The impact of drifting substorm-injected electrons on pulsating aurora initiation and intensification
 John C. Momberg1*
  Allison N. Jaynes1
  Sanjay N. F. Chepuri1
  Alexis Leali1,2
  Juliana A. Karl1
  Riley N. Troyer1,3
- 1Department of Physics and Astronomy, University of Iowa, Iowa City, IA, United States
- 2School of Physics and Astronomy, University of Minnesota, Twin Cities, MN, United States
- 3Space Dynamics Laboratory, Albuquerque, NM, United States
Pulsating aurora, which consists of diffuse patches blinking on and off, is caused by pitch angle scattering of radiation belt electrons into the loss cone by lower-band chorus waves. Understanding the drivers of pulsating aurora is important as it is a long-lasting and widespread phenomenon, accounting for significant energy transfer from the solar wind into the ionosphere. Substorm injections, which transport electrons from the magnetotail into the inner magnetosphere, are one source of electrons in this region. Injections have been observed simultaneously with pulsating aurora during conjunctions between ground cameras and satellites. In addition, previous work has also shown that substorms can enhance chorus activity (the fundamental process that produces pulsating aurora), providing a mechanism linking substorms to pulsating aurora. To further study this connection, we used the Van Allen Probes and all-sky cameras to look at events where pulsating aurora and substorm injections were observed at different locations in Magnetic Local Time (MLT), rather than focusing only on conjunctions. To make this comparison, we calculated the drift rate of electrons originating from observed injections and projected their motion forward in time until their Magnetic Local Time was the same as the ground camera. When the electrons are located at the same MLT as the ground camera, the pulsating aurora they cause would most likely occur in the field of view of the camera. We compared the time drifting substorm-injected particles arrived at the MLT of the camera to when pulsating aurora was observed. We found several instances where the initiation or intensification of pulsating aurora was accompanied by the arrival of substorm-injected electrons. This observation gives further evidence that pulsating aurora can be enhanced by or occur after substorm injections.
1 Introduction
Pulsating aurora is a type of aurora that appears as diffuse patches that blink on and off. The pulsations typically have a period of about 2–20 s and the patches have a horizontal size in the tens to hundreds of km (Royrvik and Davis, 1977; Johnstone, 1978). The most probable duration for pulsating aurora is 1.5 h (Jones et al., 2011). Pulsating aurora is caused by 10–100 keV electrons (Bryant et al., 1975; Brown et al., 1976; Smith et al., 1980; McEwen and Duncan, 1981; Yau et al., 1981; Sandahl, 1984) which are pitch-angle scattered into the loss cone by Doppler-shifted cyclotron resonance Dungey (1963); Kennel and Petschek (1966) with lower band chorus waves (Nishimura et al., 2010; 2011; Jaynes et al., 2013; Kasahara et al., 2018; Hosokawa et al., 2020).
Pulsating aurora is more common east of magnetic midnight and typically occurs in the midnight and morning sectors (Heppner, 1954; 1958; Victor, 1965; Cresswell and Davis, 1966; Omholt and Berger, 1967; Akasofu, 1968; Kvifte and Pettersen, 1969; Duthie and Scourfield, 1977; Royrvik and Davis, 1977; Oguti et al., 1981; Jones et al., 2011). Jones et al. (2011) found that the occurrence rate of pulsating aurora increases dramatically near magnetic midnight to around 50%, continues to increase to around 60% by 0300 MLT (Magnetic Local Time), and remains high until the camera is turned off. Kvifte and Pettersen (1969) found that the maximum probability of occurrence is near 0600 MLT. Oguti et al. (1981) found that, at magnetic midnight, there is a 30% probability that pulsating aurora can be seen somewhere along the auroral oval, and this probability increases to 100% near 0400 MLT.
An auroral substorm is a brief disturbance in the Earth’s magnetosphere that causes a sudden brightening and increased movement of auroral arcs. Substorms consist of three main phases: the growth phase, prior to substorm onset; the expansion phase, where auroral arcs brighten and start moving dramatically; and the recovery phase, in which the arcs break up and diffuse patches appear and start pulsating (Akasofu, 1968; Duthie and Scourfield, 1977).
Substorms can have measurable impacts on ionosphere processes, such as ionospheric currents and winds (Ebihara et al., 2014; Wang et al., 2017; Wang and Lühr, 2021; Zhang et al., 2022). Substorm activity is often accompanied by energetic particle injections. These are events that transport particles from the magnetotail into the inner magnetosphere and are characterized by the sudden increase of electron flux in the energy range of tens to hundreds of keV (Birn et al., 1997; Birn et al., 1998; Turner et al., 2015; Motoba et al., 2021). Injected particles then become trapped on closed drift orbits and start drifting around the earth (Gabrielse et al., 2014). These injected particles can drive wave activity (Tsurutani and Smith, 1974; Chepuri et al., 2023).
When injections are observed, they are classified as either dispersed or dispersionless (Sarris et al., 1976; Sarafopoulos and Sarris, 1988; Birn et al., 1997; Gabrielse et al., 2014; Turner et al., 2015). A dispersionless injection occurs when the satellite is located inside the injection boundary, which bounds the region where the electron flux increases in all energy channels simultaneously (Mauk and McIlwain, 1974; McIlwain, 1974). The injection region of dispersionless injections typically spans around 1–3 h of MLT (Li et al., 1998; Gabrielse et al., 2012). A dispersed injection occurs when the satellite is located at a different location in azimuth from the injection site. In a dispersed injection, there is a delay between observations in different energy channels, with the highest energy being observed first, as the drift rate of injected particles depends on their energy (Birn et al., 1997; Zaharia et al., 2000). Since electrons drift east, the electrons observed in a dispersed injection originate from the eastern boundary of the injection region.
Pulsating aurora is typically observed in the recovery phase of the substorm. However, Jones et al. (2011) looked at 74 pulsating aurora events and found many examples of long-duration events, while Jones et al. (2013) presented one event that lasted for 15 h. This suggests that pulsating aurora is an ongoing phenomena that is temporarily disrupted by substorms rather than strictly a recovery phase phenomenon. In addition, several studies have found evidence that substorms or substorm injections can enhance already ongoing pulsating aurora. For example, Jaynes et al. (2015) observed a single substorm injection that enhanced a region of pulsating aurora. Another study that observed this effect is Suszcynsky et al. (1996), who compared satellite measurements of electrons with ground camera observations of pulsating aurora at the satellite’s footpoint, analyzing data from 70 nights between October 1994 and April 1995. They selected 17 pulsating aurora events to analyze, which included several events where the pulsations were re-energized during the growth and expansion phase of subsequent substorms. Troyer et al. (2022) found that pulsating aurora that occurs soon after substorm onset has larger total energy flux and harder energy content. Finally, Troyer et al. (2024) found that substorms can drive chorus wave activity, providing a mechanism linking substorms to pulsating aurora. Together, these results show that pulsating aurora can be either initiated by or enhanced by substorms.
Previous studies have also suggested that pulsating aurora may be the signature of substorm-injected electrons drifting east (Oguti and Watanabe, 1976; Akasofu, 1977; Nakamura et al., 1990; Nemzek et al., 1995; Suszcynsky et al., 1996). Similar to Suszcynsky et al. (1996), Nemzek et al. (1995) also compared satellite measurements of electrons with ground camera observations of pulsating aurora at the satellite’s footpoint. They analyzed data from 5 consecutive nights in February 1990 and found 15 events where substorm injections coincided with the start of pulsating aurora. This was true for “almost all cases”, and the authors concluded that “the electrons which precipitate in the form of the pulsating aurora is linked to those that make up a substorm injection” and “the principal factor controlling the onset of pulsations over a particular area may be the arrival of substorm-injected electrons at the conjugate equator” (Nemzek et al., 1995).
However, Jones et al. (2011) provides evidence that contradicts the claim that pulsating aurora is necessarily correlated with substorm-injected electrons. They used the Gillam ground-based camera to analyze 74 pulsating aurora events from September 2007 to March 2008 and found that the onset of pulsating aurora evolves away from a region located 1.6 h east of midnight (i.e., pulsating aurora that occurs west of that location migrate westward). Similarly, Oguti et al. (1981) found that the drift of pulsating auroras is westward in the evening while it is eastward in the morning hours. These results suggest that pulsating aurora is not necessarily the signature of drifting injected electrons, otherwise, they would always drift east rather than drifting west, as they do west of midnight.
The goal of this study is to further investigate whether the electrons precipitating during pulsating aurora correspond to the drift of substorm-injected electrons. We present a direct connection between the timing of drifting electrons and the initiation or intensification of pulsating aurora events over a multi-event study using ground- and space-based observations.
2 Methodology
2.1 Identification of pulsating aurora
We located pulsating aurora by accessing the THEMIS (Time History of Events and Macroscale Interactions during Substorms) ground-based all-sky imager located in Athabasca. The imager has a size of 256 by 256 pixels, a frame rate of 1 image every 3 s, and is located at a magnetic latitude/longitude of 61.98° north, 307.76° east (Donovan et al., 2006; Mende et al., 2009).
To record what was seen in the camera at any given time, we divided each video into segments and classified each segment based on what was observed in the camera during that timeframe. We then assigned a color to represent each classification type in our plots. This allowed us to visualize both the time and location where various types of events, such as pulsating aurora, clear sky, or clouds were observed. The 6 classifications used were: clear sky, non-pulsating non-substorm, non-pulsating substorm, dim pulsating aurora, bright pulsating aurora, and camera obscured. Table 1 gives a description of each category.
Table 1. Categories used to classify times in THEMIS videos.
We chose to categorize the intensity of pulsations into three levels (not pulsating, dimly pulsating, or brightly pulsating) rather than attempt to quantify it. The advantage is that this allows us to differentiate between two separate levels of the “on” state rather than just a simple on/off, while avoiding the complexities in quantifying the intensity of pulsations. This was done so we could both measure the full duration of pulsating aurora events and also visualize locations where sudden intensifications occurred by observing the transition from dim to bright pulsating aurora.
As the categorizations were assigned by visually inspecting the THEMIS videos rather than using an algorithm to calculate or quantize the intensity of pulsations, the distinction between bright and dim pulsating aurora was somewhat arbitrary: the boundary between “bright” and “dim” on one date might not necessarily be the same level of brightness as the boundary between “bright” and “dim” on another date. Although we did not make this distinction quantitatively precise, there is still an important and identifiable qualitative distinction between times sorted into the two categories. Overall, times sorted into the “bright” category contained pulsations that were several times brighter and more intense than those in the “dim” category.
We also recorded the times when aurora without any pulsations occurred. For times when multiple types of events occurred at the same time, such as both non-pulsating and pulsating aurora, the pulsating aurora categories took precedence. If any pulsations were seen at all, that time was classified as either dim or bright pulsating aurora, depending on the intensity of the pulsations. In addition, we separated non-pulsating aurora into “non-substorm” and “substorm” categories. The benefit of using this classification method is that it allows us to measure the full duration of pulsations, while also recording information about the other kinds of aurora that occurred when no pulsations were present. Separating the non-pulsating category into substorm and non-substorm aurora allowed us to visualize the transition from substorm aurora into pulsating aurora in several cases, giving further evidence that pulsating aurora can occur in the recovery phase of the substorm. However, since pulsating and substorm aurora can both occur simultaneously, this method does not capture the full duration of substorm aurora. Therefore, we were unable to fully compare the independent and sometimes overlapping occurrence of substorm aurora to pulsating aurora.
Once all the videos were segmented and categorized, we used these classifications to locate a number of separate pulsating aurora events. Any continuous run which included only dim or bright pulsating aurora segments was considered one single pulsating aurora event. In addition, we combined two consecutive events if they were separated by an interruption of less than 45 min. Most of these cases involved pulsations that experienced brief interruptions due to passing cloud cover, and once the clouds dispersed, the pulsations were again visible. This suggests that the pulsations likely persisted through the interruption, so we decided to group such cases as single continuous events. However, in one case, we clearly observed the pulsating aurora die down, followed by a distinct second event occurring less than 45 min later. In this particular case, despite the interruption lasting less than 45 min, we classified them as two separate events. Using this method, we identified a total of 34 pulsating aurora events that took place across 23 distinct dates between 2013-05-01 and 2015-05-12.
2.2 Identification of particle injections
To identify substorm injections, we accessed the ECT-MagEIS instrument on both Van Allen Probes (also known as Radiation Belt Storm Probe A and B, or RBSPA and RBSPB (Mauk et al., 2014)). ECT is the Energetic Particle, Composition, and Thermal Plasma Suite and consists of three separate instruments. MagEIS, or the Magnetic Electron Ion Spectrometer, is one instrument making up the ECT instrument suite (Spence et al., 2013; Blake et al., 2014; Claudepierre et al., 2021). This instrument measures the electron flux vs. time in several different energy channels and also gives the calculated McIlwain L parameter of the satellite. We selected energy channels between 30 and 500 keV to look for injections. Next, we cropped out data when the L value of the satellite was less than 3 because this is typically where the satellite leaves the radiation belt and it would no longer be able to observe particle injections. This leaves us data with an L value from 3 to approximately 6.5.
We identified particle injections by visually examining the MagEIS electron flux data. We used the following guidelines to identify an injection:
1. An injection is characterized by a sharp increase in the electron flux.
2. Injections are initially observed in the highest energy channel, and, in most cases, there is a slight delay between each lower energy channel, depending on the distance from the injection site to the satellite.
3. To be classified as an injection, it must be observed in at least three adjacent energy channels.
4. The identification of an injection does not include cases where the increase is preceded by a sharp decrease, as this may indicate a temporary dropout followed by the data returning to its previous value, rather than an injection.
Finally, we categorized injections as either dispersed or dispersionless. For each injection, we found the separation between observations in the three lowest energy channels it was observed in. If this separation was less than 2 min, we categorized the injection as dispersionless. This follows a similar procedure used by Gabrielse et al. (2014) to differentiate between dispersed and dispersionless injections.
Figure 1 (top) gives an example of two injections identified in the MagEIS data. Each color corresponds to an energy channel in the MagEIS instrument and the dots represent where the peak was identified in each energy channel. The dashed gray line gives the L-shell of the satellite according to the axis on the right side of the plot.
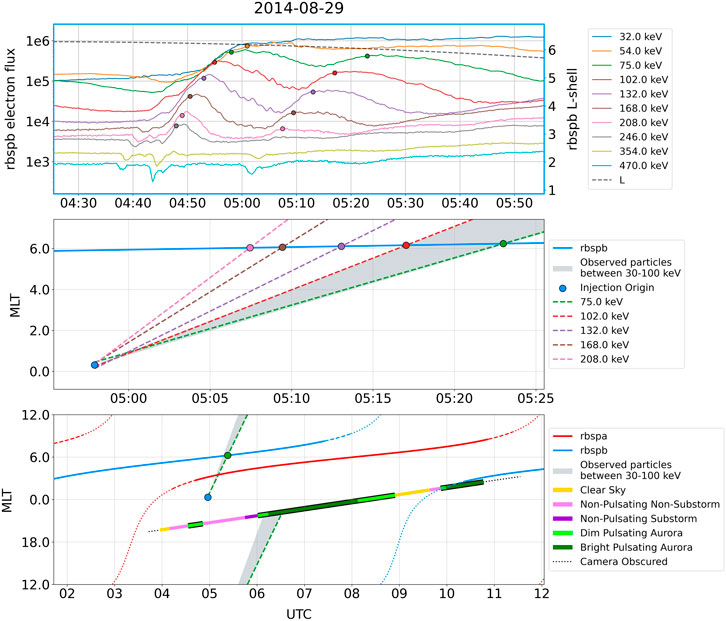
Figure 1. TOP: MagEIS data from RBSPB during a time when two injections were identified. MIDDLE: The second injection from the above plot is represented in MLT vs. time, with dashed lines representing the tracked angular drift motion in each energy channel. BOTTOM: MLT vs. time plot which includes the same injection as well as the complete paths of the satellites and Athabasca through MLT.
2.3 Calculating the drift speed of injected particles
The trajectories of charged particles in the magnetosphere can be characterized by three different periodic motions: gyration, bounce, and drift (Öztürk, 2012; Ng et al., 2013). Electrons with an energy between 30–100 keV and at a distance of about 3-7 earth radii (such as the ones measured in this paper) have a bounce period of around 0.1 to a few seconds (Ilie, 2020).
If we approximate the Earth as a dipole, then the rate at which electrons drift eastward is given by the following equation (Lew, 1961):
where
We applied this formula to all injections identified and found the drift rate in each energy channel. Since the drift rate depends on the energy, the difference between the times that particles in different energy channels reached the detector can be used to calculate the injection boundary. To do this, we made a graph of MLT vs. time to visualize each injection. For each energy channel, we plotted a line with a slope of
This procedure for one injection is shown in Figure 1 (middle). The blue line gives the path that RBSPB took through MLT. The colored dots represent where and when the injection was observed in different energy channels, while the dashed colored lines represent the particles’ tracked angular drifts. The point where these lines intersect gives the electron boundary of the injection. In addition, we added a gray cone that spans between the energy channels that observed the injection and also within the range of 30 and 100 keV. This was done to represent particles with energy in between the energy channels of the MagEIS instrument but still in the expected energy range to cause pulsating aurora.
2.4 Visualizing the data in MLT
To visualize the relative timing and position of the satellites, injected particles, and aurora, we expanded this MLT vs. time plot to include both probes and the ground-based all-sky camera, as well as all injections identified. A simplified version of this procedure that includes both satellites and Athabasca but only one injection is shown in Figure 1 (bottom). The path Athabasca takes through MLT is segmented and color-coded to indicate the types of events witnessed by the camera at different points in time. The black bars above and below the path of Athabasca show which segments were combined and considered as one pulsating aurora event. In this example, three separate pulsating aurora events were recorded. The satellite paths use a solid line when (L > 4), a dashed line when (3 < L < 4), and a dotted line when (L < 3).
The injection from Figure 1 (middle) is included in this plot as well. The green dot along the path of RBSPB represents where the injection was observed by RBSPB in that energy channel. The gray cone represents the angular drift of particles within the specified range that were observed by the satellite. This allowed us to visualize where and when these drifting particles caught up to the MLT of Athabasca, by noticing where the gray cone intersects the path of Athabasca, and compare that to when pulsating aurora occurred.
We used this graph to determine whether any of the injections were drift echoes of previous injections. A drift echo is when you observe the same injection a second time after the particles drift all the way around the Earth and reach the satellite again. If an injection is a drift echo, its observed location should lie close to one of the lines plotted to represent the traced-forward drift motion of particles from previous injections. Additionally, the dispersion of a drift echo would be significantly greater than a normal injection due to the particles drifting a longer distance. This increased dispersion would cause the calculated eastern boundary of the injection to appear much earlier. Among the injections we observed, a few were positioned close to the forward-traced path of particles from a prior injection. However, none of these injections exhibited nearly enough dispersion, and their traced-back eastern boundaries did not occur early enough for them to be drift echoes. Therefore, we concluded that none of the injections we identified were drift echoes.
2.5 Comparing pulsating aurora to arrival times of particles
We categorized the 34 pulsating aurora events into the following three categories:
• Yes injection: The initiation or intensification of pulsations was accompanied by the arrival of particles from an observed injection.
• Potentially missed injection: No injections corresponding to the initiation or intensification of pulsating aurora were observed. Both satellites have a justifiable reason to miss the injection.
• No injection: No injections corresponding to the initiation or intensification of pulsating aurora were observed. At least one satellite was likely in the correct position to observe it.
An intensification was defined as any location where the strength of pulsations transitioned from dim to bright pulsating aurora. Some pulsating aurora events included multiple intensifications. These events were classified in the “yes injection” category as long as at least one of the intensifications, or the start of the event, coincided with the arrival of the injection. This means that some events classified under the “yes injection” category may also include additional intensifications that did not coincide with the arrival of injection, as long as at least one did.
In addition, the definition for the arrival of particles being “concurrent” or “coinciding” with an event (such as an intensification) is that the event must have occurred somewhere within or just outside a region where gray cones (representing the spread of particles) overlap the path of Athabasca. (All but one instance occurred strictly within the overlapping region. In that specific case, the particles drifted far around the earth before arriving just after the time when pulsating aurora was observed to start. Due to the inaccuracies in measuring the drift rate and the arbitrary nature of identifying the exact start of pulsations, we decided to include this event even though it was not strictly within the overlapping region.) This means that for some cases, the entire pulsating aurora may lie within the overlapping region originating from multiple injections, but as long as at least one of the intensifications or the beginning occurred during the overlapping regions, it was put in the “yes injection” category.
For events in the latter two categories, where neither the initiation nor any of the intensifications were accompanied by the arrival of particles, we considered if there were reasons why we might expect one or both of the satellites to miss an injection that may have occurred. The difference between the latter two categories is that the “potentially missed injection” category consists of events where both satellites had potential reasons for not detecting a corresponding injection, while the “no injection” category consists of events where at least one satellite did not have an excuse, meaning it would have seen the injection if there was one. The following list gives the reasons considered for why an injection might have been missed by a particular satellite.
• Particle data too noisy: the MagEIS data included large fluctuations that would have covered up the signal from any injections.
• Satellite west of midnight: the satellite’s MLT was between 12 and 24. Injections originate near the magnetotail and electrons drift east. It is easier for the satellite to detect dispersed injections that have not traveled as far because the signature in the data becomes more diffuse the farther they travel. Therefore, it is easier for the satellite to detect injections when it is east of midnight (0–12) than west of midnight (12–24). While most injections were observed east of midnight, several were observed west of midnight, which shows that observing an injection west of midnight is still possible, albeit less probable. Figure 7 (middle) gives the MLT distribution of observations of injections.
• Satellite not in radiation belt (L < 4): We have chosen L > 4 as the range where it is possible for injections to be observed and will treat the satellite’s presence in the L < 4 region as a justification for why it was unable to observe an injection that may have occurred. While it is possible for injections to be observed in this region, as the inner boundary of the radiation belt fluctuates, observing injections in this region is much less likely. Of the 50 injections identified in our study, none were observed when the satellite was located in L < 4, and only 5 were observed when L < 5. This data supports our choice of setting L < 4 as a region where injections would not be observed.
• Missing data: there was no data from the MagEIS instrument.
3 Case studies
In order to further explain the analysis process used, as well as to highlight some of the noteworthy specific cases, we provide detailed descriptions of three dates selected out of the 21 total analyzed.
3.1 2014-08-29
On 2014-08-29, which is displayed in Figure 2, we identified three pulsating aurora. The top plot gives the complete MLT vs. time graph with all observed injections. The colors of the dashed lines representing the tracked angular drift of the particles have been changed to match the color of the satellite it was detected by rather than the energy channel. In addition, numbered labels were added to help distinguish the many injections observed. The traced electron boundary and the location where the injection first arrived at Athabasca are labeled with corresponding numbers for each injection. Solid black lines were also added to the boundary of the gray cones.
Figure 2. TOP: MLT vs. time plot that includes all relevant data recorded on 2014-08-29. The path of Athabasca is color-coded based on the camera event classifications, the paths of both satellites are represented by red and blue lines, injections are represented with colored dots, and the trace-forward drift motion of particles originating from detected injections with an energy between 30 and 100 keV is represented by a gray cone. MIDDLE: MagEIS data from RBSPA during the same time frame as top. The dots show where injections were identified and correspond to the injections observed by satellite A plotted in the top plot. BOTTOM: Same for RBSPB.
The middle plot gives the MagEIS electron flux in each energy channel for RBSPA. The electron flux in all energy channels is plotted with a semi-transparent line during times when L < 4 in order to represent the region where we do not typically expect to see injections, while times when L < 3 have been completely ignored. The dashed black line gives the L-shell of the satellite. The red border of this graph represents that this data comes from the satellite with the red line in the top graph. The bottom plot gives the same information for RBSPB, using a blue border rather than a red one.
The first began at 4:32:57 and lasted until 4:51:30. This event was comparably dim and short-lived. If an injection led to particles arriving at the beginning of this event, it would have most likely passed satellite A when it was in the L < 4 region. However, satellite B appears to be in the correct position to observe any injections and did not see one. Therefore, we classified this event as “no injection”.
The second event began at 6:01:09 and lasted until 8:54:27. This event was preceded by substorm aurora and then evolved into pulsating aurora. In addition, the pulsations in this event were much brighter than the previous one. Several injections arrived throughout the entire duration of this event. Since this includes the beginning of the event, we classified it as “yes injection”.
The third event began at 9:52:09 and lasted until the camera became obscured at 10:46:21, meaning the real duration of this event may be much longer than what was observed. The beginning of this event coincided with the arrival of particles, so it was also placed in the “yes injection” category.
3.2 2015-03-17
The data collected for 2015-03-17 is displayed in Figure 3. This date includes one pulsating aurora event which began at 9:11:30 after a period of non-pulsating non-substorm aurora. The event ended at 12:33:21 when the camera became obscured, which implies that the real duration of the event may be longer than what was observed.
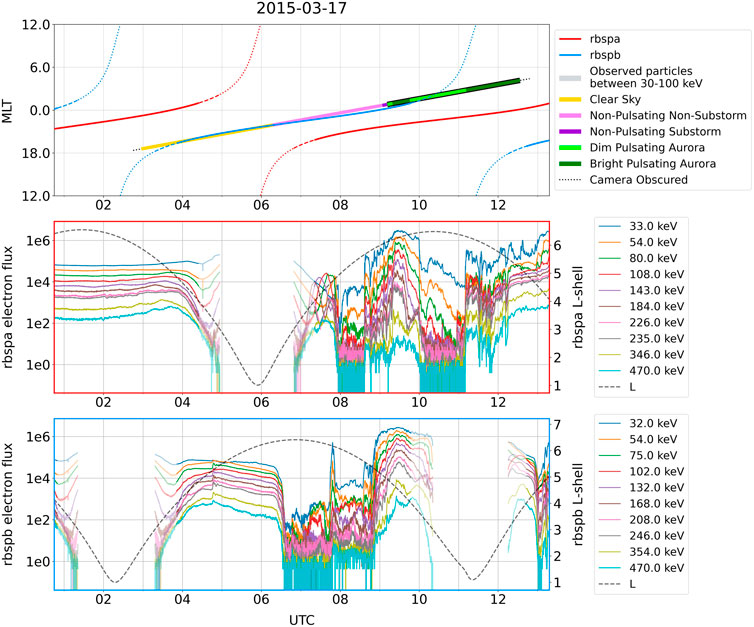
Figure 3. Same analysis as Figure 2 applied to the data recorded on 2015-03-17.
While no injections were identified in the MagEIS data, this is probably due to the fact that both satellites detected large fluctuations which may have covered up the signal from any injections. This event serves as an example to highlight what MagEIS data looks like in the “too noisy” category. Therefore, we placed this event in the “potentially missed injection” category.
3.3 2014-12-12
On 2014-12-12, which is displayed in Figure 4, we identified two pulsating aurora events.
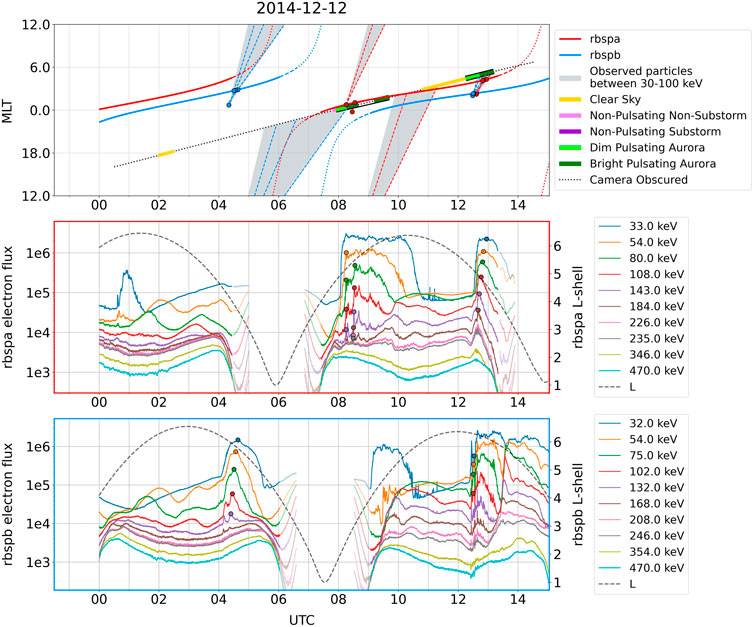
The first event began at 7:54:42 and ended at 9:41:30. This event spans across a short period where the camera was obscured by clouds before the pulsations were revealed again. This is visualized in the plot by the fact that the black bars above and below the path of Athabasca are continuous through this segment, indicating that the two regions of pulsating aurora were combined into one continuous event that spanned across the interruption. The intensification of pulsations was accompanied by 2 injections which occurred at about the same MLT and time as the intensification, as well as the arrival of particles from an earlier injection. This event was placed in the “yes injection” category.
The second event began at 12:15:09 and lasted until 13:11:36, when it was obscured by clouds. The intensification of pulsations was accompanied by the arrival of particles from an injection that was observed by both satellites at about the same time, placing this event in the “yes injection” category.
4 Results
4.1 Comparing pulsating aurora and particle injections
Figure 5 gives the total number of pulsating aurora events that fall into each of the main categories. In addition, the two categories that did not see an injection are further broken down into subcategories based on the reasons considered for why a corresponding injection could have been missed (described in Section 2.5). Figure 6 lists all of the identified pulsating aurora events in each subcategory.
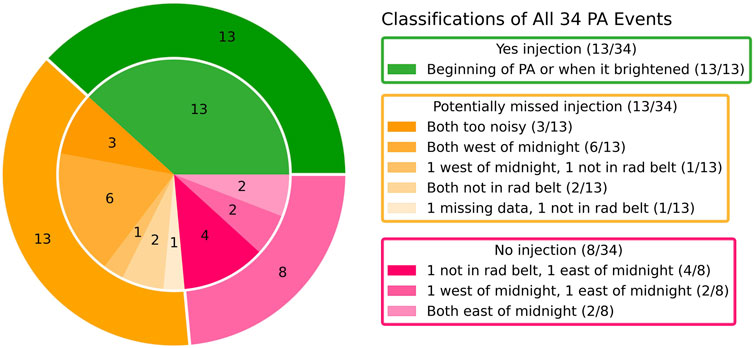
Figure 5. Total number of aurora events in each category and each subcategory. The orange and pink categories are broken down into subcategories representing the reasons considered for why a corresponding injection may have been missed. Each section of the pie chart is annotated with the number of events falling within its respective category or subcategory.
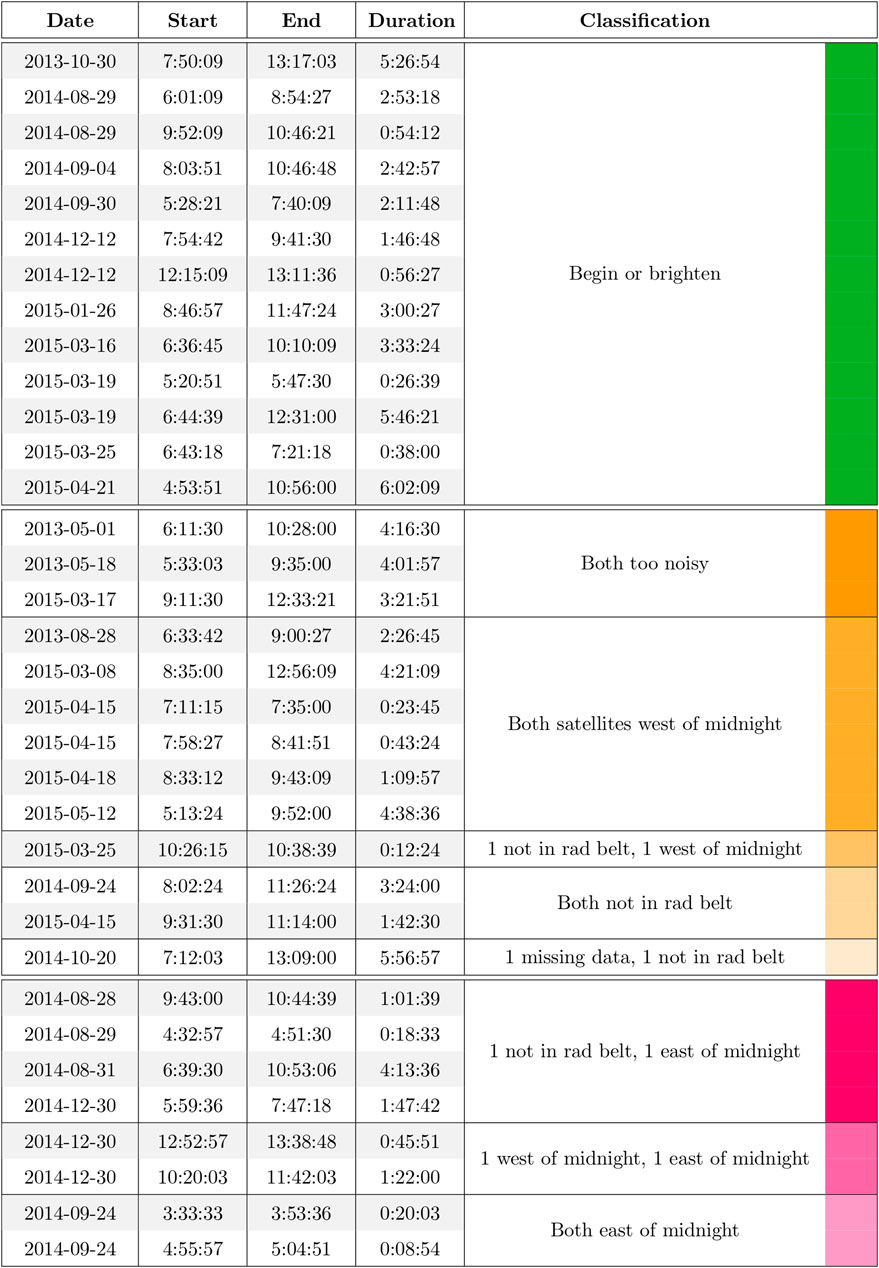
Figure 6. All pulsating aurora events identified by this study.
Out of the 34 pulsating aurora events, we found 15 that included injected particles arriving during the duration of the event. Of those 15, 13 cases included the arrival of injected particles at the initiation or intensification of pulsations. Out of the 21 that did not see the arrival of particles at the initiation or intensification of pulsations, we identified 13 cases where both satellites had justifiable reasons for potentially missing injections. For these 13, it is possible that they were also accompanied by an injection but it was missed by our satellites. Finally, we saw 8 events that did not see an injection, despite at least one satellite being in the correct position to observe it. This breakdown is represented as a pie chart in Figure 5.
4.2 Observed pulsating aurora durations
The 34 pulsating aurora events had an average duration of 2.44 ± 0.32 h. This is consistent with Jones et al. (2011), who found that the most probable duration for pulsating aurora is 1.5 h. Figure 7 (left) gives the distribution of observed durations as a histogram.
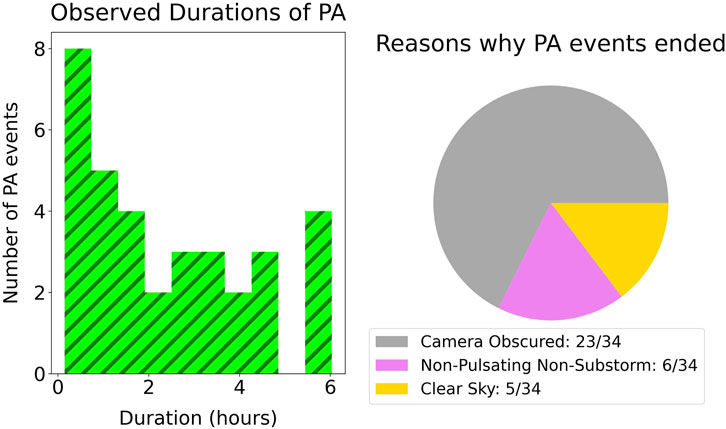
Figure 7. LEFT: Histogram of pulsating aurora durations. The colors of this histogram (light green and dark green stripes) were chosen to represent the two classifications from Table 1 that were included in the total event duration, Dim Pulsating Aurora and Bright Pulsating Aurora. RIGHT: Pie chart representing the types of events that prompted the end of the pulsating aurora event.
Figure 7 (right) gives a pie chart showing what types of events occurred after pulsating aurora, which indicates what caused the pulsating events to end. Out of the 34 events, 23 ended prematurely due to cloud cover or the camera turning off. Since such a large fraction of the events ended by being interrupted rather than ending naturally, it is likely that many of the events lasted longer than their observed durations suggest. Therefore, our observed average duration serves as a lower bound on the actual average duration of pulsating aurora, and it is probable that pulsating aurora can extend into the dayside in many cases. This result is also in agreement with Jones et al. (2011), who found many events cut off by weather or camera turn off, and also concluded that these events may extend into the dayside.
Furthermore, we observed several cases where pulsating aurora occurred after substorm aurora or the intensification of pulsations was preceded by substorm aurora. This observation gives further evidence that pulsating aurora can occur in the recovery phase of the substorm and can be enhanced by or occur after substorm injections.
4.3 MLT distribution of injections and pulsating aurora
Figure 8 (middle) gives the MLT distribution of where injections were observed. 12 dispersionless injections were observed with an average observed MLT of 0.58 ± 0.87. Using the standard deviation, we found that most dispersed injections were observed between 21.7 and 3.46 MLT. Since dispersionless injections represent cases where the satellite is inside of the injection, this gives evidence that injections typically occur in the midnight sector and possibly with a preference for slightly east of midnight. These results are consistent with Birn et al. (1997), who plotted the distribution of 134 dispersionless injections and found that it peaked around midnight. In addition, Gabrielse et al. (2014) observed 1,624 dispersionless injections and found that injections inside of R < 12RE ranged in MLT from 18 to 4 with a peak probability at 23.45 MLT.
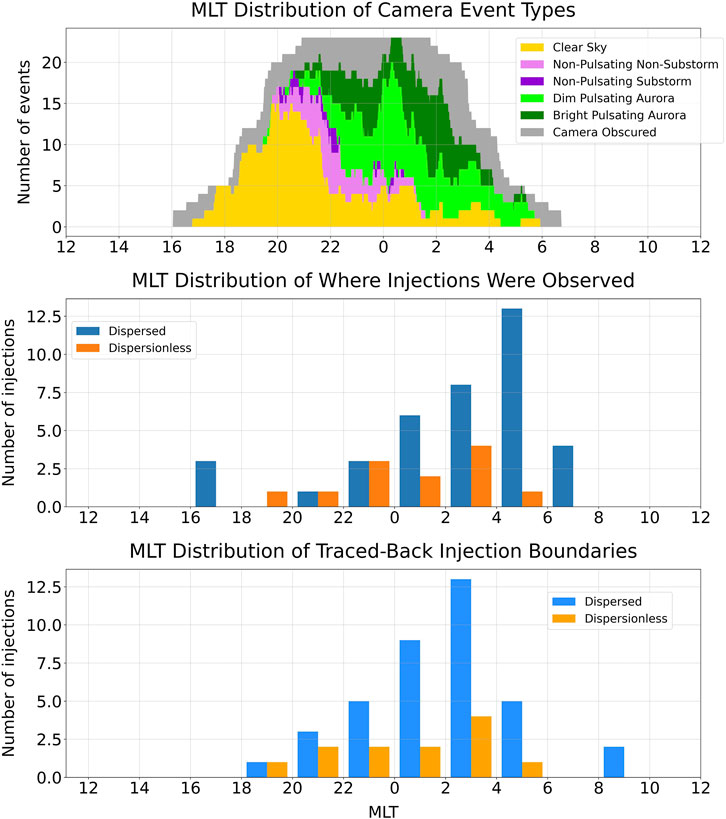
Figure 8. TOP: Stacked histogram representing the distribution of camera classifications vs. MLT. The thickness of each color band represents the number of nights where the corresponding classification was seen when Athabasca was located at a given MLT. MIDDLE: MLT distribution of where the satellites were located when injections were observed. BOTTOM: MLT distribution of the traced-back injection electron boundaries.
The observation of dispersed injections, represented by blue bars, was more skewed towards the east than dispersionless ones were. This makes sense since dispersed injections consist of the eastward drift of injected particles after they originate near midnight. We observed 38 dispersed injections with an average MLT of 2.52 ± 0.59 and mostly ranging from 22.91 to 6.13. The skew towards observations occurring east of midnight due to the eastward drift of injected particles supports the fact that injections are more likely to be missed when the satellite is west of midnight. These results are consistent with Gabrielse et al. (2014), who observed 1,201 dispersed injections and also found that they were more skewed towards dawn than dispersionless injections, with the peak probability occurring at 0.75 MLT.
Next, we analyzed the MLT distribution of traced-back injection boundaries. Figure 8 (bottom) shows the MLT distribution of traced-back injection electron boundaries (combining data from both satellites). The blue bars represent dispersed injections and the orange represents dispersionless injections. The eastern boundary of dispersionless injections ranged in MLT from 23.16 to 4.5, with an average of 0.29 ± 0.79. By comparing the orange bars in both graphs, we can see that the distribution of traced-back boundaries is very similar to the observed locations for dispersionless injections. This makes sense since dispersionless injections occur when the observation is taken inside of the injection. However, the two graphs are not perfectly identical since we still applied the tracing back calculation to the dispersionless injections. Applying this calculation would have caused some injections to be traced back a small amount, as we allowed dispersionless injections to have a small amount of dispersion, up to a threshold, rather than requiring exactly zero dispersion.
The MLT distribution of the eastern boundaries of dispersed injections is given by the blue bars in 7 (bottom). They had an average MLT of 1.83 ± 0.44 and mostly ranged from 21.66 to 2.92. This is significantly west of where they were observed, which makes sense since the dispersion is caused by the eastward drift of injected particles.
Finally, we analyzed the MLT distribution of pulsating aurora. Figure 8 (top) is a stacked histogram representing the distribution of camera classifications (described in Table 1) in MLT. The thickness of each color band represents the number of dates where the corresponding classification was seen when Athabasca was located at a given MLT. This allows us to visualize how many observations of each camera classification occurred at each MLT. However, it should be noted that this stacked histogram does not represent the overall occurrence rate of pulsating aurora. This is because the dates included in this study were deliberately selected for analysis only if pulsating aurora was observed. The purpose of this plot is to compare the relative change in occurrence rate at different values of MLT.
The stacked histogram shows that pulsating aurora was mostly observed between about 22 and 6 MLT. In addition, the fraction of observations that saw pulsating aurora is clearly much higher east of midnight than west of midnight. The observation that pulsating aurora is more common east of midnight is consistent with the results of several other studies (Heppner, 1954; 1958; Victor, 1965; Cresswell and Davis, 1966; Omholt and Berger, 1967; Akasofu, 1968; Kvifte and Pettersen, 1969; Duthie and Scourfield, 1977; Royrvik and Davis, 1977; Oguti et al., 1981; Jones et al., 2011).
4.4 Summary of results
1. Comparing pulsating aurora and particle injections:
• 13/34 events observed the initiation or intensification of pulsations being accompanied by the arrival of injected particles
• 13/34 events did not see a corresponding injection, and both satellites had justifiable reasons for potentially missing it
• 8/34 events did not see an injection, despite at least one satellite being in the correct position to observe it
2. 34 pulsating aurora events identified
• Average duration: 2.44 ± 0.32 h
• Pulsating aurora was mostly observed between 22 and 6 MLT and is more common east of midnight
3. 38 dispersed injections identified
• Observations of dispersed injections mostly ranged from 22.91 to 6.13 MLT, with an average MLT of 2.52 ± 0.59
• The traced-back eastern boundaries of dispersed injections mostly ranged from 23.16 to 4.5 MLT, with an average MLT of 1.83 ± 0.44
4. 12 dispersionless injections identified
• Observations of dispersionless injections mostly ranged from 21.7 to 3.46 MLT, with an average MLT of 0.58 ± 0.87
• The traced-back eastern boundaries of dispersionless injections mostly ranged from 21.66 to 2.92, with an average MLT of 0.29 ± 0.79
5 Discussion and conclusion
We present the first-ever comparison of pulsating aurora to the drift motion of substorm-injected electrons. Previous studies, such as Suszcynsky et al. (1996) and Nemzek et al. (1995), have used conjunctions to analyze pulsating aurora observed at the footpoint of a satellite that simultaneously detects a particle injection. However, the limited number of conjunctions makes this analysis difficult. Our study introduces a novel approach by tracing injected particles forward in their drift motion from where they were observed until they reach the MLT of the ground camera. One advantage to this method is it allows us to analyze a significantly larger number of events, as we are not limited to instances when the satellite’s footpoint falls within the camera’s field of view. However, since we are not observing the particle injections and pulsating aurora simultaneously and during conjunction, this can introduce some errors.
One source of error with our approach is that we only compared the MLT of the drifting particles to the MLT of the ground camera, but we do not necessarily know that the field line they are on has its footpoint within the field of view of the camera. Therefore, we do not know how far the injection extends in space, both radially and azimuthally, when we only observe it at one point. Nevertheless, even if the observed injection location does not directly correspond to the ground camera’s field of view, it is plausible that the injection extends far enough in L, corresponding to north/south extension on Earth’s surface, to encompass the region where pulsating aurora was observed. To establish a more conclusive connection, further analysis is required to measure the spatial extent of the injections and verify that they align with the camera’s field of view when they arrive. Although we observed many events that were consistent with the conclusion that the initiation or intensification of pulsations can be accompanied by the arrival of injected particles, it is important to be aware of this limitation.
Another source of error is the drift rate calculation. The equation we used assumes the particles are drifting in a perfect dipole field, but in reality, the Earth’s magnetic field is not a perfect dipole. In addition, we assumed that F/G = 1, but this value can vary from 1 to 2/3 depending on the mirror latitude. If we assume the injected particles occur with a range of values for λm, this would increase the spread of the cone representing the paths of particles.
To investigate the impact of different F/G values, we repeated the analysis using F/G = 2/3. While most events remained in the same category, we observed four events that did not exhibit a corresponding injection with F/G = 1, but did show one when we used F/G = 2/3. Furthermore, one event that showed an injection with F/G = 1 was reclassified into the “no injection” category when we used F/G = 2/3. Although a few events changed categories, overall, we still observed several instances of the initiation or intensification of pulsating auroras being accompanied by the arrival of injected particles. Therefore, we concluded that using different values or a range of values for F/G does not significantly alter the results of this study.
Our results suggest that the arrival of drifting substorm-injected electrons plays an important role in the initiation or intensification of pulsating aurora in many cases. However, it is essential to clarify the scope of our findings. When we consider the criteria required to sort an event into the “yes injection” category, one may notice that it is somewhat broad: It encompasses all pulsating aurora events where the desired effect (the initiation or intensification being accompanied by the arrival of injected particles) occurred at least once, even if there were several other instances during the same pulsating aurora event where it did not occur. In addition, we made no distinction between events where the entire event, including the initiation or intensification, was in the overlap region, and events where only the initiation or intensification was in the overlap region.
Therefore, our results should be interpreted as presenting a list of events which were consistent with the conclusion that the initiation or intensification of pulsations can be triggered by the arrival of injected particles. We present these as case studies that demonstrate the plausibility and potential significance of the effect. However, our results should not be interpreted as calculating the actual occurrence rate of this effect, such as by counting the total number of intensifications and initiations and finding the fraction that were accompanied by the arrival of injected particles.
A question one might have is, exactly how much energy needs to arrive in the form of drifting particles in order to initiate or intensify pulsating aurora, and by how much does that increase the intensity of pulsating aurora? Even if we knew the amount of energy contained in the injection, this may not correlate to the increase in auroral intensity as one might expect. Pulsating aurora need two things to occur: the presence of electrons within the 30–100 keV energy range and the availability of lower-band chorus waves to scatter these electrons into the loss cone. The efficiency of this scattering process can vary significantly. For instance, a substantial substorm injection may arrive during a time when conditions are such that the efficiency of scattering electrons into the loss cone is very low. Conversely, a minor injection might lead to more significant particle precipitation if it occurs when the loss cone scattering efficiency is much higher. This variability in the efficiency and occurrence of chorus waves makes it unlikely that there would be a correlation between the amount of energy contained in the injection and the increase in intensity of pulsating aurora. Furthermore, in order to study the properties of the chorus waves scattering the particles, one could conduct observations during conjunction with the ground camera, as many studies have done before.
Additionally, one may wonder why there are so many injections that do not correspond to the initiation or intensification of pulsating aurora. It should be remembered that we started from a list of pulsating aurora events and asked if they were accompanied by the arrival of injected particles, rather than starting from a list of injections and asking if they caused pulsating aurora to occur. There are multiple reasons why an injection might be observed that did not correlate with pulsating aurora. If the injected particles arrived during a period where the local conditions were not favorable to chorus wave growth or resonant wave-particle interactions, they would not have been scattered into the loss cone and therefore would not precipitate in the atmosphere and be correlated with pulsating aurora on the ground. Another reason why observed injections might not have led to pulsating aurora is if the dipole assumption of the magnetic field is not accurate, which would lead to magnetic field mapping discrepancies when calculating the drift trajectories.
In this study, we compared ground-based observations of pulsating aurora to the drift of substorm-injected particles. To do this, we utilized a novel approach where we traced the angular drift motion of these particles forward in time to find when they arrived at the MLT of the ground camera. We found several cases where the initiation or intensification of pulsating aurora was accompanied by the arrival of injected electrons with an energy between 30 and 100 keV. This suggests that the initiation or intensification of pulsating aurora can be triggered by the arrival of injected particles. These results provide further evidence that pulsating aurora can occur in the recovery phase of the substorm and can be enhanced by or occur after substorm injections.
Data availability statement
The original contributions presented in the study are included in the article/Supplementary Material, further inquiries can be directed to the corresponding author.
Author contributions
JM: Data curation, Formal Analysis, Investigation, Methodology, Software, Visualization, Writing–original draft. AJ: Conceptualization, Funding acquisition, Investigation, Project administration, Resources, Supervision, Writing–review and editing. SC: Methodology, Validation, Writing–review and editing. AL: Data curation, Investigation, Visualization, Writing–review and editing. JK: Investigation, Writing–review and editing. RT: Data curation, Software, Writing–review and editing.
Funding
The author(s) declare financial support was received for the research, authorship, and/or publication of this article. JM and AJ were supported by NSF CAREER grant 2045016 to the University of Iowa.
Conflict of interest
The authors declare that the research was conducted in the absence of any commercial or financial relationships that could be construed as a potential conflict of interest.
Publisher’s note
All claims expressed in this article are solely those of the authors and do not necessarily represent those of their affiliated organizations, or those of the publisher, the editors and the reviewers. Any product that may be evaluated in this article, or claim that may be made by its manufacturer, is not guaranteed or endorsed by the publisher.
Supplementary material
The Supplementary Material for this article can be found online at: https://www.frontiersin.org/articles/10.3389/fspas.2024.1335562/full#supplementary-material
References
Akasofu, S.-I. (1968). Polar and magnetospheric substorms. Berlin, Germany: Springer Science and Business Media, 222–224.
Birn, J., Thomsen, M., Borovsky, J., Reeves, G., McComas, D., and Belian, R. (1997). Characteristic plasma properties during dispersionless substorm injections at geosynchronous orbit. J. Geophys. Res. Space Phys. 102, 2309–2324. doi:10.1029/96JA02870
Birn, J., Thomsen, M., Borovsky, J., Reeves, G., McComas, D., Belian, R., et al. (1998). Substorm electron injections: geosynchronous observations and test particle simulations. J. Geophys. Res. Space Phys. 103, 9235–9248. doi:10.1029/97ja02635
Blake, J., Carranza, P., Claudepierre, S., Clemmons, J., Crain, W., Dotan, Y., et al. (2014). The magnetic electron ion spectrometer (mageis) instruments aboard the radiation belt storm probes (rbsp) spacecraft. Space Sci. Rev. 179, 383–421. doi:10.1007/s11214-013-9991-8
Brown, N., Davis, T., Hallinan, T., and Stenbaek-Nielsen, H. (1976). Altitude of pulsating aurora determined by a new instrumental technique. Geophys. Res. Lett. 3, 403–404. doi:10.1029/gl003i007p00403
Bryant, D., Smith, M., and Courtier, G. (1975). Distant modulation of electron intensity during the expansion phase of an auroral substorm. Planet. Space Sci. 23, 867–878. doi:10.1016/0032-0633(75)90022-7
Chepuri, S. N. F., Jaynes, A. N., Turner, D. L., Gabrielse, C., Baker, D. N., Mauk, B. H., et al. (2023). A comparison of energetic particle energization observations mms at and injections at van allen probes. Front. Astronomy Space Sci. 9. doi:10.3389/fspas.2022.1033546
Claudepierre, S., Blake, J. B., Boyd, A., Clemmons, J., Fennell, J., Gabrielse, C., et al. (2021). The magnetic electron ion spectrometer: a review of on-orbit sensor performance, data, operations, and science. Space Sci. Rev. 217, 80–67. doi:10.1007/s11214-021-00855-2
Cresswell, G., and Davis, T. (1966). Observations on pulsating auroras. J. Geophys. Res. 71, 3155–3163. doi:10.1029/jz071i013p03155
Donovan, E., Mende, S., Jackel, B., Frey, H., Syrjäsuo, M., Voronkov, I., et al. (2006). The themis all-sky imaging array—system design and initial results from the prototype imager. J. Atmos. Solar-Terrestrial Phys. 68, 1472–1487. doi:10.1016/j.jastp.2005.03.027
Dungey, J. (1963). Loss of van allen electrons due to whistlers. Planet. Space Sci. 11, 591–595. doi:10.1016/0032-0633(63)90166-1
Duthie, D., and Scourfield, M. (1977). Aurorae and closed magnetic field lines. J. Atmos. Terr. Phys. 39, 1429–1434. doi:10.1016/0021-9169(77)90099-x
Ebihara, Y., Tanaka, T., and Kikuchi, T. (2014). Counter equatorial electrojet and overshielding after substorm onset: global mhd simulation study. J. Geophys. Res. Space Phys. 119, 7281–7296. doi:10.1002/2014ja020065
Gabrielse, C., Angelopoulos, V., Runov, A., and Turner, D. (2012). The effects of transient, localized electric fields on equatorial electron acceleration and transport toward the inner magnetosphere. J. Geophys. Res. Space Phys. 117. doi:10.1029/2012ja017873
Gabrielse, C., Angelopoulos, V., Runov, A., and Turner, D. L. (2014). Statistical characteristics of particle injections throughout the equatorial magnetotail. J. Geophys. Res. Space Phys. 119, 2512–2535. doi:10.1002/2013ja019638
Heppner, J. P. (1954). Time sequences and spatial relations in auroral activity during magnetic bays at college, Alaska. J. Geophys. Res. 59, 329–338. doi:10.1029/jz059i003p00329
Heppner, J. P. (1958). “Satellite geomagnetic measurements,” in Scientific uses of earth satellites. Editor J. A. van Allen (Ann Arbor, Michigan USA: University of Michigan Press), 234.
Hosokawa, K., Miyoshi, Y., Ozaki, M., Oyama, S.-I., Ogawa, Y., Kurita, S., et al. (2020). Multiple time-scale beats in aurora: precise orchestration via magnetospheric chorus waves. Sci. Rep. 10, 3380. doi:10.1038/s41598-020-59642-8
Ilie, R. (2020). “Chapter 3 - theoretical description,” in Ring current investigations. Editors V. K. Jordanova, R. Ilie, and M. W. Chen (Amsterdam, Netherlands: Elsevier), 53–98. doi:10.1016/.B978-0-12-815571-4.00003-2
Jaynes, A., Lessard, M., Rodriguez, J., Donovan, E., Loto’Aniu, T., and Rychert, K. (2013). Pulsating auroral electron flux modulations in the equatorial magnetosphere. J. Geophys. Res. Space Phys. 118, 4884–4894. doi:10.1002/jgra.50434
Jaynes, A. N., Lessard, M., Takahashi, K., Ali, A., Malaspina, D., Michell, R., et al. (2015). Correlated pc4–5 ulf waves, whistler-mode chorus, and pulsating aurora observed by the van allen probes and ground-based systems. J. Geophys. Res. Space Phys. 120, 8749–8761. doi:10.1002/2015ja021380
Jones, S., Lessard, M., Rychert, K., Spanswick, E., and Donovan, E. (2011). Large-scale aspects and temporal evolution of pulsating aurora. J. Geophys. Res. Space Phys. 116. doi:10.1029/2010ja015840
Jones, S., Lessard, M., Rychert, K., Spanswick, E., Donovan, E., and Jaynes, A. (2013). Persistent, widespread pulsating aurora: a case study. J. Geophys. Res. Space Phys. 118, 2998–3006. doi:10.1002/jgra.50301
Kanekal, S., Baker, D., Fennell, J., Jones, A., Schiller, Q., Richardson, I., et al. (2016). Prompt acceleration of magnetospheric electrons to ultrarelativistic energies by the 17 march 2015 interplanetary shock. J. Geophys. Res. Space Phys. 121, 7622–7635. doi:10.1002/2016ja022596
Kasahara, S., Miyoshi, Y., Yokota, S., Mitani, T., Kasahara, Y., Matsuda, S., et al. (2018). Pulsating aurora from electron scattering by chorus waves. Nature 554, 337–340. doi:10.1038/nature25505
Kennel, C. F., and Petschek, H. (1966). Limit on stably trapped particle fluxes. J. Geophys. Res. 71, 1–28. doi:10.1029/jz071i001p00001
Kvifte, G., and Pettersen, H. (1969). Morphology of the pulsating aurora. Planet. Space Sci. 17, 1599–1607. doi:10.1016/0032-0633(69)90148-2
Lew, J. S. (1961). Drift rate in a dipole field. J. Geophys. Res. 66, 2681–2685. doi:10.1029/jz066i009p02681
Li, X., Baker, D., Temerin, M., Reeves, G., and Belian, R. (1998). Simulation of dispersionless injections and drift echoes of energetic electrons associated with substorms. Geophys. Res. Lett. 25, 3763–3766. doi:10.1029/1998gl900001
Mauk, B., Fox, N. J., Kanekal, S., Kessel, R., Sibeck, D., and Ukhorskiy, a. A. (2014). Science objectives and rationale for the radiation belt storm probes mission. van Allen probes mission, 3–27. doi:10.1007/978-1-4899-7433-4_2
Mauk, B. H., and McIlwain, C. E. (1974). Correlation of kp with the substorm-injected plasma boundary. J. Geophys. Res. 79, 3193–3196. doi:10.1029/ja079i022p03193
McEwen, D., and Duncan, C. (1981). A campaign to study pulsating auroras. Can. J. Phys. 59, 1029–1033. doi:10.1139/p81-135
McIlwain, C. E. (1974). “Substorm injection boundaries,” in Magnetospheric physics: Proceedings of the advanced summer institute held at Sheffield, UK, August 1973, 143–154.
Mende, S., Harris, S., Frey, H., Angelopoulos, V., Russell, C., Donovan, E., et al. (2009). The themis array of ground-based observatories for the study of auroral substorms. themis mission, 357–387. doi:10.1007/978-0-387-89820-9_16
Motoba, T., Ohtani, S., Gkioulidou, M., Ukhorskiy, A., Lanzerotti, L. J., and Claudepierre, S. G. (2021). Superposed epoch analysis of dispersionless particle injections inside geosynchronous orbit. J. Geophys. Res. Space Phys. 126, e2021JA029546. doi:10.1029/2021ja029546
Nakamura, R., Yamamoto, T., Kokubun, S., Oguti, T., and Baker, D. (1990). Pulsating auroral activity and energetic electron injections. Eos Trans. AGU 71, 913–914.
Nemzek, R., Nakamura, R., Baker, D., Belian, R., McComas, D., Thomsen, M., et al. (1995). The relationship between pulsating auroras observed from the ground and energetic electrons and plasma density measured at geosynchronous orbit. J. Geophys. Res. Space Phys. 100, 23935–23944. doi:10.1029/95ja01756
Ng, Y., Hoshino, M., Amano, T., Shirakawa, K., and Higashimori, K. (2013). Introduction to motion of charged particles in earth’s magnetosphere.
Nishimura, Y., Bortnik, J., Li, W., Thorne, R., Chen, L., Lyons, L., et al. (2011). Multievent study of the correlation between pulsating aurora and whistler mode chorus emissions. J. Geophys. Res. Space Phys. 116. doi:10.1029/2011ja016876
Nishimura, Y., Bortnik, J., Li, W., Thorne, R. M., Lyons, L. R., Angelopoulos, V., et al. (2010). Identifying the driver of pulsating aurora. science 330, 81–84. doi:10.1126/science.1193186
Oguti, T., Kokubun, S., Hayashi, K., Tsuruda, K., Machida, S., Kitamura, T., et al. (1981). Statistics of pulsating auroras on the basis of all-sky tv data from five stations. i. occurrence frequency. Can. J. Phys. 59, 1150–1157. doi:10.1139/p81-152
Oguti, T., and Watanabe, T. (1976). Quasi-periodic poleward propagation of on-off switching aurora and associated geomagnetic pulsations in the dawn. J. Atmos. Terr. Phys. 38, 543–551. doi:10.1016/0021-9169(76)90013-1
Omholt, A., and Berger, S. (1967). The occurrence of auroral pulsations in the frequency range 0·01–0·1 c/s over tromso. Planet. Space Sci. 15, 1075–1080. doi:10.1016/0032-0633(67)90174-2
Öztürk, M. K. (2012). Trajectories of charged particles trapped in earth’s magnetic field. Am. J. Phys. 80, 420–428. doi:10.1119/1.3684537
Reeves, G., Fritz, T., Cayton, T., and Belian, R. (1990). Multi-satellite measurements of the substorm injection region. Geophys. Res. Lett. 17, 2015–2018. doi:10.1029/gl017i011p02015
Royrvik, O., and Davis, T. (1977). Pulsating aurora: local and global morphology. J. Geophys. Res. 82, 4720–4740. doi:10.1029/ja082i029p04720
Sandahl, I. (1984). Pitch angle scattering and particle precipitation in a pulsating aurora-an experimental study. Tech. Rep. Kiruna Geofys. Inst., (Sweden).
Sarafopoulos, D., and Sarris, E. (1988). Inverse velocity dispersion of energetic particle bursts inside the plasma sheet. Planet. space Sci. 36, 1181–1199. doi:10.1016/0032-0633(88)90072-4
Sarris, E., Krimigis, S., and Armstrong, T. (1976). Observations of magnetospheric bursts of high-energy protons and electrons at ∼35R<sub>E</sub>with Imp 7. J. Geophys. Res. 81, 2341–2355. doi:10.1029/ja081i013p02341
Smith, M., Bryant, D., and Edwards, T. (1980). Pulsations in auroral electrons and positive ions. J. Atmos. Terr. Phys. 42, 167–178. doi:10.1016/0021-9169(80)90077-x
Spence, H. E., Reeves, G., Baker, D., Blake, J., Bolton, M., Bourdarie, S., et al. (2013). Science goals and overview of the radiation belt storm probes (rbsp) energetic particle, composition, and thermal plasma (ect) suite on nasa’s van allen probes mission. Space Sci. Rev. 179, 311–336. doi:10.1007/s11214-013-0007-5
Suszcynsky, D. M., Borovsky, J. E., Thomsen, M. F., McComas, D. J., and Belian, R. D. (1996). Coordinated ground-based and geosynchronous satellite-based measurements of auroral pulsations. Los Alamos, NM (United States): Los Alamos National Lab.LANL.
Troyer, R. N., Jaynes, A. N., Hartley, D. P., Meredith, N. P., Hua, M., and Bortnik, J. (2024). Substorm driven chorus waves: decay timescales and implications for pulsating aurora. J. Geophys. Res. Space Phys. 129, e2023JA031883. doi:10.1029/2023ja031883
Troyer, R. N., Jaynes, A. N., Kaeppler, S. R., Varney, R. H., Reimer, A. S., and Jones, S. L. (2022). Substorm activity as a driver of energetic pulsating aurora. Front. astronomy space Sci. 9, 1032552. doi:10.3389/fspas.2022.1032552
Tsurutani, B. T., and Smith, E. J. (1974). Postmidnight chorus: a substorm phenomenon. J. Geophys. Res. 79, 118–127. doi:10.1029/ja079i001p00118
Turner, D., Claudepierre, S., Fennell, J., O’Brien, T., Blake, J., Lemon, C., et al. (2015). Energetic electron injections deep into the inner magnetosphere associated with substorm activity. Geophys. Res. Lett. 42, 2079–2087. doi:10.1002/2015gl063225
Turner, D. L., Fennell, J., Blake, J., Claudepierre, S., Clemmons, J., Jaynes, A., et al. (2017). Multipoint observations of energetic particle injections and substorm activity during a conjunction between magnetospheric multiscale (mms) and van allen probes. J. Geophys. Res. Space Phys. 122, 11–481. doi:10.1002/2017ja024554
Victor, L. J. (1965). Correlated auroral and geomagnetic micropulsations in the period range 5 to 40 seconds. J. Geophys. Res. 70, 3123–3130. doi:10.1029/jz070i013p03123
Wang, H., and Lühr, H. (2021). Effects of solar illumination and substorms on auroral electrojets based on champ observations. J. Geophys. Res. Space Phys. 126, e2020JA028905. doi:10.1029/2020ja028905
Wang, H., Zhang, K. D., Wan, X., and Lühr, H. (2017). Universal time variation of high-latitude thermospheric disturbance wind in response to a substorm. J. Geophys. Res. Space Phys. 122, 4638–4653. doi:10.1002/2016ja023630
Yau, A. W., Whalen, B. A., and McEwen, D. (1981). Rocket-borne measurements of particle pulsation in pulsating aurora. J. Geophys. Res. Space Phys. 86, 5673–5681. doi:10.1029/ja086ia07p05673
Zaharia, S., Cheng, C., and Johnson, J. R. (2000). Particle transport and energization associated with substorms. J. Geophys. Res. Space Phys. 105, 18741–18752. doi:10.1029/1999ja000407
Keywords: pulsating aurora, aurora, substorm, substorm injection, particle injection, Van Allen Probes (RBSP), radiation belts
Citation: Momberg JC, Jaynes AN, Chepuri SNF, Leali A, Karl JA and Troyer RN (2024) The impact of drifting substorm-injected electrons on pulsating aurora initiation and intensification. Front. Astron. Space Sci. 11:1335562. doi: 10.3389/fspas.2024.1335562
Received: 09 November 2023; Accepted: 23 January 2024;
Published: 01 March 2024.
Edited by:
Hui Wang, Wuhan University, ChinaReviewed by:
Jiang Liu, University of Southern California, United StatesKedeng Zhang, Wuhan University, China
Copyright © 2024 Momberg, Jaynes, Chepuri, Leali, Karl and Troyer. This is an open-access article distributed under the terms of the Creative Commons Attribution License (CC BY). The use, distribution or reproduction in other forums is permitted, provided the original author(s) and the copyright owner(s) are credited and that the original publication in this journal is cited, in accordance with accepted academic practice. No use, distribution or reproduction is permitted which does not comply with these terms.
*Correspondence: John C. Momberg, john-momberg@uiowa.edu