Identifying Urine Patches on Intensively Managed Grassland Using Aerial Imagery Captured From Remotely Piloted Aircraft Systems
 Juliette Maire1,2,3,4*
  Simon Gibson-Poole2,3
  Nicholas Cowan4
  Dave S. Reay3 Karl G. Richards1 Ute Skiba4
  Robert M. Rees2 Gary J. Lanigan1
- 1Soils and Land Use Department, Teagasc, Wexford, Ireland
- 2Future Farming Systems, Scotland's Rural College, Edinburgh, United Kingdom
- 3School of Geosciences, University of Edinburgh, Edinburgh, United Kingdom
- 4Atmospheric Chemistry and Effects, Centre for Ecology and Hydrology, Penicuik, United Kingdom
The deposition of livestock urine and feces in grazed fields results in a sizable input of available nitrogen (N) in these soils; therefore significantly increasing potential nitrogen pollution from agricultural areas in the form of nitrous oxide (N2O), ammonia (NH3), and nitrate (NO3−). Livestock deposition events contributes to high spatial variability within the field and generate uncertainties when assessing the contribution that animal waste has on nitrogen pollution pathways. This study investigated an innovative technique for identifying the spatial coverage of urine deposition in grasslands without the need for manual soil measurements. A Remotely Piloted Aircraft System (RPAS) using a twin camera system was used to identify urine patches in a 5 ha field, which had been grazed by sheep 3 weeks previous to measurements. The imagery was processed using Agisoft Photoscan (Agisoft LLC) to produce true and false color orthomosaic imagery of the entire field. Imagery of five areas (225 m2) within the field were analyzed using a custom R script. For a total of 1,125 m2 of grassland, 12.2% of the area consisted of what was classified as urine patch. A simple up-scaling method was applied to these data to calculate N2O emissions for the entire field providing an estimate of 1.3–2.0 kg N2O-N ha−1 emissions from urine and fertilizer inputs.
1. Introduction
In order to improve Nutrient Use Efficiency (NUE) and reduce unnecessary losses in the food supply chain, management of nutrients in agricultural systems has to be considered in its entirety. One potential solution to improve NUE is to use precision farming techniques which take into account the spatial heterogeneity and temporal variability of nutrients already present at the field scale before further fertilizers are applied (Mulla, 2012; Hedley, 2014). In the context of precision agriculture in intensively grazed grassland management, it is of particular interest to study excreta deposited by grazing animals. Nutrient losses from livestock at the field scale are difficult to assess in full due to the randomness of the deposition of urine and dung from grazing animals (Auerswald and Mayer, 2010; Cowan et al., 2015). Past research has focused primarily upon the overall control and management of livestock waste and its impacts on the environment, grass production, and soil quality (Boon et al., 2014; Selbie et al., 2015; Hyde et al., 2016) with little attention paid to spatial heterogeneity.
In the case of sheep urine, the nitrogen (N) content is reported in the literature only sporadically and the uncertainties about these values are large as shown in the meta-analysis reported by Selbie et al. (2015). The nitrogen loading was reported to vary from 500 to 1,089 kg N ha−1 for sheep urine deposits based on the findings that the urine contains 5–10 g N L−1 and a volume per urination of 0.5 L would cover an area of 0.03–0.05 m2 (Haynes and Williams, 1993). In our study, using these values, the amount of urine N deposited represents an equivalent of 2.0–4.8 times the annual amount of N fertilizer (225 kg N ha−1). This excess of applied nitrogen leads to an increased likelihood of N leaching, ammonia (NH3) volatilization, and nitrous oxide (N2O) emission, but also increased grass growth (Hyde et al., 2016; Marsden et al., 2016), as well as increasing nitrogen and carbon pools in the soil urine depositions change soil pH, soil surface temperature, and soil moisture content (Marriott et al., 1987; Moir et al., 2011; Boon et al., 2014; Selbie et al., 2015). All factors are likely to change the N2O emission rate (Clough et al., 2004; Hoogendoorn et al., 2008; De Klein et al., 2014).
Typical apportionment values for deposited sheep urine are estimated as 13% NH3 volatilization; 2% N2O emission; 20% NO3− leaching; 41% pasture uptake and 26% gross immobilization of the total deposited urinary nitrogen (Selbie et al., 2015). Monitoring deposited urine in soils is difficult due to the fact that the urine itself is not directly visible. However, urine patches do have visible consequences for the grass growth, most noticeably color and density of the leaves (Dennis et al., 2011). These properties may serve as a useful proxy for tracking urine deposition, but the response in grass growth to urine deposition also depends strongly on soil type, soil moisture content, seasonal and climatic conditions and the nitrogen content of the urine (Clough et al., 2004).
Existing urine deposition detection methods include simple visual observations of variations in vegetation growth and color (Auerswald and Mayer, 2010). Recent advancements in technology have made it possible to detect urine patches by fitting the grazing animals with GPS collars and thermal sensors (Betteridge et al., 2010), or with cameras footage or urine sensors (Misselbrook et al., 2016); all of which typically require considerable investment in time, human and material resources. These methods are usually either only effective over small areas, a small number of grazing animals or require installing sensors on the animals. Moreover, post-grazing methods to detect urine patches manually or electronically are limited in their ability to capture reliable and good quality data (Misselbrook et al., 2016). The method developed in this study could help to mitigate these issues by increasing the frequency of observations, allowing the study of overlapping urination during the same or different grazing events. In other words, a low-cost, high-frequency, non-destructive method that is easy to deploy in the field is required.
In agricultural studies, practices that make use of remote sensing technologies have been widely developed to map a variety of spatial factors such as crop production estimation (Jensen et al., 2007; Hunt et al., 2010), grass nutrient content (Capolupo et al., 2015; Pullanagari et al., 2016), weed distribution (Jensen et al., 2003), soil spatial variability mapping (Stoorvogel et al., 2015), and diseased or damaged crops (Mirik et al., 2006). Remotely Piloted Aircraft Systems (RPAS) can fly at low altitude allowing acquisition of high spatial resolution imagery to observe small individual objects, such as grass patches, and can be deployed even in cloudy conditions for which the acquisition of satellite imagery or helicopter videography become difficult. The effort required to deploy an RPAS platform has greatly reduced in recent years, contributing in some cases to more flexible and affordable experimentation than with other aerial image acquisition systems (Zhang and Kovacs, 2012). Use of other remote sensing techniques (e.g., piloted aircraft, helicopter, satellite platforms) can be limited in its ability to provide adequate field-scale image acquisition, image quality, and spatial and temporal resolutions partly due to cost and sensitivity to weather conditions (Dennis et al., 2013; Ali et al., 2016; Lopes et al., 2017).
In the case of urine patch detection and grass quality studies, good preliminary results have already been obtained using aerial or ground-based imagery (Moir et al., 2011; Dennis et al., 2013; Roten et al., 2017). Nevertheless, development of automated pre- and post-processing of images covering large areas, enabling automated detection of patches, is still required. The challenge of automating patch-detection presents complex difficulties, such as the light variability effect on similar reflectance properties, the requirement of a high-resolution image, the identification and removal of unwanted plants and object reflectance interfering with the detection. Recently, numerous approaches have been developed to perform feature or land-cover detection on images from satellite imagery (Sammouda et al., 2014), phenology cameras (Filippa et al., 2016), microscopic or X-ray imagery, and remote sensing imagery from RPAS (Hunt et al., 2010; Mulla, 2012; Capolupo et al., 2015). For high resolution remotely sensed imagery (where image pixels are much smaller than the objects to be identified), an object based image analysis (OBIA) technique is more appropriate to use compared to a pixel based approach (Blaschke, 2010). Commonly used software packages that use OBIA techniques include eCognition (Gupta and Bhadauria, 2014) or python scripts combined with OpenCV, however, these programs can carry expensive licenses or may not be user-friendly for most environmental and agricultural science researchers.
The method developed in this study is a remote sensing-based approach, aimed at enabling the collection of a large number of urination events at numerous times in an automated way (Mulla, 2012). This method is based on grass growth response and does not measure the area over which the urine has been deposited (wetted area), but considers the effective area (Buckthought et al., 2016). The effective area of a urine patch includes the wetted area, the diffusional area and the pasture response area. The wetted area has been distinguished from the diffusional and pasture response area which incorporates the diffusive edge of the nutrients and the plants able to access, via their roots, these nutrients (Marsden et al., 2016). Often N2O emission estimates of urine patches focus on the wetted area only and do not account for the diffusional areas (Williams and Haynes, 1994; Hoogendoorn et al., 2008). By measuring nitrogen input from urination and spatially determine their locations, the development of this method has the potential to help farmers to control their fertilizer management, improving NUE, and reducing associated N pollution to the environment.
The objective of this study was to evaluate the potential and the limitations of using a combined tool of RPAS orthoimagery and a script written in R (R Development Core Team, 2016) to allow feature detection. The aim was to provide an efficient tool to map urine patch coverage over grazed grassland in order to improve N2O estimates at the field scale and to better explain field soil spatial variability.
2. Materials and Methods
Urine patch detection was undertaken by: (1) Collection of pictures in the field using a RPAS; (2) Stitching the collected pictures together to obtain an orthoimage of the entire surveyed area; (3) Automated identification of the urine patches from the pictures; (4) Aggregation of detected urine patch data. This step-wise method was designed to allow the characterization of field scale urine deposition coverage, size, and color.
2.1. Remotely Piloted Aircraft Systems (RPAS) and on Board Camera System
The RPAS used in this study was a custom-built, eight-motor multi-rotor system housed in a 1 m diameter Vulcan octocopter frame (VulcanUAV, Mitcheldean, UK; Figure 1), controlled via a 3DR Pixhawk autopilot running Arducopter (v3.2.1) firmware (3D Robotics, Berkeley, USA). The autopilot contained an inertial measurement unit, a barometer, a magnetometer and an external GPS for navigation. The RPAS was powered by two 14.8 V, 10,000 mAh lithium polymer batteries which provide a flight time of ~14 min whilst carrying the dual camera payload of ~320 g. The dual camera system was housed in a stabilized gimbal and contained two Canon A2200 point and shoot cameras (Canon, Tokyo, Japan). One of the cameras was un-modified, giving a typical red, green, blue (RGB) image, and one was modified to sense near infra-red (NIR) wavelengths of light through the removal of its internal NIR filter and the addition of an acrylic 585 nm long pass filter (Knight Optical, Harrietsham, UK).
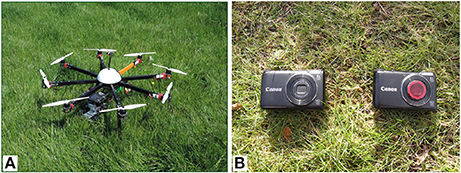
Figure 1. (A) Octocopter used for this project mounted with an unmodified (B, left) and a modified Canon A2200 measuring visible light and near infra-red light (B, right).
The spectral sensitivity of the cameras was tested to identify their spectral characteristics, revealing that for the modified camera, NIR was captured across all channels with the blue channel showing the purest signal (Berra et al., 2015). Both cameras used the Canon Hack Development Kit (CHDK) modified firmware (v1.2) and the KAP UAV exposure control script (v3.1) to enable RAW imagery to be acquired when commanded via the autopilot. The script also allows the shutter speed and ISO to vary within a specified range (1/200 to 1/2,000 s and 200 to 400 ISO, respectively). The internal neutral density filter was not used. The aperture (f 2.8) and zoom level (default) were fixed with focus set to infinity and the white balance was calibrated against a gray card before the flight to provide reliable visual results.
2.2. Unmanned Aerial Survey
On the 6th of June 2016, four flights were operated to survey the entire field, from two take-off positions which ran perpendicular to the slope of the field to maintain an altitude of 35 m above ground level. The images captured during the four flights were then considered as one dataset. All flights used pre-programmed automatic waypoints facilitated by Mission Planner (http://ardupilot.org/planner) to ensure an image overlap of 60% and a side overlap of 80% in order to optimize the image stitching. The flight speed was 2 m s−1 to allow for the camera system to capture images at the rate of one image every ~6 s. Georectification of the imagery was performed by surveying the center of twelve fixed collars (used for static chambers measurements) distributed within the field using a Piksi (Swift Navigation, San Francisco, USA) real-time kinematic GPS with an expected accuracy of ±13 cm (Figure 2).
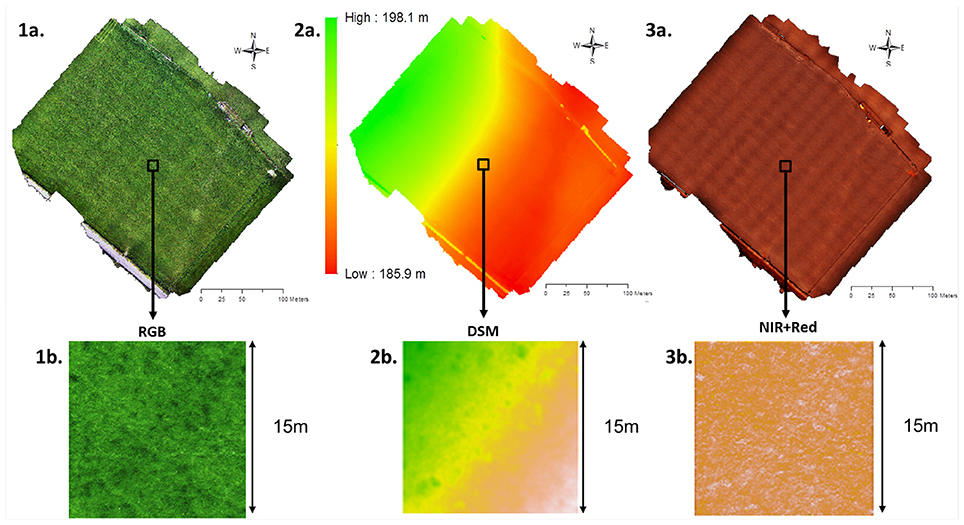
Figure 2. The Easter Bush grassland orthoimage from images captured using a RPAS on the 6th of June 2016 (1a, 2a, 3a) and a square of 15 by 15 m used for the urine patch detection script (1b, 2b,3b). (1) Orthoimage with RGB visible colors, (2) Digital elevation model, and (3) Orthoimage with near infrared information.
2.3. Field Site
The survey was conducted over a 5 ha intensively managed grazed grassland ~10 km South of Edinburgh, 190 m above sea level (3°12′W, 55°52′N) over the period March 2016 to June 2016 (Jones et al., 2017). The field is predominantly grazed by sheep, which is annually grazed at 0.7 livestock unit (LSU) per hectare rate. Before the RPAS survey, the field was grazed from the third week of March 2016 to mid-May 2016 (7 weeks), by 100 ewes and was fertilized in early April 2016 with 69 kg of N ha−1 in the form of urea. After the grazing period, no animals were present in the field. The field was harvested mid-July 2016 and 12 sub-samples were collected for a total area of 1.5 m2. The dry matter (DM) grass yield was 8.0 tone ha−1 with a dry matter content of 243 g kg−1. The crude protein content was an average of 79.3 g kg−1 DM and the metabolized energy 10.8 MJ kg−1 DM. From the same sub-samples, the DM grass yield was found to be significantly different between patch areas, areas where urine was deposited and areas visually not affected by urine (one-way ANOVA, p = 0.0015, n = 12) with an average of 9.5 and 6.0 tone ha−1, respectively. The protein content and the metabolized energy of the grass did not show significant differences between the two areas of grass visually assessed as patch area or not affected area. The field consists of an imperfectly drained MacMerry soil series, Rowanhill soil association (Eutric Cambisol) with a pH (in H2O) of 5.1 and a clay fraction of 20–26% (Jones et al., 2011). The main grass species is Italian ryegrass (Lolium perenne). The long-term average annual rainfall (1981–2010) at this site is 980 mm and the mean daily temperature is 18.8 °C in summer (July) and 5.6 °C in winter (January) (Jones et al., 2017).
2.4. Pre-processing Using Agisoft Photoscan
The RGB and NIR images were initially processed to remove erroneous pixels using the Canon Hack Development Kit CHDK (http://chdk.wikia.com/wiki/PTP_Extension), followed by further processing using a custom script in ImageJ (Schindelin et al., 2013) converted each image to a 16 bit linear tagged image file format (TIFF) file (white balance set to 1, no gamma correction) using DCRAW software (Coffin, 2016), which utilized a dark image of the same ISO and shutter speed in order to reduce dark current signal noise. Each image was then smoothed using an ImageJs despeckle filter to further remove noise before the PTlens software (T.Niemann, Portland, Oregon, USA) was used to correct lens and edges distortion. The RGB images were processed a second time to produce a better visual set of data in 16 bit TIFF format (gamma corrected, white balance as set for each flight, utilizing highlight recovery options) and sharpened using ImageJs sharpen filter. The TIFF files were geotagged using the GPS information from the RPAS flight log and were then processed using Agisoft Photoscan (Agisoft LLC), using high settings (Highest alignment, High Dense cloud with mild depth filtering) to produce a georeferenced orthomosaic for each dataset: RGB and NIR (Figure 2).
2.5. Detection of Urine Patches Algorithm
2.5.1. Algorithm Step 1: Cropping of the Orthoimages and NDVI Calculation
The RGB and NIR orthimages of the surveyed field were stacked on a raster layer then clipped to select smaller areas resulting in a more manageable file sizes of 15 by 15 m of grassland (1107 by 1107 pixels, format .tiff, 20.6 MB, resolution of 1.84 cm2 pixel) (Figure 2).
Red and NIR stands for the red reflectance and near-infrared reflectance.
The NIR images allowed the calculation of the Normalized Difference Vegetation Index (NDVI) based on the data from the blue channel of the modified camera (to give NIR) and the red channel of the un-modified camera (to give the red). NDVI is a ratio using red and NIR reflectance to highlight photosynthesis (Equation 1). NDVI varies between −1.0 and +1.0 and is mostly used for satellite pictures due to its link with differences in vegetation type, biomass and photosynthetic potential. NDVI is commonly used for feature detection in vegetation environments (Jensen et al., 2003; Hunt et al., 2010; Mulla, 2012). Red and NIR cropped images were also studied in addition to NDVI cropped images to estimate the efficiency of using NDVI to supplement the use of either Red or only NIR images.
2.5.2. Algorithms Step 2: Pixel Clustering
To detect urine patches in each picture the clustering method based on pixel segmentation was chosen to be applied to the NDVI raster layer created from the RBG and NIR images. Clustering is the task of grouping a set of pixels in a way that pixels of the same group called a cluster (K) are more similar in term of color characteristics, to each other than to those of the other groups. In this study, the algorithm was written to perform an unsupervised classification using K-means clustering method (Jain, 2010) on each pixel of the NDVI layer. This method is designed to handle large datasets and follows four consecutive steps for each cluster:
1. Selection of the K cluster centroids
2. Attribute pixel to its closest centroid
3. Set position of each cluster to the mean of all pixel values belonging to that cluster
4. Reiteration of the steps 2 and 3 until convergence or until the maximum number of iterations is reached (default is 10 iterations)
The algorithm implemented in R was developed by Hartigan and Wong (1979) for the purpose of partitioning data points into k groups to minimize the distance from the data points to the cluster centroid. In other words, in the Lloyd's algorithm (Equation 2), for each iteration, each pixel is assigned to the cluster with the smallest value of:
Where n is the number of pixels, K the given cluster, i is the pixel considered, ci is the set of pixel that belong to the cluster k and xi−μi the Euclidean distance between the pixel i and the centroid of the cluster K. The selection of the cluster first centroid is normally randomized inside the whole image. But in this study, the starting point to the K-means method was arbitrary set to ensure that the results would be the same if the process was to be repeated. The clustering was performed for a set number of clusters per image that needed to be predetermined. For this purpose, the elbow method (Figure 3) which is a hierarchical cluster analysis was performed using a set of dissimilarities for the number of objects (n) being clustered. The method selected was the Ward's minimum variance method (Ward, 1963) that allows the identification of compact, spherical clusters. Through this method, the optimal number of clusters was found to be 4 for the 15 by 15 m squares of grassland.
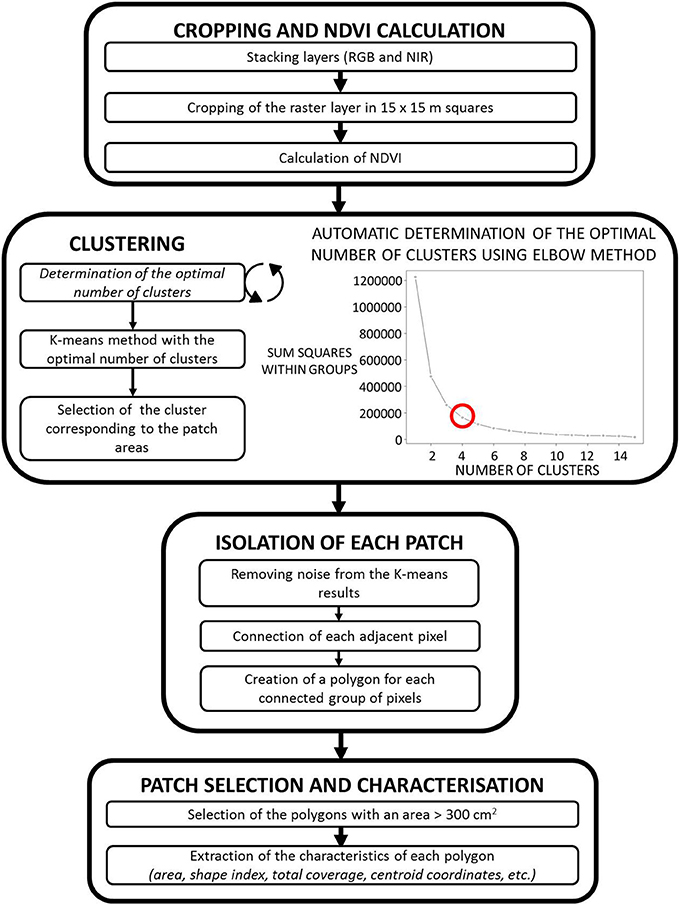
Figure 3. Step by step description of the urine patch detection script and result of the elbow method for determining the optimal number of clusters.
2.5.3. Algorithms Step 3: Isolation of Each Urine Patch
The next step was to isolate the urine patches from each other. For each image, inside the cluster corresponding to the urine patch, the connected adjacent pixels were grouped together to form a patch. For this step, a virtual window of 9 by 9 pixels was created to screen the whole image to remove small groups of pixels which were noise from the clustering step. Then using the same method, gaps inside the same patch were dissolved and pixels belonging to the same patch were connected. Before moving to the next step, the function rasterToPolygon() (from the R package “raster,” https://www.rdocumentation.org/packages/raster/versions/2.6-7) was used to convert each patch as a polygon.
2.5.4. Algorithms Step 4: Patch Selection and Calculation of Their Characteristics
To avoid the detection of unwanted objects such as weed patches, small shadows and groups of denser grass, objects <300 cm2 were discarded, which correspond at the minimal potential size of a urine patch (Selbie et al., 2015; Marsden et al., 2016). Finally, the patch characteristics such as size, centroid coordinates, patch average color values, and shape index (giving an information on the shape of the patch) were calculated and converted to square meters. These values were used to estimate the total coverage of urine patches at the field scale. A step-by-step synthetic diagram of the script is provided in Figure 3.
3. Results and Discussion
3.1. RPAS and Image Stitching Limitations
The orthoimages (i.e., RGB and NIR) obtained from the RPAS survey undertaken on the 6th of June 2016, were generated using Agisoft Photoscan (Agisoft LLC). The Figure 2 shows the output of this software: RBG orthoimage and NIR adding the red digital channel and the Digital Elevation Model (DEM) reprensenting the elevation from the sea level. The stitching of the images captured by the RPAS into an orthoimage is necessary to create an image appearing as though it was taken from a uniform altitude, a rectilinear lens, with limiting edge distortions and with accurate details. The image stitching software is limited by the quality of the pictures captured and the weather conditions (e.g., influenced by light and wind speed). The quality of the camera can also be problematic in some cases. To account for the images distorsions, the surveyed area must be at least 10 m wider than the actual study area. Moreover, color calibration of the pictures is required to enable time series monitoring and the comparison between fields. The proximity and the size of the urine patch deposition required a high pixel resolution but also required the images to be as close as possible to true-colors to ensure accurate patch detection. A more detailed review on the challenges and limitations of using RPAS over grassland environments is presented in Von Bueren et al. (2015).
3.2. Image Segmentation Using K-Means Algorithm
Orthoimages of the whole field were cropped to 225 m2 squares (15 by 15 m) of grassland (Figure 2). Five of these cropped images, corresponding to locations close to the middle of the field surveyed, were processed using an R script (see location of the first square in Figure 2) as a proof of concept.
To automate the patch detection, the K-means method (Hartigan and Wong, 1979), commonly used for image segmentation (Lopes et al., 2017; Singh and Misra, 2017), was implemented in the R script. The advantage of this algorithm is that it has a low computational complexity, it is an unsupervised learning mechanism and the resulted clusters of this method are not overlapping. This method was able to detect the urine patches on image with high color similarities, patches in close proximity, and overlapping. However, the K-means methods can work efficiently only if the optimal number of clusters is correctly determined. In this script, the elbow method (Strobl et al., 2017) was used to determine that four clusters were the optimal number of clusters required (Figure 3). The K-means results (Figure 4B) were compared visually to the RGB images (Figure 4A) to access the certainty of patch detection. The specific cluster corresponding to the urine patch was allocated visually and processed using custom functions to isolate each patch (Figures 4C,D). This step is the limitating step in terms of computational complexity, and therefore it is the slowest step in the process (Table 1). An object-based detection instead of a pixel-based method could improve the efficiency of this step but would require a supervised initial classification of some of the areas by the script-user (Rastner et al., 2014). Other features may be mistakenly be labeled as patches when in reality they are weed patches, fence poles, or tractors tracks. These issues have not been assessed in this study due to the fact that the study area did not contained any of these items, but it will be important to include a correction in a future version of this script.
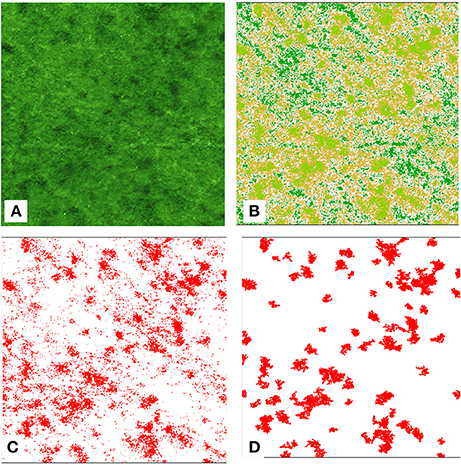
Figure 4. Examples of results from urine patch detection script on a 15 by 15 m square of grassland (example 1 in the Table 3). (A) RGB image, (B) K-means clustering results, (C) selected cluster, and (D) patch isolation results.
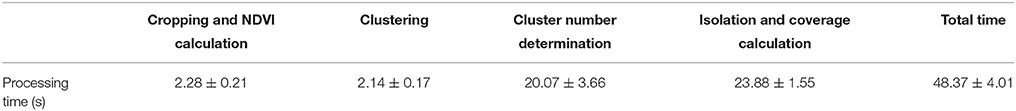
Table 1. Average processing time of the R script for five squares of grassland (225 m2 each) expressed in seconds ± standard deviation.
The typical wetted area of the sheep urine patch, based on field measurements, is estimated to be between 300 and 500 cm2 (Selbie et al., 2015; Marsden et al., 2016). Additionally, the effective area of a sheep urine deposition has been shown to not exceed 20 cm beyond the wetted area (Ducau et al., 2003). Therefore, the total area of the visible patch can range between 400 and 1,600 cm2 (Marsden et al., 2016). The effective area may vary with the volume, the urine nitrogen concentration, soil texture, soil moisture content as well as the topography of the area, vegetation type, and root architecture (Haynes and Williams, 1993; Dennis et al., 2011). Using this information, the script was written to select effective patch areas larger than 300 cm2.
3.3. Validation of the Use of NDVI
NDVI used in this study was chosen for the analysis based on references belonging to other scientific disciplines such as satellite images analysis (Zha et al., 2001; Colombo et al., 2003), feature detection for self-driving cars (Cho et al., 2014) and other RPAS studies as described in the section 1. It was chosen in this study due to its capability to detect the small differences of the green and red spectra inside the images (Rasmussen et al., 2016).
The NDVI is based on Red digital numbers and NIR reflectance values which required to modify the camera to measure NIR. Multispectral sensors such as the parrot sequoia or red edges (https://www.parrot.com/us/business-solutions/parrot-sequoia), are often used to measure NIR values. These devices are about five times more expensive than the modified Canon camera used in this project. Moreover, the necessity of having an extra device on the RPAS would have increased payload capacity of the RPAS and cost. The downside of having two different cameras to ensure that each pixel in both orthoimages are corresponding to the exact same location in the field. For this task, the images have been georeferenced using GPS data collected in the field.
The next step was to identify if the Red digital numbers or the NIR data alone could differentiate efficiently the area affected by urine deposition to the rest of the field. After running the script using the NDVI data, a t-test has been used to compare the values of pixels allocated to the patch area and the ones allocated to the “non-patch” area. The F-value and the R2 from the t-tests were used to compare the performance of the color indices (Figure 5). The difference between pixels allocated to the patch and non-patch area was significant for the three indices (Red, NIR, NDVI). Nonetheless, in this study, Red and NIR values for pixels allocated to urine patches were significantly different than the non-patch pixels. However, from the F-stats and R2 values, it is clear that NIR and Red digital numbers did not perform as well as the NDVI values (Table 2).
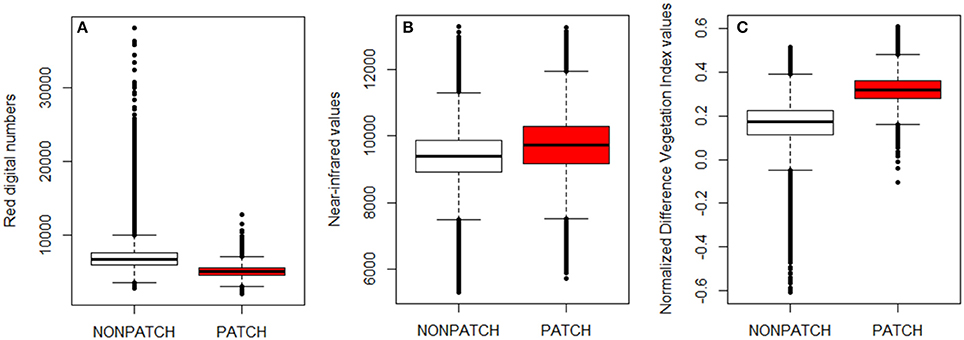
Figure 5. Color composition of pixels allocated as urine patch (red) or non-patch (white) for Red digital number (A), Near infra-red values (B), and Normalized Difference Vegetation Index value (C). Differences between categories were significant for the three indices (t-test, p < 0.00001) with n(Patch) = 168,670 pixels, n(Non−patch) = 1,056,779 pixels.
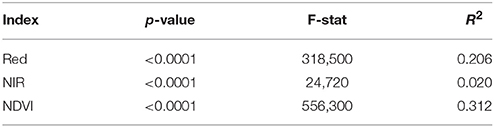
Table 2. Summary of the Student's t-test performed to test the difference in mean values between pixels belonging to patch and pixel not belonging to patch (non-patch) for the three color indices Red digital number (Red), Near infra-red (NIR), and Normalized Difference Vegetation Index (NDVI).
3.4. Urine Patch Coverage and Characteristics
The detection of individual urine patches using the RPAS during four flights on one single day allowed us to calculate the area covered by patches over a sub-section of the field of 1,125 m2 (Table 3), which was 12.2 ± 2.2 %. This coverage value has been used as an estimate of the whole field coverage which corresponds to an area covered by urine patch of 0.7 ha for the 5 ha field. This value is at the low end of urine patch estimation compared to repeated estimates (14–31%) over a year of urine depositions from repetition grazed cattle using field observations or RPAS imagery and grazed by cattle (Moir et al., 2011; Dennis et al., 2013; Selbie et al., 2015). This difference is likely due to the short grazing period before the survey (7 weeks), smaller animals (sheep) as well as as well as the urine nutrient content difference (Kelliher et al., 2014). To evaluate the annual coverage in our study, it would be necessary to repeat the survey regularly throughout the year. Moir et al. (2011)'s experiment was conducted for 4 years (2003–2007) where the urine patches were identified visually in the spring, summer, and autumn periods each year. This identification was time-consuming and took 12 weeks for each season and was considered to be relevant for the previous 3 months of urine deposition. By comparison, RPAS survey could be undertaken weekly, pre- and post- grazing and will generally take <2 h.
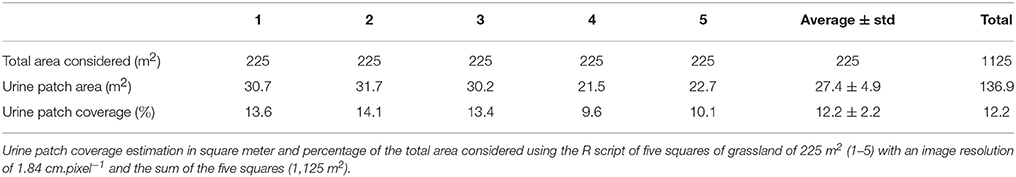
Table 3. Results of the application of the urine patch detection script.
In this study, every grass patch detected using the RPAS survey was considered as a urine patch. However, dung patches are likely to form grass patches unde specific conditions of accumulation of sheep dung. In contrast to cattle dung which forms a grass patch of >50 cm2 after degradation of the dung (taking up to 12 months), sheep dung is in form of pellets scattered over large areas and are unlikely to generate a discernible pasture response (Williams and Haynes, 1995). Moreover, within the period between the grazing ends and the RPAS survey the sheep dung depositions were probably fully degraded (Williams and Haynes, 1995). Therefore, dung deposition was not visible in the output images. For these reasons, grass patches visible in the output image have been assumed to be due to urine and not dung depositions. In the case of potential prior excreta depositions, in this study, the previous grazing event was over 5 months prior to the grazing period studied. Therefore it was unlikely that previous depositions were visible on the RPAS survey images.
3.5. Estimation of N2O Emissions From Patches at the Field Scale
In this study, the urine patch coverage was used to estimate urine and fertilizer induced N2O emissions. A homogeneous amount of urine deposited on the patch has been assumed to calculate the total N2O emissions of the studied field. The calculations have been based on the national greenhouse gas inventory methodology (De Klein et al., 2006). The emission factor of mineral nitrogen fertilizer application and of urine deposition is 1%, i.e., 1% of the nitrogen applied is emitted as N2O. During the period of study, a treatment of 69 kg of N ha−1 was applied and we estimated that 12.2% of the field was covered by urine patches. The amount of nitrogen in sheep urine is required to use the emission factor but this is poorly reported in the literature (De Klein et al., 2014; Hyde et al., 2016; Marsden et al., 2016). For these calculations, the data summarized by Selbie et al. (2015) on sheep grazing urine N content were considered. The N loading for sheep urine was ranged from 500 to 1,089 kg N ha−1. An average value of 800 kg N ha−1 was assumed. From these data, the total emissions of N2O from both urine and N fertilizer application was estimated at 1.3 and 2.0 kg N2O-N ha−1 for the period of grazing studied (Table 4). The emissions from dung depositions and the potentially combined effect of urine and fertilizer were not considered.
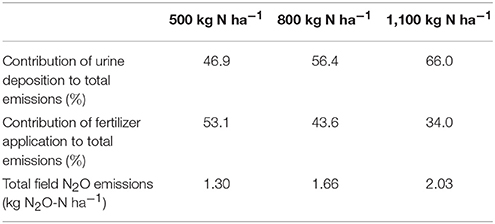
Table 4. Results from up-scaling of the urine deposition and fertilizer application N2O emissions using the IPCC emission factor of 1% and the value of urine patch coverage estimated over a 7 week period (12.2%).
To provide an order of magnitude, the contributions of the N2O emissions from 7 weeks of grazing of 100 ewes and from the mineral fertilizer applied during the same period have been determined. The urine depositions from the grazing ewes contribute of 47–66% of the total N2O emissions (Table 4). From these estimations, emissions induced by urine deposition are not negligible compared to the N2O emissions induced by fertilizer application.
To improve the up-scaling of the emissions, more specific emission factors are required for sheep urine patches (De Klein et al., 2014; Marsden et al., 2016), as they vary with season, soil properties (texture, pH, moisture content), and as it has been done for cattle urine deposition (Clough et al., 2004; Boon et al., 2014; Krol et al., 2016; Minet et al., 2016).
These calculations were based on the percentage of urine patch coverage calculated previously and so, on the effective area of the urine deposition. The difference in emissions between the wetted and the effective areas was assessed for cattle urine by Marsden et al. (2016). They concluded that the cattle urine patch diffusional area is an extremely important source of emissions from urine patches and needs to be considered when measuring EFs. This study justified using the total area affected by urine deposition instead of the wetted area for N2O emissions calculation.
These results (Table 4) are an example of how the urine patch coverage can be used to improve our understanding and estimation of emissions. Furthermore, the automated detection of urine coverage can improve model validation when compared with field data, upscaling from individual patches to field scale as well as allowing the consideration for temporal changes of the emissions.
3.6. R Script Efficiency
This study has led to the production of a script written in the R software. This software is largely used in the scientific community as a statistical tool but more and more researchers are using it for spatial and image analysis. OBIA techniques can be implemented to optimize the processing time and increase the accuracy of the detection (Blaschke, 2010). The R-package currently under further development, will allow researchers working in this area to easily replicate a similar analysis. For a 225 m2 square of grassland, the script will take 48.4 s to process (on a computer with limited power capacity, 4GB RAM, processor Intel®, Core™, i5-5200 CPU, 2.20 GHz). Each step of the script time processing is shown in Table 1. While considering 1 ha of grassland, the script takes about 35 min to run (Figure 3). This accounts for the image segmentation, clustering, the calculation of the parameters of each grass patch and plotting the results, but does not include the generation of the orthomosaic. In future, it will be important to expand this code to run with object-based detection software such as eCognition by Trimble or ArcGIS software by Esri. This would prevent multiple counting or miscounting of patches at the edges of the smaller images by processing the entire field image at once. It will also allow the analysis of larger datasets, such farm scale or entire grazing period datasets.
4. Conclusions
In this study, RPAS and R image analysis have proven to be effective when carrying out high-resolution, non-destructive, near real-time, and low-cost assessment of the size and distribution of urine patches from aerial surveys. This process has been automated and kept unsupervised. The process is based on R software which gives the opportunity to researchers to easily adapt this script to their research purposes as well as directly using it for urine patch coverage estimation. An outcome of this study is the R package which facilitates easy and quick processing of the orthoimages collected with a RPAS. The script efficiency has shown promise for analyzing small and homogenous areas which seem to work sufficiently for plot-based experiments or individual occasions. However, for long-term monitoring of grazing and management impacts on grassland, a more efficient software would be required. Using low-cost RPAS, onboard cameras and an open source software, this method offers new perspectives for nutrient management, precision agriculture, and greenhouse gas emissions estimation in grassland systems.
Author Contributions
JM and SG-P designed the method, developed the image analysis approach and conducted data collection. JM wrote the paper with contributions from all co-authors.
Conflict of Interest Statement
The authors declare that the research was conducted in the absence of any commercial or financial relationships that could be construed as a potential conflict of interest.
The reviewer PH and handling Editor declared their shared affiliation.
Acknowledgments
The authors gratefully acknowledge the University of Edinburgh farm manager Wim Bosma for allowing access to the Easter Bush study field. Valuable assistance was also provided by the Biomathematics and Statistics Scotland, BioS. Funding for this study was provided by the Walsh fellowship program by Teagasc, Ireland and the BBSRC–Newton project UK-China Virtual Joint Centre for Improved Nitrogen Agronomy (CINAG). The authors are grateful to the two reviewers and the editor their suggestions that have improved the manuscript.
References
Ali, I., Cawkwell, F., Dwyer, E., Barrett, B., and Green, S. (2016). Satellite remote sensing of grasslands: from observation to management. J. Plant Ecol. 9, 649–671. doi: 10.1093/jpe/rtw005
Auerswald, K., and Mayer, F. (2010). Coupling of spatial and temporal pattern of cattle excreta patches on a low intensity pasture. Nutr. Cycl. Agroecosyst. 88, 275–288. doi: 10.1007/s10705-009-9321-4
Berra, E., MacArthur, A., Gaulton, R., and Hamilton, A. (2015). Estimation of the spectral sensitivity functions of un-modified and modified commercial off-the-shelf digital cameras to enable their use as a multispectral imaging system for UAVs. Int. Arch. Photogrammetry 1, 207–214. doi: 10.5194/isprsarchives-XL-1-W4-207-2015
Betteridge, K., Hoogendoorn, C., Costall, D., Carter, M., and Griffiths, W. (2010). Sensors for detecting and logging spatial distribution of urine patches of grazing female sheep and cattle. Comp. Electron. Agric. 73, 66–73. doi: 10.1016/j.compag.2010.04.005
Blaschke, T. (2010). Object based image analysis for remote sensing. ISPRS J. Photogrammetry Remote Sens. 65, 2–16. doi: 10.1016/j.isprsjprs.2009.06.004
Boon, A., Robinson, J. S., Chadwick, D. R., and Cardenas, L. M. (2014). Effect of cattle urine addition on the surface emissions and subsurface concentrations of greenhouse gases in a UK peat grassland. Agric. Ecosyst. Environ. 186, 23–32. doi: 10.1016/j.agee.2014.01.008
Buckthought, L., Clough, T., Cameron, K., Di, H., and Shepherd, M. (2016). Plant N uptake in the periphery of a bovine urine patch: determining the “effective area.” N.Z. J. Agric. Res. 59, 1–19. doi: 10.1080/00288233.2015.1134589
Capolupo, A., Kooistra, L., Berendonk, C., Boccia, L., and Suomalainen, J. (2015). Estimating plant traits of grasslands from UAV-acquired hyperspactral images: a comparison of statistical approaches. ISPRS Int. J. Geo Inf. 4, 2792–2820. doi: 10.3390/ijgi4042792
Cho, H., Seo, Y. W., Kumar Vijaya, B. V. K., and Rajkumar, R. (2014). “A multi-sensor fusion system for moving object detection and tracking in urban driving environments,” in IEEE Internation Conference on Robotics and Automation (ICRA) (Hong Kong), 1836–1843.
Clough, T. J., Kelliher, F. M., Sherlock, R. R., and Ford, C. D. (2004). Lime and soil moisture effects on nitrous oxide emissions from a urine patch. Soil Sci. Soc. Am. J. 68, 1600–1609. doi: 10.2136/sssaj2004.1600
Coffin, D. (2016). Decoding raw digital photos in Linux- DCRAW application. Available online at: http://www.cybercom.net/~dcoffin/draw/ (Accessed on 10 December, 2017)
Colombo, R., Bellingeri, D., Fasolini, D., and Marino, C. M. (2003). Retrieval of leaf area index in different vegetation types using high resolution satellite data. Remote Sens. Environ. 86, 120–131. doi: 10.1016/S0034-4257(03)00094-4
Cowan, N. J., Norman, P., Famulari, D., Levy, P. E., Reay, D. S., and Skiba, U. M. (2015). Spatial variability and hotspots of soil N2O fluxes from intensively grazed grassland. Biogeosciences 12, 1585–1596. doi: 10.5194/bg-12-1585-2015
De Klein, C. A. M., Novaa, R., Ogle, S., Smith, K., Rochette, P., Wirth, T., et al. (2006). IPCC Guidelines for National Greenhouse Gas Inventories. Volume 4 Chapter 11: N2O Emissions for Managed Soils, and CO2 Emissions Groom Like and Urea Application. Technical report 4-88788-032-4, Intergovernmental Panel on Climate Change (Bioscience 50).
De Klein, C. A. M., Shepherd, M. A., and van der Weerden, T. J. (2014). Nitrous oxide emissions from grazed grasslands: interactions between the N cycle and climate change: a New Zealand case study. Curr. Opin. Environ. Sustain. 9-10, 131–139. doi: 10.1016/j.cosust.2014.09.016
Dennis, S. J., Moir, J. L., Cameron, K. C., Di, H. J., Hennessy, D., and Richards, K. G. (2011). Urine patch distribution under dairy grazing at three stocking rates in Ireland. Irish J. Agric. Food Res. 50, 149–160. doi: 10.2307/41549248
Dennis, S. J., Moir, J. L., Cameron, K. C., Edwards, G. R., and Di, H. J. (2013). Measuring excreta patch distribution in grazed pasture through low-cost image analysis. Grass Forage Sci. 68, 378–385. doi: 10.1111/gfs.12000
Ducau, M. L., Simon, J. C., and Jacquet, A. (2003). PLant and environment interactions: fate of urine nitrogen in three soils throughout a grazing season. J. Environ. Qual. 1413, 1405–1413. doi: 10.2134/jeq2003.1405
Filippa, G., Cremonese, E., Migliavacca, M., Galvagno, M., Forkel, M., Wingate, L., et al. (2016). Agricultural and forest meteorology phenopix : a R package for image-based vegetation phenology. Agric. For. Meteorol. 220, 141–150. doi: 10.1016/j.agrformet.2016.01.006
Gupta, N., and Bhadauria, H. S. (2014). Object based information extraction from high resolution satellite imagery using eCognition. IJCSI Inter. J. Comp. Sci. 11, 139–144.
Hartigan, J. A., and Wong, M. A. (1979). Algorithm AS 136: a K-Means clustering algorithm. J. R. Stat. Soc. 28, 100–108.
Haynes, R., and Williams, P. (1993). Nutrient cycling and soil fertility in the grazed pasture ecosystem. Adv. Agron. 49, 119–199. doi: 10.1016/S0065-2113(08)60794-4
Hedley, C. (2014). The role of precision agriculture for improved nutrient management on farms. J. Sci. Food Agric. 95, 12–19. doi: 10.1002/jsfa.6734
Hoogendoorn, C. J., De Klein, C. A. M., Rutherford, A. J., Letica, S., and Devantier, B. P. (2008). The effect of increasing rates of nitrogen fertiliser and a nitrification inhibitor on nitrous oxide emissions from urine patches on sheep grazed hill country pasture. Austr. J. Exp. Agric. 48, 147–151. doi: 10.1071/EA07238
Hunt, E. R., Hively, W. D., Fujikawa, S. J., Linden, D., Daughtry, C. S., and McCarty, G. W. (2010). Acquisition of NIR-green-blue digital photographs from unmanned aircraft for crop monitoring. Remote Sens. 2, 290–305. doi: 10.3390/rs2010290
Hyde, B., Forrestal, P., Jahangir, M., Ryan, M., Fanning, A., Carton, O., et al. (2016). The interactive effects of fertiliser nitrogen with dung and urine on nitrous oxide emissions in grassland. Irish J. Agric. Food Res. 55, 1–9. doi: 10.1515/ijafr-2016-0001
Jain, A. K. (2010). Data clustering : 50 years beyond K-means. Pattern Recogn. Lett. 31, 651–666. doi: 10.1016/j.patrec.2009.09.011
Jensen, T., Apan, A., Young, F., and Zeller, L. (2007). Detecting the attributes of a wheat crop using digital imagery acquired from a low-altitude platform. Comp. Electron. Agric. 59, 66–77. doi: 10.1016/j.compag.2007.05.004
Jensen, T., Apan, A., Young, F., Zeller, L., and Cleminson, K. (2003). “Assessing grain crop attributes using digital imagery acquired from a low-altitude remote controlled aircraft,” in 2003 Spatial Sciences Institute Conference: Spatial Knowledge Without Boundaries (SSC2003) (Canberra, NSW: ACT), 1–11.
Jones, S. K., Famulari, D., Di Marco, C. F., Nemitz, E., Skiba, U. M., Rees, R. M., et al. (2011). Nitrous oxide emissions from managed grassland: a comparison of eddy covariance and static chamber measurements. Atmos. Meas. Tech. 4, 2179–2194. doi: 10.5194/amtd-4-1079-2011
Jones, S. K., Helfter, C., Anderson, M., Coyle, M., Campbell, C., Famulari, D., et al. (2017). The nitrogen, carbon and greenhouse gas budget of a grazed, cut and fertilised temperate grassland. Biogeosciences 1, 2069–2088. doi: 10.5194/bg-14-2069-2017
Kelliher, F. M., Cox, N., Van Der Weerden, T. J., De Klein, C. A. M., Luo, J., Cameron, K. C., et al. (2014). Statistical analysis of nitrous oxide emission factors from pastoral agriculture field trials conducted in New Zealand. Environ. Pollut. 186, 63–66. doi: 10.1016/j.envpol.2013.11.025
Krol, D. J., Carolan, R., Minet, E., McGeough, K. L., Watson, C. J., Forrestal, P. J., et al. (2016). Improving and disaggregating N2O emission factors for ruminant excreta on temperate pasture soils. Sci. Tot. Environ. 568, 327–338. doi: 10.1016/j.scitotenv.2016.06.016
Lopes, M., Fauvel, M., Ouin, A., and Girad, S. (2017). Spectro-temporal heterogeneity measures from dense high spatial resolution satellite image time series: application to Grassland species diversity estimation. Remote Sens. 9, 1–23. doi: 10.3390/rs9100993
Marriott, B. Y. A., Smith, M. A., and Baird, M. A. (1987). The effect of sheep urine on clover performance in a grazed upland sward. J. Agric. Sci. 177–185. doi: 10.1017/S0021859600081120
Marsden, K. A., Jones, D. L., and Chadwick, D. (2016). The urine patch diffusional area: an important N2O source? Soil Biol. Biochem. 92, 161–170. doi: 10.1016/j.soilbio.2015.10.011
Minet, E., Ledgard, S. F., Lanigan, G. J., Murphy, J. B., Hennessy, D., Lewis, E., et al. (2016). Mixing dicyandiamide (DCD) with supplementary feeds for cattle: an effective method to deliver a nitrification inhibitor in urine patches. Agric. Ecosyst. Environ. 231, 114–121. doi: 10.1016/j.agee.2016.06.033
Mirik, M., Michels, G. J. Jr., Kassymzhanova-mirik, S., Elliott, N. C., Catana, V., Jones, D. B., et al. (2006). Using digital image analysis and spectral reflectance data to quantify damage by greenbug (Hemitera: Aphididae) in winter wheat. Comp. Electron. Agric. 51, 86–98. doi: 10.1016/j.compag.2005.11.004
Misselbrook, T., Fleming, H., Camp, V., Umstatter, C., Duthie, C. A., Nicoll, L., et al. (2016). Automated monitoring of urination events from grazing cattle. Agric. Ecosyst. Environ. 230, 191–198. doi: 10.1016/j.agee.2016.06.006
Moir, J. L., Cameron, K. C., Di, H. J., and Fertsak, U. (2011). The spatial coverage of dairy cattle urine patches in an intensively grazed pasture system. J. Agric. Sci. 149, 473–485. doi: 10.1017/S0021859610001012
Mulla, D. J. (2012). Twenty five years of remote sensing in precision agriculture: Key advances and remaining knowledge gaps. Biosyst. Eng. 114, 358–371. doi: 10.1016/j.biosystemseng.2012.08.009
Pullanagari, R., Kereszturi, G., and Yule, I. (2016). Mapping of macro and micro nutrients of mixed pastures using airborne AisaFENIX hyperspectral imagery. J. Photogrammetry Remote Sens. 117, 1–10. doi: 10.1016/j.isprsjprs.2016.03.010
R Development Core Team (2016). R: A Language and Environment for Statistical Computing. Version 3.2.5 2016-04-14, Vienna.
Rasmussen, J., Ntakos, G., Nielsen, J., Svensgaard, J., Poulsen, R. N., and Christensen, S. (2016). Are vegetation indices derived from consumer-grade cameras mounted on UAVs sufficiently reliable for assessing experimental plots? Eur. J. Agron. 74, 75–92. doi: 10.1016/j.eja.2015.11.026
Rastner, P., Bolch, T., Natarnicola, C., and Paul, F. (2014). “A comparison of pixel- and object-based glacier classification with optical satellite images,” in IEEE Journal of Selected Topic Applied Earth Observations and Remote Sensing, Vol. 7, doi: 10.1109/JSTARS.2013.227.4668
Roten, R. L., Fourie, J., Owens, J. L., Trethewey, J. A. K., Ekanayake, D. C., Werner, A., et al. (2017). Urine patch detection using LiDAR technology to improve nitrogen use efficiency in grazed pastures. Comp. Electron. Agric. 135, 128–133. doi: 10.1016/j.compag.2017.02.006
Sammouda, R., Adgaba, N., Touir, A., and Al-ghamdi, A. (2014). Computers in Human Behavior Agriculture satellite image segmentation using a modified artificial Hopfield neural network. Comp. Hum. Behav. 30, 436–441. doi: 10.1016/j.chb.2013.06.025
Schindelin, J., Arganda-carreras, I., Frise, E., Kaynig, V., Pietzsch, T., Preibisch, S., et al. (2013). Fiji - an Open Source platform for biological image analysis. Natl. Inst. Health Methods 9, 1–15. doi: 10.1038/nmeth.2019
Selbie, D. R., Buckthought, L. E., and Shepherd, M. A. (2015). The challenge of the urine patch for managing nitrogen in grazed pasture systems. Adv. Agron. 129, 229–292. doi: 10.1016/bs.agron.2014.09.004
Singh, V., and Misra, A. K. (2017). Detection of plant leaf diseases using image segmentation and soft computing techniques. Inform. Process. Agric. 4, 41–49. doi: 10.1016/j.inpa.2016.10.005
Stoorvogel, J., Kooistra, L., and Bouma, J. (2015). “Chapter 2: Managing soil variability at different spatial scales as a basis for precision agriculture,” in Soil Specific Farming: Precision Agriculture, Advances in Soil Science, eds R. Lal and B. Stewart (Boca Raton, FL: CRC Press Taylor Francis Group), 37–72.
Strobl, J., Piorecky, M., and Krajca, V. (2017). Methods for automatic estimation of the number of clusters for K-means algorithm used on EGG signal: feasibility study. Clin. Technol. 47, 81–87. Available online at: https://ojs.cvut.cz/ojs/index.php/CTJ/article/view/4474
Von Bueren, S. K., Burkart, A., Hueni, A., Rascher, U., Tuohy, M. P., and Yule, I. J. (2015). Deploying four optical UAV-based sensors over grassland: challenges and limitations. Biogeosciences 12, 163–175. doi: 10.5194/bg-12-163-2015
Ward, J. (1963). Hierarchical grouping to optimize and objective function. J. Am. Stat. Assoc. 58, 236–244.
Williams, P., and Haynes, R. (1995). Effect of sheep, deer and cattle dung in herbage production and soil nutrient content. Grass Forage Sci. 50, 263–271.
Williams, R. H., and Haynes, R. J. (1994). Comparison of initial wetting pattern, nutrient concentrations in soil solution and the fate of 15N-labelled urine in sheep and cattle urine patch areas of pasture soil. Plant Soil 162, 49–59. doi: 10.1007/BF01416089
Zha, Y., Gao, J., and Ni, S. (2001). Use of normalized di ff erence built-up index in automatically mapping urban areas from TM imagery. Remote Sens. 24, 583–594. doi: 10.1080/01431160304987
Keywords: RPAS, UAV, image analysis, feature detection, urine, nitrous oxide, grassland
Citation: Maire J, Gibson-Poole S, Cowan N, Reay DS, Richards KG, Skiba U, Rees RM and Lanigan GJ (2018) Identifying Urine Patches on Intensively Managed Grassland Using Aerial Imagery Captured From Remotely Piloted Aircraft Systems. Front. Sustain. Food Syst. 2:10. doi: 10.3389/fsufs.2018.00010
Received: 01 February 2018; Accepted: 05 April 2018;
Published: 25 April 2018.
Edited by:
Tom Misselbrook, Rothamsted Research (BBSRC), United KingdomReviewed by:
Paul Harris, Rothamsted Research (BBSRC), United KingdomHarald Menzi, Federal Office for the Environment, Switzerland
Copyright © 2018 Maire, Gibson-Poole, Cowan, Reay, Richards, Skiba, Rees and Lanigan. This is an open-access article distributed under the terms of the Creative Commons Attribution License (CC BY). The use, distribution or reproduction in other forums is permitted, provided the original author(s) and the copyright owner are credited and that the original publication in this journal is cited, in accordance with accepted academic practice. No use, distribution or reproduction is permitted which does not comply with these terms.
*Correspondence: Juliette Maire, Juliette.Maire@sruc.ac.uk