Using 3D Imaging and Machine Learning to Predict Liveweight and Carcass Characteristics of Live Finishing Beef Cattle
 Gemma A. Miller1*
  James J. Hyslop2 David Barclay3 Andrew Edwards4 William Thomson5
  Carol-Anne Duthie1
- 1Future Farming Systems, Scotland's Rural College, Edinburgh, United Kingdom
- 2SAC Consulting Ltd., SRUC, Edinburgh, United Kingdom
- 3Innovent Technology Ltd., Turriff, United Kingdom
- 4Ritchie Ltd., Forfar, United Kingdom
- 5Harbro Ltd., Turriff, United Kingdom
Selection of finishing beef cattle for slaughter and evaluation of performance is currently achieved through visual assessment and/or by weighing through a crush. Consequently, large numbers of cattle are not meeting target specification at the abattoir. Video imaging analysis (VIA) is increasingly used in abattoirs to grade carcasses with high accuracy. There is potential for three-dimensional (3D) imaging to be used on farm to predict carcass characteristics of live animals and to optimise slaughter selections. The objectives of this study were to predict liveweight (LW) and carcass characteristics of live animals using 3D imaging technology and machine learning algorithms (artificial neural networks). Three dimensional images and LW's were passively collected from finishing steer and heifer beef cattle of a variety of breeds pre-slaughter (either on farm or after entry to the abattoir lairage) using an automated camera system. Sixty potential predictor variables were automatically extracted from the live animal 3D images using bespoke algorithms; these variables included lengths, heights, widths, areas, volumes, and ratios and were used to develop predictive models for liveweight and carcass characteristics. Cold carcass weights (CCW) for each animal were provided by the abattoir. Saleable meat yield (SMY) and EUROP fat and conformation grades were also determined for each individual by VIA of half of the carcass. Performance of prediction models was assessed using R2 and RMSE parameters following regression of predicted and actual variables for LW (R2 = 0.7, RMSE = 42), CCW (R2 = 0.88, RMSE = 14) and SMY (R2 = 0.72, RMSE = 14). The models predicted EUROP fat and conformation grades with 54 and 55% accuracy (R2), respectively. This study demonstrated that 3D imaging coupled with machine learning analytics can be used to predict LW, SMY and traditional carcass characteristics of live animals. This system presents an opportunity to reduce a considerable inefficiency in beef production enterprises through autonomous monitoring of finishing cattle on the farm and marketing of animals at the optimal time.
Introduction
In 2017, 51% of prime beef carcasses in the UK did not meet target fat and conformation grades: 40% had poor conformation and 15% were too fat (AHDB, 2018a). The cost to UK producers of sending over-finished cattle to slaughter has been estimated at £8.8 million per year (AHDB, 2018b). For example Roehe et al. (2013) estimated that for an increase in EUROP grade from R4L to R4H for an intensively fed steer of a medium sized breed, a loss of £11.37 would be made in feeding costs alone. Furthermore, processors set weight limits on carcasses and penalise producers for sending overweight cattle, despite them being otherwise to specification. Sending cattle to slaughter too lean equally results in a loss due to the lower price paid for the carcass. Identifying the optimum slaughter point to meet market specifications for beef cattle has economic benefits (Roehe et al., 2013), and reduces the environmental impact of cattle production (de Vries and de Boer, 2010). Therefore, to improve sustainability in the beef production sector it is important for farmers to be able to predict carcass value in the live animal.
Some equations exist for the prediction of carcass characteristics in live animals (Realini et al., 2001; Greiner et al., 2003; Afolayan et al., 2006; Lambe et al., 2008; Minchin et al., 2009; Pogorzelska-Przybylek et al., 2014) but they generally rely on obtaining manual measurements of body dimensions, body condition or tissue depth using ultrasound scanners. Obtaining these measurements is time consuming, may require a level of training and skill, and they can be stressful and potentially dangerous for both animals and handlers.
As imaging technologies become more advanced and affordable it is now economically feasible to implement them on commercial farms. Ozkaya et al. (2016) demonstrated that body measurements of cattle (body length, wither height, chest depth. and hip height) can be accurately determined from 2-dimensional (2D) digital image analysis (90–98% accuracy). Applications for 2D imaging have included estimating liveweight (LW) of broiler chickens (Mollah et al., 2010), pigs (Kashiha et al., 2014; Wongsriworaphon et al., 2015; Shi et al., 2016) and beef cattle (Ozkaya et al., 2016), and LW (Tasdemir et al., 2011), body condition score (Bewley et al., 2008), and lameness (Viazzi et al., 2014) in dairy cows.
Using both Limousin or Aberdeen Angus crossbred steers managed under typical UK conditions Hyslop et al. (2008, 2009) used 2D digital imaging to estimate LW and carcass characteristics. Successful prediction of slaughter parameters included LW (R2 = 0.81, RMSE = 15.7); cold carcass weight (CCW) (R2 = 0.81, RMSE = 10.4); killing out proportion (R2 = 0.91, RMSE = 5.3), sirloin weight (R2 = 0.58, RMSE = 2.1) and proportions (R2 = 0.61, RMSE = 5.1) along with fat (R2 = 0.81) and conformation (R2 = 0.81) gradings.
Advances in imaging technology have allowed for the use of three-dimensional (3D) imaging in the livestock sector with applications in estimating LW (Mortensen et al., 2016) and lying behaviour (Aydin, 2017) in broiler chickens and body condition scoring (Weber et al., 2014; Fischer et al., 2015; Kuzuhara et al., 2015), LW (Kuzuhara et al., 2015), milking traits (Kuzuhara et al., 2015), and lameness (Van Hartem et al., 2014; Viazzi et al., 2014) in dairy cows. 3D imaging is also successfully used in estimating LW in pigs (Wang et al., 2008). There are no known reports where 3D imaging has been applied in estimating both LW and carcass characteristics of beef cattle.
Whilst multiple 2D cameras have been investigated (Hyslop et al., 2009), it was concluded that a “top down” camera view rather than the addition of side and rear view 2D cameras was sufficient for accurate prediction. Application of a 3D camera suspended above the animal would extend the range of potential “top down” predictor variables and refine prediction models further, with the continued advantage of equipment being kept away from animals and potential damage as well as being accessible for both installation and maintenance.
Increasingly, video image analysis (VIA) is being used to grade carcasses in the abattoir, improving the consistency of grading by removing subjective differences in visual assessment by trained graders (Craigie et al., 2012). However, many producers still subjectively select animals for slaughter by visual assessment of fat and condition score and by weighing manually through a crush. This is a clear inefficiency in the beef market. 3D imaging technology has the potential to provide predictions of carcass characteristics from live animals on farm, allowing farmers to send cattle to slaughter as soon as they are within the parameters specified by the abattoir. Having more animals slaughtered within specification increases the profit to the producer, improves the uniformity of the products produced for down-stream customers and reduces the environmental impact per kg of product produced (i.e., lower greenhouse gas emissions and reduced water use).
The objectives of this study were to use live animal body measurements automatically extracted from 3D images to build machine learning algorithms to predict LW and carcass characteristics of finishing beef cattle.
Methods
Ethics Statement
The animal trials described below were approved by the Animal Experiment Committee of SRUC and were conducted in accordance with the requirements of the UK Animals (Scientific Procedures) Act 1986.
Measurements—Live Animals
The 3D cameras used were Basler Time-of-Flight near infra-red cameras (Basler Inc., Exton, PA). The camera specifications are as follows: 640 × 480 pixels, 20 frames per second, 57° horizontal × 43° vertical angular field of view, accuracy of +/– 1 cm. Eighteen measurements (5 widths, 6 lengths, 5 heights, and 2 diagonals, Figure 1) were extracted from each 3D image and 20 ratios, 11 areas, and 11 volumes were calculated, giving a total of 60 potential predictor variables available for evaluation. Measurements were extracted in real time from 3D images using algorithms developed by Innovent Technology Ltd. using Halcon software (MVTec Software GmbH, München, Germany).
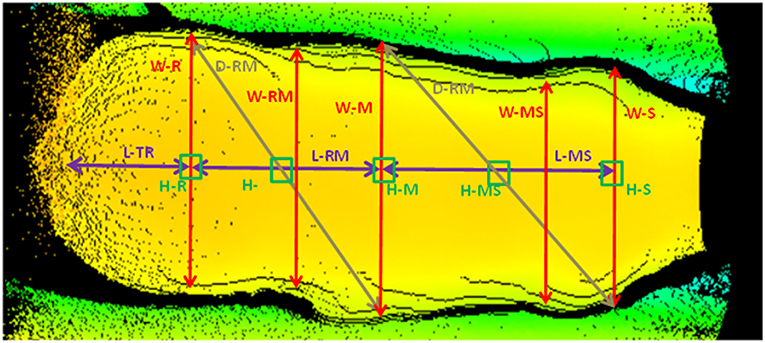
Figure 1. Measurements acquired from 3D images. W, width; L, length; D, diagonal; H, height; S, shoulder; M, middle; R, rump, T, tail.
Live animal data was gathered from a range of sources: including both commercial and research farms and from an abattoir lairage.
Farm Trials
Five automatic Beef Monitor weigh crates (Ritchie Ltd, Turriff, UK) fitted with Tru-test weigh heads and electronic ID (EID) readers (Tru-Test Corporation Ltd., Auckland, New Zealand) were installed on four commercial finishing units throughout Scotland and two were installed at SRUC's Beef Research Centre near Edinburgh. The crates were the sole water source for up to 50 steers or heifers in group pens. All animals behind the system were allocated low frequency EID ear tags to allow individual identification and automated weight recording. Three dimensional cameras were suspended from custom made frames 3 m above each crate. Liveweight and 3D images were recorded at every visit to the water trough. Variables were automatically linked to the EID and LW recorded by the Beef Monitor crate and immediately uploaded to a database. Data extracted from images which had poor animal outlines (determined visually) or where the automatically calculated variables were 0 (i.e., a height, width etc. cannot be 0) were removed from the analysis. Poor outlines were generally caused by strong direct sunlight below the camera, a second animal's head against the rear of the animal being measured or the animal leaning against the side of the crate or race. Across the five farms, 17127 LWs were collected from 674 animals (see Table 1 for a breakdown of sexes and breeds).
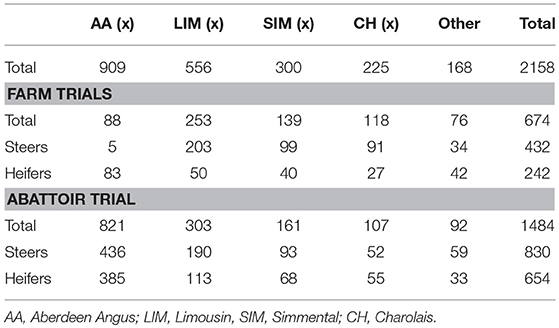
Table 1. Summary of cattle used in the development of liveweight prediction algorithms.
Abattoir Trial
A ten day data collection trial was undertaken in a commercial abattoir in Scotland. This allowed a large number of individual animal data points from a variety of breeds, sexes, and animal types with a range of conformation and fat grades to be obtained rapidly. A weigh platform was placed between two sliding gates in the race leading up to the stun box and a 3D camera was secured 3 m above the platform. This allowed individual animals to be held for a short time immediately pre-slaughter to record UKID and LW and to capture a 3D image. Liveweights and clear images were recorded for 1,484 beef animals. A summary of animal numbers by breed and sex are shown in Table 1.
Measurements—Slaughter Data
Cattle were stunned by captive bolt, exsanguinated and their hides were removed. Carcasses were split down the midline and dressed as per normal abattoir practice. Conformation class and fatness class were visually assessed for each carcass by trained abattoir staff (according to the abbreviated EUROP grid commonly used in UK abattoirs). VIA technology (VBS 2000, E+V GmbH, Germany) was operated on-line to predict fat and conformation grades on both the 15 point scale and the EUROP grid (7 fat and 8 conformation grades). Cold carcass weight, saleable meat yield (SMY) estimated by VIA along with visually assessed EUROP fat and conformation grades were provided by the abattoir. Carcass characteristics data for a total of 1649 carcases from both the abattoir and on-farm trial datasets were matched to clear pre-slaughter 3D images, see Table 2 for a breakdown of breeds and sexes.
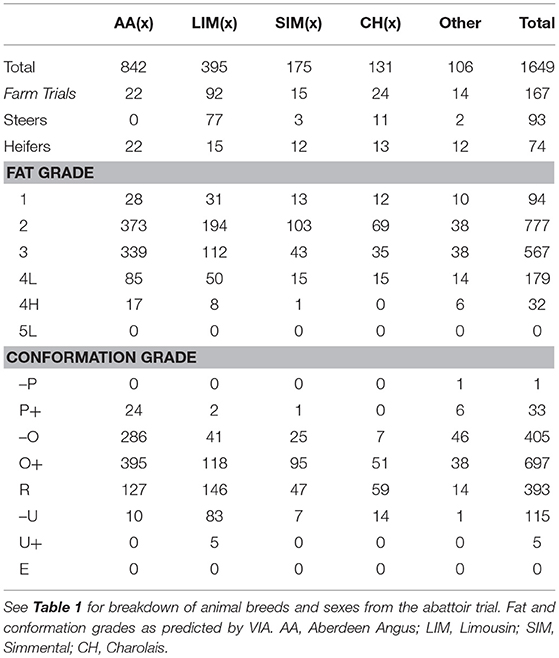
Table 2. Summary of cattle used in the development of carcass characteristics prediction algorithms.
Statistical Analysis and Development of Predictive Models
Data from all abattoir and on-farm sources were combined into one dataset. For the LW predictions the abattoir data consisted of a single LW per animal taken immediately pre-slaughter. The commercial and SRUC on-farm trial data consisted of multiple weights per animal across the finishing period. For the fat grade, conformation grade, CCW and SMY predictions, only the final LW recorded in the beef monitor crates on farms was used alongside the LWs collected in the abattoir trial. No 5L or 5H fat grades and no E and insufficient U+ conformation grades (n = 5) were recorded and so these grades could not be included in the prediction model. A summary of the breeds, sexes, fat grades and conformation grades are shown in Table 2.
Sex was included as a factor in the model. Cattle were categorised as either native type (smaller, quick finishing breeds such as Aberdeen Angus) or continental type (larger breeds such as Charolais) (see Supplementary Table 1 for categorisation of breeds), and this was also included as a factor in the model. From the commercial farm trials, the final measured LW from the weigh crate was included as a predictor variable for carcass characteristics.
Artificial neural networks (ANNs) were selected for this study as they can be used for both regression and classification problems and are capable of handling complex non-linear relationships between large numbers of variables. ANNs comprise a framework of “neurons” which are connected by weighted links (Agatonovic-Kustrin and Beresford, 2000). ANNs can be used for regression and classification problems and have many applications in financial forecasting, machine vision, game theory, medicine and ecology to name only a few. ANNs were developed using the caret package in R (version 3.4.1, R Core Team, 2017). To optimise neural network training, continuous input variables were standardised using a Gaussian transformation (subtracting the mean and dividing by one standard deviation) and min-max scaling between −0.9 and 0.9. The data was then randomly split into training (70%) and validation (30%) subsets.
In this study ANNs were developed through supervised training by backward propagation. The model was presented with the training set and known target values. Weights and biases were automatically randomly initialised to non-zero values (between 1 and −1) by the ANN software and during the training phase the model adjusted the weighted connections by feeding back the error and optimising the weights to decrease the difference between target and output values. Repeated training iterations (three repeats of 10-fold repeated cross validation) further reduced the model error. Models were regularised to prevent overfitting to the training data subset by applying a penalty (a weight decay value) to weights which became relatively much larger than others in the model. Parameter estimation (model size and weight decay values) were optimised after testing 100 potential models (10 possible values per parameter). Several topographies (number of hidden layers and nodes in each layer) were tested for each ANN. The topography which produced the best performance results without overfitting to the training data sub-sets was selected for each ANN. All of the ANNs had one hidden layer with five nodes, except the fat grade classification ANN which only had one node in the hidden layer. The model was then tested on the validation data subset. Model performance was assessed by R2 and RMSE for regression (LW, CCW, and SMY). Classification accuracy for fat and conformation grades were assessed by way of confusion matrices. A confusion matrix is a table summarising the number of validation sub-set data points in each class and the predicted classes, and the sensitivity (Equation 1) and specificity (Equation 2) for each class.
Where for any class (x), a true positive is a data point that is correctly predicted to be within class x, a false negative is a data point incorrectly predicted to not be in class x, a true negative is a data point which is correctly predicted to not be in class x and a false positive is a data point which is incorrectly predicted to be in class x.
Stepwise linear regression models were also created for the continuous variables (LW, CCW, and SMY) using the same training and validation data subsets as were used to create the ANNs and were cross validated using the same method. Summary results (R2 and RMSE) are reported alongside the ANN results.
Finally, the importance of each predictor variable to the overall ANN was assessed using the VarImp function in R. This function calculates the influence each input variable has on the output by using the connection weight between the input and each hidden neuron and apportioning the connection weights between each hidden neuron and the output between each input variable (based on the method described in Gevrey et al., 2003). Connection weights are analogous to coefficients in a linear model (although the number of connection weights in an ANN is excessive compared to coefficients in a linear model) and so dictate the influence any variable has on the hidden nodes and ultimately on the output e.g., variables with low weights are suppressed and so have little importance and those with large weights are influential and have high importance. Variable importance was scaled from 100 to 0 with 100 being the predictor variable with the highest calculated influence and 0 being redundant. The following calculations below are quoted from Gevrey et al. (2003).
1. For each hidden neuron, divide the absolute value of the input-hidden layer connection weight by the sum of the absolute value of the input-hidden layer connection weight of all input neurons, i.e.,
For h = 1 to nh, and for i = 1 to ni
2) For each input neuron i, divide the sum of the Qih for each hidden neuron by the sum for each hidden neuron of the sum for each input neuron of Qih, multiply by 100. The relative importance of all output weights attributable to the given input variable is then obtained.
For i = 1 to ni
Where Q is the proportional influence an input neuron has on a hidden neuron, h is a hidden neuron, i is an input neuron, W is a weight and RI is the relative influence of an input neuron (%).
Results and discussion
3D Image Collection
A total of 18,134 3D images were collected during this trial. Of the 16,100 3D images collected on commercial and research farms 1,292 (8%) of images were removed due to a poor outline being obtained. From the abattoir trial 550 of 2,034 3D images (27%) were removed from the analysis. The more stressful environment in the abattoir lairage led to a higher proportion of 3D images being removed from the analysis. Animals were more likely to be agitated and so a good quality 3D image was difficult to obtain. Removal of images from the on-farm data sets is not deemed to be a concern for commercial implementation as multiple images are collected per animal per day; therefore not all images of each individual animal are required to provide a prediction to the end user.
Prediction of Liveweight, Cold Carcass Weight, and Saleable Meat Yield
Pre-slaughter LW's ranged from 341 to 774 kg and the mean weight at slaughter was 608 ± 57 kg. The mean CCW was 339 ± 39 kg and mean SMY was 223 ± 32 kg.
In this study LW was predicted for a wide variety of breeds, both steers and heifers, with an R2 of 0.70 (RMSE = 42, n = 4443, Figure 2). The performance of the stepwise linear regression for LW was much poorer than the ANN (R2 = 0.54, RMSE = 51). Ozkaya et al. (2016) used multiple linear regression of measurements extracted from lateral 2D digital images of Limousin cattle to predict LW with an R2 of 0.89. Although sex and breed type had low importance (3 and 0, respectively, Table 3), to investigate the performance of sex and breed specific models the ANN was trained only using the Aberdeen Angus steers data subset (n = 441, Table 1). The model performance increased to R2 = 0.77 (RMSE = 37), suggesting that the further development of this system may benefit from breed and sex specific models. As LW had the highest importance (100) for the prediction of CCW, SMY and fat grade, and the importance of sex (CCW: 51, SMY: 29, conformation grade: 1, fat grade: 11) and breed type (CCW: 32, SMY: 15, conformation grade: 18, fat grade: 32) are generally of higher importance for prediction of carcass characteristics (Table 3), breed and sex specific LW models should also improve prediction of these carcass characteristics.
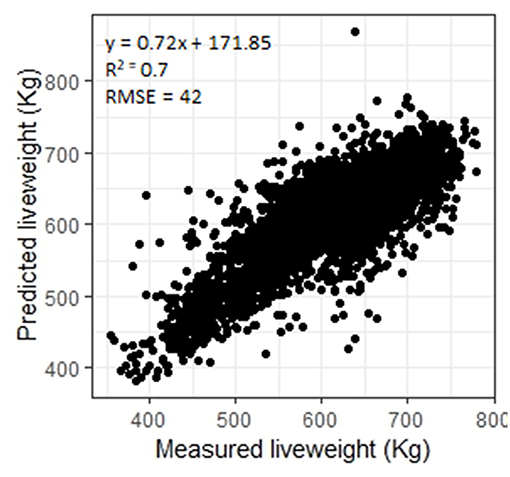
Figure 2. Measured liveweights plotted against liveweights predicted using an artificial neural network.
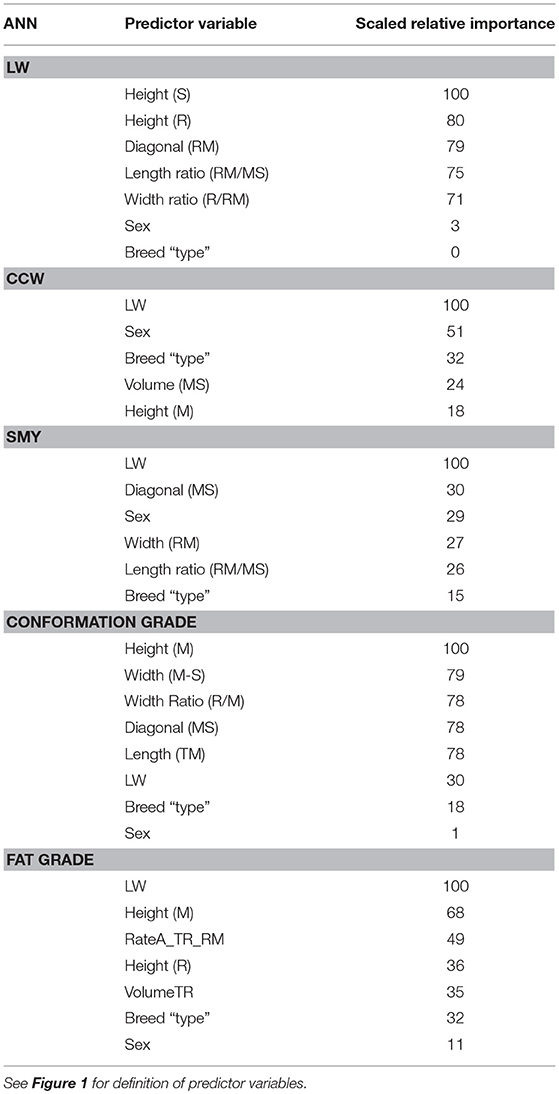
Table 3. Relative importance (scaled from 100 to 0 where 100 is most influential in the model and 0 is redundant) of the 5 predictor variables with highest influence [and liveweight (LW), sex and breed type if not already included], for each ANN.
Carcasses which are over a defined weight face a penalty at the abattoir. Being able to predict CCW in the live animal would allow producers to ensure that animals are sent to slaughter before they grow beyond the weight limit. The ANN predicted CCW with R2 = 0.88 (RMSE = 14, n = 449, Figure 3) and SMY with R2 = 72 (RMSE = 14, n = 448, Figure 4). The stepwise linear regression models predicted CCW with R2 = 0.83 (RMSE = 16) and SMY with R2 of 0.63 (RMSE = 16). LW was of most importance in the ANNs for CCW and SMY in this study (Table 3). LW has previously been shown to have a strong linear relationship with CCW (Minchin et al., 2009), hot carcass weight (Pogorzelska-Przybylek et al., 2014), and SMY (Realini et al., 2001; Greiner et al., 2003). However, predictor variables extracted from the 3D images still had significant influence over the ANN model outputs (Table 3), and the ANNs had improved performance over the stepwise linear regression models. Greiner et al. (2003) found that when LW was used as a single predictor for SMY their regression model had an R2 of 0.66 for a more limited range of animals (534 cross-bred steers) than used in the present study, demonstrating the potential of 3D imaging to provide more accurate predictions of carcass characteristics.
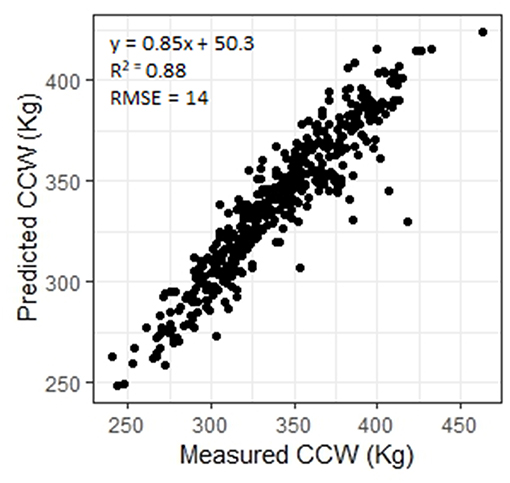
Figure 3. Measured cold carcass weight (CCW) plotted against CCW predicted using an artificial neural network.
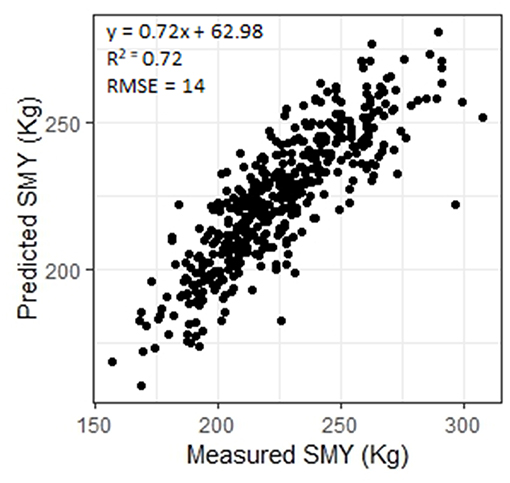
Figure 4. Measured saleable meat yield (SMY) plotted against SMY predicted using an artificial neural network.
Prediction of Fat and Conformation Grades
Farmers in the UK are currently paid for their animals on both carcass weight and fat and conformation grades. ANNs were developed for fat and conformation grade using the abbreviated EUROP scale in operation at the abattoir. The accuracy of the classification ANNs for the validation data subset were 54.2% for fat grade and 55.1% for conformation grade. The confusion matrices are shown for the fat (Table 4) and conformation grades (Table 5), along with the sensitivity (ability of the model to correctly classify a data point to that particular grade) and specificity (ability of the model to correctly identify a data point as not belonging to that particular grade) of the model to each grade.
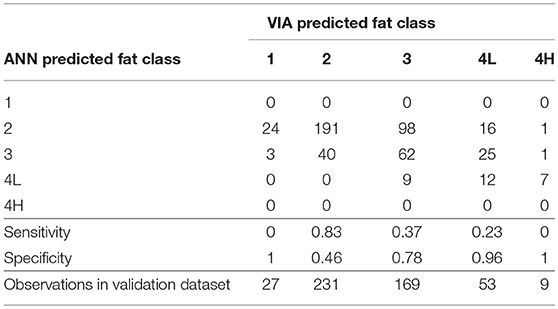
Table 4. Confusion matrix for the fat grade classification artificial neural network and the sensitivity and specificity of the model to each grade.
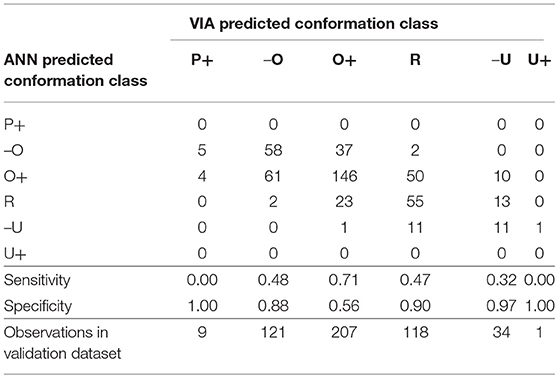
Table 5. Confusion matrix for the conformation grade classification artificial neural network and the sensitivity and specificity of the model to each grade.
The majority of carcasses were classed as fat grade 2 (47%) or 3 (34%) (Table 2). The fat grade model had a sensitivity of 0.83 for grade 2, but a specificity of 0.46 (Table 4). This low specificity was due to the tendency of the algorithm to classify the grade 3 carcasses as grade 2. The model classified all of the grade 1 carcasses in the validation subset as grade 2 and most of the 4H carcasses as 4L. It did not correctly classify to either grade 1 or 4H (sensitivity equal to 0, Table 4), this was likely due to there being insufficient data points in the training set for these two grades. The specificity of the conformation grade classification ANN model to both P+ and U+ was 1 (Table 5). There were also only a small number of data points collected for carcases of these grades. There was a tendency for the model to classify the O- and R carcases as O+ (O+ had a specificity of 0.56), likely due to the relatively large number of data points in the training data set which were grade O+. It is anticipated that increasing the number of data points in the less desirable grades would improve the predictive performance of these models.
Lambe et al. (2010) used ultrasound measurements of tissue depth in live finishing beef steers and heifers to predict conformation and fat grades using linear regression. The predictions in their study were slightly more accurate (R2 = 0.60) for fat grade and similar (R2 = 0.56) for conformation class than in the present study, however their models performed poorly on validation data sets (fat class: R2 = 0.39–0.46, conformation class: R2 = 0.07–0.24). SMY has also been successfully (R2 = 0.80) predicted using similar ultrasound measurements (Realini et al., 2001). No literature could be found where a classification model had been used to predict fat and conformation grade of beef carcases. The advantage of a 3D imaging system over manual measurements such as ultrasound are the reduction in stress caused by handling of animals and the automated system can passively provide multiple estimates per animal per day at minimal cost.
In this study LW was found to be the most important predictor of fat grade (weighted importance of 100, Table 3), and was less important, but not redundant (weighted importance of 30) for conformation grade. Minchin et al. (2009) found that LW was not a significant predictor of fat or conformation grade for cull cows from either dairy or beef sired lines. This is likely due to the generally lower body condition and fat cover of cull cows compared to finished beef heifers and steers.
Conclusions
This study has shown that there is potential to use 3D imaging technology to automate the process of selecting cattle for slaughter at the correct specification, so improving the efficiency and profitability of beef enterprises through marketing of animals at the optimal time. Further work to improve the prediction of fat and conformation grades in the live animal is required. Particularly more data needs to be collected from animals with carcass grades out with the desirable target grades. Addressing this imbalance of carcass grades in the dataset will allow the model to better distinguish between grades. Further development of this technology also requires the development of breed and sex specific algorithms for LW and carcass characteristics.
Ethics Statement
The animal trials described below were approved by the Animal Experiment Committee of SRUC and were conducted in accordance with the requirements of the UK Animals (Scientific Procedures) Act 1986.
Author Contributions
C-AD, JJH, WT, DB, and AE conceived and designed the project. GAM, DB, WT, and AE collected the data. GAM and JJH processed the data. GAM analysed the data. GAM and C-AD prepared the manuscript which was reviewed by all authors.
Funding
This research was funded by Innovate UK (Grant No. 101812).
Conflict of Interest Statement
DB was an employee of Innovent Technology Ltd., AE was an employee of Ritchie Ltd., and WT was an employee of Harbro Ltd.
The remaining authors declare that the research was conducted in the absence of any commercial or financial relationships that could be construed as a potential conflict of interest.
Acknowledgments
The authors would like to thank Innovate UK who funded this project. This work was undertaken in partnership with Innovent Technology Ltd., Harbro Ltd., and Ritchie Ltd. The authors are grateful for the assistance of the technical team at SRUC. The abattoir trial would not have been possible without the help and cooperation of the abattoir staff. Images from VIA were processed by E+V. We are also very grateful to the commercial beef finishers who allowed us to conduct trials on their farms. SRUC are funded by the Scottish Government through the Strategic Research Programme of the Scottish Government's Rural and Environment Science and Analytical Services Division (RESAS).
Supplementary Material
The Supplementary Material for this article can be found online at: https://www.frontiersin.org/articles/10.3389/fsufs.2019.00030/full#supplementary-material
References
Afolayan, R. A., Adeyinka, I. A., and Lakpini, C. A. M. (2006). The estimation of live weight from body measurements in Yankasa sheep. Czech J. Anim. Sci. 8, 343–348. doi: 10.17221/3948-CJAS
Agatonovic-Kustrin, S., and Beresford, R. (2000). Basic concepts of artificial neural network (ANN) modelling and its application in pharmaceutical research. J. Pharmac. Biomed. Anal. 22, 717–727. doi: 10.1016/S0731-7085(99)00272-1
Aydin, A. (2017). Using 3D vision camera system to automatically assess the level of inactivity in broiler chickens. Comput. Electr. Agri. 135, 4–10. doi: 10.1016/j.compag.2017.01.024
Bewley, J. M., Peacok, A. M., Lewis, O., Boyce, R. E., Roberts, D. J., Coffey, M. P., et al. (2008). Potential for estimation of body condition scores in dairy cattle from digital images. J. Dairy Sci. 91, 3439–3453. doi: 10.3168/jds.2007-0836
Craigie, C. R., Navajas, E. A., Purchas, R. W., Maltin, C. A., Bünger, L., Hoskin, S. O., et al. (2012). A review of the development and use of video image analysis (VIA) for beef carcass evaluation as an alternative to the current EUROP system and other subjective systems. Meat Sci. 92, 307–318. doi: 10.1016/j.meatsci.2012.05.028
de Vries, M., and de Boer, I. J. M. (2010). Comparing environmental impacts for livestock products: a review of life cycle assessments. Livestock Sci. 128, 1–11. doi: 10.1016/j.livsci.2009.11.007
Fischer, A., Luginbühl, T., Delattre, L., Delouard, J. M., and Faverdin, P. (2015). Rear shape in 3 dimensions summarized by principal component analysis is a good predictor of body condition score in Holstein dairy cows. J. Dairy Sci. 98, 4465–4476. doi: 10.3168/jds.2014-8969
Gevrey, M., Dimopoulos, I., and Lek, S. (2003). Review and comparison of methods to study the contribution of variables in artificial neural network models. Ecol. Model. 160, 249–264. doi: 10.1016/S0304-3800(02)00257-0
Greiner, S. P., Rouse, G. H., Wilson, D. E., Cundiff, L. V., and Wheeler, T. L. (2003). Prediction of retail product weight and percentage using ultrasound and carcass measurements in beef cattle. J. Anim. Sci. 81, 1736–1742. doi: 10.2527/2003.8171736x
Hyslop, J. J., Ross, D. W., Schofield, C. P., Navajas, E., Roehe, R., and Simm, G. (2008). “An assessment of the potential for live animal digital image analysis to predict the slaughter liveweights of finished beef cattle,” in Proceedings of the British Society of Animal Science, 2008, Abstract 050.
Hyslop, J. J., Ross, D. W., Schofield, C. P., Navajas, E., Roehe, R., and Simm, G. (2009). “Predicting the slaughter characteristics of finished beef cattle using a live animal digital image analysis system under typical on-farm management conditions,” in Proceedings of the British Society of Animal Science, 2009, Abstact 139.
Kashiha, M., Bahr, C., Ott, S., Moons, C. P. H., Niewold, T. A., Ödberg, F.O., et al. (2014). Automatic weight estimation of individual pigs using image analysis. Comput. Electr. Agric. 107, 38–44. doi: 10.1016/j.compag.2014.06.003
Kuzuhara, Y., Kawamura, K., Yoshitoshi, R., Tamaski, T., Sugai, S., Ikegami, M., et al. (2015). A preliminary study for predicting body weight and milk properties in lactating Holstein cows using a three-dimensional camera system. Comput. Electr. Agric. 111, 186–193. doi: 10.1016/j.compag.2014.12.020
Lambe, N. R., Navajas, E. A., Schofield, C. P., Fisher, A. V., Simm, G., Roehe, R., et al. (2008). The use of various live animal measurements to predict carcass and meat quality in two divergent lamb breeds. Meat Sci. 80, 1138–1149. doi: 10.1016/j.meatsci.2008.05.026
Lambe, N. R., Ross, D. W., Navajas, E. A., Hyslop, J. J., Prieto, N., Craigie, C., et al. (2010). The prediction of carcass composition and tissue distribution in beef cattle using ultrasound scanning at the start and/or end of the finishing period. Livestock Sci. 131, 193–202. doi: 10.1016/j.livsci.2010.03.019
Minchin, W., Buckley, F., Kenny, D. A., Keane, M. G., Shalloo, L., and O'Donovan, M. (2009). Prediction of cull cow carcass characteristics from live weight and body condition score measured pre slaughter. J. Agric. Food Res. 48, 75–86.
Mollah, B. R., Hassan, A., Salam, A., and Ali, A. (2010). Digital image analysis to estimate the live weight of broiler. Comput. Electr. Agric. 72, 48–52. doi: 10.1016/j.compag.2010.02.002
Mortensen, A. K., Lisouski, P., and Ahrendt, P. (2016). Weight prediction of broiler chickens using 3D computer vision. Comput. Electr. Agric. 123, 319–326. doi: 10.1016/j.compag.2016.03.011
Ozkaya, S., Neja, W., Krezel-Czopek, S., and Oler, A. (2016). Estimation of bodyweight from body measurements and determination of body measurements on Limousin cattle using digital image analysis. Anim. Product. Sci. 56, 2060–2063. doi: 10.1071/AN14943
Pogorzelska-Przybylek, P., Nogalski, Z., Wielgosz-Groth, Z., Winarski, R., Sobezuk-Szul, M., Łapińska, P., et al. (2014). Prediction of the carcass value of young Holstein-Friesian bulls based on live body measurements. Ann. Anim. Sci. 14, 429–439. doi: 10.2478/aoas-2014-0004
(2017). R: A Language and Environment for Statistical Computing. Vienna: R Foundation for Statistical Computing.
Realini, C. E., Williams, R. E., Pringle, T. D., and Bertrand, J. K. (2001). Gluteus medius and rump fat depths as additional live animal ultrasound measures for predicting retail product and trimmable fat in beef carcasses. J. Anim. Sci. 79, 1378–1385. doi: 10.2527/2001.7961378x
Roehe, R., Morgan, C., and Clarkson, A. (2013). Understanding the Inefficiency of Too Much Fat. Kenilworth: AHDB Beef and Lamb.
Shi, C., Teng, G., and Li, Z. (2016). An approach of pig weight estimation using binocular stereo system based on LabVIEW. Comput. Electr. Agric. 129, 37–43. doi: 10.1016/j.compag.2016.08.012
Tasdemir, S., Urkmez, A., and Inal, S. (2011). Determination of body measurements on the Holstein cows using digital image analysis and estimation of live weight with regression analysis. Comput. Electr. Agric. 76, 189–197. doi: 10.1016/j.compag.2011.02.001
Van Hartem, T., Viazzi, S., Steensels, M., Maltz, E., Antler, A., Alchanatis, V., et al. (2014). Automatic lameness detection based on consecutive 3D-video recordings. Biosyst. Eng. 119, 108–116. doi: 10.1016/j.biosystemseng.2014.01.009
Viazzi, S., Bahr, C., Van Hartem, T., Schlageter-Tello, A., Romanini, C. E. B., Halachmi, I., et al. (2014). Comparison of a three-dimensional and two-dimensional camera system for automated measurement of back posture in dairy cows. Comput. Electr. Agric. 100, 139–147. doi: 10.1016/j.compag.2013.11.005
Wang, Y., Yang, W., Winter, P., and Walker, L. (2008). Walk-through weighing of pigs using machine vision and an artificial neural network. Biosyst. Eng. 100, 117–125. doi: 10.1016/j.biosystemseng.2007.08.008
Weber, A., Salau, J., Haas, J. H., Junge, W., Bauer, U., Harms, J., et al. (2014). Estimation of backfat thickness using extracted traits from an automatic 3D optical system in lactating Holstein-Fresian cows. Livestock Sci. 165, 129–137. doi: 10.1016/j.livsci.2014.03.022
Keywords: finishing beef cattle, 3D imaging, carcass characteristics, machine learning, precision livestock farming
Citation: Miller GA, Hyslop JJ, Barclay D, Edwards A, Thomson W and Duthie C-A (2019) Using 3D Imaging and Machine Learning to Predict Liveweight and Carcass Characteristics of Live Finishing Beef Cattle. Front. Sustain. Food Syst. 3:30. doi: 10.3389/fsufs.2019.00030
Received: 29 October 2018; Accepted: 11 April 2019;
Published: 01 May 2019.
Edited by:
Matt Bell, University of Nottingham, United KingdomReviewed by:
Jean-Francois Hocquette, INRA UMR1213 Herbivores, FranceStephen James Ramsden, University of Nottingham, United Kingdom
Copyright © 2019 Miller, Hyslop, Barclay, Edwards, Thomson and Duthie. This is an open-access article distributed under the terms of the Creative Commons Attribution License (CC BY). The use, distribution or reproduction in other forums is permitted, provided the original author(s) and the copyright owner(s) are credited and that the original publication in this journal is cited, in accordance with accepted academic practice. No use, distribution or reproduction is permitted which does not comply with these terms.
*Correspondence: Gemma A. Miller, gemma.miller@sruc.ac.uk