Abstract
Increasing milk yield per cow is considered a promising climate change mitigation strategy for small-scale dairy farms in developing countries. As it can be difficult to increase cow productivity, mitigation options beyond this production strategy need to be identified. The aim of this study was to identify entry points for mitigation of GHG emissions in small-scale dairy farms in Lembang Sub-district, West Java, Indonesia. Data on herd composition, productivity, feeding, and manure management were collected in a survey of 300 randomly selected dairy farms. Characteristics of farms with the 25% lowest (<3291 kg milk/cow/y), medium 50% (3291–4975 kg milk/cow/y), and 25% highest milk yields (≥4976 kg milk/cow/y) were compared. Life cycle assessment was then performed to estimate the cradle-to-farm gate GHG emission intensity (EI) of farms. The relationship between EI and milk yield per cow for all farms was modeled and farms with an EI below and above their predicted EI were compared (“low” and “high” EI farms). Results showed that milk yield explained 57% of the variance in EI among farms. Farms with medium and high milk yields were more often specialized farms, fed more tofu waste and compound feed, and had higher feed costs than farms with low milk yields (P < 0.05). Farms with high milk yields also applied less manure on farm land than farms with low milk yields (P < 0.05). Low EI farms had fewer cows, and fed less rice straw, more cassava waste, and more compound concentrate feed (particularly the type of concentrates consisting largely of by-products from milling industries) than high EI farms (P < 0.05). In addition, low EI farms discharged more manure, stored less solid manure, used less manure for anaerobic digestion followed by daily spreading, and applied less manure N on farmland than high EI farms (P < 0.05). Some associations were affected by confounding factors. Farm management factors associated with milk yield and the residual variation in EI were considered potential entry points for GHG mitigation. Feeding less rice straw and discharging manure, however, were considered unsuitable mitigation strategies because of expected trade-offs with other environmental issues or negative impacts on food-feed competition.
Introduction
Global livestock production is estimated to contribute 14.5% to the total anthropogenic greenhouse gas (GHG) emissions, with dairy production systems being responsible for about 30% of these emissions (2.1 gigatonnes of CO2e per year; Gerber et al., 2013; Opio et al., 2013). The global demand for dairy products is expected to increase in the next decade, with the majority of the increase in milk production being anticipated in developing countries (OECD/FAO, 2017). This development is expected to be accompanied by considerable increases in GHG emissions, all the more because GHG emission intensities (i.e., emissions per unit of milk output) from current dairy production systems in developing countries are often relatively high compared to the global average (Opio et al., 2013).
Because of the large contribution of dairy production systems to climate change, many studies have been conducted to evaluate options for mitigation of GHG emissions. Dairy cattle produce methane from enteric fermentation, and methane and nitrous oxide from manure. Besides this, dairy production also drives additional emissions from feed production, land use change, processing, and transports. At the farm level, one mitigation option is to increase milk yield per cow, which shows a non-linear negative association with GHG emissions per unit of milk output (Gerber et al., 2011). Increasing milk yield per cow is considered a promising strategy for reducing emissions intensity (emissions per unit of milk or meat output) even though absolute emissions per animal increase. This strategy is particularly effective for small-scale dairy farms in developing countries, as reductions in GHG emission intensity are largest for yield increases at the lower end of the milk yield range. The livelihood benefits for poor farmers can also be significant (Delgado, 2003; e.g., Brown, 2003).
Increasing milk yield requires improved herd management through combinations of feed supply and quality, animal health, cow fertility, and improving genetic potential (e.g., Capper et al., 2009). Although the level of variation in milk yield among farms in developing countries suggests there is much potential for improvement, in practice, it often appears difficult to improve milk production levels. A lack of high-quality feed sources, poor access to credit and poor herd management are examples of common constraints.
Alternative measures for mitigation should therefore also be considered, including, for example, improved manure management, low-emission crop cultivation (e.g., efficient nitrogen uptake, soil carbon sequestration), and avoided land use change (Capper et al., 2009; Van Middelaar et al., 2013; De Vries et al., 2018; Mostert et al., 2018; Vellinga and de Vries, 2018). The potential effectiveness and suitability of mitigation options depends on the specific characteristics of dairy farming systems targeted, and their agro-ecological and socio-economic context. Comparing farms within the same context should help to explain why some farms are more successful in increasing milk yield, and to identify farm-specific mitigation options beyond this production strategy (Mu et al., 2018).
The aim of this study was to identify suitable entry points for mitigation of GHG emissions in small-scale dairy farms in West-Java, Indonesia. We used a two-stage approach in which farms were first compared in terms of milk yield levels, followed by an analysis of the variance in farms' GHG emission intensities that could not be explained by milk yield levels and the implications for additional mitigation options.
Materials and Methods
Data Collection
Survey
Three hundred dairy farms were randomly selected from a list of 4,361 farms delivering milk to the dairy cooperative Koperasi Peternak Sapi Bandung Utara (KPSBU) Jabar in Lembang Sub-district, West Java, Indonesia. A structured questionnaire was developed for dairy farms with questions about herd composition and performance, cow fertility and health, land use, feed ration and feeding practices, manure management and crop nutrient management practices, other farming practices, and farmers' perceptions and motivations. Questions were asked in Indonesian, with translation to the local language, Sundanese, when needed. Five enumerators [bachelor students from the University of Padjajaran (UNPAD)] with knowledge of farming systems and familiar with local languages and culture were trained in a 5 days course, including 2 days of field testing of the questionnaire. The questionnaire was administered in person on the 300 farms between November and December 2016. An informed written consent was obtained from all respondents. An ethics approval was not required as per applicable institutional guidelines and Indonesian law. Written informed consent was obtained from all participants.
Overall results of the survey showed that dairy farms in Lembang had an average herd size of four adult cows and two young stock. Herds were housed in tie-stalls with no access to grazing (zero-grazing systems). Most farms were specialized dairy farms (84%), and there were some mixed crop-livestock farms as well (16%). In nearly all farms the main purpose of keeping cattle was to produce milk for sale. Few farmers had other sources of income. The feed ration of lactating cows consisted mainly of home-grown grass (king grass or elephant grass), roadside grass, rice straw, industrial by-products (mainly tofu waste and cassava waste), and compound feed. In the dry season, home-grown grass was often replaced by rice straw and other crop residues, and in case of the lactating cows, supplemented with an increased amount of compound concentrate feed. Manure (either feces, urine, or both) was discharged to the environment from most farms, or used as a soil amendment, sold or given away to other farms. More details about the results of the survey can be found in the following sections and in De Vries et al. (2017).
Milk Sales
For each of the 300 farms in the survey, the total amount of milk sold in 2016 was obtained from databases kept by the dairy cooperative KPSBU. The amount of milk sold to KPSBU could not be obtained for 12 farms, which were therefore excluded from the analysis, leaving a sample of 288 farms.
On-Farm Measurements
On 50 farms from the list of 300 surveyed farms, heart girths of cattle, and absolute quantities of feed and fodder fed to cattle were measured during one full day in December 2016. Collection of farm data was done after obtaining approval of the farmer. An ethics approval was not required as per applicable institutional guidelines as well as Dutch and Indonesian law. Heart girths, measured slightly behind the shoulder blade, were used to estimate live weights of cattle using an equation derived from measurements on the same approximate size and breed of cattle (Heinrichs et al., 2007). Amounts of concentrate feed, wet by-products, and fodder per head of cattle were weighed over a 24 h period using scales. Further details about the on-farm measurements can be found in Verweij (2017).
Nutritional Values of Feed Ingredients
To determine the nutritional value of feed ingredients, two samples per feed ingredient were taken from several farms in Lembang in 2016 and analyzed in the EUROFINS laboratory. Sampled farms were not necessarily farms in the baseline survey or farm assessment.
Calculation of Milk Yield
Milk production per farm was based on the total amount of milk sold to KPSBU in 2016, corrected for the share of milk kept at home (e.g., for home consumption or calves). To calculate the average annual milk yield per cow per farm, the total amount of milk was divided by the number of adult cows. The average number of adult cows in 2016 was estimated based on the number of adult cows at the time of the survey and farmer recall of the number of adult cows culled, purchased, and that died in the past year. Since we did not obtain information about the date animals were culled, purchased, or died, we assumed the event took place halfway through the year.
Because of expected bias in the estimated number of adult cows, farms with an unrealistically high milk yield per cow were excluded from the analysis as outliers. Outliers were detected using the interquartile range (IQR; i.e., the difference between the 25 and 75th percentiles). Farms were excluded where average milk yield was 1.5 IQR above the third quartile (≥7659 kg milk per cow/y). There were no outliers in the lower range (1.5 IQR below the first quartile). Five cases were excluded from the analysis, leaving 283 farms for the final analysis.
Calculation of GHG Emission Intensity
A life cycle assessment (LCA) was carried out to estimate GHG emission intensity of each of the 283 dairy farms. GHG emissions related to land use and land use change (LULUC) were not included in the LCA.
System Boundaries
All processes up to the dairy farm gate (i.e., cradle-to-farm gate) were included in the LCA. This included production of farm inputs and on-farm production activities, but excluded transport and processing of the milk (Figure 1). Since we focused on the impact related to milk production, system boundaries included young stock kept for replacement of dairy cows, but excluded surplus calves and cows kept for fattening purposes.
Figure 1
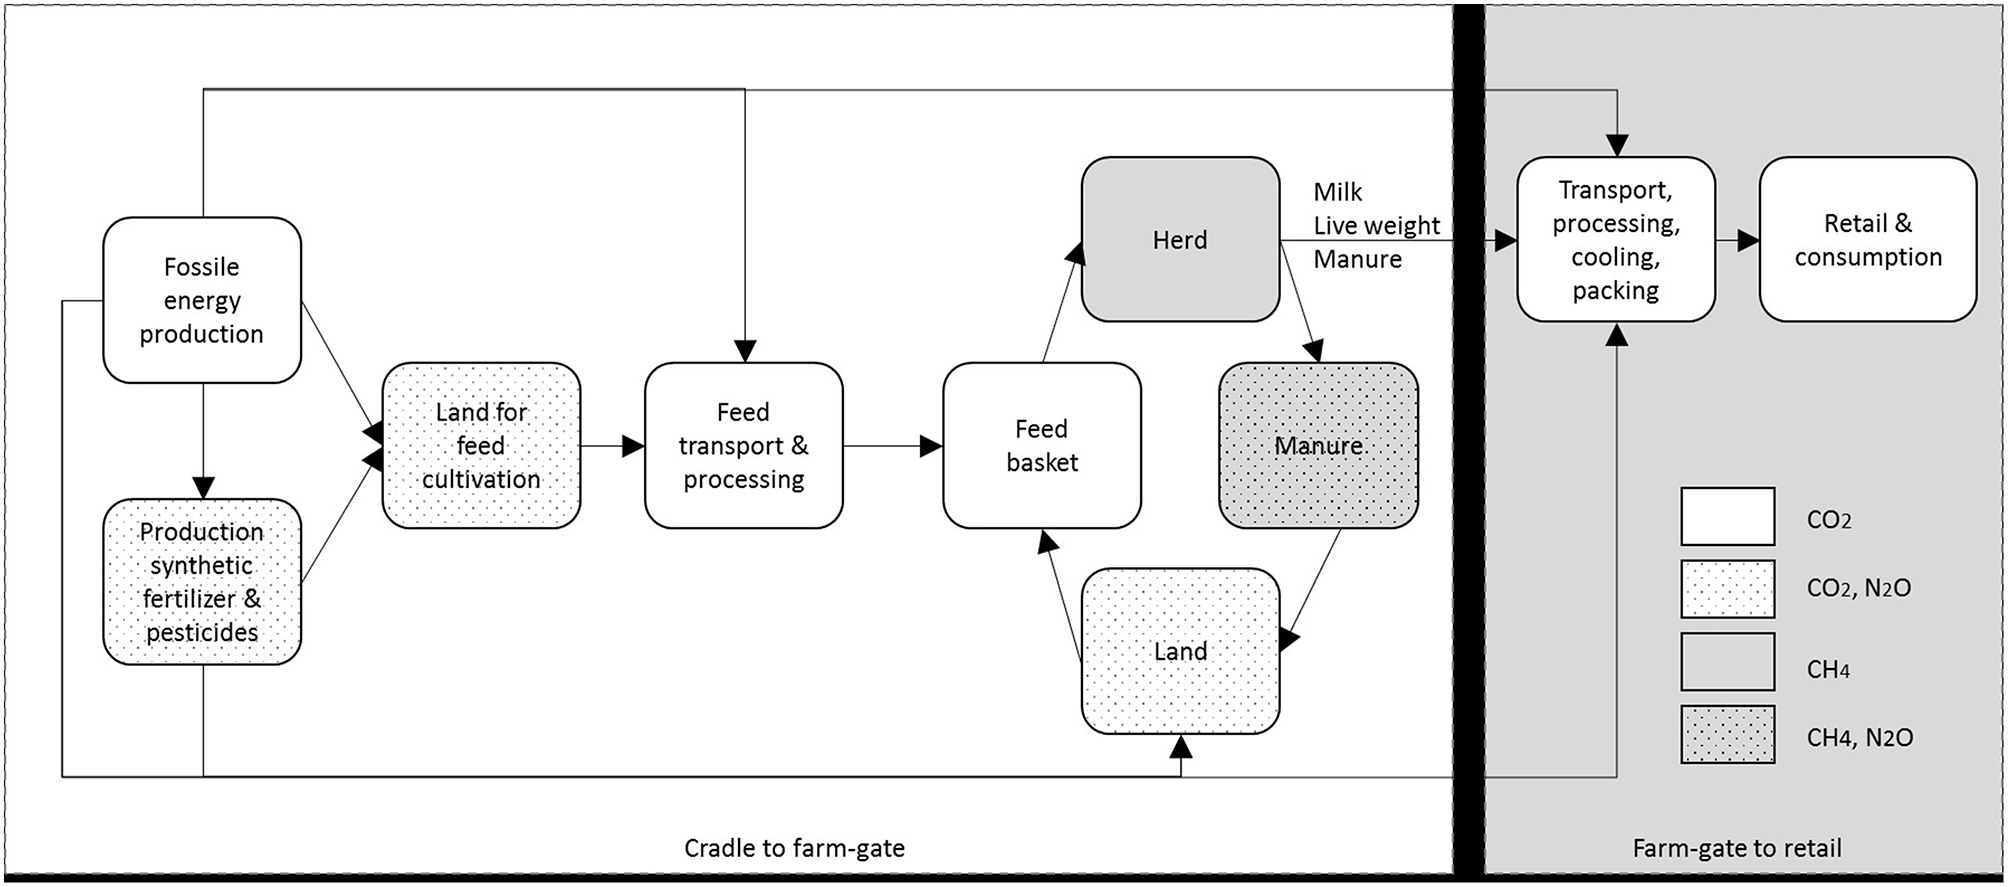
Cradle to farm-gate system boundaries (indicated by the white rectangle) used for the analysis of greenhouse gas emissions.
Data Inventory
Primary, farm-specific data was used where available (Table 1). Where primary data were not available or biased, secondary data were used from existing databases or the literature (Tables 2A–C).
Table 1
| GLEAM module | Input parameter | Source |
|---|---|---|
| Herd module | Average number of adult cows on the farm in 2016a | De Vries and Wouters, 2017 (survey) |
| Average milk yield per cow (kg/year)b | KPSBU Jabar (dairy cooperative), De Vries and Wouters, 2017 | |
| Manure module | Fraction of animal excreta per MMS (solid storage, compost, drylot, daily spread, anaerobic digestion, discharged, or exit livestock) | De Vries and Wouters, 2017 |
| Feed module | Fraction (dry matter) of feed ingredient in total herd feed ration [homegrown grass, roadside grass, rice straw, cassava waste, tofu waste, brewers spent grain, rice bran, compound concentrate feed (type A or B)] | De Vries and Wouters, 2017; Verweij, 2017 (on-farm measurements) |
| Average nitrogen (N) application rates from animal manure (kg/ha)c | De Vries and Wouters, 2017 | |
| Land used for grass, fodder, and food crop production (ha) | De Vries and Wouters, 2017 |
Farm-specific input data used in LCA analysis.
Based on the number of adult cows present at the farm at the time of the survey, and the farmer-reported number of adult cows that were culled, purchased, or died in 2016.
Based on the amount of milk sold to the local dairy cooperative KPSBU Jabar (kg/farm/year), the percentage of milk kept at home, and the average number of adult cows on the farm in 2016.
Based on Tier 2 estimates of N excretion rates and amount of agricultural land.
Table 2A
| GLEAM module | Input parameter | Value | Source |
|---|---|---|---|
| Herd module | Fertility rate (%) | 75.0 | Opio et al., 2013 |
| Replacement rate (%) | 15.0 | Expert opinion | |
| Age at first calving (mo) | 31.0 | Anggraeni and Rowlinson, 2005a,b | |
| Death rate, perinatal (%) | 22.0 | Opio et al., 2013 | |
| Death rate, older (%) | 4.2 | Expert opinion | |
| Live weight adult cows (kg) | 503.3 | Verweij, 2017 | |
| Feed module | Nutritional values per feed ingredient (dry matter content, crude protein, organic matter, organic matter digestibility, gross energy) | (see other tables) | EUROFINS laboratory analyses, expert opinion, Feedipedia databasea |
| Gross yields, application rates of synthetic and animal fertilizer, and pesticides used in crop production | (De Vries and Wouters, 2017; Gautier, 2017), Badan Pusat Statistik (average rice yield Indonesia 2011–2015), (IRRI, 2004; FAO, 2005; IPNI, 2011; Vellinga et al., 2012; FAOSTAT, 2014; Norton and vanderMark, 2016), expert opinion. | ||
| Energy requirements of processing feed | Vellinga et al., 2012 | ||
| Transport distances feed | KPSBU Jabar (dairy cooperative) | ||
| System module | Milk fat (%) | 4.0 | KPSBU Jabar (dairy cooperative) |
| Milk protein (%) | 2.9 | “” |
Fixed values used as input data in LCA analysis.
www.feedipedia.org, accessed February 2017.
Table 2B
| Feed ingredient | Dry matter contenta,c | Nutritional value b,c per kg DM | |||
|---|---|---|---|---|---|
| (%) | CP (%) | OM (%) | OMD (%) | GE (MJ) | |
| Fresh cut grass (road side) | 12.3 | 11.7 | 85.4 | 56.9 | 16.0 |
| Fresh cut grass (home grown) | 12.5 | 14.9 | 83.3 | 58.7 | 17.4 |
| Rice straw | 28.6 | 4.0 | 79.9 | 46.5 | 15.5 |
| Tofu waste | 12.5 | 20.7 | 96.9 | 79.6 | 19.7 |
| Cassava waste (pommace) | 13.1 | 1.7 | 96.3 | 79.6 | 17.7 |
| Brewers spent grain | 23.5 | 25.8 | 97.0 | 67.7 | 19.7 |
| Rice bran | 90.2 | 12.7 | 90.6 | 63.8 | 20.2 |
| Compound concentrate feed | 86.0 | 17.0 | 93.0 | 74.8 | 18.9 |
Nutritional values of feed ingredients.
Dry matter content of fresh cut road side grass was assumed to be 14.8% in the dry season. Dry matter content of fresh cut home grown grass was assumed to be 15.0% in the dry season. Except for dry matter content of fresh cut grass, nutritional values of feed ingredients were assumed to be the same in the rainy season and the dry season.
CP, Crude Protein; OM, Organic Matter; OMD, Organic Matter Digestibility; GE, Gross Energy.
Sources: expert opinion (DM% tofu waste; OMD% cassava waste; CP% rice straw and compound concentrate feed), Feedipedia (DM, CP, and OM% of cassava waste and rice bran; OMD% rice bran; GE of all feed ingredients, except road-side grass; P content cassava waste and rice bran), EUROFINS laboratory analyses (other values).
Table 2C
| Gross yield (kg DM/ha) | Synthetic fertilizer (kg per ha/y) | Animal manure (kg N per ha/y) | Pesticides (kg/ha) | |||
|---|---|---|---|---|---|---|
| N | P2O5 | K2O | ||||
| Grass (road side) | 7,500a | – | – | – | – | – |
| Grass (home grown) | 15,000a | 277b | – | – | (Farm-specific) | – |
| Rice | 10,997c | 202d | 10d | – | – | 2d |
| Wheat | 2,360e | 39f | 25f | 22f | 29f | 3f |
| Corn | 4,954e | 82g | – | – | 2g | 2g |
Assumed crop yields, fertilizer use, and pesticide use.
Primary Data
Data sources for calculation of annual milk yield per cow are described in section Calculation of Milk Yield. The survey (De Vries and Wouters, 2017) yielded data on number of adult cows, land size, manure management and application, and feed rations. Land size included both owned and rented land for grass, fodder, and food crop production.
The share of animal excreta allocated to different types of manure management systems (MMS) was estimated by farmers using a 1–5 scale (from “almost none” to “nearly all”). MMS included solid storage, composting, dry lot, daily spread, anaerobic digester, exit livestock (manure sold or given away), and discharge of manure (a description of these MMS can be found in IPCC, 2014). In case of manure discharging, farmers flushed from the cow barn the feces and urine, which were either washed away directly to ground- and surface water or lied deposited initially next to the barn, depending on the location and weather conditions (e.g., dry vs. rainy season).
With regard to feed rations, absolute amounts of industrial by-products and concentrates fed to lactating cows were derived from the survey and reported separately for the dry season and the rainy season. As it is difficult for farmers to estimate absolute amounts of fodder (grass and crop residues), farmers were asked about the relative share of each type of fodder in the total amount of fodder fed in the wet and dry season. Fodder contributing <5% was ignored (e.g., banana stalks, vegetable waste). Amounts of compound concentrate feed fed to lactating and dry cows were based on the survey (De Vries and Wouters, 2017), and for young stock, using on-farm measurements (Verweij, 2017). Nutritional values of feed ingredients were based on laboratory analyses of feed samples from farms in Lembang Sub-district (Section Nutritional Values of Feed Ingredients). For some feed ingredients, nutritional values were based on expert opinion or Feedipedia (details specified in Table 2B footnote).
Secondary Data
Average fat and protein contents of milk from farms in Lembang were acquired using data from the local dairy cooperative KPSBU (Table 2A). Because of expected bias we did not use the self-reported data from the survey (De Vries and Wouters, 2017) for herd reproductive performance as input for the LCA. Reproduction parameters were based on literature and expert opinion instead (Table 2A).
Crop yields, fertilizer use, and pesticide use were based on national statistics (Badan Pusat Statistik), FAOSTAT, expert opinion, and the literature (Table 2C). Data for field work emissions, energy use of road transport, allocation of processed crops, and market prices were collected from databases of the Global Livestock Environmental Assessment Model (GLEAM; Opio et al., 2013), EcoInvent (using Simapro), FeedPrint (Vellinga et al., 2012), and the dairy cooperative KPSBU. For rice cultivation, we assumed pre-cultivation flooding of fields, continuous flooding during cultivation (irrigation via canal systems), no application of animal manure, and 200 days of cultivation per year (pers. comm. Huib Hengsdijk, November 2017).
The composition of compound concentrate feed and information about the production locations were obtained from the local dairy cooperative KPSBU. Two types of compound concentrate feed were used in dairy farms: quality A [wheat pollard (80%), corn gluten feed (13%), dregs of soy sauce (3%), and CaCO3 (3%)] and quality B [wheat pollard (40%), corn gluten feed (13%), dregs of soy sauce (3%), CaCO3 (3%), rice bran (7%), palm oil dregs (23%), coffee hulls (6.7%), and corn bran (3%)]. We assumed an equal amount from both types (50/50) in case farms used both types of compound concentrate feed. Dry matter content of fresh cut grass (road-side and home-grown) was assumed to be 25% lower in the rainy season than in the dry season.
Calculation of LCA Input Parameters
Numbers of young stock were estimated using rate parameters on reproduction, growth, and mortality based on expert opinion or literature (Table 2A). Numbers of young stock were not based on the survey, because these data did not distinguish between animals for replacement of dairy cattle and surplus animals kept for fattening on farms, a distinction required for the delineation of the system's boundaries.
In the survey farmers were asked about relative shares of fodder only. Absolute amounts of fodder were estimated based on energy requirements in four steps. First, gross energy requirements of adult cows per year were calculated using IPCC guidelines (IPCC, 2014). Second, total annual dry matter (DM) intake of adult cows was predicted based on their gross energy requirements and feed ration composition. Third, DM intake from fodder was estimated by subtracting DM intake from concentrates and by-products from the total DM intake (amount of concentrates and by-products fed were reported by farmers in the survey). Fourth, DM intake from fodder was subdivided to types of fodder (roadside grass, homegrown grass, rice straw) based on proportions reported by farmers in the survey. In case DM intake from concentrates and by-products (reported by farmers) exceeded 75% of the total DM intake, DM intake from concentrates and by-products was rounded to 75% of the total DM intake. The method of estimating fodder intake based on energy requirements is commonly used (e.g., Aarts et al., 2015), since estimating intake from forage is difficult.
For young stock, we assumed the same feed ration as for adult cows, but in lower amounts: the DM intake of fodder and by-products by young stock was assumed to be 60 and 40% of the DM intake by adult cows, respectively (percentages were based on on-farm measurements in the study of Verweij (2017); see section On-Farm Measurements). A fixed amount of 2.4 kg compound concentrate feed was assumed for young stock (based on Verweij, 2017).
Farm-specific nitrogen (N) application rates from animal manure were calculated based on Tier 2 estimates of N excretion rates and the area of agricultural land in the farm, corrected for manure discharged, sold, or given away. In three farms with missing data on the area of agricultural land, missing values were replaced by the mean land size of all other farms (i.e., mean imputation). Outliers in N application rate were detected using the interquartile range. Where the N application rate was >1.5 IQR above the third quartile, outliers were defined as being above the value of 1.5 IQR above the third quartile (i.e., 1,803 kg N per hectare per year; 21 farms). In these farms, the remaining N was considered to be discharged manure.
Emission Calculations
For each farm, GHG emission intensity was estimated using the GLEAM (MacLeod et al.,
2017) based on an attributional approach. In GLEAM, GHG emissions are calculated based on IPCC Guidelines (IPCC,
2014), using Tier 2 methods where data permit. The GLEAM model consists of five modules, of which salient features are described below [a detailed description of the model can be found in MacLeod et al. (2017)]:
Herd module: Herd structure, dynamics, and production are characterized. Herd totals are disaggregated into four cohorts of animal classes: adult females, adult males, female young stock, and male young stock. The herd model computes the number of young stock to maintain the adult stock, using rate parameters on reproduction, growth, and mortality, as well as live weight (LW) output.
Manure module: The proportion of manure in each MMS is specified. Results are used as input to the system module (calculating emissions from manure management) and the feed module (calculating emissions from manure applied to crops and grasses).
Feed module: The total herd feed ration is specified (in percentage of total DM intake per feed ingredient at the herd level) and CO2, CH4, and N2O emissions arising during feed production, processing and transport are calculated. Emission sources include direct and indirect N2O and CO2 from crop cultivation and cultivation inputs (e.g., synthetic fertilizer), CH4 from rice cultivation, and CO2 from energy use associated with field operations, crop processing and transport. CO2 emissions arising from LULUC are not included. Total emissions per feed ingredient are allocated between the grain and its co-products using economic or digestible fraction allocation, depending on the type of feed ingredient (MacLeod et al., 2013). In addition, average digestible energy and N content of the feed ration as a whole are calculated, which are used in the System module to determine total DM intake per animal cohort.
System module: DM feed intake per animal cohort is calculated based on cattle energy requirements and the digestible energy and N content of the ration from the Feed module. Subsequently, N and P retention in animal products (milk and LW) and volatile solids are determined, and N and P excreted in dung and urine (IPCC, 2014). Emissions arising from enteric fermentation (CH4), manure management (CH4 and N2O), energy use in housing (CO2), and the production, processing, and transport of feed (CO2, CH4, and N2O) are calculated using Tier 2 approaches (IPCC, 2014). For enteric methane the emission factor is adjusted for ration digestibility [details can be found in MacLeod et al. (2017)]. For GWP characterization, factors of 1, 28, and 265 were used for CO2, biogenic CH4, and N2O, respectively, (IPCC, 2014) to sum up emissions.
Allocation module: GHG emissions are allocated to milk and live weight, using biophysical relationship allocation (Thoma et al., 2013). In the present study, emissions were not allocated to other functions of cattle (non-edible outputs or services), because the survey among dairy farms in Lembang showed cattle were predominantly kept for edible outputs (milk and meat).
The System module was adjusted to enable calculation of emissions related to discharging of manure, either as fresh feces and urine, or as digestate based on the following assumptions:
For manure discharged daily from barns, CH4 and N2O emission factors of “pasture/range/paddock” were used (IPCC, 2014) with an N leaching factor of 65%.
For manure discharged after anaerobic digestion (discharged digestate), the CH4 conversion factor of anaerobic digestion was used for CH4 emissions, and the emission factor of daily discharging of manure for N2O emissions (see previous bullet).
Comparison of Farms by Milk Production Level
To compare characteristics of the 283 farms with distinct milk production levels, farms with the 25% lowest milk production per cow were classified as “low” milk yield (i.e., <3,291 kg milk per cow/y), and farms with the 25% highest milk production per cow were classified as “high” milk yield (i.e., ≥4,976 kg milk per cow/y). The remaining 50% of farms with were classified as “medium” milk yield (i.e., 3,291–4,975 kg milk per cow/y). Medians and ranges per milk yield class are given in Table 3.
Table 3
| Variable | All farms | Milk yield class | Overall P-value | ||||||
|---|---|---|---|---|---|---|---|---|---|
| (n= 283) | Low (n= 71) | Medium (n= 141) | High (n= 71) | ||||||
| Herd | |||||||||
| Herd size (LU)1 | 4.5 | (1.0–38.5) | 4.5 | (1.5–38.5) | 4.5 | (1.0–22.5) | 4.3 | (1.0–15.5) | N.S. |
| Fraction adult cows in herd (LU/LU) | 0.8 | (0.2–1) | 0.8 | (0.4–1.0) | 0.8 | (0.2–1.0) | 0.8 | (0.4–1.0) | N.S. |
| Household | |||||||||
| Household members (persons) | 3 | (1–8) | 4 | (1–8) | 4 | (1–6) | 3 | (2–6) | N.S. |
| Respondent age (years)2 | 43 | (20–76) | 45 | (22–76) | 42 | (20–74) | 43 | (24–65) | N.S. |
| Female respondent (vs male; % of farms)2 | 15.9 | 21.1 | 15.6 | 11.3 | N.S. | ||||
| Land | |||||||||
| Farm type mixed (vs specialized; % of farms) | 16.6 | 29.6a | 12.1b | 12.7b | 0.003 | ||||
| Land size (ha) | 0.2 | (0–2.0) | 0.2 | (0–1.0) | 0.2 | (0–2.0) | 0.1 | (0–1.3) | N.S. |
| Land tenure (%) | 28.6 | (0–100) | 50.7 | (0–100) | 20.0 | (0–100) | 28.6 | (0–100) | N.S. |
| Herd performance | |||||||||
| Average milk yield (kg/cow/y)3 | 4151 | (882–7636) | 2652a | (882–3291) | 4151b | (3304–4974) | 5734c | (4976–7636) | 0.000 |
| Average number of open days per cow (d)4 | 102 | (40–410) | 100 | (50–313) | 105 | (40–410) | 105 | (60–403) | N.S. |
| Average AI services per cow4 | 2 | (1–12) | 2 | (1–6) | 2 | (1–12) | 2 | (1–5) | N.S. |
| Costs of purchased feed (1000 IDR/LU/mo)1,5 | 652 | (107–2794) | 520a | (107–2794) | 657b | (161–1605) | 754c | (199–1608) | 0.000 |
| Feed ration adult cows6 | |||||||||
| Tofu waste (kg DM/cow/d) | 0.1 | (0–2.7) | 0a | (0–2.2) | 0.1b | (0–2.7) | 0.9b | (0–2.7) | 0.003 |
| Cassava waste (kg DM/cow/d) | 0.5 | (0–2.3) | 0.3 | (0–2.3) | 0.6 | (0–2.0) | 0.6 | (0–1.7) | N.S. |
| Compound concentrate feed (kg DM/cow/d) | 3.4 | (0–7.1) | 2.5a | (0.3–7.1) | 3.4b | (0–7.1) | 3.4b | (0.2–7.1) | 0.020 |
| Compound concentrate feed type A (vs B; % of farms)7 | 71.4 | 71.8 | 70.2 | 73.2 | N.S. | ||||
| Share of roadside grass in fodder ration (%) | 40.0 | (0–100) | 36.7 | (0–100) | 42.9 | (0–100) | 37.5 | (0–100) | N.S. |
| Share of home-grown grass in fodder ration (%) | 33.4 | (0–100) | 36.7 | (0–100) | 33.4 | (0–100) | 36.7 | (0–100) | N.S. |
| Share of rice straw in fodder ration (%) | 0 | (0–100) | 20.0 | (0–100) | 0 | (0–100) | 0 | (0–100) | N.S. |
| Manure management system (% of manure)8 | |||||||||
| solid storage | 0 | (0–50.0) | 0 | (0–30.8) | 0 | (0–41.2) | 0 | (0–50.0) | N.S. |
| daily spread | 0 | (0–100) | 0a | (0–100) | 0a | (0–100) | 0b | (0–100) | 0.039 |
| digester w/daily spread | 0 | (0–51.3) | 0 | (0–50.0) | 0 | (0–51.3) | 0 | (0–50.0) | N.S. |
| discharged | 66.7 | (0–100) | 66.7 | (0–100) | 64.5 | (0–100) | 80.0 | (0–100) | N.S. |
| exit livestock | 0 | (0–100) | 0 | (0–100) | 0 | (0–100) | 0 | (0–100) | N.S. |
Characteristics (median (range), or frequencies) of surveyed dairy farms, and differences between farms with the 25% lowest (“low”), medium 50% (“med”), and 25% highest (“high”) milk yields.
Medians or frequencies within a row with different superscripts differ between milk yield classes (P <0.05).
Number refers to number of cattle (expressed in livestock units; LU) present at the farm at the time of the survey (including cattle kept for fattening).
Respondent was likely to be the person in charge of the farm, as enumerators requested so before starting the interview.
Milk yield (kg/cow/y) was estimated from the total amount of milk sold to the dairy cooperative in 2016, and the share of milk kept at home and the average number of adult cows present at the farm in 2016.
Based on average number of open days and average number of artificial insemination (AI) services per conception of (maximum) three randomly chosen adult cows in the herd.
Costs of purchased feed and fodder over the month before the interview took place (including transport costs)
Rice bran and brewers spent grain not shown because of low prevalence (<5 farms per milk yield class).
Two types of compound concentrate feed were used in KPSBU dairy farms: (i) quality A: wheat pollard (80%), corn gluten feed (13%), dregs of soy sauce (3%), and CaCO3 (3%), and (ii) quality B: wheat pollard (40%), corn gluten feed (13%), dregs of soy sauce (3%), CaCO3 (3%), rice bran (7%), palm oil dregs (23%), coffee hulls (6.7%), and corn bran (3%).
Manure management system (IPCC, 2014) included only if applied in at least five farms per cell (excluded were dry lot and composting).
Farms in the three milk yield classes were compared according to herd size, household characteristics, land use, herd performance, feed ration, and manure management (Table 3). Since the assumption of normality was often not appropriate for these variables, the Kruskall-Wallis test was used to compare farms across milk yield classes, and the Mann-Whitney U-test was used for post-hoc comparisons of classes. The Chi-square test was used for discrete variables.
Comparison of Farms by GHG Emission Intensity Level
To identify factors influencing GHG emission intensity (EI) of farms other than milk yield, characteristics of farms were compared based on the deviation of their EI from the curve describing the relationship between milk yield per cow and EI of all 283 farms in the analysis (Gerber et al., 2011). In the present study the relation between milk yield per cow and EI was described as follows:
where EI = GHG emission intensity (kg CO2e/kg milk), given a milk yield Y (kg/cow/y).
Farms with an EI below and above their predicted EI (using Equation 1) were compared in terms of LCA input parameters, using Mann-Whitney U-tests and Chi-square tests. In addition, to test if differences depended on milk yield level, farms with an EI below and above their predicted EI were compared within milk yield classes (low, medium, and high milk yield) using the same statistical tests. Spearman correlations were used to identify potential confounding variables.
Results
As expected, average EI differed significantly among all milk yield classes (P < 0.001), ranging from 2.1 kg CO2e/kg milk in the lowest milk yield class, to 1.4 and 1.1 kg CO2e/kg milk in the medium and high milk yield class (SD = 0.7, 0.4, and 0.2). The fitted curve of Equation (1) (Figure 2), explained only 57% of the variance in the data, however, suggesting that the EI was influenced by other factors than milk yield. A large residual variance was observed, especially in farms in the low milk yield class (coefficient of variation (CV) 34%) compared to farms in the medium and high milk yield class (CV 25 and 17%).
Figure 2
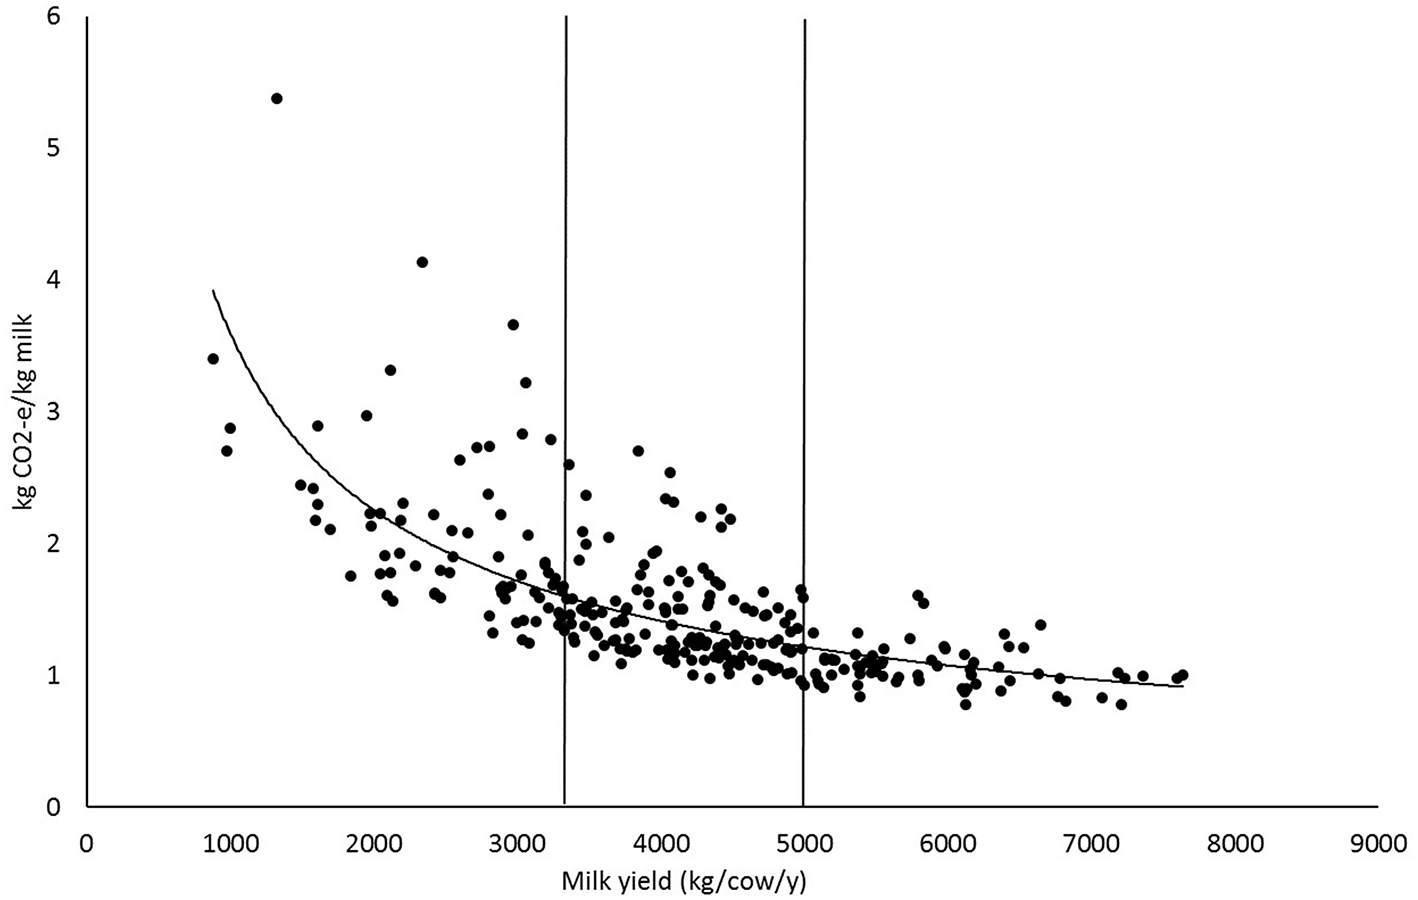
Milk yield and greenhouse gas emission intensity of 283 dairy farms in Lembang Sub-district, West Java.
Characteristics of Farms by Milk Production Level
Farms with medium and high milk yields were more often specialized dairy farms, in contrast with farms that had low milk yields, which were more often mixed crop-livestock farms (Table 3). With regard to feed ration composition, farms with medium and high milk yields fed a higher amount of tofu waste and compound concentrate feed, and had higher feed costs per cow than farms with low milk yields. In farms with high milk yields a lower percentage of manure was spread daily on farmland compared to farms with medium and low milk yields (these differences cannot be directly observed from Table 3 because median values were zero in all groups).
Characteristics of Farms by Deviation From Their Predicted Emission Intensity
Farms with a “low” EI (an EI below their predicted EI based on milk yield level, using Equation 1) had fewer cows than farms with a “high” EI (an EI above their predicted EI; Table 4). In addition, low EI farms fed less rice straw, more cassava waste, and more compound concentrate feed, and less often fed compound concentrate feed type A than high EI farms. With regard to manure management, low EI farms discharged more manure, stored less solid manure, used less manure for anaerobic digestion followed by daily spreading, and applied less manure N on farmland than high EI farms (some of these differences cannot be directly observed from Table 4 because median values were zero in both groups).
Table 4
| GHG emission intensity | Below predicted EI (n = 171)a | Above predicted EI (n = 112)a | P-value |
|---|---|---|---|
| Adult cows (average heads/year) | 3.0 (1–15.0) | 4.0 (1–25.5) | 0.048 |
| Milk yield (kg/cow/y)b | 4,221 (882–7,206) | 4,077 (1,325–7,636) | N.S. |
| Land size (ha) | 0.2 (0–1.3) | 0.1 (0–2.0) | N.S. |
| Feed ration adult cows (kg DM/cow/d)c: | |||
| - Roadside grass | 2.2 (0–11.0) | 2.2 (0–9.5) | N.S. |
| - Home–grown grass | 1.8 (0–9.1) | 1.2 (0–9.6) | N.S. |
| - Rice straw | 0 (0–2.9) | 2.8 (0–12.9) | 0.000 |
| - Tofu waste | 0.1 (0–2.7) | 0.1 (0–2.7) | N.S. |
| - Cassava waste | 0.7 (0–2.3) | 0.1 (0–2.0) | 0.005 |
| - Compound concentrate feed | 3.4 (0–7.1) | 2.8 (0.2–7.1) | 0.050 |
| Compound concentrate feed type A (vs B; % of farms) | 66.1 | 79.5 | 0.010 |
| Manure management system (% of manure)d | |||
| - Solid storage | 0 (0–41.2) | 0 (0–50.0) | 0.003 |
| - Daily spread | 0 (0–100) | 0 (0–66.7) | N.S. |
| - Digester, daily spread | 0 (0–100) | 0 (0–100) | 0.016 |
| - Digester, discharged | 0 (0–100) | 0 (0–100) | N.S. |
| - Digester, exit livestock | 0 (0–50.0) | 0 (0–100) | N.S. |
| - Discharged | 72.0 (0–100) | 46.0 (0–100) | 0.015 |
| - Exit livestock | 0 (0–100) | 0 (0–100) | N.S. |
| Manure N application rate (kg/ha)e | 0 (0–1,803) | 156 (0–1,803) | 0.002 |
Differences [median (range); P < 0.05] between farms with a greenhouse gas (GHG) emission intensity below and above their predicted emission intensity based on milk yield.
Maximum number of farms per category (for some variables the number of farms per category was lower).
Milk yield (kg/cow/y) was estimated from the total amount of milk sold to the dairy cooperative in 2016, and the share of milk kept at home and the number of adult cows present at the farm at the time the interview took place.
Rice bran and brewers spent grain not shown because of low prevalence.
Dry lot and composting not shown because of low prevalence.
A cut-off value was used for N application rate from animal manure in case of outliers (1,803 kg N/ha).
Results of the correlation analysis showed that the association between herd size and residual variation in EI was likely affected by confounding factors, including amount of rice straw fed to cows and manure N application rates (both positively associated with herd size; P < 0.05). Both for discharging of manure and the amount of solid manure stored the association with residual variation in EI was likely affected by the amount of manure N applied to farm land as a confounding factor (rs = −0.68 and 0.39, resp., P < 0.001). Excessive manure N fertilization was more common in farms with a higher amount of fresh manure and digestate spread to land daily (rs = 0.66 and 0.42, resp., P < 0.001).
Comparing “low” and “high” EI farms within milk yield classes showed that differences in EI between these two groups depended on milk yield class (Annex 1). An exception was the amount of rice straw fed, which differed between low and high EI farms in all milk yield classes, and herd size and amount of discharged manure, which were not significantly different between “low” and “high” EI farms in any of the milk yield classes. Besides rice straw, in the low milk yield class, low EI farms less often used a solid storage for manure than high EI farms. In the medium milk yield class, low EI farms fed more cassava waste, and more compound concentrate feed, and applied less digestate and total manure N to farmland than high EI farms. In the high milk yield class, low EI farms had lower milk yields, and applied less manure N to farmland than high EI farms.
Discussion
Average EI of farms in this study was 1.5 kg CO2e/kg milk, which is lower than estimates of the EI of dairy production systems in SE Asia found by Opio et al. (2013) and Gerber et al. (2013). Enteric methane emissions and emissions from feed production per kg milk in our study were lower than in Opio et al. (2013), probably because of a higher milk production level [4,166 vs. 2,515 kg/cow/y in Opio et al. (2013)] and use of better quality by-products. EI in an LCA study by Taufiq et al. (2016) in the same region in Indonesia (Pangalengan) ranged from 1.5 kg CO2e/L milk in “modern” dairy farms to 2.3 kg CO2e/L milk in small-scale dairy farms. Average EI of small-scale farms in our study was lower than what was found by Taufiq et al. (2016), partly due to a higher milk production of small-scale farms in our study (12 vs. 10 L/cow/day).
The non-linear relationship between EI and milk yield of dairy farms in Lembang found in this study (as shown by the curve in Figure 2) is consistent with the relationship between EI and milk yields for a wide range of dairy production systems worldwide (Gerber et al., 2011). Like Gerber et al., we found that emissions steeply decreased at the lower end of the milk yield range, until about 2 to 3 kg CO2e/kg milk at 2,000 kg milk per cow/year, at which point reductions in EI slowed down as productivity increased further. Country average emission intensities were used in the study of Gerber et al. (2011), however, thus excluding between-farm variation. This may explain the smaller proportion of variance in EI due to milk yield in the present study compared Gerber et al. (57 vs. 89%). For comparison, Christie et al. (2012) found that milk yield accounted for 70% of the variance in EI among Australian dairy farms.
The fact that milk yield explains only part of the variation in EI suggests mitigation strategies other than milk yield increase are relatively important, and also highlights the limitation of using milk yield as a single proxy for estimating EI (e.g., Christie et al., 2012; FAO and ILRI, 2016; Lorenz et al., 2019). In the following paragraphs we discuss methodological limitations of the present study, options for reducing EI by improving milk yields and mitigation options beyond this production strategy.
Methodological Limitations
Availability and quality of livestock data are common issues in developing countries and were also an important methodological limitation of the present study. Like in any survey, responses to the questionnaire were likely subject to self-reporting bias, particularly farmers' estimates of feed ration composition, land size, amounts of farm inputs purchased, and amounts of manure per storage type. Furthermore, the recall period of 1 year was too short to make accurate estimates of amount of LW output from herds, because LW output of small herds can fluctuate substantially from year to year. Using 1 year data can lead to too optimistic or too pessimistic estimates of the amount of LW output from herds. Also, as is common in developing countries, availability of secondary data in Indonesia was limited, particularly for data on local crop yields and field inputs (fertilizers, pesticides). In future studies, farm data susceptible to self-reporting bias should be collected through on-farm measurements rather than surveys, and farms should be monitored more regularly and over several years to estimate LW output more accurately.
The limited data availability and quality likely affected the results of this study in two ways. First, estimates of milk yields and GHG EI of farms were likely less accurate due to the limited availability and quality of data. For example, some farms had low inputs but high milk yield levels, which might explain why we found relatively low emission intensities for some farms. Second, because only a few farm parameters were farm-specific, the differences between farms with distinct milk yields and GHG emission intensities were likely underestimated. More differences among farms may be expected where more farm-specific data are included, e.g., farm-specific field inputs (e.g., synthetic fertilizer), reproductive performance, and animal health.
Options for Reducing EI by Improving Milk Yields
Specialization in dairy production, and feeding higher amounts of tofu waste and compound feed were associated with higher milk yield levels, and can be considered entry points for mitigation as average EI reduced considerably when shifting to a higher milk yield class (26–32% reduction). It is important to consider that specialization can increase the risk of adverse environmental impacts, however, especially if animal manure is not efficiently recycled as a fertilizer and nutrient losses are not managed properly (Petersen et al., 2007; e.g., Oenema et al., 2007). In our study, specialized farms discharged significantly more manure than mixed farms. The positive effects of compound concentrate feed and tofu waste on milk yield were likely caused by a higher intake of energy and protein. An increased use of compound concentrate feed, furthermore, can lead to a net increase in EI if the increase in milk yield is not sufficient to compensate for the increase in emissions from feed production. This is particularly relevant when feed rations do not match with the dairy cow's requirements, as is the case in many farms in Lembang (De Vries and Wouters, 2017). Feeding concentrates in excess may also carry animal health risks such as subacute ruminal acidosis (Kleen et al., 2003). Increasing the amount of compound concentrate feed to enhance productivity of dairy cows, therefore, should be part of a balanced ration. Feeding balanced rations has shown considerable potential for reduction of EI (De Vries et al., 2017; Garg et al., 2018). The use of tofu waste as part of a balanced diet for cows is not only advantageous because of its positive effects on milk yield, but also because utilizing these co-products as animal feed prevents food-feed competition and contributes to circularity of food systems (Vellinga et al., 2012; Van Zanten et al., 2018).
Mitigation Options Beyond the Milk Production Strategy
Nine management practices were identified as statistically significant for mitigation based on analysis of the residual variation. Our statistical approach allowed to distinguish between the variation in EI associated with milk yield, and the residual variation in EI. Some farm management factors, however, influence EI both via changes in milk yield and the residual variation in EI. A better quality feed, for example, can lead to a higher milk yield but can also influence total dry matter intake and carry relatively high embedded emissions from its cultivation and processing.
The positive association between the amount of rice straw fed to cows and EI can be explained by the relatively high emission factor of rice straw (0.9 kg CO2e/kg DM), associated with the assumptions made on CH4 and CO2 emissions from paddy rice cultivation and processing. However, since rice straw is commonly burned after harvesting, omission of rice straw in the cow diet does not necessarily reduce emissions embedded in rice straw, just that the emissions are no longer allocated to the dairy sector. Open burning of rice straw is associated with the release of black carbon, which is the second largest contributor to global warming after carbon dioxide, and leads to human health problems (e.g., Hafidawati and Sofyan, 2017). Also, whereas use of rice straw (being a crop residue) does not require additional land, other higher-quality fodders might require additional land (e.g., grass, maize silage). In this context, technical solutions that can improve the nutritional quality and digestibility of rice straw have a high potential for reduction of GHG emissions from agriculture. Fungi treatment of rice straw is an example of such a technique (e.g., Tuyen et al., 2013).
The negative association between the amount of cassava waste fed and EI was due to the relatively low emission factor of cassava waste (<0.1 kg CO2e/kg DM), which was low because no upstream emissions were assumed for wet by-products except for those related to the processing and transport of the wet by-product itself (Vellinga et al., 2012). Similar to tofu waste, utilizing these by-products from industrial food processing can reduce food-feed competition and contribute to circularity of food systems (Vellinga et al., 2012; Van Zanten et al., 2018). The potential for increased use of cassava waste in cattle diets is low, however, due to its poor nutritional value.
Even though compound concentrate feed was the feed ingredient with the second highest emissions per kg DM (0.4–0.5 kg CO2e/kg DM), we found a negative association between the amount of compound concentrate feed fed to cows and EI. This was because total dry matter intake was lower in farms feeding more concentrates (8.2 and 9.2 kg DM/cow/d in “low” and “high” EI farms; Table 4), due to the high energy content of concentrates. Feeding feed ingredients with a low carbon footprint per unit of nutritive value (e.g., energy), therefore, can contribute to reducing EI.
Feeding compound concentrate feed type A was positively associated with EI because it contained more wheat pollard, and less palm oil dregs, coffee hulls, and corn bran than concentrate type B, and the emission factor of wheat pollard was assumed to be higher than of palm oil dregs, coffee hulls, and corn bran. Similar to wet by-products, increasing the use of nutritious by-products from milling industries in compound concentrate feed can reduce GHG emissions from feed production (e.g., Bannink, 2009) and reduce food-feed competition. Hence, feeding the same or better quality feed with relatively low embedded emissions from feed production should be preferred to reduce EI while maintaining high milk yield levels.
Paradoxically, manure discharging was associated with a lower EI, and storing solid manure and daily spreading of digestate were associated with a higher EI. Assumptions on CH4 and N2O emissions from discharged manure were highly uncertain, however, and emissions may vary considerably depending on the location and weather conditions and the fate of the discharged manure. Moreover, discharging manure implies a loss of nutrients, and can cause other environmental issues besides global warming such as eutrophication and pollution of drinking water sources. Recycling manure as a fertilizer can reduce GHG emissions when it replaces synthetic fertilizer. The positive associations between manure management practices and EI was were likely confounded with amount of manure N applied on farmland. In other words, manure storage and application more often led to excess manure application and higher associated N2O emissions than discharging of manure.
Although not significant in the present study, daily spread shows large potential for mitigation of GHG emissions because of relatively low associated N2O emissions from storage (IPCC, 2014), provided that excess manure application is avoided. Other low-emission manure management options for dairy farms in Lembang need to be explored for situations where daily spread is not possible. Part of the manure needs to be sold or given away to other sectors because dairy farmers in Lembang own too little land to apply all manure (De Vries and Wouters, 2017). Changing to other manure management practices may be challenging, however, because collection, storage, and transport of manure requires more labor and space, and may be more costly than the current practice of discharging manure.
Recommendations
Several mitigation options were identified in the present study, but many were expected to have trade-offs outside the dairy production chain or with other environmental issues. Feeding more compound concentrate feed (type B) and tofu waste seemed promising mitigation options for farms with low and medium milk yields, provided that these are part of a balanced ration and food-feed competition is avoided. Preventing excess manure N fertilization seemed a promising mitigation option for farms with medium and high milk yields.
To support sustainable development of the Indonesian dairy sector potential trade-offs with other environmental issues such as eutrophication, land use, and biodiversity should be assessed before introducing options to reduce GHG emissions. Given the high livestock stocking densities in West Java, spatial policy or a manure policy at regional level might be required. Consequential LCA can help to identify environmental trade-offs outside the dairy production chain, e.g., an increase in GHG emission related to burning of rice straw as a result of changes in the dairy cow's diet. A final point of consideration is that options to reduce GHG emissions could impair food security. Feeding highly nutritious feed products such as grains to livestock, for example, might decrease emission intensity compared to feeding by-products, but also contributes to food-feed competition.
Conclusion
This study showed that 57% of the variance in EI among dairy farms in Lembang Sub-District could be explained by milk yield. Farm management factors associated with increased milk yields and the residual variance in EI were considered potential entry points for mitigation. Specialization toward dairy production, and feeding higher amounts of tofu waste and compound feed were associated with higher milk yield levels. Feeding less rice straw, more cassava waste, and more compound concentrate feed (particularly type B, consisting largely of by-products from milling industries) were feeding practices negatively associated with the residual variance in EI. Discharging more manure, storing less solid manure, using less manure for anaerobic digestion followed by daily spreading, and applying less manure N on farmland were manure management practices negatively associated with the residual variation in EI. Feeding less rice straw and discharging manure, however, were not considered to be suitable mitigation strategies because of expected trade-offs with other environmental issues or negative impacts on food-feed competition. More research is needed to evaluate these potential trade-offs.
Statements
Author contributions
This article was written by MdV, with kind contributions of CvM, SO, AW, WZ, BT, and TV. Data analyses were performed by MdV and TV. All authors contributed to the manuscript and approved the submitted version.
Funding
This work was implemented as part of the CGIAR Research Program on Climate Change, Agriculture and Food Security (CCAFS) with funding support from the government of The Netherlands. CCAFS is carried out with support from CGIAR Fund Donors and through bilateral funding agreements. For details please visit https://ccafs.cgiar.org/donors. The views expressed in this document cannot be taken to reflect the official opinions of these organizations.
Acknowledgments
The research was carried out as part of the Sustainable Intensification of Dairy Production Indonesia (SIDPI) project, which is a collaboration between Wageningen Livestock Research, IPB Agricultural University of Bogor, Frisian Flag Indonesia, KPSBU Jabar, and Trouw Nutrition Indonesia. We thank our project partners for their contribution to this research, UNPAD university for collecting the data for the baseline survey, Lini Wollenberg for language editing, and Bas Engel for technical assistance.
Conflict of interest
The authors declare that the research was conducted in the absence of any commercial or financial relationships that could be construed as a potential conflict of interest.
Supplementary material
The Supplementary Material for this article can be found online at: https://www.frontiersin.org/articles/10.3389/fsufs.2019.00049/full#supplementary-material
References
1
AartsH. F. M.De HaanM. H. A.SchroderJ. J.HolsterH. C.De BoerJ. A.ReijsJ.et al. (2015). Quantifying the environmental performance of individual dairy farms–the Annual Nutrient Cycling Assessment (ANCA), in Grassland and Forages in High Output Dairy Farming Systems. Vol. 20 (Wageningen: Wageningen Academic Publishers), 377–380.
2
AnggraeniA.RowlinsonP. (2005a). Productivity of Holstein dairy cows maintained in two different conditions in Central Java, Indonesia, 1: Evaluation of milk performance, in Integrating Livestock-Crop Systems to Meet the Challenges of Globalisation, Proceedings of AHAT/BSAS International Conference, Vol. 2, eds RowlinsonP.WachirapakornG.PakdeeP.WanapatM.. Khon Kaen University, T128.
3
AnggraeniA.RowlinsonP. (2005b). Productivity of Holstein dairy cows maintained in two different conditions in Central Java, Indonesia, 2: environmental effects on reproductive performance, in Integrating Livestock-Crop Systems to Meet the Challenges of Globalisation, Proceedings of AHAT/BSAS International Conference, Vol. 2, eds RowlinsonP.WachirapakornG.PakdeeP.WanapatM. (Khon Kaen University), P106.
4
BanninkA. (2009). Verkenning van de invloed van vochtige diervoeders op de methaanemissie door melkvee. (Investigation of the effect of wet animal feeds on methane emission in dairy cattle). Lelystad: Wageningen UR Livestock Research.
5
BrownA. G. (2003). The livestock revolution: a pathway from poverty? in Record of a Conference Conducted by the ATSE Crawford Fund (Canberra, ACT).
6
CapperJ. L.CadyR. A.BaumanD. E. (2009). The environmental impact of dairy production: 1944 compared with 2007. J. Anim. Sci.87, 2160–2167. 10.2527/jas.2009-1781
7
ChristieK. M.GourleyC. J. P.RawnsleyR. P.EckardR. J.AwtyI. M. (2012). Whole-farm systems analysis of Australian dairy farm greenhouse gas emissions. Anim. Prod. Sci.52, 998–1011. 10.1071/AN12061
8
De VriesM.VellingaT. V.HovingI. E.Van MiddelkoopJ.Ten NapelJ.VerhagenJ.et al. (2018). Klimaatslimme melkveehouderij. Een routekaart voor implementatie van mitigatie- en adaptatiemaatregelen (Climate Smart Dairy Farming: a Roadmap for Implementation of Climate Change Mitigation and Adaptation Measures). Wageningen Livestock Research report 1131. Wageningen: Wageningen Livestock Research.
9
De VriesM.WoutersA. P. (2017). Characteristics of Small-Scale Dairy Farms in Lembang, West-Java. Wageningen: Wageningen Livestock Research.
10
De VriesM.WoutersA. P.VellingaT. V. (2017). Environmental impacts of dairy farming in Lembang, West Java; estimation of greenhouse gas emissions and effects of mitigation strategies. CCAFS Working Paper no. 221. CGIAR Research Program on Climate Change, Agriculture and Food Security (CCAFS) (Wageningen).
11
DelgadoC. L. (2003). Rising consumption of meat and milk in developing countries has created a new food revolution. J. Nutrit.133, 3907s−3910s. 10.1093/jn/133.11.3907S
12
FAO (2005). Fertilizer Use by Crop in Indonesia. Rome: Food and Agriculture Organization of the United Nations.
13
FAO and ILRI (2016). Gold Standard. Smallholder Dairy Methodology: Draft Methodology for Quantification of GHG Emission Reductions From Improved Management in Smallholder Dairy Production System using a Standardized Baseline. Rome: Food and Agriculture Organization of the United Nations (FAO).
14
FAOSTAT (2014). FAOSTAT Database, Food and Agriculture Organization of the United Nations. Rome. Available online at: http://www.fao.org/faostat/
15
GargM. R.SherasiaP. L.PhondbaB. T.MakkarH. P. S. (2018). Greenhouse gas emission intensity based on lifetime milk production of dairy animals, as affected by ration-balancing program. Anim. Prod. Sci.58, 1027–1042. 10.1071/AN15586
16
GautierL. C. M. (2017). Estimation of nitrogen and phosphorus balances at smallholder dairy farms in Lembang, Indonesia (MSc thesis). Wageningen University and Research, The Netherlands.
17
GerberP.VellingaT.OpioC.SteinfeldH. (2011). Productivity gains and greenhouse gas emissions intensity in dairy systems. Livest. Sci.139, 100–108. 10.1016/j.livsci.2011.03.012
18
GerberP. J.SteinfeldH.HendersonB.MottetA.OpioC.DijkmanJ.et al. (2013). Tackling Climate Change Through Livestock – A Global Assessment of Emissions and Mitigation Opportunities. Rome: Food and Agriculture Organization of the United Nations (FAO).
19
Hafidawati LestariP.SofyanA. (2017). Emission factors of black carbon (BC) from rice straw open burning specific to District Cianjur, West Java, Indonesia. Inter. J. GEOMATE13, 126–130. 10.21660/2017.36.2792
20
HeinrichsA. J.ErbH. N.RogersG. W.CooperJ. B.JonesC. M. (2007). Variability in Holstein heifer heart-girth measurements and comparison of prediction equations for live weight. Prev. Vet. Med.78, 333–338. 10.1016/j.prevetmed.2006.11.002
21
IPCC (2014). IPCC 2006 Guidelines for National Greenhouse Gas Inventories prepared by the National Greenhouse Gas Inventories Programme, Updated 2014. eds EgglestonH. S.BuenidaL.MiwaK.NagaraT.TanabeK. (Hayama: IGES).
22
IPNI (2011). Phoshorus Application on Wheat in SE Australia. 4R Nutrient Best Practices. IPNI. Available online at: http://anz.ipni.net/article/ANZ-3054
23
IRRI (2004). Increasing Productivity of Intensive Rice Systems Through Site-Specific Nutrient Management, eds DobermannA.WittC.DaweD.. Manila: IRRI.
24
KleenJ. L.HooijerG. A.RehageJ.NoordhuizenJ. P. (2003). Subacute ruminal acidosis (SARA): a review. J. Vet. Med. Physiol. Pathol. Clin. Med.50, 406–414. 10.1046/j.1439-0442.2003.00569.x
25
LorenzH.ReinschT.HessS.TaubeF. (2019). Is low-input dairy farming more climate friendly? A meta-analysis of the carbon footprints of different production systems. J. Clean. Prod.211, 161–170. 10.1016/j.jclepro.2018.11.113
26
MacLeodM.GerberP.MottetA.TempioG.FalcucciA.OpioC.et al. (2013). Greenhouse Gas Emissions From Pig and Chicken Supply Chains–A Global Life Cycle Assessment. Rome: Food and Agriculture Organization of the United Nations (FAO).
27
MacLeodM. J.VellingaT.OpioC.FalcucciA.TempioG.HendersonB.et al. (2017). Invited review: A position on the Global Livestock Environmental Assessment Model (GLEAM). Animal 12, 383–397. 10.1017/S1751731117001847
28
MostertP. F.van MiddelaarC. E.BokkersE. A. M.de BoerI. J. M. (2018). The impact of subclinical ketosis in dairy cows on greenhouse gas emissions of milk production. J. Clean. Prod.171, 773–782. 10.1016/j.jclepro.2017.10.019
29
MuW.KanellopoulosA.van MiddelaarC. E.StilmantD.BloemhofJ. M. (2018). Assessing the impact of uncertainty on benchmarking the eco-efficiency of dairy farming using fuzzy data envelopment analysis. J. Clean. Prod.189, 709–717. 10.1016/j.jclepro.2018.04.091
30
NortonR. M.vanderMarkE. (2016). Nitrogen performance indicators for southern Australian grain farms, in Presented at the International Nitrogen Conference, ed AngusJ. (Melbourne, VIC).
31
OECD/FAO (2017). Dairy and Dairy Products, in OECD-FAO Agricultural Outlook 2017–2026. (Paris: OECD Publishing).
32
OenemaO.OudendagD.VelthofG. L. (2007). Nutrient losses from manure management in the European Union. Livest. Sci.112, 261–272. 10.1016/j.livsci.2007.09.007
33
OpioC.GerberP.MottetA.FalcucciA.TempioG.MacLeodM.et al. (2013). Greenhouse Gas Emissions From Ruminant Supply Chains–A Global Life Cycle Assessment. Rome: Food and Agriculture Organization of the United Nations (FAO).
34
PetersenS. O.SommerS. G.BélineF.BurtonC.DachJ.DourmadJ. Y.et al. (2007). Recycling of livestock manure in a whole-farm perspective. Livest. Sci.112, 180–191. 10.1016/j.livsci.2007.09.001
35
TaufiqF. M.PadmiT.RahardyanD. B. (2016). Life cycle assessment of dairy farms. Rev. Environ. Health31, 187–190. 10.1515/reveh-2015-0037
36
ThomaG.JollietO.WangY. (2013). A biophysical approach to allocation of life cycle environmental burdens for fluid milk supply chain analysis. Inter. Dairy J.31, 41–S49. 10.1016/j.idairyj.2012.08.012
37
TuyenD. V.PhuongH. N.ConeJ. W.BaarsJ. J. P.SonnenbergA. S. M.HendriksW. H. (2013). Effect of fungal treatments of fibrous agricultural by-products on chemical composition and in vitro rumen fermentation and methane production. Biores. Technol.129, 256–263. 10.1016/j.biortech.2012.10.128
38
Van MiddelaarC. E.BerentsenP. B. M.DijkstraJ.De BoerI. J. M. (2013). Evaluation of a feeding strategy to reduce greenhouse gas emissions from dairy farming: the level of analysis matters. Agr. Syst.121, 9–22. 10.1016/j.agsy.2013.05.009
39
Van ZantenH. E.HerreroM.Van HalO.RöösE.MullerA.GarnettT.et al. (2018). Defining a land boundary for sustainable livestock consumption. Glob. Change Biol.24, 4185–4194. 10.1111/gcb.14321
40
VellingaT. V.BlonkH.MarinussenM.van ZeistW. J.de BoerI. J. M. (2012). Methodology Used in Feedprint: a Tool Quantifying Greenhouse Gas Emissions of Feed Production and Utilization. Lelystad/Gouda: Wageningen UR Livestock Research and Blonk Consultants.
41
VellingaT. V.de VriesM. (2018). Effectiveness of climate change mitigation options considering the amount of meat produced in dairy systems. Agr. Syst.162, 136–144. 10.1016/j.agsy.2018.01.026
42
VerweijJ. W. (2017). Manure management at smallholder dairy farms in Lembang, Indonesia (MSc thesis). Wageningen University and Research, Netherlands.
Summary
Keywords
dairy cattle, greenhouse gases, climate change mitigation, feeding, manure management
Citation
de Vries M, Zahra WA, Wouters AP, van Middelaar CE, Oosting SJ, Tiesnamurti B and Vellinga TV (2019) Entry Points for Reduction of Greenhouse Gas Emissions in Small-Scale Dairy Farms: Looking Beyond Milk Yield Increase. Front. Sustain. Food Syst. 3:49. doi: 10.3389/fsufs.2019.00049
Received
21 October 2018
Accepted
11 June 2019
Published
04 July 2019
Volume
3 - 2019
Edited by
Mario Herrero, Agriculture and Food, Commonwealth Scientific and Industrial Research Organisation, Australia
Reviewed by
Margaret Gill, University of Aberdeen, United Kingdom; Justice Nyamangara, Marondera University of Agricultural Sciences and Technology (MUAST), Zimbabwe
Updates
Copyright
© 2019 de Vries, Zahra, Wouters, van Middelaar, Oosting, Tiesnamurti and Vellinga.
This is an open-access article distributed under the terms of the Creative Commons Attribution License (CC BY). The use, distribution or reproduction in other forums is permitted, provided the original author(s) and the copyright owner(s) are credited and that the original publication in this journal is cited, in accordance with accepted academic practice. No use, distribution or reproduction is permitted which does not comply with these terms.
*Correspondence: Marion de Vries marion.devries@wur.nl
This article was submitted to Climate-Smart Food Systems, a section of the journal Frontiers in Sustainable Food Systems
Disclaimer
All claims expressed in this article are solely those of the authors and do not necessarily represent those of their affiliated organizations, or those of the publisher, the editors and the reviewers. Any product that may be evaluated in this article or claim that may be made by its manufacturer is not guaranteed or endorsed by the publisher.