Evidence Synthesis as the Basis for Decision Analysis: A Method of Selecting the Best Agricultural Practices for Multiple Ecosystem Services
 Gorm E. Shackelford1,2*
  Rodd Kelsey3
  William J. Sutherland1,2
  Christina M. Kennedy4
  Stephen A. Wood5,6
  Sasha Gennet7
  Daniel S. Karp8
  Claire Kremen9,10
  Nathaniel E. Seavy11
  Julie A. Jedlicka12 Kelly Gravuer5,13 Sara M. Kross14 Deborah A. Bossio15
  Andrés Muñoz-Sáez16
  Deirdre G. LaHue17
  Kelly Garbach11 Lawrence D. Ford18 Mark Felice19 Mark D. Reynolds7 Devii R. Rao20 Kathleen Boomer21 Gretchen LeBuhn22
  Lynn V. Dicks23
- 1Conservation Science Group, Department of Zoology, University of Cambridge, Cambridge, United Kingdom
- 2BioRISC (Biosecurity Research Initiative at St. Catharine's), St. Catharine's College, Cambridge, United Kingdom
- 3The Nature Conservancy, Sacramento, CA, United States
- 4The Nature Conservancy, Fort Collins, CO, United States
- 5The Nature Conservancy, Arlington, VA, United States
- 6Yale School of Forestry & Environmental Studies, New Haven, CT, United States
- 7The Nature Conservancy, San Francisco, CA, United States
- 8Department of Wildlife, Fish, and Conservation Biology, University of California, Davis, Davis, CA, United States
- 9Department of Environmental Science, Policy, and Management, University of California, Berkeley, Berkeley, CA, United States
- 10Institute of Resources, Environment and Sustainability, University of British Columbia, Vancouver, CA, United States
- 11Point Blue Conservation Science, Petaluma, CA, United States
- 12Missouri Western State University, Saint Joseph, MO, United States
- 13Center for Biodiversity Outcomes, Arizona State University, Tempe, AZ, United States
- 14Department of Ecology, Evolution & Environmental Biology, Columbia University, New York, NY, United States
- 15The Nature Conservancy, Santa Cruz, CA, United States
- 16Center of Applied Ecology and Sustainability (CAPES), Pontificia Universidad Católica de Chile, Santiago, Chile
- 17Department of Crop and Soil Sciences, Washington State University, Mount Vernon, WA, United States
- 18LD Ford Rangeland Conservation Science, Felton, CA, United States
- 19Department of Land, Air and Water Resources, University of California, Davis, Davis, CA, United States
- 20University of California Cooperative Extension, Hollister, Hollister, CA, United States
- 21The Nature Conservancy, Bethesda, MD, United States
- 22Department of Biology, San Francisco State University, San Francisco, CA, United States
- 23School of Biological Sciences, University of East Anglia, Norwich, United Kingdom
Agricultural management practices have impacts not only on crops and livestock, but also on soil, water, wildlife, and ecosystem services. Agricultural research provides evidence about these impacts, but it is unclear how this evidence should be used to make decisions. Two methods are widely used in decision making: evidence synthesis and decision analysis. However, a system of evidence-based decision making that integrates these two methods has not yet been established. Moreover, the standard methods of evidence synthesis have a narrow focus (e.g., the effects of one management practice), but the standard methods of decision analysis have a wide focus (e.g., the comparative effectiveness of multiple management practices). Thus, there is a mismatch between the outputs from evidence synthesis and the inputs that are needed for decision analysis. We show how evidence for a wide range of agricultural practices can be reviewed and summarized simultaneously (“subject-wide evidence synthesis”), and how this evidence can be assessed by experts and used for decision making (“multiple-criteria decision analysis”). We show how these methods could be used by The Nature Conservancy (TNC) in California to select the best management practices for multiple ecosystem services in Mediterranean-type farmland and rangeland, based on a subject-wide evidence synthesis that was published by Conservation Evidence (www.conservationevidence.com). This method of “evidence-based decision analysis” could be used at different scales, from the local scale (farmers deciding which practices to adopt) to the national or international scale (policy makers deciding which practices to support through agricultural subsidies or other payments for ecosystem services). We discuss the strengths and weaknesses of this method, and we suggest some general principles for improving evidence synthesis as the basis for multi-criteria decision analysis.
Introduction
What Are the Best Management Practices for Multiple Ecosystem Services?
To meet global Sustainable Development Goals (United Nations, 2015), farmlands, rangelands, and other agroecosystems will need to be managed not only for food production but also for other ecosystem services, such as soil fertility, water quality, climate regulation, pollination, pest regulation, and biodiversity conservation (Millennium Ecosystem Assessment, 2005; Wood et al., 2018). It will be difficult to decide how best to manage these agroecosystems, because management practices often cause trade-offs between different ecosystem services, such as increases in food production but decreases in water quality due to increases in fertilizer use (Zhang et al., 2007; Power, 2010; Howe et al., 2014). Some of these trade-offs could potentially be managed by spatially prioritizing different ecosystem services in different places (Shackelford et al., 2015). Others will need to be managed in the same place, at the same time, in multifunctional landscapes that combine food production with other ecosystem services, as part of the “sustainable intensification” or “ecological intensification” of agriculture (The Royal Society, 2009; Bommarco et al., 2013;Lescourret et al., 2015).
To make evidence-based decisions about the management of these agricultural landscapes, scientists will need to provide evidence for the effects of management practices on multiple ecosystem services, and decision makers will need to use this evidence to decide which practices should be implemented (Bennett et al., 2009; Birkhofer et al., 2015; Martinez-Harms et al., 2015). Our objective in this publication is to show how evidence for a wide range of management practices can be reviewed and summarized (“subject-wide evidence synthesis”), and how this evidence can be assessed by experts and used for decision making (“multiple-criteria decision analysis”). We begin by introducing multi-criteria decision analysis and subject-wide evidence synthesis. We then suggest a methodological pipeline that could be used to connect these two methods, and we show how these methods could be used by The Nature Conservancy (TNC) in California to select the best management practices for multiple ecosystem services. We end by discussing some general principles for evidence-based decision analysis.
Multiple-Criteria Decision Analysis: What Evidence Is Needed?
Multiple-criteria decision analysis (MCDA; hereafter, “decision analysis”) is a set of methods that are used for deciding between multiple alternatives based on multiple criteria (Belton and Stewart, 2002). These methods have been used for decades in environmental management (Kiker et al., 2005; Langemeyer et al., 2016; Adem Esmail and Geneletti, 2018), and they are suitable for making decisions about the management of multiple ecosystem services (Saarikoski et al., 2016). A common method of decision analysis is to rank the alternatives from highest to lowest priority, by calculating the relative value of each alternative (for each criterion), weighting it by the relative value of each criterion to the stakeholders, and then summing these weighted values across all criteria. The alternative with the highest value is the highest priority (e.g., the “best management practice”).
The data that are needed for decision analysis include “performance measures” for each alternative—for example, the effect of each management practice on each ecosystem service—and the careful selection of performance measures is critical to the decision-making process (Gregory et al., 2012). Performance measurement is also known as “impact assessment” or “criteria assessment” (e.g., Saarikoski et al., 2016; Adem Esmail and Geneletti, 2018). Performance measures are the raw data for calculating the relative value of each alternative. Performance measures can be estimated by eliciting opinions from experts, extracting data from scientific publications, or using models of scientific data (Kiker et al., 2005; Gregory et al., 2012). However, the validity of these different methods of performance measurement have not yet been widely considered in decision analysis (but see Pashaei Kamali et al., 2017).
We suggest that decision analysis should be based on robust methods of evidence synthesis, instead of using performance measures that have been non-systematically selected (“cherry picked”) or elicited from experts without explicit reference to an evidence base. In some cases, experts may be able to provide acceptable performance measures without explicit reference to an evidence base (Pashaei Kamali et al., 2017). However, decision analysis would be more inclusive, rigorous, and transparent (cf. Donnelly et al., 2018), and would better fulfill the ideals of “evidence-based practice” (e.g., Pullin and Knight, 2003; Sutherland et al., 2004), if it were based on robust methods of evidence synthesis.
Subject-Wide Evidence Synthesis: What Evidence Is Available?
Evidence synthesis is a set of methods that are used for systematically collecting and summarizing knowledge (Donnelly et al., 2018). These methods include rapid evidence assessments, summaries of scientific studies, systematic reviews with meta-analysis, and expert consultation (Dicks et al., 2017). Systematic reviews are seen as the “gold standard” method of evidence synthesis, but it is also possible to use a subset of methods from systematic reviews (e.g., transparent search strategies and inclusion criteria) to increase the reliability of rapid reviews, in situations where full systematic reviews are not possible (Haddaway et al., 2015; Donnelly et al., 2018).
An average systematic review in environmental sciences takes about one person-year and costs about £50,000–£100,000, depending on overheads and other costs (Haddaway and Westgate, 2019, based on systematic reviews in the Collaboration for Environmental Evidence). Moreover, an average systematic review is focused on only a narrow range of research questions (Dicks et al., 2014b). For example, a systematic review might show the effects of one “intervention” on one “outcome” (e.g., the effects of one agricultural practice on one ecosystem service) (cf. James et al., 2016). Thus, the cost of a robust evidence base for decision analysis could be as high as £100,000 (or one person-year), multiplied by the number of interventions to be reviewed, multiplied by the number of outcomes to be reviewed, if all of these interventions and outcomes have to be reviewed separately. This could be prohibitively expensive.
However, if multiple interventions and outcomes could be reviewed at the same time, then the cost could be reduced through economies of scale. For example, publications that included data on multiple interventions or outcomes would only need to be read once, and all of the data could be extracted at the same time. This is the argument for a more cost-effective method of evidence synthesis, called “subject-wide evidence synthesis” (Sutherland and Wordley, 2018; Sutherland et al., 2019), in which all of the interventions in a broad subject area are reviewed at the same time (e.g., all interventions for bird conservation). A subject-wide evidence synthesis is more expensive than a single review (e.g., a review of one intervention for bird conservation), but it is a cost-effective method of doing multiple reviews in the same subject-area at the same time (and it could even be cheaper if these reviews were rapid reviews, rather than systematic reviews). For these reasons, we suggest that subject-wide evidence synthesis could be used as a cost-effective source of evidence for multiple-criteria decision analysis.
Methods
A Methodological Pipeline for Evidence-Based Decision Making
We show how subject-wide evidence synthesis and multiple-criteria decision analysis could be connected to form a methodological pipeline for evidence-based decision making (Figure 1). This pipeline flows from “evidence” to “performance measures” using subject-wide evidence synthesis. Subject-wide evidence synthesis could include expert assessment, meta-analysis, or some combination of meta-analysis and expert assessment as methods of deriving performance measures from the evidence (e.g., the effect sizes from a meta-analysis may need to be interpreted by experts, to differentiate effects that are only statistically significant from effects that are above or below some threshold of performance). The pipeline then flows from “performance measures” to “value scores” (e.g., Belton and Stewart, 2002). For example, if the evidence synthesis shows that a management practice results in some amount of biodiversity conservation (a performance measure), then this amount of biodiversity conservation is converted into some amount of value (a value score). The pipeline then flows from “value scores” to “priority scores” using relative weights (value judgements made by stakeholders). For example, it could be that biodiversity conservation is given only half the weight of food production in the decision analysis. The pipeline then flows from “priority scores” to a “decision” through a process of deliberation (e.g., Gregory et al., 2012). For example, the decision could be that the management practice with the highest priority score is indeed the best management practice, or else the decision could be that some previous section of this methodological pipeline needs to be revisited (e.g., re-weighting the value scores or re-assessing the evidence, if the results of the decision analysis seem perverse). “Evidence synthesis” includes the first two sections of this pipeline (from evidence to performance measures in Figure 1). “Decision analysis” includes the last three sections (from value scores to decisions in Figure 1). We show how this methodological pipeline could be used to select the best management practices for multiple ecosystem services, based on Conservation Evidence.
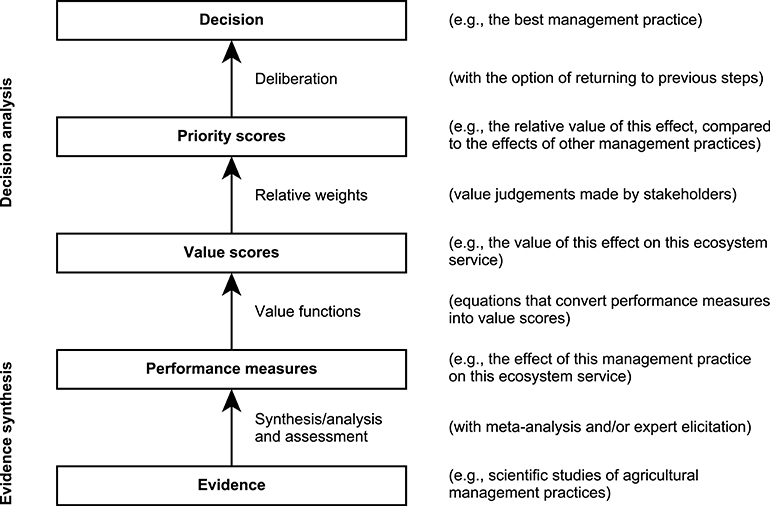
Figure 1. A method of evidence-based decision analysis.
Conservation Evidence
Conservation Evidence (www.conservationevidence.com) provides summaries of scientific studies about conservation practices (including agricultural practices). Conservation Evidence uses two methods of evidence synthesis: (1) subject-wide evidence synthesis, in which scientific studies of conservation practices are collected and summarized in “synopses” of evidence, and (2) expert elicitation, in which the summarized evidence is assessed by experts, and each conservation practice is assigned to an “effectiveness category” (Dicks et al., 2014a, 2016; Sutherland et al., 2019). The Conservation Evidence Synopsis on farmland and rangeland in California and the Mediterranean (Shackelford et al., 2017) is a subject-wide evidence synthesis that was written as part of a collaboration with The Nature Conservancy (TNC) in California. It summarizes the effects of 20 management practices on seven ecosystem services in 762 paragraphs: one paragraph for each study that quantitatively tested the effects of one management practice on one ecosystem service (see Figure 2 for management practices and ecosystem services). For information on the search strategy, inclusion criteria, and other methods, see Shackelford et al. (2017), and please note that we consider this synopsis to be a collection of rapid reviews, not systematic reviews. The twenty management practices and seven ecosystem services that were summarized were based on the interests of TNC in California.
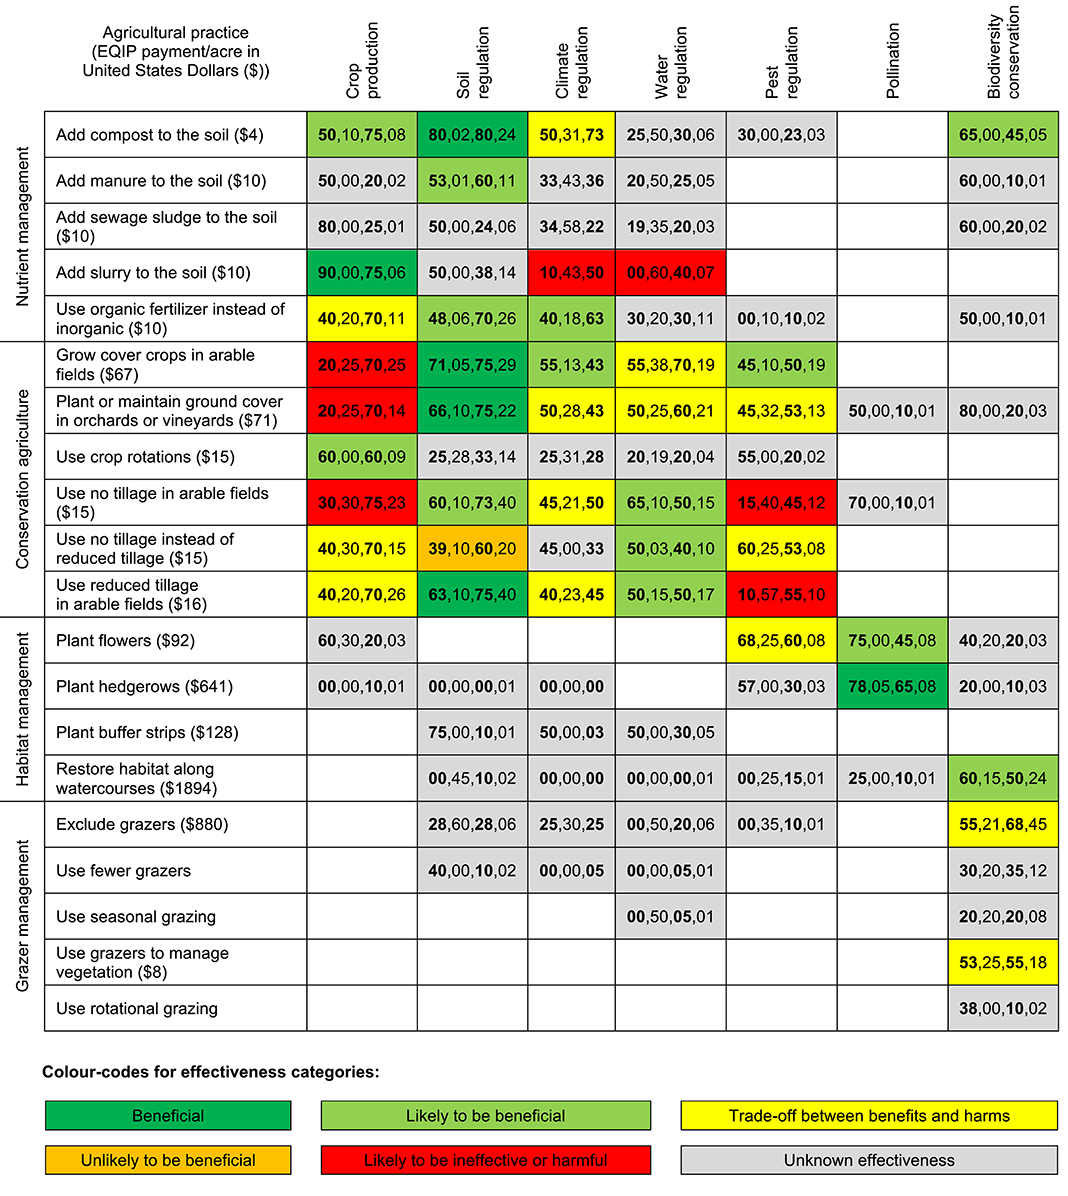
Figure 2. The effects of management practices on multiple ecosystem services in California and other Mediterranean farming systems (based on the evidence summarized by Shackelford et al., 2017). The results of the evidence assessment are shown as comma-separated values in this order: benefits score, harms score, certainty score, number of summarized studies on which these scores are based (the same studies were assessed for soil and climate regulation). These scores were used as “performance measures” in the multiple-criteria decision analysis.
After the synopsis was written, the summarized evidence was assessed by a group of 23 academics, agricultural consultants, and TNC staff, including many of the authors of this publication. Most of these people were based at institutions in California (please see the author list and author contributions) and their expertise included farmland and rangeland management. The results of this assessment have already been published on www.conservationevidence.com, but the methods have not been published. Therefore, we describe the methods below, and then we show how the results of this assessment could be used as performance measures for decision analysis.
A modified Delphi method was used to assess the evidence. The Delphi method is a method of expert elicitation that uses several rounds of anonymous scoring and commenting to minimize bias in decisions made by groups (Mukherjee et al., 2015). A similar method has been used for other assessments of Conservation Evidence (Dicks et al., 2016; Sutherland et al., 2017a). On average, ten people assessed the effects of each practice on each service (9.5 ± 2.2; mean ± standard deviation). Each person scored the “benefits” and “harms” of each practice and the “certainty” of the evidence, for each ecosystem service for which there was evidence (“Round 1”). These scores were based on the summarized evidence in the synopsis, not evidence from other sources. The scores were on a scale from 0 to 100 (where 0 was supposed to mean no benefits or harms and 100 was supposed to mean maximum benefits or harms). The scores were supposed to include the frequency and magnitude of benefits or harms, as well as the relative importance of different measurements (e.g., nitrate leaching vs. water quality as measurements of “water regulation”). Some people wrote comments to explain their scores. The scores and comments were anonymous in all rounds. After Round 1, each practice was assigned to an “effectiveness category” for each ecosystem service, based on its median scores for benefits, harms, and certainty (Table 1). Each person compared his or her own scores to the median scores for the group, read the comments from others in the group, and agreed or disagreed with the category to which each practice had been assigned (“Round 2”). Some people also wrote comments to explain their agreement or disagreement. If ≥ 33% of people disagreed with a category (an arbitrary threshold that was set by GES, RK, and LVD before the assessment began), then each person read the comments and re-scored the evidence for that practice, with respect to that service (“Round 3”). That practice was then re-assigned to an effectiveness category. All of this was anonymous, to reduce bias.
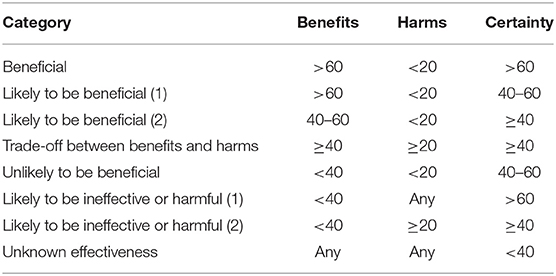
Table 1. Effectiveness categories, defined by the median scores from the evidence assessment (based on Sutherland et al., 2017a).
From Subject-Wide Evidence Synthesis to Multiple-Criteria Decision Analysis
We used the benefits, harms, and certainty scores from evidence assessment (described above) as the basis for the decision analysis (described below). We did not include practices with certainty scores <40 (the threshold for “unknown effectiveness” in the Conservation Evidence project), but users of this decision-support system can set their own thresholds using our web application (see below). To show how additional evidence could be included in this process, we also used the Environmental Quality Incentives Program (EQIP) Payment Schedule for California in 2017 (NRCS, 2016) as evidence of cost (a criterion for which there was no evidence in the Conservation Evidence Synopsis). This payment schedule shows the amount of money that was payable to farmers for implementing these practices through the Natural Resources Conservation Service (NRCS) (Table S1).
We used a “value-function” method (Belton and Stewart, 2002), which is a common method of decision analysis for ecosystem services (Langemeyer et al., 2016). In other words, we transformed the scores from the evidence assessment into “value” scores on a standardized scale from low value to high value (a scale from 0 to 1) (e.g., Edwards and Barron, 1994; Belton and Stewart, 2002). The reason for this transformation from “performance” to “value” is that (1) performance may be measured on different scales for different criteria, (2) low performance could be a good thing for some criteria (e.g., low harms) and a bad thing for other criteria (e.g., low benefits), and (3) the relationship between performance and value may not be linear (e.g., an increase from low to medium performance may be more valuable than an increase from medium to high performance), and thus it may be necessary to model this relationship using a non-linear value function. We then used a weighted linear equation to aggregate these value scores for each management practice across all ecosystem services, which is a standard method in decision analysis (e.g., Huang et al., 2011). Different methods of decision analysis, such as the Analytic Hierarchy Process (AHP), could also be used, and these methods would offer different strengths and weaknesses (Belton, 1986). Our objective here is not to suggest that there is only one method of using evidence for decision analysis, but only show that it is possible to use evidence at this scale. In the equations, below, we show the steps we took to transform the scores from the evidence assessment into value scores. However, this should be seen as only one example of many possible methods.
Examples of our calculations are shown in Table 2. For benefits scores, we based our calculations on “Type a” value functions: linear functions that transform a high performance measure into a high value (higher benefits = higher value) (Edwards and Barron, 1994). For harms scores and for costs, we based our calculations on “Type b” value functions: linear functions that transform a low performance measure into a high value score (lower cost = higher value; lower harm = higher value) (Edwards and Barron, 1994). In the following equations, i is a unique combination of one management practice and one ecosystem service. For example, benefiti is the benefits score for one management practice with respect to one ecosystem service, and benefits (without a subscript) is the set of all of these benefits scores.
The management practice with the highest normalized priority was the best practice for that ecosystem service. It is called a “normalized” priority because it has been converted to a proportion in Step 5. The best practice had a normalized priority of 1.00, and the other practices had priorities that were proportions of the best practice. For example, a practice with a priority of 0.96 had a priority that was 96% as high as the best practice. The normalized priority of each practice with respect to cost was calculated using a similar procedure, but it was simpler, since it did not require separate steps for combining benefits, harms, and certainty. In the following equations, which replace steps 1–5, i is a unique combination of one management practice and its cost. For example, cost valuei is the value of the cost of one management practice, and cost value (without a subscript) is the set of all of these cost values.
In the following equations, priorityi is the normalized priority of one management practice with respect to one criterion (ecosystem service or cost), weighti is the weight of that criterion (see below), priorityj is the priority of one management practice with respect to all criteria, n is the number of criteria, and priority (without a subscript) is the set of all priorityj.
The management practice with the highest normalized priority was the best practice for all criteria. Step 6 is the weighted linear equation that is often used to aggregate value scores across all criteria in a decision analysis (e.g., Huang et al., 2011).
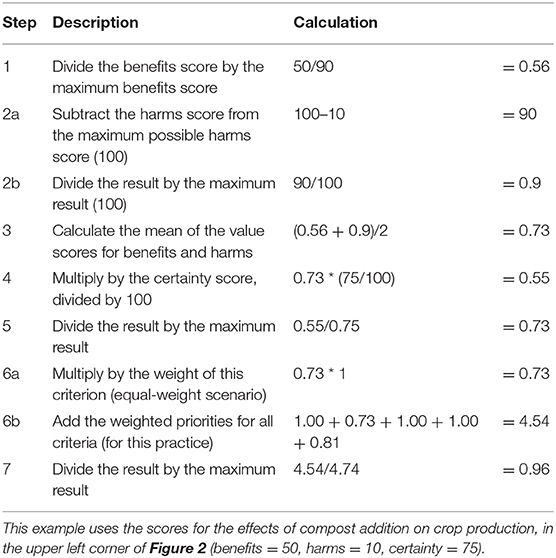
Table 2. The calculation of value scores and priority scores from harms, benefits, and certainty scores.
The weight of each criterion (weighti) is a value judgment that needs to be made by stakeholders (Belton and Stewart, 2002). For the purposes of this example, we imagined three hypothetical stakeholders: one stakeholder for whom all criteria have weights of 1 (the “equal-weight scenario”), one stakeholder for whom crop production and soil fertility (which could be considered “private” benefits) have weights of 1 and all other criteria have weights of 0 (the “private-stakeholder scenario”), and one stakeholder for whom biodiversity conservation and climate regulation (which could be considered “public” benefits) have weights of 1, and all other criteria have weights of 0 (the “public-stakeholder scenario”). These scenarios are arbitrary and overly simplistic, and they are used here only to show how these methods could account for stakeholders with different preferences. It would also be possible to use surveys, workshops, or other methods to collect data on stakeholder preferences and use these as weights.
Web Application
We used the shiny package for R (Chang et al., 2017) to develop our decision-support system as a web app (http://mcda.metadataset.com/mediterranean). It calculates the priority of each practice using multiple-criteria decision analysis (i.e., it takes the steps in Table 2). Users can score the evidence for themselves, or they can keep the default scores from our assessment. They can assign weights to each criterion, and they can assign weights to benefits and harms. They can decide whether the benefits and harms scores should be weighted by the certainty scores and whether the priority score of a practice should be 0 for a criterion with no evidence (the default, which is the equivalent of no benefits and no harms, or no certainty) or 0.5 (which is the equivalent of no benefits, no harms, and 100% certainty). This is because the priority score for a practice across all criteria is substantially reduced if its priority score for some criteria is 0.
We used the web app to show how the best practices could be selected for the three hypothetical stakeholder scenarios that we described above, and we refer to these three analyses as the “main analyses.” As “sensitivity analyses,” we compared the results from these three scenarios, and we also compared the results from two other analyses (assuming priority scores of 0.5 for missing data and not weighting by certainty), to see whether the same practices were high priorities under different sets of assumptions. We also asked staff from The Nature Conservancy (TNC) in California to test the web app. These staff are responsible for making decisions about agricultural management practices for properties that are owned by TNC in the Santa Clara Valley of California. They need to consider multiple criteria when making these decisions. This provided a practical example of decision analysis, as a counterpoint to our theoretical example.
Results
Subject-Wide Evidence Synthesis
The effectiveness categories from our assessment of the Conservation Evidence Synopses are shown in Figure 2. Of the 91 combinations of practices and services that we assessed, 42 were assigned to a category other than “unknown effectiveness” (because the certainty scores were sufficiently high). Only one practice had evidence for all seven services (planting or maintaining ground cover in vineyards or orchards). Only one practice was assessed as “beneficial” or “likely to be beneficial” for pest regulation (growing cover crops in arable fields), but at least two practices were assessed as “beneficial” or “likely to be beneficial” for each of the other services. Effects on soil fertility and pollination were never assessed as “likely to be ineffective or harmful” or “trade-off between benefits and harms” (but there was less evidence for pollination than any other service). In contrast, there were some practices that were assessed as “trade-off between benefits and harms” or “likely to be ineffective or harmful” for each of the other five services. No practice was “beneficial” or “likely to be beneficial” for all of the services, which shows the need for multiple-criteria decision analysis to select the best practice when considering all of these services.
Multiple-Criteria Decision Analysis
A screenshot from the web app is shown in Figure 3, and the data and R code for the web app are provided in Files S1 and S2. The “best management practice” (BMP) for each criterion in the equal-weight scenario is shown in Table 3 (the BMP is the practice with the highest priority score for each criterion). For example, adding slurry to the soil was the BMP for crop production, and excluding grazers was the BMP for biodiversity conservation. For some criteria, there was only a small difference in priority between the best practice and the second-best practice. For example, growing cover crops was the BMP for water regulation, but using no tillage had a priority score of 0.93 (i.e., a priority score that was 93% as high as that of growing cover crops), and five practices had priority scores of 1.00 for cost (i.e., there were multiple BMPs for cost). The BMP for all criteria is shown in Table 4. In all three scenarios, adding compost to the soil was a high priority. High priority practices in the main analysis were also high priority practices in other analyses (Table 5), but the order of priorities changed slightly (e.g., the best practice became the second-best or third-best practice).
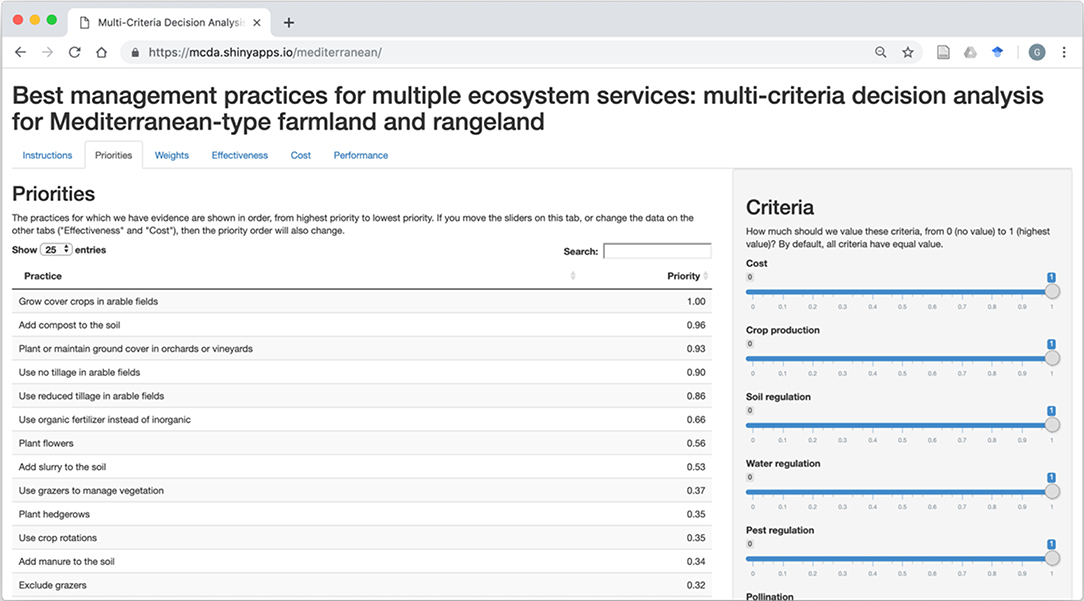
Figure 3. A screenshot from the web app for multiple-criteria decision analysis (http://mcda.metadataset.com/mediterranean/).
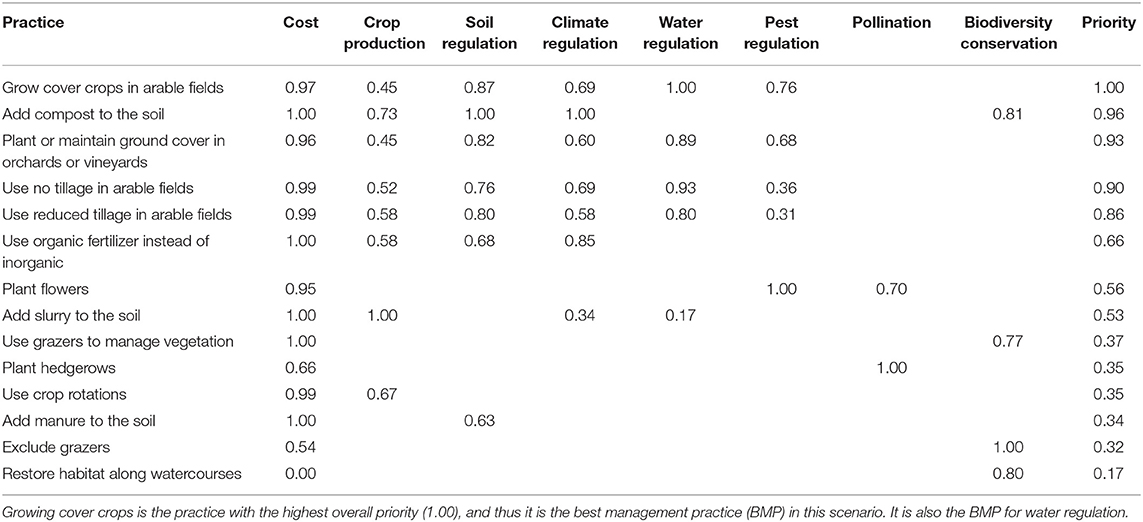
Table 3. Best management practices (BMPs) for farmland and/or rangeland in California and other Mediterranean farming systems: priority scores in the equal-weight scenario (but see the Discussion for the limitations of this prototype).
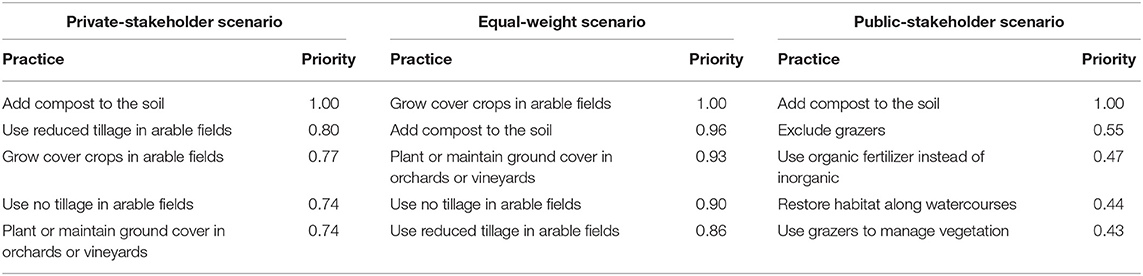
Table 4. Comparison of the five best management practices in three hypothetical scenarios.
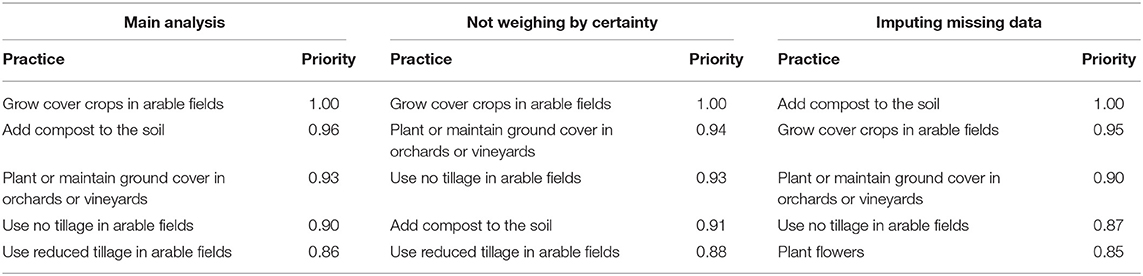
Table 5. Comparison of the five best management practices in the main analysis and the sensitivity analyses (equal-weight scenario).
The staff of TNC in California decided to use the web app to consider different “scenarios” for the Santa Clara Valley: (1) prioritizing agricultural/production outcomes (“farmer priorities”) or (2) prioritizing biodiversity/conservation outcomes (“TNC priorities”). Three people used the web app separately to set weights for each of these two scenarios, and then they compared their results (one person also set weights for “balanced priorities” as a third scenario). Thus, they considered three sets of weights for the first two scenarios and one set of weights for the third scenario (Table S2). Growing cover crops was the best or second-best practice for all seven sets of weights, and adding compost was the best or second best in five of seven sets (but only one of three sets for “farmer priorities”) (Table S3).
Discussion
Based on 323 scientific publications that were summarized in 762 paragraphs, we assessed the evidence for 91 combinations of management practices and ecosystem services. We then used the outputs of this evidence synthesis as inputs for decision analysis. We were able to use this combination of evidence synthesis and decision analysis to select management practices that seemed to be high priorities in multiple scenarios (e.g., adding compost to the soil). TNC staff were also able to use our web app to select management practices that seemed acceptable not only as “TNC priorities” but also as “farmer priorities” for the Santa Clara Valley (e.g., growing cover crops in arable fields). This shows that these methods can be used in practice, and it also shows that decision analysis can be used to identify consistent results across multiple scenarios. However, these results should only be seen as an example of these methods, and we do not focus on the details of these results in this publication. We use these results only to consider the strengths and weaknesses of these methods, and to suggest some general principles for evidence-based decision analysis. These results should not be seen as evidence that some management practices are better than others in all situations, and decisions that are based on these methods should carefully consider these discussion points.
Evidence Synthesis Should Meet the Needs of Decision Analysis
Including the cost of writing the Conservation Evidence Synopsis (Shackelford et al., 2017), assessing the evidence (with unpaid participation by the expert assessors), and developing the web app, the process cost about £125,000 and took about two person-years. In other words, it cost perhaps as much as two systematic reviews (Haddaway and Westgate, 2019), but it provided evidence for the effectiveness of 20 management practices. It was not as robust as 20 systematic reviews would have been (and this should be seen as a weakness), but it provided evidence for a wider range of management practices, and thus we were able to use it for evidence-based decision analysis. If additional funding were available, the robustness of these methods could be increased by commissioning systematic reviews for some subset of these management practices. If systematic reviews were already available, these methods could include them without additional funding (and several meta-analyses were summarized as part of the evidence base), but the costs of additional systematic reviews would need to be carefully considered. Some combination of rapid reviews and systematic reviews could be a good compromise between cost and robustness. Management practices for which the evidence is complicated, controversial, or inconclusive could be high priorities for systematic reviews (Pullin et al., 2016). In summary, a strength of this system is that it provided evidence on the scale that was needed for decision analysis, without being prohibitively expensive, but this system would be stronger if the robustness of the evidence base could be increased through systematic reviews of high-priority topics.
Decision Makers Should Review and Reassess the Evidence
Another strength of this decision-support system is its transparency. We think it should be possible for decision makers to review the evidence scores, as well as the evidence itself (e.g., the summaries of individual studies in the Conservation Evidence Synopsis), and reassess the evidence from a different perspective. For example, we were surprised that adding compost to the soil seemed to be as high a priority for biodiversity conservation as habitat restoration along watercourses (Table 3). Looking back at the evidence scores (File S1), seven out of eight people had agreed that “likely to be beneficial” was the correct category for this practice, with respect to biodiversity conservation, but looking back at the summaries of individual studies, the evidence seemed biased toward plants that were not of conservation concern. Therefore, we used the web app to test the sensitivity of these results by entering different scores for this practice. However, even with a score of zero benefits for biodiversity conservation (which could be a realistic score in some situations), compost addition was still the BMP in the public-stakeholder scenario. Thus, this system can account for different assessments of the evidence, and sensitivity analyses can be used to test the robustness of the results.
Decision Makers Should Consider the Resolution of the Evidence
Another weakness of this system is that there is no formal mechanism for weighting the evidence for sub-criteria. For example, for biodiversity conservation (criterion), there is no mechanism for weighting the evidence on bird conservation vs. plant conservation (sub-criteria). Each sub-criterion could be scored and weighted as part of a lower-level decision analysis, which could then be used as an input into a higher-level decision analysis. For example, bird conservation could be given more weight than plant conservation, which would increase the relative priority of riparian restoration vs. compost addition. However, the system would then be more complicated to use (since weights would be needed not only for each criterion but also for each sub-criterion), and the evidence synthesis would be more time-consuming to produce (because performance measures and value scores would be needed for each sub-criterion). Moreover, it could be argued that sub-sub-criteria (e.g., bird abundance vs. bird diversity) should also be scored separately, and so on. A more complicated system could be developed, if a simpler system does not capture the values of stakeholders at a suitable level of resolution. Alternatively, the evidence for one criterion could simply be rescored after reconsidering the evidence for sub-criteria.
Decision Makers Should Consider the Local Relevance of the Global Evidence
Management practices could have different effects in different soils, different landscapes, or different climates (Unger and Vigil, 1998; Batáry et al., 2011; Steward et al., 2018), and decision makers should consider whether the global evidence is relevant to their local conditions (Sutherland et al., 2017b). For example, the evidence from irrigated vegetable fields in the Salinas Valley of California may not be relevant to rainfed cereal fields in the Ebro Valley in Spain. We assessed cover cropping and no tillage as “likely to be ineffective or harmful” for crop production, but these practices could be beneficial for crop production in the drier, rainfed parts of the Mediterranean (Unger and Vigil, 1998; Pittelkow et al., 2014). Decision makers can use the web app to re-score the benefits and harms of practices based only on the evidence that they consider to be relevant to their local conditions. However, this system would be even stronger if there were an automated method for recomputing the scores for subsets of the evidence that decision makers consider to be relevant to their local conditions. These subsets could be based on variables such as crop type, soil type, irrigation system, or other implementation options that could interact with the effects of a management practice. For example, different species of cover crops, in combination with different methods of fertilization, irrigation, and tillage, could have different effects on ecosystem services, and only some of these effects may be relevant to a decision maker, if only some of these implementation options are relevant to their local conditions.
Protocols for Evidence-Based Decision Analysis Should Be Developed
To reduce bias in some fields of primary and secondary research, it is standard practice to publish “protocols” that describe the methods that will be used, before they are used (Higgins and Green, 2011; Munafò et al., 2017). Likewise, it may become necessary to publish protocols for evidence-based decision analysis, not only to reduce unintentional bias but also to reduce intentional misuse of the evidence. For example, one of the strengths of this decision-support system is its flexibility (e.g., decision makers can reassess the evidence for themselves), but this flexibility could lead to biased decisions in which weights are reassigned, or evidence is reassessed, to prioritize a preferred alternative. Decision analysis could be especially vulnerable to this bias, since it is an iterative process. Protocols could describe methods of assigning weights (e.g., using robust methods to survey stakeholders), filtering the evidence base (e.g., using evidence only from predefined countries, climate types, or experimental designs), or handling gaps in the evidence base (e.g., imputing missing values), before the decision-support system is used.
Gaps in the Evidence Base Should Be Filled
There was more evidence for the practices related to conservation agriculture and nutrient management (in the top half of Figure 2) than there was for the practices related to habitat management and grazer management (in the bottom half). There was also more evidence for services that were more strongly related to crop production (on the left half of Figure 2) than there was for services that were more strongly related to biodiversity conservation (on the right half). Indeed, different practices could be expected to have different amounts of evidence, because of the lumping or splitting of practices (e.g., three practices involving tillage and two involving cover cropping could have been lumped together as components of conservation agriculture). Different services could also be expected to have different amounts of evidence. Nevertheless, the white and gray cells in Figure 2 are gaps in the evidence base that should be filled. For example, evidence on pollination and biodiversity conservation are wide gaps.
There are also “invisible” gaps in the evidence base. For example, there are practices and services that were not reviewed in the Conservation Evidence Synopsis. Thus, it is not only the white or gray cells in Figure 2 that are gaps, but also the rows and columns that could be added to Figure 2. For example, costs were not reviewed in the Conservation Evidence Synopsis. To show how costs or other non-systematically reviewed data could be used to fill gaps in the decision analysis, we used data on costs from government payments to farmers in California. However, we suggest that systematically reviewed evidence should be used wherever possible.
There are other invisible gaps, such as the interactions between multiple practices or multiple services. For example, most experiments do not test the effects of management practices on multiple ecosystem services at the same time and in the same landscape, and evidence of the interactions between services is a gap (Shackelford et al., 2013). Moreover, management practices are likely to have different effects in different landscapes (Batáry et al., 2011) and at different scales (Cong et al., 2014). It is not obvious how some of these gaps could be filled, considering the difficulty of setting up experiments at landscape scales (Ewers et al., 2011). However, decision makers could also consider non-experimental solutions to this problem, such as InVEST models (Nelson et al., 2009), which could potentially be parameterized using summarized data from Conservation Evidence. Multiple-criteria decision analysis could also be incorporated into these landscape-scale models by identifying alternative land-use strategies that would minimize the trade-offs between multiple services (Kennedy et al., 2016).
Some of these gaps are known to exist (e.g., we know that the Conservation Evidence Synopsis did not review evidence on cost), but there may be other gaps that are not known to exist. For example, there may be new management practices that have not yet been studied scientifically, and methods of horizon scanning could be used to identify these gaps (Sutherland et al., 2014). Even if it is possible to identify these gaps, it is not likely that there will be evidence to fill them. Our web app provides one option for handling missing data (imputation), but it would also be possible to provide other options. For example, hybrid systems could be developed that are partly based on evidence, where evidence is available, and partly based on expert elicitation, where evidence is not available.
Conclusion
We have shown that subject-wide evidence synthesis can be used as the basis for multiple-criteria decision analysis. This is only one part of an ongoing process of “structured decision making” (Gregory et al., 2012), and some parts of this process are likely to be contingent upon other parts. For example, the decision to select the best management practices for an agricultural landscape could be contingent upon the decision to use that landscape for agriculture instead of some other land use [e.g., land-sparing vs land-sharing (Green et al., 2005)]. These other decisions may also need to use some form of evidence-based decision analysis, and ever larger methodological pipelines may need to be developed, to connect these decision analyses to one another. However, we are confident that integrated systems of evidence-based decision analysis can be developed, if evidence can be provided on the scale that is needed. As general principles for evidence-based decision analysis, we suggest (as discussed above) that (1) the scale of evidence synthesis should meet the needs of decision analysis, (2) decision makers should review and reassess the evidence, (3) decision makers should consider the resolution of the evidence, (4) decision makers should consider the local relevance of the global evidence, (5) protocols for evidence-based decision analysis should be developed, and (6) gaps in the evidence base should be filled.
Data Availability Statement
All datasets generated for this study are included in the manuscript/Supplementary Files.
Author Contributions
GS, RK, WS, and LD designed the research. GS led the evidence assessment, decision analysis, and manuscript writing. RK led the testing of the web app with TNC staff. All authors except RK, WS, and LD scored the evidence, and several of the authors revised the manuscript.
Funding
Funding for this project and support for GS was provided by a 2016 Science Catalyst Fund grant from The Nature Conservancy, California. GS was supported by The AG Leventis Foundation. GS and WS were supported by the David and Claudia Harding Foundation. WS was supported by Arcadia. LD was supported by the Natural Environment Research Council (NERC grants NE/K015419/1 and NE/N014472/1) and the Biotechnology and Biological Sciences Research Council (BBSRC grant BB/R016429/1).
Conflict of Interest
The authors declare that the research was conducted in the absence of any commercial or financial relationships that could be construed as a potential conflict of interest.
Acknowledgments
We thank David Williams and Rebecca Robertson for their work on the Conservation Evidence Synopsis.
Supplementary Material
The Supplementary Material for this article can be found online at: https://www.frontiersin.org/articles/10.3389/fsufs.2019.00083/full#supplementary-material
File S1. The scores from the evidence assessment.
File S2. The R code and data for the Shiny app.
Table S1. The costs of management practices.
Table S2. Weights set by the TNC staff to create different scenarios when testing the web app.
Table S3. Results from TNC staff when testing the web app using different scenarios.
References
Adem Esmail, B., and Geneletti, D. (2018). Multi-criteria decision analysis for nature conservation: a review of 20 years of applications. Methods Ecol. Evol. 9, 42–53. doi: 10.1111/2041-210X.12899
Batáry, P., Báldi, A., Kleijn, D., and Tscharntke, T. (2011). Landscape-moderated biodiversity effects of agri-environmental management: a meta-analysis. Proc. R. Soc. B Biol. Sci. 278, 1894–1902. doi: 10.1098/rspb.2010.1923
Belton, V. (1986). A comparison of the analytic hierarchy process and a simple multi-attribute value function. Eur. J. Oper. Res. 26, 7–21. doi: 10.1016/0377-2217(86)90155-4
Belton, V., and Stewart, T. J. (2002). Multiple Criteria Decision Analysis: An Integrated Approach. Oxford: Kluwer Academic Publishers.
Bennett, E. M., Peterson, G. D., and Gordon, L. J. (2009). Understanding relationships among multiple ecosystem services. Ecol. Lett. 12, 1394–1404. doi: 10.1111/j.1461-0248.2009.01387.x
Birkhofer, K., Diehl, E., Andersson, J., Ekroos, J., Früh-Müller, A., Machnikowski, F., et al. (2015). Ecosystem services—current challenges and opportunities for ecological research. Front. Ecol. Evol. 2:87. doi: 10.3389/fevo.2014.00087
Bommarco, R., Kleijn, D., and Potts, S. G. (2013). Ecological intensification: harnessing ecosystem services for food security. Trends Ecol. Evol. 28, 230–238. doi: 10.1016/j.tree.2012.10.012
Chang, W., Cheng, J., Allaire, J. J., Xie, Y., and McPherson, J. (2017). Shiny: Web Application Framework for R.
Cong, R.-G., Smith, H. G., Olsson, O., and Brady, M. (2014). Managing ecosystem services for agriculture: will landscape-scale management pay? Ecol. Economics 99, 53–62. doi: 10.1016/j.ecolecon.2014.01.007
Dicks, L., Haddaway, N., Hernández-Morcillo, M., Mattsson, B., Randall, N., Failler, P., et al. (2017). Knowledge Synthesis for Environmental Decisions: An Evaluation of Existing Methods, and Guidance for Their Selection, Use and Development: A Report from the EKLIPSE Project.
Dicks, L. V., Hodge, I., Randall, N. P., Scharlemann, J. P. W., Siriwardena, G. M., Smith, H. G., et al. (2014a). A transparent process for “evidence-informed” policy making. Conserv. Lett. 7, 119–125. doi: 10.1111/conl.12046
Dicks, L. V., Walsh, J. C., and Sutherland, W. J. (2014b). Organising evidence for environmental management decisions: a ‘4S’ hierarchy. Trends Ecol. Evol. 29, 607–613. doi: 10.1016/j.tree.2014.09.004
Dicks, L. V., Wright, H. L., Ashpole, J. E., Hutchison, J., McCormack, C. G., Livoreil, B., et al. (2016). What works in conservation? Using expert assessment of summarised evidence to identify practices that enhance natural pest control in agriculture. Biodivers. Conserv. 25, 1383–1399. doi: 10.1007/s10531-016-1133-7
Donnelly, C. A., Boyd, I., Campbell, P., Craig, C., Vallance, P., Walport, M., et al. (2018). Four principles to make evidence synthesis more useful for policy. Nature 558:361. doi: 10.1038/d41586-018-05414-4
Edwards, W., and Barron, F. H. (1994). SMARTS and SMARTER: improved simple methods for multiattribute utility measurement. Org. Behav. Human Decision Processes 60, 306–325. doi: 10.1006/obhd.1994.1087
Ewers, R. M., Didham, R. K., Fahrig, L., Ferraz, G., Hector, A., Holt, R. D., et al. (2011). A large-scale forest fragmentation experiment: the Stability of Altered Forest Ecosystems Project. Philos. Transac. R. Soc. B Biol. Sci. 366, 3292–3302. doi: 10.1098/rstb.2011.0049
Green, R. E., Cornell, S. J., Scharlemann, J. P. W., and Balmford, A. (2005). Farming and the fate of wild nature. Science 307, 550–555. doi: 10.1126/science.1106049
Gregory, R., Failing, L., Harstone, M., Long, G., McDaniels, T., and Ohlson, D. (2012). Structured Decision Making: A Practical Guide to Environmental Management Choices. Chichester: John Wiley and Sons, Ltd.
Haddaway, N. R., and Westgate, M. J. (2019). Predicting the time needed for environmental systematic reviews and systematic maps. Conserv. Biol. 33, 434–443. doi: 10.1111/cobi.13231
Haddaway, N. R., Woodcock, P., Macura, B., and Collins, A. (2015). Making literature reviews more reliable through application of lessons from systematic reviews. Conserv. Biol. 29, 1596–1605. doi: 10.1111/cobi.12541
Higgins, J. P., and Green, S. (2011). Cochrane Handbook for Systematic Reviews of Interventions. Oxford: John Wiley and Sons.
Howe, C., Suich, H., Vira, B., and Mace, G. M. (2014). Creating win-wins from trade-offs? Ecosystem services for human well-being: a meta-analysis of ecosystem service trade-offs and synergies in the real world. Global Environ. Change 28, 263–275. doi: 10.1016/j.gloenvcha.2014.07.005
Huang, I. B., Keisler, J., and Linkov, I. (2011). Multi-criteria decision analysis in environmental sciences: ten years of applications and trends. Sci. Total Environ. 409, 3578–3594. doi: 10.1016/j.scitotenv.2011.06.022
James, K. L., Randall, N. P., and Haddaway, N. R. (2016). A methodology for systematic mapping in environmental sciences. Environ. Evidence 5:7. doi: 10.1186/s13750-016-0059-6
Kennedy, C. M., Hawthorne, P. L., Miteva, D. A., Baumgarten, L., Sochi, K., Matsumoto, M., et al. (2016). Optimizing land use decision-making to sustain Brazilian agricultural profits, biodiversity and ecosystem services. Biol. Conserv. 204, 221–230. doi: 10.1016/j.biocon.2016.10.039
Kiker, G. A., Bridges, T. S., Varghese, A., Seager, T. P., and Linkov, I. (2005). Application of multicriteria decision analysis in environmental decision making. Int. Environ. Assessment Manag. 1, 95–108. doi: 10.1897/IEAM_2004a-015.1
Langemeyer, J., Gómez-Baggethun, E., Haase, D., Scheuer, S., and Elmqvist, T. (2016). Bridging the gap between ecosystem service assessments and land-use planning through Multi-Criteria Decision Analysis (MCDA). Environ. Sci. Policy 62, 45–56. doi: 10.1016/j.envsci.2016.02.013
Lescourret, F., Magda, D., Richard, G., Adam-Blondon, A.-F., Bardy, M., Baudry, J., et al. (2015). A social–ecological approach to managing multiple agro-ecosystem services. Curr. Opin. Environ. Sustainability 14, 68–75. doi: 10.1016/j.cosust.2015.04.001
Martinez-Harms, M. J., Bryan, B. A., Balvanera, P., Law, E. A., Rhodes, J. R., Possingham, H. P., et al. (2015). Making decisions for managing ecosystem services. Biol. Conserv. 184, 229–238. doi: 10.1016/j.biocon.2015.01.024
Millennium Ecosystem Assessment (2005). Ecosystems and Human Well-Being: Synthesis. Washington, DC: Island Press.
Mukherjee, N., Hugé, J., Sutherland, W. J., McNeill, J., Van Opstal, M., Dahdouh-Guebas, F., et al. (2015). The Delphi technique in ecology and biological conservation: applications and guidelines. Methods Ecol. Evol. 6, 1097–1109. doi: 10.1111/2041-210X.12387
Munafò, M. R., Nosek, B. A., Bishop, D. V. M., Button, K. S., Chambers, C. D., Percie du Sert, N., et al. (2017). A manifesto for reproducible science. Nat. Human Behav. 1:0021. doi: 10.1038/s41562-016-0021
Nelson, E., Mendoza, G., Regetz, J., Polasky, S., Tallis, H., Cameron, Dr., et al. (2009). Modeling multiple ecosystem services, biodiversity conservation, commodity production, and tradeoffs at landscape scales. Front. Ecol. Environ. 7, 4–11. doi: 10.1890/080023
NRCS (2016). Environmental Quality Incentives Program (EQIP) Payment Schedule for California in 2017. Natural Resources Conservation Service (NRCS), United States Department of Agriculture (USDA). Available online at: https://www.nrcs.usda.gov/wps/portal/nrcs/detail/ca/programs/financial/eqip/ (accessed November 28, 2017).
Pashaei Kamali, F., Borges, J. A. R., Meuwissen, M. P. M., de Boer, I. J. M., and Oude Lansink, A. G. J. M. (2017). Sustainability assessment of agricultural systems: the validity of expert opinion and robustness of a multi-criteria analysis. Agricult. Syst. 157, 118–128. doi: 10.1016/j.agsy.2017.07.013
Pittelkow, C. M., Liang, X., Linquist, B. A., van Groenigen, K. J., Lee, J., Lundy, M. E., et al. (2014). Productivity limits and potentials of the principles of conservation agriculture. Nature 517:365. doi: 10.1038/nature13809
Power, A. G. (2010). Ecosystem services and agriculture: tradeoffs and synergies. Philos. Transac. R. Soc. B Biol. Sci. 365, 2959–2971. doi: 10.1098/rstb.2010.0143
Pullin, A., Frampton, G., Jongman, R., Kohl, C., Livoreil, B., Lux, A., et al. (2016). Selecting appropriate methods of knowledge synthesis to inform biodiversity policy. Biodivers. Conserv. 25, 1285–1300. doi: 10.1007/s10531-016-1131-9
Pullin, A. S., and Knight, T. M. (2003). Support for decision making in conservation practice: an evidence-based approach. J. Nat. Conserv. 11, 83–90. doi: 10.1078/1617-1381-00040
Saarikoski, H., Mustajoki, J., Barton, D. N., Geneletti, D., Langemeyer, J., Gomez-Baggethun, E., et al. (2016). Multi-Criteria Decision Analysis and Cost-Benefit Analysis: comparing alternative frameworks for integrated valuation of ecosystem services. Ecosyst. Serv. 22, 238–249. doi: 10.1016/j.ecoser.2016.10.014
Shackelford, G., Steward, P. R., Benton, T. G., Kunin, W. E., Potts, S. G., Biesmeijer, J. C., et al. (2013). Comparison of pollinators and natural enemies: a meta-analysis of landscape and local effects on abundance and richness in crops. Biol. Rev. 88, 1002–1021. doi: 10.1111/brv.12040
Shackelford, G. E., Kelsey, R., Robertson, R. J., Williams, D. R., and Dicks, L. V. (2017). Sustainable Agriculture in California and Mediterranean Climates: Evidence for the Effects of Selected Interventions. Cambridge: University of Cambridge.
Shackelford, G. E., Steward, P. R., German, R. N., Sait, S. M., and Benton, T. G. (2015). Conservation planning in agricultural landscapes: hotspots of conflict between agriculture and nature. Divers. Distributions 21, 357–367. doi: 10.1111/ddi.12291
Steward, P. R., Dougill, A. J., Thierfelder, C., Pittelkow, C. M., Stringer, L. C., Kudzala, M., et al. (2018). The adaptive capacity of maize-based conservation agriculture systems to climate stress in tropical and subtropical environments: a meta-regression of yields. Agricult. Ecosyst. Environ. 251, 194–202. doi: 10.1016/j.agee.2017.09.019
Sutherland, W., Taylor, N., MacFarlane, D., Amano, T., Christie, A., Dicks, L., et al. (2019). Building a tool to overcome barriers in research-implementation spaces: the Conservation Evidence database. Biol. Conserv. 283:108199. doi: 10.1016/j.biocon.2019.108199
Sutherland, W. J., Gardner, T., Bogich, T. L., Bradbury, R. B., Clothier, B., Jonsson, M., et al. (2014). Solution scanning as a key policy tool: identifying management interventions to help maintain and enhance regulating ecosystem services. Ecol. Soc. 19:3. doi: 10.5751/ES-06082-190203
Sutherland, W. J., Ockendon, N., Dicks, L. V., and Smith, R. K. (2017a). What Works in Conservation 2017. Cambridge: Open Book Publishers. Available online at: http://www.conservationevidence.com
Sutherland, W. J., Pullin, A. S., Dolman, P. M., and Knight, T. M. (2004). The need for evidence-based conservation. Trends Ecol. Evol. 19, 305–308. doi: 10.1016/j.tree.2004.03.018
Sutherland, W. J., Shackelford, G., and Rose, D. C. (2017b). Collaborating with communities: co-production or co-assessment? Oryx 51, 569–570. doi: 10.1017/S0030605317001296
Sutherland, W. J., and Wordley, C. F. R. (2018). A fresh approach to evidence synthesis. Nature 558:364. doi: 10.1038/d41586-018-05472-8
The Royal Society (2009). Reaping the Benefits: Science and the Sustainable Intensification of Agriculture. London: The Royal Society.
Unger, P. W., and Vigil, M. F. (1998). Cover crop effects on soil water relationships. J. Soil Water Conserv. 53, 200–207.
United Nations (2015). Transforming Our World: The 2030 Agenda for Sustainable Development. Available online at: https://sustainabledevelopment.un.org/post2015/transformingourworld
Wood, S. L. R., Jones, S. K., Johnson, J. A., Brauman, K. A., Chaplin-Kramer, R., Fremier, A., et al. (2018). Distilling the role of ecosystem services in the Sustainable Development Goals. Ecosyst. Serv. 29, 70–82. doi: 10.1016/j.ecoser.2017.10.010
Keywords: conservation agriculture, ecological intensification, evidence-based decision making, multiple-criteria decision analysis, subject-wide evidence synthesis, sustainable agriculture, sustainable intensification, systematic reviews
Citation: Shackelford GE, Kelsey R, Sutherland WJ, Kennedy CM, Wood SA, Gennet S, Karp DS, Kremen C, Seavy NE, Jedlicka JA, Gravuer K, Kross SM, Bossio DA, Muñoz-Sáez A, LaHue DG, Garbach K, Ford LD, Felice M, Reynolds MD, Rao DR, Boomer K, LeBuhn G and Dicks LV (2019) Evidence Synthesis as the Basis for Decision Analysis: A Method of Selecting the Best Agricultural Practices for Multiple Ecosystem Services. Front. Sustain. Food Syst. 3:83. doi: 10.3389/fsufs.2019.00083
Received: 21 May 2019; Accepted: 16 September 2019;
Published: 11 October 2019.
Edited by:
Eike Luedeling, University of Bonn, GermanyReviewed by:
Cory W. Whitney, University of Bonn, GermanyKatja Helene Schiffers, University of Bonn, Germany
Daniel Frederick McGonigle, Bioversity International, Italy
Copyright © 2019 Shackelford, Kelsey, Sutherland, Kennedy, Wood, Gennet, Karp, Kremen, Seavy, Jedlicka, Gravuer, Kross, Bossio, Muñoz-Sáez, LaHue, Garbach, Ford, Felice, Reynolds, Rao, Boomer, LeBuhn and Dicks. This is an open-access article distributed under the terms of the Creative Commons Attribution License (CC BY). The use, distribution or reproduction in other forums is permitted, provided the original author(s) and the copyright owner(s) are credited and that the original publication in this journal is cited, in accordance with accepted academic practice. No use, distribution or reproduction is permitted which does not comply with these terms.
*Correspondence: Gorm E. Shackelford, gorm.shackelford@gmail.com