Livelihoods and Food Security Among Rural Households in the North-Western Mount Kenya Region
 Emily Mutea1*
  Patrick Bottazzi1,2
  Johanna Jacobi2
  Boniface Kiteme3
  Chinwe Ifejika Speranza1
  Stephan Rist1,4
- 1Geography and Sustainable Development, Institute of Geography, University of Bern, Bern, Switzerland
- 2Center for Development and Environment, University of Bern, Bern, Switzerland
- 3Centre for Training and Integrated Research in ASALs Development, Nanyuki, Kenya
- 4UNESCO Chair for Sustainable Mountain Development, University of Bern, Bern, Switzerland
Food insecurity remains a major concern for numerous rural households in Sub-Saharan Africa who rely on agriculture as their main source of livelihood. The assessment of the links between food security and livelihoods is central for overcoming widespread food insecurity. However, assessments remain challenging due to food security's multi-dimensionality and the challenge of finding indicators that are comparable and applicable to various contexts. This study addresses this challenge by adapting a food security index (FSI) and uses it to assess the livelihood drivers of food security. The index captures the multi-dimensionality of food security using conventional food security indicators. The assessed indicators include measures of “food consumption score,” “household dietary diversity score,” “coping strategies index,” the “household food insecurity access scale,” and “months of adequate household food provisioning.” The study covered 600 randomly selected households representative of three agro-ecological zones located close to large-scale agricultural investment in Mount Kenya region in Kenya. We used linear regression to identify livelihood factors significantly influencing food security. Spearman's rank-order correlation and student's T-test demonstrated a strong and significant correlation between the composite FSI index and each classical indicators of food security. Overall, 32% of the households were food secure and 68% were food insecure. Households' ownership of productive hand tools, followed by off-farm income, consumption of own produced food, type of agro-ecological zone, farm income and number of main crops infested by pests had a significant effect on household food security. All these factors, except the number of main crops infested by pests, were found to positively influence household food security. Households in humid agro-ecological zone were less food secure than households in semi-humid and semi-arid zones. Household size, the size of accessible land and households' members' participation to large agricultural investments (as wage workers or sub-contract farmer) were not significantly influencing food security. Households of the Mount Kenya region need alternative off-farm income sources combined with further support to improve sustainable agriculture management with appropriate hand tools.
Introduction
Achieving food security remains challenging in many rural areas of Sub-Saharan Africa (FAO, 2017). The 1996 World Food Summit defines, food security as existing “when all people, at all times, have physical and economic access to sufficient, safe, and nutritious food that meets their dietary needs and food preferences for an active and healthy life” (FAO, 2006, p. 1). This definition of food security rests on four pillars: food availability, accessibility, utilization, and stability. Availability means physical presence of adequate food, accessibility denotes access by individuals to adequate resources for obtaining suitable foods for a nutritious diet, utilization means having sufficient energy and nutrient intake combined with good biological absorption of the food consumed, and stability entails access at all times and not losing such access (FAO, 2006). Each pillar is necessary but alone not sufficient to ensure the achievement of food security (Barrett, 2010). Appropriately measuring food security implies putting into simultaneous consideration all pillars in order to direct food security policies to the right target group.
Kenya, like other Sub-Saharan countries, faces food insecurity with approximately 3.4 million people in 2017 being acutely food insecure and in need of humanitarian assistance (Government of Kenya, 2017). This is a significant increase of 67% from the 2.6 million identified in 2016 (Government of Kenya, 2017). According to the government, this increase was because of below-average crop production in 2016 due to poor rains, increases in food prices and reduced regional imports from neighboring countries that also faced below-average production.
Research shows that multiple and complex factors influence food insecurity, such as climate change, neoliberal policies reducing support to smallholders rural households such as extension services, increase of costs for agricultural inputs, or price volatility of food products (Heidhues et al., 2004; Ulrich et al., 2012; Nganga and Mugo, 2018). Other researches add that large-scale land acquisition, which has been on the rise in the last decade especially in Africa, is a potential driver of food insecurity but also provides potential opportunities for employment and off-farm incomes (Cotula, 2013; Richards, 2013; Bottazzi et al., 2018). Large farms in the western Mt. Kenya region were transformed into highly technical horticultural farms for international markets (Wiesmann et al., 2000). This has been labeled as a pro-poor strategy, but other researchers argue that the sector does not benefit the poor (Ulrich, 2014). Another aspect influencing household food security is the characteristic of the agro-ecological zone particularly in mountainous gradients, where climatic and soil conditions can vary dramatically according to altitude, access to irrigation and soil fertility (Roden et al., 2016). Apart from these contextual factors, the proximate causes of food insecurity remain challenging to identify due to its multidimensionality (Barrett, 2010). Thus, studies aiming at a better understanding of drivers of food insecurity are needed to inform policies to take proper measures to support rural households (Connolly-Boutin and Smit, 2016).
This task is daunting, yet many indicators available for measuring food security are not taking into account the different dimensions of food security, which poses methodological challenges (Barrett, 2010; Jones et al., 2013; Maxwell et al., 2013; Hendriks et al., 2016). For instance, the food consumption score (FCS) (World Food Programme, 2008) and the household dietary diversity score (HDDS; Swindale and Bilinsky, 2006) can capture the utilization dimension. The coping strategies index (CSI; Maxwell and Caldwell, 2008) and the household food insecurity access scale (HFIAS; Coates et al., 2007) can capture the accessibility and stability dimensions. Measuring the months of adequate household food provisioning (MAHFP; Swindale and Bilinsky, 2010) captures food availability and stability.
Thus, for greater reliability, it is vital to combine food security indicators that measure different dimensions (Maxwell, 1995). Additionally, since food security is a result of households' experiences, behavior and decision-making, it can be estimated by a reasonably constructed index rather than a precise and objective measurement (Hendriks et al., 2016). In addition, although indicators can measure food security either at global, regional, national, local, household or individual levels, the household level remains the basis upon which aggregate food security is measured, hence the focus of this research. This study aims at modifying and testing a composite food security index (FSI) searching to achieve a comprehensive estimation of household food security, while providing at the same time a basis for analysis and critical insight on the most influencing livelihood related drivers of food security.
Materials and Methods
Study Area
The study was conducted in the north- western slopes of Mount Kenya, covering parts of Laikipia and Meru counties, within the upper Ewaso Ng'iro river basin (Figure 1) from January to March 2017. The study area is characterized by a steep ecological gradient marked by distinct altitudinal belts that drop from a height of 5,200 m in the alpine zone through the Laikipia plateau at 1,500 m to below 1,000 m in the Samburu lowlands (Kiteme and Gikonyo, 2002). The climate changes from semi-humid (1,000–1,500 mm annual rainfall) in the highlands of Meru County to semi-arid (400–700 mm annual rainfall) and to arid (about 350 mm annual rainfall) northwards over the Laikipia Plateau (Eckert et al., 2017). We chose this area due to the presence of different agro-ecological zones, diverse livelihood systems, and the presence of large-agricultural investments1 (LAIs). The original inhabitants of the area belong to the Maasai tribe, who are predominantly pastoralists. However, currently the largest settlers in the area belong to Kikuyu and Meru tribes who originated from high potential areas on the eastern and southern slopes of Mount Kenya who practice mixed-farming (Ulrich et al., 2012). Many rural households within the upper Ewaso Ng'iro river basin are small-scale farmers with less than one hectare (ha) of land, on which they practice mixed farming for subsistence and for local markets, while in the drier lowlands of Laikipia plateau, pastoral systems dominate (Ulrich, 2014; Zaehringer et al., 2018). LAIs have increased from less than 5 in early 1990s to 24 in 2003, and 35 in 2013 in the northwest of Mt. Kenya (Kiteme et al., 2008), increasing pressure on limited natural resources, particularly water (Lanari et al., 2016). Also, the area face limited and erratic rainfall, population increase, increasing land degradation and soil erosion (Ulrich, 2014).
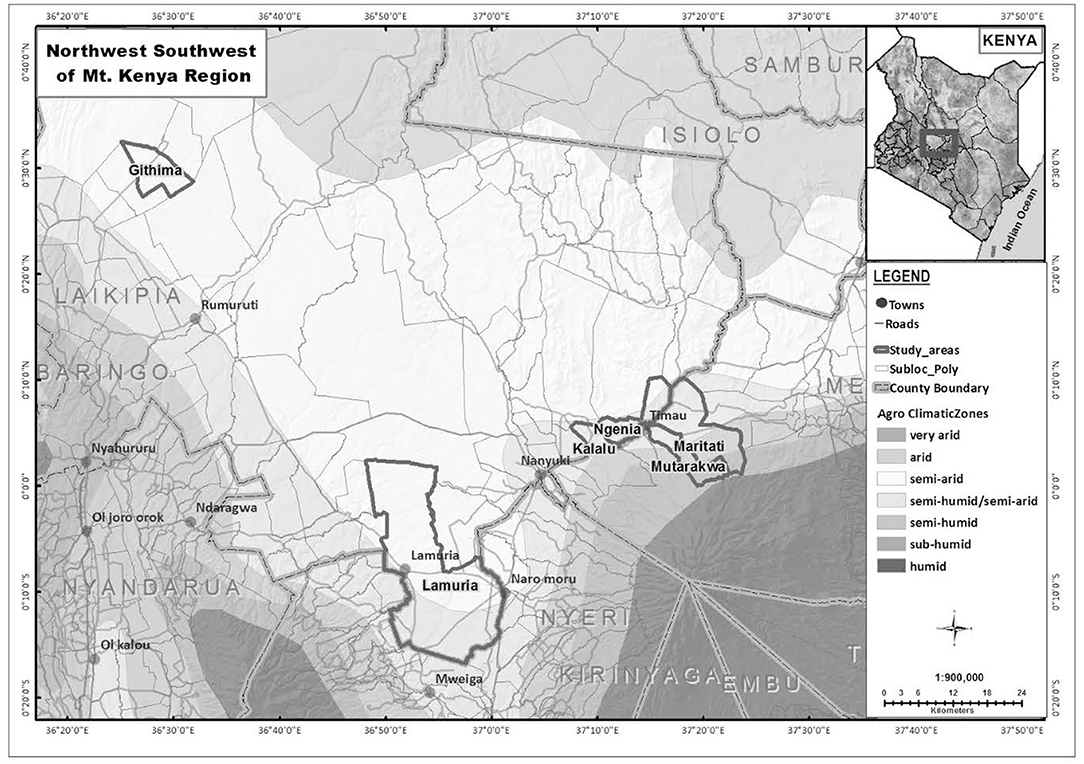
Figure 1. Study area in the North-Western Mount Kenya region.
Data and Methodology
We applied a stratified random sampling to select households that are equally distributed in Maritati and Mutarakwa sub-locations representing the humid area, Kalalu and Ngenia sub-locations representing the semi-humid area, and Lamuria and Githima sub-locations representing the semi-arid area (Figure 1). First, we identified households' locations using Google Earth Basemap of the quantum geographic information system (QGIS). The study area had 9,851 households. However, in order to increase the chances of having a sufficient proportion of households participating in LAIs we selected 6,000 households that were located within a radius of 15 km from the LAI in the study area. In the local context, the 15 km distance is considered the longest commuting distance to and from the LAIs daily using local or LAI organized means of transport. Finally, we randomly selected 200 households in each ecological zone using the random selection function of the QGIS software resulting in 600 households. We allocated an identification number to all the selected households. The study targeted adult household members over 18 years of age for responses. We interviewed the 600 households on the guidelines developed for five food security indicators as elaborated in chapter 2.3. If no respondent was available, the team revisited later and, in case of sustained absence, the enumerators picked the closest household nearby instead. The survey enumerators translated the questions in local languages, either Kikuyu, Kimeru, or Swahili. We collected qualitative data through observations and interviews with experts on food security in the region. Observations and interviews mainly focused on their views on the drivers of food security and their general opinion on some of the key leverages that are needed to improve farmers' food security status.
Food Security Measurement
For the development of the FSI, we focused on the mostly used indicators used to measure household food security (Table 1). They included a measure of household dietary diversity score (HDDS; Swindale and Bilinsky, 2006), food consumption score (FCS; World Food Programme, 2008), coping strategies index (CSI; Maxwell and Caldwell, 2008), months of adequate household food provisioning (MAHFP; Swindale and Bilinsky, 2010), and household food insecurity access scale (HFIAS; Coates et al., 2007). HDDS is the number of different food groups consumed during the last week. This allowed us to capture variability diversity in intake (Ruel, 2002). However, to precisely capture variability in HDDS, there is a need to do a 24-our recall period (to minimize recall error) for a 7-day reference period (to capture variability in intake), which was beyond the scope of this study. FCS is a composite score based on dietary diversity, food frequency, and the relative nutritional importance of different food groups. CSI is based on the many possible answers to one single question: “What do the household members do when they do not have adequate food, and do not have the money to buy food”? MAHFP identifies whether there was limited access to food during the last 12 months, regardless of the source. HFIAS is based on the idea that the experience of food insecurity (access) causes predictable reactions and responses. The reference period for HFIAS was 1 month. HFIAS features nine closed occurrence questions on levels of severity of food insecurity, and nine closed “frequency-of-occurrence” questions.
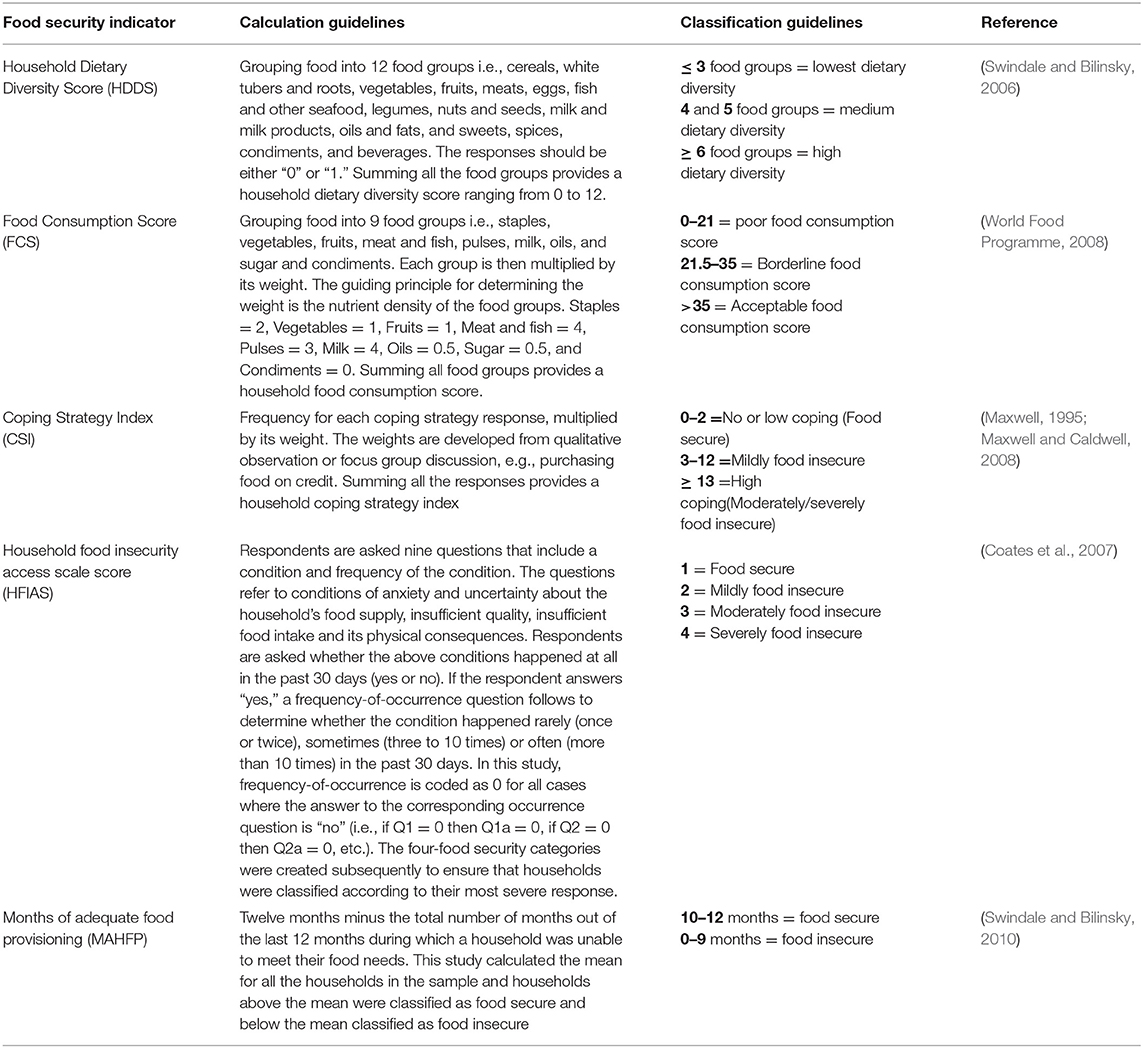
Table 1. Calculation and classification for each food security indicator.
Data Analysis
We used guidelines provided by World Food Programme (WFP) and the Food and Nutrition Technical Assistance communities (FANTA) to compute FCS, HDDS, CSI, MAHFP, and HFIAS for each household (Swindale and Bilinsky, 2006, 2010; Coates et al., 2007; Maxwell and Caldwell, 2008; World Food Programme, 2008). We classified households into different categories according to the documented guidelines (Table 1). To capture the overall food security status of each household, we checked whether the household met the food security thresholds for each of the five indicators. This resulted to dummy variables where one (1) meant food security for every indicator in each household. To create a composite food security index, first we standardized each of the original indicator score into a Z-score for each household to achieve algebraic requirements (see Equation 1). Some researchers have developed indices see Sahu et al. (2017) and The Economist Intelligence Unit (2018). Since we assessed household food security in the study area using the conventional food security indicators, we put our focus on how best to combine these indicators. By reassessing the food security index developed by Sahu et al. (2017), we adapt the concept by combining five indicators.
We make a modification of Sahu et al. (2017) index that uses the difference between minimum of food security and maximum of food insecurity indicators using a normalized score. For a household to achieve food security, it must fulfill all food security dimensions simultaneously. Therefore, by Sahu et al. (2017) only taking one minimum value among all food security indicators and one maximum value of all food insecurity indicators, it may not sufficiently incorporate all dimensions of food security in each household's final index. Moreover, the authors do not justify why only one of the food security indicators (FCS, HDDS, CSI, or Self assessed food security) can compensate for only one of the food insecurity indicators (Household Hunger Scale or HFIAS). We consider this a compensational effect problem.
To avoid this compensational effect, we summed up all standardized scores from each food security indicator to create a composite FSI guided by Song et al. (2013) (see Equation 2). According to the authors, summing is appropriate if the original variables are known to have similar relationships with the outcome variable. Additionally, converting the original variable scores to standardized scores preserves the distribution of the original scores and the contributions of these variables are considered equal (Song et al., 2013). In our case, none of the dimensions of food security is more or less important to the other and therefore, their contribution to the composite index should be equal. Moreover, for a household to achieve food security, it must fulfill all food security dimensions simultaneously. See Equation (1) for calculating the household Z-score for each food security indicator
where zn is the Z-score for each food security indicator for the nth household, xn is the original score, μn is the mean of the original distribution and σnis the standard deviation of the original distribution. We then inversed the food insecurity indicator scores (CSI and HFIAS) for high scores to imply food security (see Equation 2). We performed a Spearman's rank correlation between the food security indicators and the final composite FSI to assess whether all dimensions of food security correlated well with the final composite FSI. See Equation (2) Calculating the composite FSI.
where is the composite food security index for nth household; is the HDDS Z-score; is the FCS Z-score; is the MAHFP Z-score; is the CSI Z-score and is the HFIAS Z-score. In this formula, higher scores imply higher food security.
Multiple linear regression analysis determined crude associations between FSI and the independent variables. Based on the probability of the Breusch-Pagan test of heterogeneity at 0.0017, the residuals were not homogenous at 0.05 threshold. Therefore, we used the robust standard error model that estimates the model by relaxing ordinary least squares assumptions related to independence and identical distribution of errors. Additionally, to enable comparison of the variables influencing the composite FSI, we performed another regression model using standardized independent variables to get the standardized coefficients (Table S1).
The unstandardized coefficients show the effect of the explanatory variables on a household's food security while the standardized coefficients show the strength of the coefficient in comparison to other explanatory variables. Table 2 shows the explanatory variables on household food security. The choice of explanatory variables was informed by the livelihood and access theories (DFID, 1999; Ribot and Peluso, 2003).
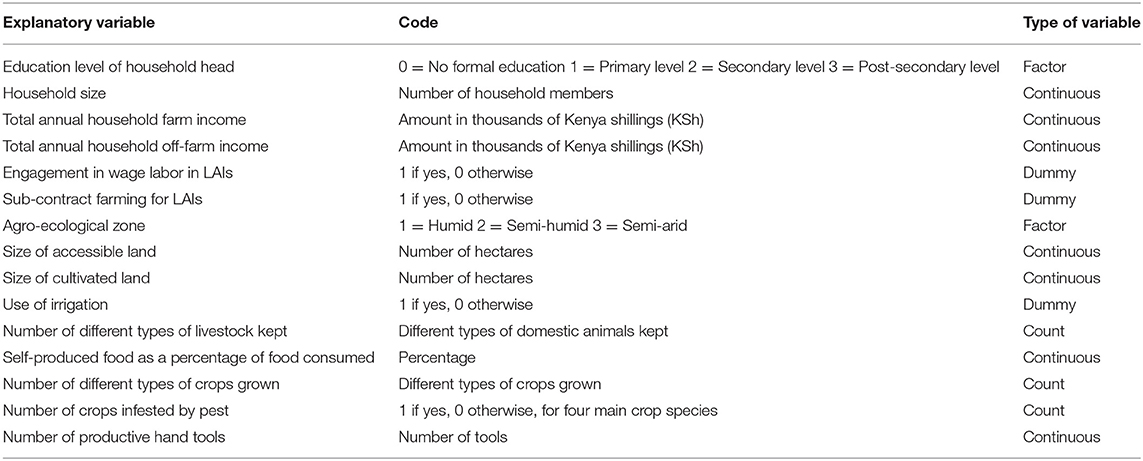
Table 2. Summary of the exploratory variables used in the multiple regression model.
Results
Characteristics of the Surveyed Households
Table 3 presents descriptive statistics of the studied households. Twenty-three observations had missing values and were thus not included in the subsequent analysis. Household derive their farm income from agricultural activities within a household's land holdings, and off-farm income from activities outside household's landholdings. Their sources of farm income included sale of crops, trees and livestock. Off-farm income came from trade and business, remittances, house rent, formal employments, transport services, and artisanal work. Interestingly, although all the surveyed households were located in a maximum radius of 15 km from large scale agricultural investments, only 6% have had at least one wage contract and only 12% engaged in sub-contract farming in the last 12 month preceding the survey.
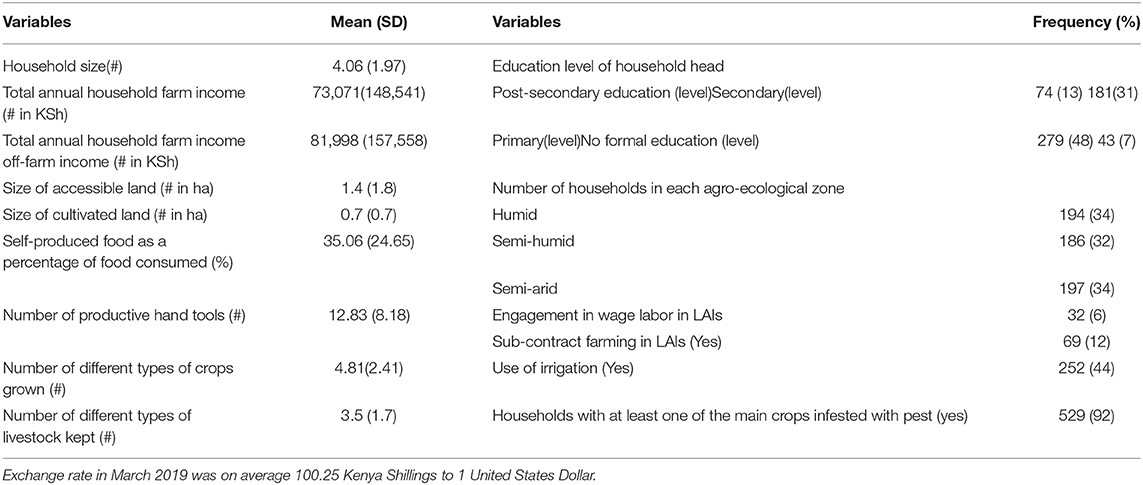
Table 3. Characteristics of the studied households (n = 577).
Food Security Status Based on Food Security Indicators
For better understanding how the indicators compare to each other and to the composite FSI, we analyzed the strength of the correlations. Table 4 shows that indicators correlated significantly, except MAHFP and FCS. Interestingly, all indicators had a statistically highly significant correlation with the composite FSI. These correlations are important since they give a glimpse of how different pillars of food security relates for the overall achievement of food security.
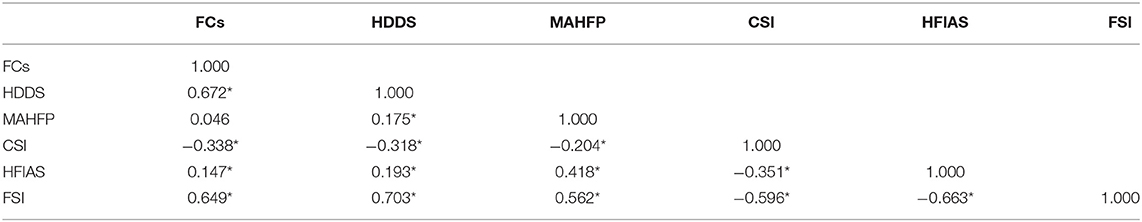
Table 4. Spearman's correlation coefficients between food security indicators (*statistically significance at 0.05 threshold).
Table 5 shows the general classification based on WFP (World Food Programme) and Food and Nutrition Technical Assistance Project (FANTA) guidelines. HDDS, which provides an estimate of food security based on dietary diversity, classified 99.5% of the households as food secure. Main staples, vegetables and oils were all on average consumed over 7 times a week. Household consumed milk and sugar each on average 6 times a week. Meat, fish, eggs and fruits were less frequent (average of 3 times a week each), and the least frequently consumed food group were pulses (2 times a week). The measure of weighted food dietary diversity represented by FCS showed a similar trend, as 99.3 % had an acceptable consumption score.
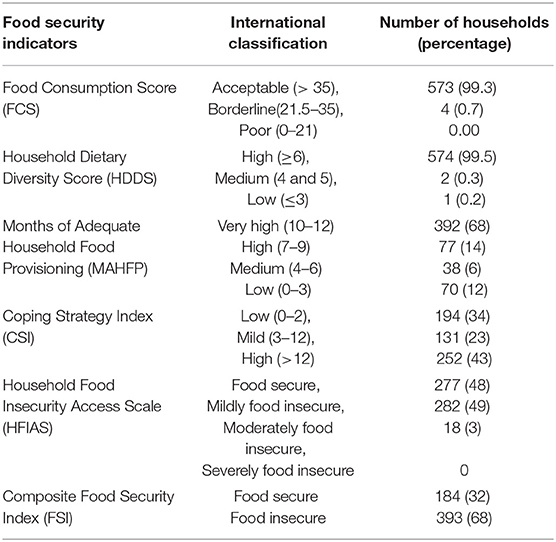
Table 5. Food security classification of households based on the five food security indicators and the food security index.
Regarding MAHFP, 68% of the households had between 10 and 12 months of adequate provisioning indicating a high food security. Fourteen percent were mildly food insecure with adequate food for 7–9 months, 6% were moderately food insecure with adequate food for 4–6 months while 12% of the households were severely food insecure with adequate food less than 3 months a year.
The CSI shows a different picture. It classified only 34% of the households as food secure. Out of the various coping strategies used by households, purchasing food on credit was the most common strategy used by 54% of the households, followed by reliance on less preferred and less expensive foods (40%), and limiting meal portions (35%). Sending members to beg (0.3%) or to eat elsewhere (0.8%) or not sending children to school some days (1.3%) were less common coping strategies in the area. According to the HFIAS score, 48% of the households were food secure, 49% were mildly food insecure, 3% were moderately food insecure and none of the households was severely food insecure.
The results show that HDDS and FCS revealed less food insecurity than MAHFP, CSI, and HFIAS based on food quality, food quantity, and food accessibility (Table 5). These discrepancies result due to the thresholds levels and the diversity of assessment questions. We used the international thresholds to check all households that were able to meet all the food security dimensions. According to the thresholds, 32% of the households were food secure by all the indicators and 68% failed to meet all the required dimensions of food security and thus we considered them food insecure. Among the food insecure households, 37% were food secure by four indicators, 38% were food secure by three indicators, 23% were food secure by two indicators and 1% was food secure by one indicator.
Livelihood Related Determinants of Food Security Based on the Composite FSI
Table 6 presents the results of the linear regression based on the various independent variables influencing the composite FSI in the area. A significant regression equation was identified [F(18,558) = 9.19, P-value associated to the F-test (0.0000), with R2 of 0.2428. The comparison of effect based on the standardized coefficients show that, number of productive hand tools, followed by off-farm income, consumption of self-produced food, type of agro-ecological zone, farm income and lastly number of main crops infested with pest had a significant effect on household composite FSI. All these independent variables had a positive effect on composite FSI, except pest infestation (see Figure 2).
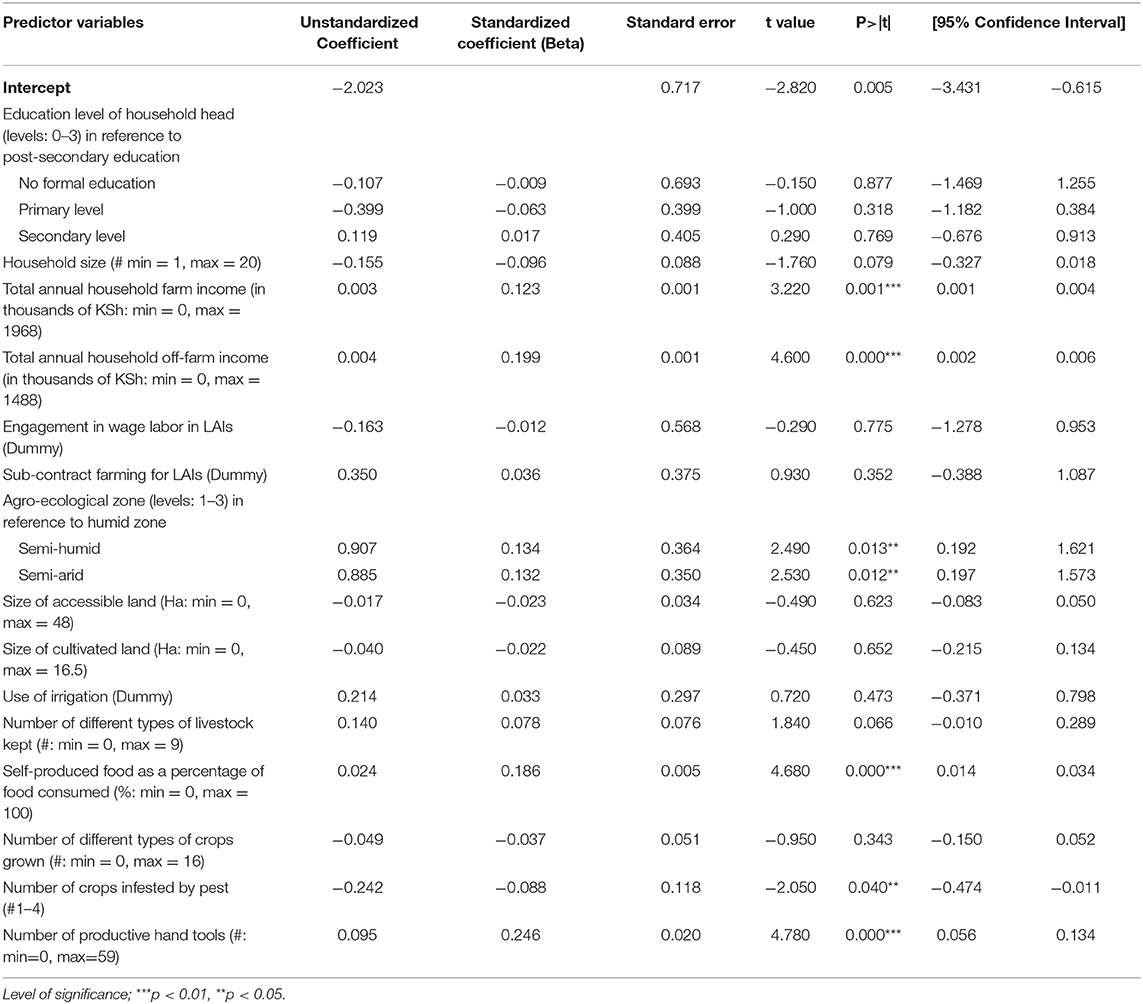
Table 6. Linear regression model with composite FSI using the robust option that take account the heterogeneity showing coefficient estimates of each explanatory variable of food security.
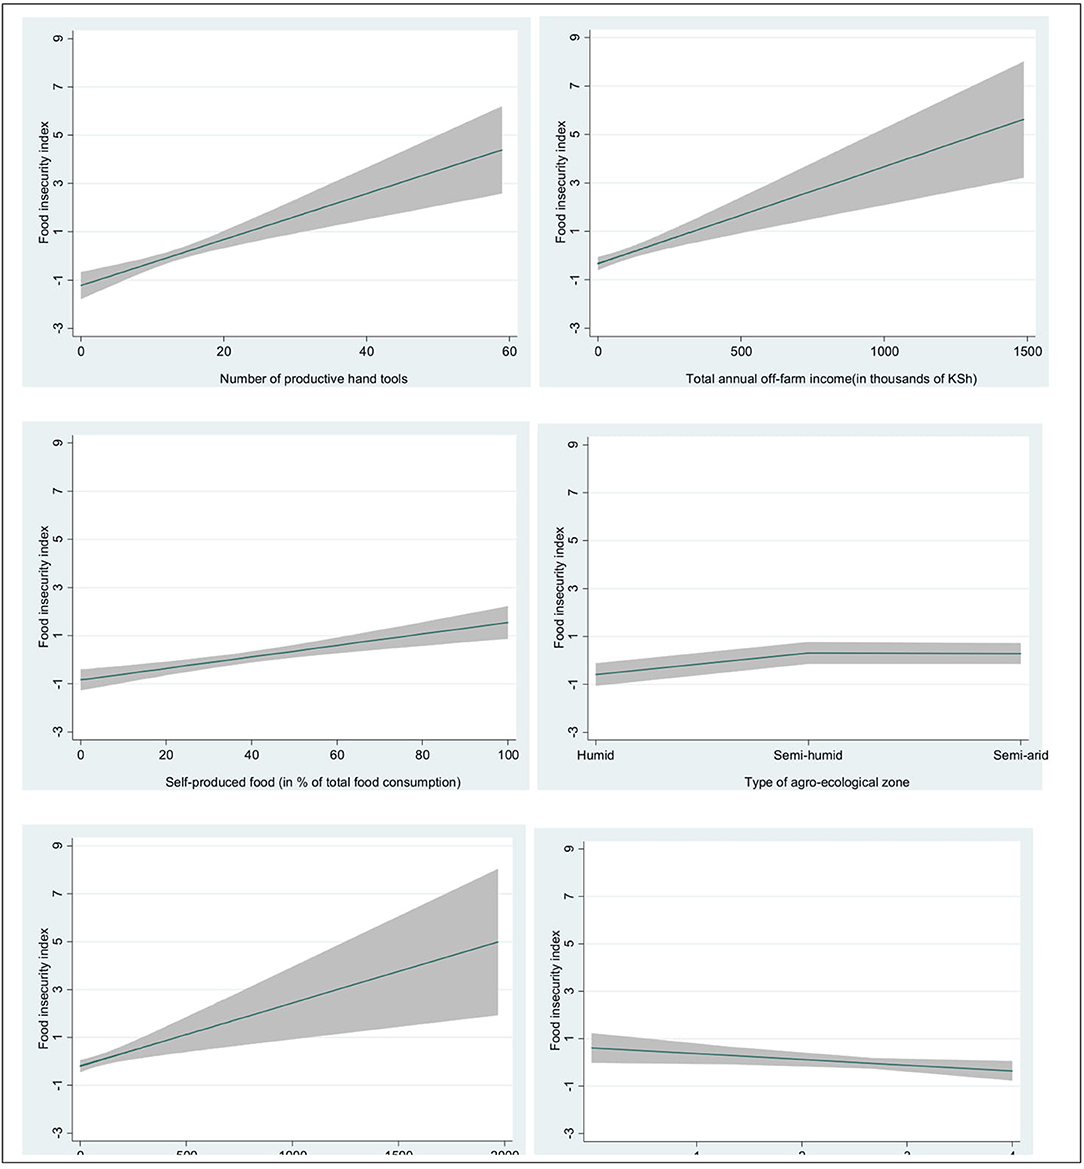
Figure 2. Marginal plots showing the relationship between the significant variables and the household composite food security index. The gray shaded area on each plot represent the confidence interval.
Discussion
Our assessment of food security using different indicators classified households differently. Some households were food secure by some indicators, and food insecure by other indicators. This makes it difficult to determine the overall food security status of a household, and can lead to dramatic misinterpretations for policy makers. Fortunately, based on the theory behind food security, and the set of international thresholds for each food security indicator, it is possible to classify households (depending on whether a household has met the all the food security thresholds or not) in order to evaluate the overall household food security status. Additionally, to account for the drivers of food security, we see that the composite food security index that we applied was able to capture the most documented significant drivers of food security and insecurity. The dimensions of food security captured in the composite index are reflected in the choice of indicators.
Farm and off-farm income had a positive significant relationship with FSI. However, off-farm income had the strongest significant influence on the household composite FSI compared to farm income. Our results indicate that, as household income increases either from farm or off the farm, it tends to have a positive impact on overall household food security. In other words, households with higher household income are more likely to be food secure than households with lower income. Similar findings were reported by Barrett et al. (2001); Silvestri et al. (2015), and Tefera and Tefera (2014). Income is vital to provide a household with physical access to food through purchasing. Hardly do households produce throughout the year all the food needed to satisfy their dietary needs. Therefore, households can meet a possible production deficit through purchasing food. In other instances, households purchase food as a coping strategy when faced with crop failure.
Consumption of self-produced food was also among the most significant factors influencing food security in the study area. Generally, households in this area consume a sizeable part of what they produce because it is readily available, accessible and culturally acceptable. Higher food production increases the probability of a household being food secure (Abu and Soom, 2016). Due to rising food prices, households with less income have difficulties to purchase enough food, hence they tend to rely more on own food production in order to reduce their vulnerability to food insecurity.
The type of agro-ecological zone had a significant influence on household food security. Contrary to our expectations, households in humid agro-ecological zone were more food insecure compared to households in less humid agro-ecological zones. Most of the households in the area are mixed smallholder farmers and agriculture is their main source of livelihood. Unfortunately, productive areas tend to become less productive due to climate change, with disrupted growing seasons, increased pest infestation, soil degradation and reduced agricultural potential, hence constraining households adaptive capacity that make them vulnerable to food insecurity (Ifejika Speranza, 2013; Connolly-Boutin and Smit, 2016; Kala et al., 2018).
Pest infestation had a negative influence on households' food security. Pest infestation can decrease agricultural yields, leading to reduced food for consumption and farm income. Additionally, households may spend too much of their income on efforts to control pest, hence affecting expenditure on other basic needs such as food. This makes households vulnerable to food insecurity and to highly hazardous pesticides (Ottiger et al., 2018).
Additionally, the study found that the number of productive hand tools (such as garden fork, spade, knapsack) has a significant positive influence on households' food security. Own observations and interviews made during fieldwork found that these tools were generally available, affordable, make farm activities easier, are usually light and can be used without the help of animals or machines. Ownership of these basic farm tools lead to intensive crop production (even on small farms) and contribute to the viability of the farm by enhancing output. They are necessary for plant propagation, soil preparation, planting, pest and weed control, irrigation and harvesting. According to the findings of Ifejika Speranza et al. (2008) appropriate hand tools and implements are key determinants in the adoption of soil and water conservation methods that can increase food security.
Finally, our results show that the engagement in LAI as either wage laborer or contract farmer does not directly influence food security. It is difficult to say if this lack of influence is due to a lack of effect or a compensated effect on critical households being previously food insecure. In any case, the very small proportion of farmers working in LAI, especially for wage labor, confirms the idea that LAI is relying on in-migration for labor rather than the established farmers of the area (Ulrich, 2014). Our qualitative interviews suggest that established farmers in the area enroll in LAI during the periods of food shortage due to low rainfall resulting in crop failure. LAI represent therefore a possible coping strategy, although it does not necessarily imply a significant effect on household food security. We argue that there is a relative lack of connection between the local and international food systems represented by LAI. Other researchers have shown that working on these farms diverts human labor from smallholder farms to large farms, making smallholder farmers abandon food production, and also resulting in post-employment health complications due to exposure to agrochemicals (Ehlert et al., 2014). Other studies conducted in the same area (e.g., Zaehringer et al., 2018) found that some households in the area were favoring the presence of the large farming companies. According to our qualitative observations, a rather positive perception toward LAI is related to assumptions that LAI represent potential access to off-farm income in case of need, extension services, and support to local educational infrastructure resulting from public-private partnerships.
Conclusion
In conclusion, our composite FSI provides a guide on how to combine the conventional food security indicators at the household level in order to identify the most important livelihood-related determinants of food security. The assessment of drivers of food security corroborate with the common livelihoods and food security literature that indicates households' endowment such as size of cultivated land and other natural capital (such as irrigation water and size of land) are not necessarily the core determinant of food security. Instead, other entitled capabilities and assets such as incomes (on-farm and off-farm) and the ownership of hand tools used to intensify agricultural production are rather most important drivers of food security. Pest infestation is a major hindrance in the achievement of food security in the study area. There is a need to advocate for integrated and organic pest management. One way to control pest is by incorporating agro-ecological practices such as the use of pest repellant plants and/or combinations of indigenous technical knowledge with modern technologies. Policy makers need to provide support and resources to scientists and other key stakeholders for the documentation and promotion of effective methods for controlling pest and diseases, as well as create awareness about such methods. Moreover, there is a need to improve sustainable agriculture practices with appropriate hand tools for increased production, and improve value chains to increase farm income. Households should have access to diverse sources of income.
This research focused on general livelihood-related drivers of food security in the study area. Research studies should test the composite FSI in other areas using similar indicators or together with other indicators not included in this study such as Household Hunger Scale, Self-assessed food security. There is also a need to base future studies on the additional food security dimensions to the FAO food security concept, as proposed by Rocha (2007, 2008) which are; acceptability, adequacy and agency, linked to the concept of food sovereignty, to ensure sustainable and equitable food security among the households. Comparison between a population of LAI wage workers and local smallholder farms on the question of food security could be an interesting further application of the FSI index.
Data Availability Statement
All datasets for this study are included in the article and the Supplementary Material.
Ethics Statement
Verbal informed consent was obtained from all the sampled population before the study. The participants were informed that the information provided was to remain confidential and only used for research purposes. Ethical approval was not sought for the present study because it is not required as per the University of Bern guidelines and applicable national regulations.
Author Contributions
EM, PB, JJ, BK, and SR contributed conception and design the study. PB designed the survey and organized data collection in contribution with Kenyan research partners. EM organized the database and performed the statistical analysis. EM and PB interpreted the result. EM wrote the first draft of the manuscript with support from PB. JJ, CS, BK, and SR provided critical feedback that helped shape the research. All authors approved the submitted version.
Funding
The main author received support from the Swiss Government Excellence Scholarships for Foreign Scholars and Artists: ESKAS 2017.0930 and the co-authors received support from the Swiss National Science Foundation (SNSF) through the Swiss r4d project Toward Food Sustainability: Reshaping the Coexistence of different Food Systems in South America and Africa grant number: SNSF 400540-152033.
Conflict of Interest
The authors declare that the research was conducted in the absence of any commercial or financial relationships that could be construed as a potential conflict of interest.
Acknowledgments
We are grateful to the Center for Training and Integrated Research in ASALs Development for coordinating data collection, to the households in the Mt. Kenya that took part in this study and to Mashoudou Maman Chabi Sika for his statistical support.
Supplementary Material
The Supplementary Material for this article can be found online at: https://www.frontiersin.org/articles/10.3389/fsufs.2019.00098/full#supplementary-material
Footnotes
1. ^Large-scale agricultural investments in the context of this study refer to farms that cover a large area, involves a great amount of capital, or has a large number of employees or has a combination of these factors.
References
Abu, G. A., and Soom, A. (2016). Analysis of factors affecting food security in rural and urban farming households of Benue State, Nigeria. Int. J. Food Agric. Econ. 4, 55–68. doi: 10.22004/ag.econ.231375
Barrett, C. B. (2010). Measuring food insecurity. Science 327, 825–828. doi: 10.1126/science.1182768
Barrett, C. B., Bezuneh, M., and Aboud, A. (2001). Income diversification, poverty traps and policy shocks in Côte d'Ivoire and Kenya. Food Policy 26, 367–384. doi: 10.1016/S0306-9192(01)00017-3
Bottazzi, P., Crespo, D., Omar, L. B., and Rist, S. (2018). Evaluating the livelihood impacts of a large-scale agricultural investment: lessons from the case of a biofuel production company in Northern Sierra Leone. Land Use Policy J. 73, 128–137. doi: 10.1016/j.landusepol.2017.12.016
Coates, J., Swindale, A., and Bilinsky, P. (2007). Household Food Insecurity Access Scale (HFIAS) for Measurement of Food Access: Indicator Guide. Washington, DC: Food and Nutrition Technical. doi: 10.1007/s13398-014-0173-7.2
Connolly-Boutin, L., and Smit, B. (2016). Climate change, food security, and livelihoods in Sub-Saharan Africa. Region. Environ. Change 16, 385–399. doi: 10.1007/s10113-015-0761-x.
Cotula, L. (2013). The Great African Land Grab? Agricultural Investments and the Global Food System. Zed Books. London; New York, NY: Paperback.
Eckert, S., Kiteme, B., Njuguna, E., and Zaehringer, J. G. (2017). Agricultural expansion and intensification in the foothills of Mount Kenya: a landscape perspective. Remote Sens. 9:784. doi: 10.3390/rs9080784
Ehlert, C. R., Mithöfer, D., and Waibel, H. (2014). Worker Welfare on Kenyan export vegetable farms. J. Food Policy 46, 66–73. doi: 10.1016/j.foodpol.2014.01.004
FAO, IFAD, UNICEF, WFP, WHO. (2017). The State of Food Security and Nutrition in the World 2017. Building Resilience for Peace and Food Security. Rome. Available online at: http://www.fao.org/3/a-I7695e.pdf.
Government of Kenya (2017). THE 2017 LONG RAINS SEASON ASSESSMENT REPORT. Nairobi. Available online at: https://www.wfp.org/publications/kenya-long-rains-season-assessment-report.
Heidhues, F., Atsain, A., Nyangito, H., Padilla, M., Ghersi, G., and Le Vallée, J.-C. (2004). Development Strategies and Food and Nutrition Security in Africa: An Assessment.. Washington, DC, 38. Available online at: http://ageconsearch.umn.edu/bitstream/42270/2/2020dp38.pdf.
Hendriks, S. L., van der Merwe, C., Ngidi, M. S., Manyamba, C., Mbele, M., McIntyre, A. M., et al. (2016). What are we measuring? Comparison of household food security indicators in the Eastern Cape Province, South Africa. Ecol. Food Nutr. 55, 141–162. doi: 10.1080/03670244.2015.1094063
Ifejika Speranza, C. (2013). Buffer capacity: capturing a dimension of resilience to climate change in African smallholder agriculture. Region. Environ. Change 13, 521–535. doi: 10.1007/s10113-012-0391-5
Ifejika Speranza, C., Kiteme, B., and Wiesmann, U. (2008). Droughts and famines: the underlying factors and the causal links among agro-pastoral households in Semi-Arid Makueni District, Kenya. Global Environ. Change 18, 220–233. doi: 10.1016/J.GLOENVCHA.2007.05.001
Jones, A. D., Ngure, F. M., Pelto, G., and Young, S. L. (2013). What are we assessing when we measure food security? A compendium and review of current metrics. Adv. Nutr. 4, 481–505. doi: 10.3945/an.113.004119
Kala, N., Kurukulasuriya, P., and Mendelsohn, R. (2018). The impact of climate change on agro-ecological zones: evidence from Africa. Environ. Dev. Econ. 17, 663–687. doi: 10.1017/S1355770X12000241
Kiteme, B. P., and Gikonyo, J. (2002). Preventing and resolving water use conflicts in the mount kenya highland–lowland system through water users' associations. Mountain Res. Dev. 22, 332–337. doi: 10.1659/0276-4741(2002)022[0332:PARWUC]2.0.CO;2
Kiteme, B. P., Liniger, H., Notter, B., Wiesmann, U., and Kohler, T. (2008). Dimensions of Global Change in African Mountains: The Example of Mount Kenya. IHDP Update. Vol. 2. Available online at: http://re.indiaenvironmentportal.org.in/files/Dimensions.pdf.
Lanari, N., Liniger, H., and Kiteme, B. (2016). Commercial Horticulture in Kenya: Adapting to Water Scarcity. No. 8. Policy Brief. Bern. Available online at: https://boris.unibe.ch/97195/1/CDE_Policy_Brief_08.pdf.
Maxwell, D., and Caldwell, R. (2008). The Coping Strategies Index A Tool for Rapid Measurement of Household Food Security and the Impact of Food Aid Programs in Humanitarian Emergencies Field Methods Manual The Coping Strategies Index Field Methods Manual Second Edition, January 2008, 2nd Edn.
Maxwell, D., Coates, J., and Vaitla, B. (2013). How Do Different Indicators of Household Food Security Compare? Empirical Evidence from Tigray. Medford, OR.
Maxwell, D. G. (1995). Measuring Food Insecurity: The Frequency and Severity of Coping Strategies. Washington, DC. Available online at: https://ageconsearch.umn.edu/bitstream/42669/2/dp08.pdf.
Nganga, T. K., and Mugo, M. (2018). “Impact of Economic regimes on food systems in Kenya,” Working Paper No. 7. Towards Food Sustainability (Bern). doi: 10.7892/boris.119466
Ottiger, F., Kiteme, B., and Jacobi, J. (2018). Policy Brief Highly Hazardous Pesticides (HHPs) in Agro-Industrial and Smallholder Farming Systems in Kenya Pesticide Use Increases in Kenya. Vol. Centre for. Bern. doi: 10.7892/boris.132116
Ribot, J. C., and Peluso, N. L. (2003). A Theory of Access*. Rural Sociol. 68, 153–181. doi: 10.1111/j.1549-0831.2003.tb00133.x
Richards, M. (2013). Social and Environmental Impacts of Agricultural Large-Scale Land Acquisitions in Africa—With a Focus on West and Central Africa. Washington, DC. Available online at: https://theredddesk.org/sites/default/files/resources/pdf/2013/rri_agric_wca.pdf.
Rocha, C. (2007). Food insecurity as market failure: a contribution from economics. J. Hunger Environ. Nutr. 1, 5–22. doi: 10.1300/J477v01n04_02
Rocha, C. (2008). Brazil-Canada Partnership: Building Capacity in Food Security. Centre for Studies in Food Security, Ryerson University, Toronto, ON.
Roden, P., Bergmann, C., Ulrich, A., and Nüsser, M. (2016). Tracing divergent livelihood pathways in the drylands: a perspective on two spatially proximate locations in Laikipia County, Kenya. J. Arid Environ. 124, 239–248. doi: 10.1016/j.jaridenv.2015.08.004
Ruel, M. T. (2002). Is dietary diversity an indicator of food security or dietary quality? A review of measurement issues and research needs. Food Nutr. Bull. 24, 231–232. doi: 10.1177/156482650302400210
Sahu, A. K., Chüzho, Z., and Das, S. (2017). Measuring household food security index for high hill tribal community of Nagaland, India. J. Food Secur. 5, 155–161. doi: 10.12691/jfs-5-5-1
Silvestri, S., Sabine, D., Patti, K., Wiebke, F., Maren, R., Ianetta, M., Carlos, Q. F., et al. (2015). Households and food security: lessons from food secure households in East Africa. Agric. Food Secur. 4, 4–23. doi: 10.1186/s40066-015-0042-4
Song, M.-K., Lin, F.-C., Ward, S. E., and Fine, J. P. (2013). Composite variables: when and how. Nurs. Res. 62, 45–49. doi: 10.1097/NNR.0b013e3182741948
Swindale, A., and Bilinsky, P. (2006). Household Dietary Diversity Score (HDDS) for Measurement of Household Food Access: Indicator Guide (Version 2). FHI 360/FANTA, Washington, DC. Available online at: www.fantaproject.org.
Swindale, A., and Bilinsky, P. (2010). Months of Adequate Household Food Provisioning (MAHFP) for Measurement of Household Food Access : Indicator Guide VERSION 4. FHI 360/FANTA, Washington, DC.
Tefera, T., and Tefera, F. (2014). Determinants of households food security and coping strategies for food shortfall in Mareko District, Guraghe Zone Southern Ethiopia. J. Food Secur. 2, 92–99. doi: 10.12691/jfs-2-3-4
The Economist Intelligence Unit (2018). Available online at: https://foodsecurityindex.eiu.com/ (accessed August 18, 2019).
Ulrich, A. (2014). Export-oriented horticultural production in Laikipia, Kenya: assessing the implications for rural livelihoods. Sustainability 6, 336–347. doi: 10.3390/su6010336
Ulrich, A., Ifejika Speranza, C., Roden, P., Kiteme, B., Wiesmann, U., and Nüsser, M. (2012). Small-scale farming in semi-arid areas: livelihood dynamics between 1997 and 2010 in Laikipia, Kenya. J. Rural Stud. 28, 214–251. doi: 10.1016/j.jrurstud.2012.02.003
Wiesmann, U., Gichuki, F. N., Kiteme, B. P., and Liniger, H. (2000). Mitigating conflicts over scarce water resources in the highland-lowland system of Mount Kenya. Mountain Res. Dev. 20, 10–15. doi: 10.1659/0276-4741(2000)020[0010:MCOSWR]2.0.CO;2
World Food Programme (2008). Food Consumption Analysis Calculation and Use of the Food Consumption Score in Food Security Analysis. Rome. Available online at: www.wfp.org/odan/senac.
Zaehringer, J. G., Wambugu, G., Kiteme, B., and Eckert, S. (2018). How do large-scale agricultural investments affect land use and the environment on the Western Slopes of Mount Kenya ? Empirical Evidence Based on Small-Scale Farmers' Perceptions and Remote Sensing. J. Environ Manage. 213, 1–21. doi: 10.1016/j.jenvman.2018.02.019
Keywords: food security, Kenya, livelihoods, food security index, Mount Kenya
Citation: Mutea E, Bottazzi P, Jacobi J, Kiteme B, Speranza CI and Rist S (2019) Livelihoods and Food Security Among Rural Households in the North-Western Mount Kenya Region. Front. Sustain. Food Syst. 3:98. doi: 10.3389/fsufs.2019.00098
Received: 29 March 2019; Accepted: 14 October 2019;
Published: 07 November 2019.
Edited by:
Amy Ickowitz, Center for International Forestry Research, IndonesiaCopyright © 2019 Mutea, Bottazzi, Jacobi, Kiteme, Speranza and Rist. This is an open-access article distributed under the terms of the Creative Commons Attribution License (CC BY). The use, distribution or reproduction in other forums is permitted, provided the original author(s) and the copyright owner(s) are credited and that the original publication in this journal is cited, in accordance with accepted academic practice. No use, distribution or reproduction is permitted which does not comply with these terms.
*Correspondence: Emily Mutea, emitah2@gmail.com