Food Insecurity and the Unsustainable Hunting of Wildlife in a UNESCO World Heritage Site
 Cortni Borgerson1,2,3*
  BeNoel Razafindrapaoly2 Delox Rajaona2 Be Jean Rodolph Rasolofoniaina2
  Christopher D. Golden2,3
- 1Department of Anthropology, Montclair State University, Montclair, NJ, United States
- 2Madagascar Health and Environmental Research (MAHERY) Maroantsetra, Madagascar
- 3Department of Nutrition, Harvard T. H. Chan School of Public Health, Boston, MA, United States
Madagascar faces dual challenges in biodiversity conservation and public health. In order to identify strategies to reduce the unsustainable hunting of threatened species while maintaining or improving child nutrition, we quantified interactions among ecosystem indicators (lemur density and habitat biodiversity indices), health indicators (stunting, underweight, wasting, and anemia), nutrition, food security, and wildlife hunting through interviews of 1,750 people in 387 households and surveys of 28 wildlife transects with 156 habitat plots at 15 sites on Madagascar's Masoala Peninsula, a UNESCO World Heritage Site. The surveyed population ate 6,726 forest animals (mammals and birds), or a mean of 3.27 kg of wild meat per person (4.48 kg per adult equivalent) during the prior year. Local Malagasy were also highly food insecure (78% of households) and malnourished (for children under five, as many as 67% were stunted, 60% were underweight, 25% were wasted, and 40% were anemic). In some communities, nearly 75% of animal-sourced calories, 76% of protein, and 74% of iron came from forest animals-demonstrating a strong dependence on wild foods. Few micronutrient-rich alternatives to wild meats were available in adequate supply and many were highly volatile; for example, 79% of chickens died from Newcastle disease in the prior year. The survivorship of lemurs (94% of lemur species are threatened with extinction) depends on providing food security to a malnourished human population who commonly hunts wildlife for food. Currently, wildlife provides a critical source of micronutrients, yet the hunting of threatened species is an untenable solution to poor diet and food insecurity. Given the established connection between wild foods and human nutrition, reductions in forests and wildlife populations will also threaten the local food supply. In order to reduce the unsustainable hunting of threatened species while improving household food security and child health, we suggest testing the effects of increasing the affordability, accessibility, and stability of micro-nutrient rich animal-sourced foods in communities where forests contribute the most to food security.
Introduction
While unsustainable hunting is widely recognized as a primary contributor to global biodiversity loss (Wilkie et al., 2016), little is known about the relationships between hunting, biodiversity, nutrition, and food security surrounding many of the world's protected areas. Malnutrition is a primary driver of the global burden of disease (International Food Policy Research Institute, 2016); with half of the deaths of all children worldwide associated with undernutrition (Black et al., 2013). If a child's diet is deficient in key micronutrients, such as zinc, iron, and vitamin A, their cognitive and physical growth can be delayed or impaired and their risk of infection and early death is significantly increased (Ezzati et al., 2002; Lopez et al., 2006; Black et al., 2013).
The country of Madagascar is one of the least food secure nations in the world (Economist Intelligence Unit, 2017). Its people spend proportionally more of their cash income on food than anywhere else on the planet (Economist Intelligence Unit, 2014, 2016). Further, Madagascar has one of the highest rates of stunting in the world (International Food Policy Research Institute, 2016), and faces high health burdens including poor maternal outcomes and high rates of both anemia and malaria (WHO, 2012; Mould et al., 2016; Rice et al., 2016).
Madagascar is also one of the most biodiverse places on earth. The nation has long been a global priority for conservation; most of the plant and animal species in Madagascar are found nowhere else on earth (Myers et al., 2000). Among these animals are lemurs, euplerid carnivorans, and tenrecs. Nearly 90% of all tenrecs, and 100% of all lemurs and euplerid carnivorans are only found in Madagascar. Lemurs are the most threatened group of primates on earth, and nearly all species (94%) are threatened with extinction because of habitat loss and unsustainable hunting (Schwitzer et al., 2013).
Recent global evidence shows many complex pathways by which forests can improve dietary diversity, health, and nutrition (Golden et al., 2011; Food Agriculture Organization., 2013; Johnson et al., 2013; Ickowitz et al., 2014; Rowland et al., 2016; Tata et al., 2019). While forest foods are rarely the staple food in a diet (Rowland et al., 2016), children who live in areas with greater forest cover eat more nutritious diets than those who do not (Ickowitz et al., 2014; Tata et al., 2019). In addition to primary forests, swidden and agro-forests also provide opportunities for families to increase the diversity of their diet and their access to many micronutrient rich foods (Ickowitz et al., 2016). Among these wild foods, wild animals provide an important source of calories, fat, protein, and bio-available micronutrients (Fa et al., 2003; Siren and Machoa, 2008; Golden et al., 2011; Sarti et al., 2015; van Vliet et al., 2017) Yet the unsustainable hunting of many wild species threatens their survival, the functioning of their ecosystems, and the food security and cultural identity of many people worldwide (Wilkie et al., 2016).
The interactions between biodiversity and food security are poorly understood within Madagascar. The Masoala National Park—a UNESCO World Heritage site—is one of Madagascar's most intact and biodiverse forest ecosystems (Kremen et al., 1999; Kremen, 2003). Yet, this national park is under significant threat from deforestation and unsustainable hunting (Allnutt et al., 2013; Borgerson, 2016; Zaehringer et al., 2017). Here, we aim to (a) describe the state of food security, nutrition, biodiversity, and hunting on the Masoala Peninsula; and (b) understand how their interactions affect the future of public health and biodiversity conservation in Madagascar.
Methods
We used the following four multi-disciplinary methods to examine the interactions among human health, nutrition, and biodiversity at 13 sites surrounding the Masoala National Park. We collected this data during May until December 2015. All research was approved by Human Subjects Institutional Review Boards (Protocols #15-0331 Wildlife Conservation Society and #15-2230 Harvard T. H. Chan School of Public Health), the Republic of Madagascar and Madagascar National Parks (Permits 111/13, 325/14, 111/15, 218/15, 270/15, /MEEF/SG/DGF/DCB.SAPP/SCB). We obtained oral informed consent and/or assent from all participants.
Extensive Structured Interviews
All authors are either fluent in, or native speakers of, the local dialect of Betsimisaraka Malagasy. CB and BJRR asked members of 387 households in 13 communities about their hunting, collection of forest products for food, demographics, diet, health, income, and food security in a 1–2 h interview. We surveyed all households in small communities. In communities with >50 households, we randomly selected study households by using a grid system in each village, assigning a number to each household in each grid, and selecting a subset of households in all quadrants using a random number array. Individuals provided information about each type of cash-generation activity in Malagasy Ariary (MGA) and we converted estimates of cash income to United States Dollar (USD) at a rate of 3,000 MGA to the dollar (the conversion rate at the time of data collection). Because subsistence (and not cash) income was high, we also scored houses based on their size and the building materials used for their walls, floors, and roofs (ranked 1–3 based on local perceptions of quality), to provide a secondary indicator of wealth in addition to reported cash income. This total score was divided by the number of household members to control for the possibility that house size may increase with household size.
We determined food security using multiple methods. We used the Coping Strategies Index (CSI) (CARE, 2008) and the Household Food Insecurity Access Scale (HFAIS) (Coates et al., 2007) to measure changes in feelings, perceptions, and behaviors during the prior year (HFAIS) and prior week (CSI) in response to insufficient access to food (coping strategies). We then weighted CSI values based on the qualitative perception of the severity of each coping strategy in each community (categorically ranked on a scale of 1–4). A CSI or HFAIS score of 0 reflects a household which perceives itself as food secure and higher CSI or HFAIS scores reflect greater perceived food insecurity. We defined a food insecure household as any household that could not access adequate food to feed their family one or more days during the prior week. In order to gain a more detailed and holistic perspective of household food security, we also used a modified version of the Economist Intelligence Unit's (EIU) food security index (Myers et al., 2000), with additional data collected on forest provisioning services (Tables 1, 2).
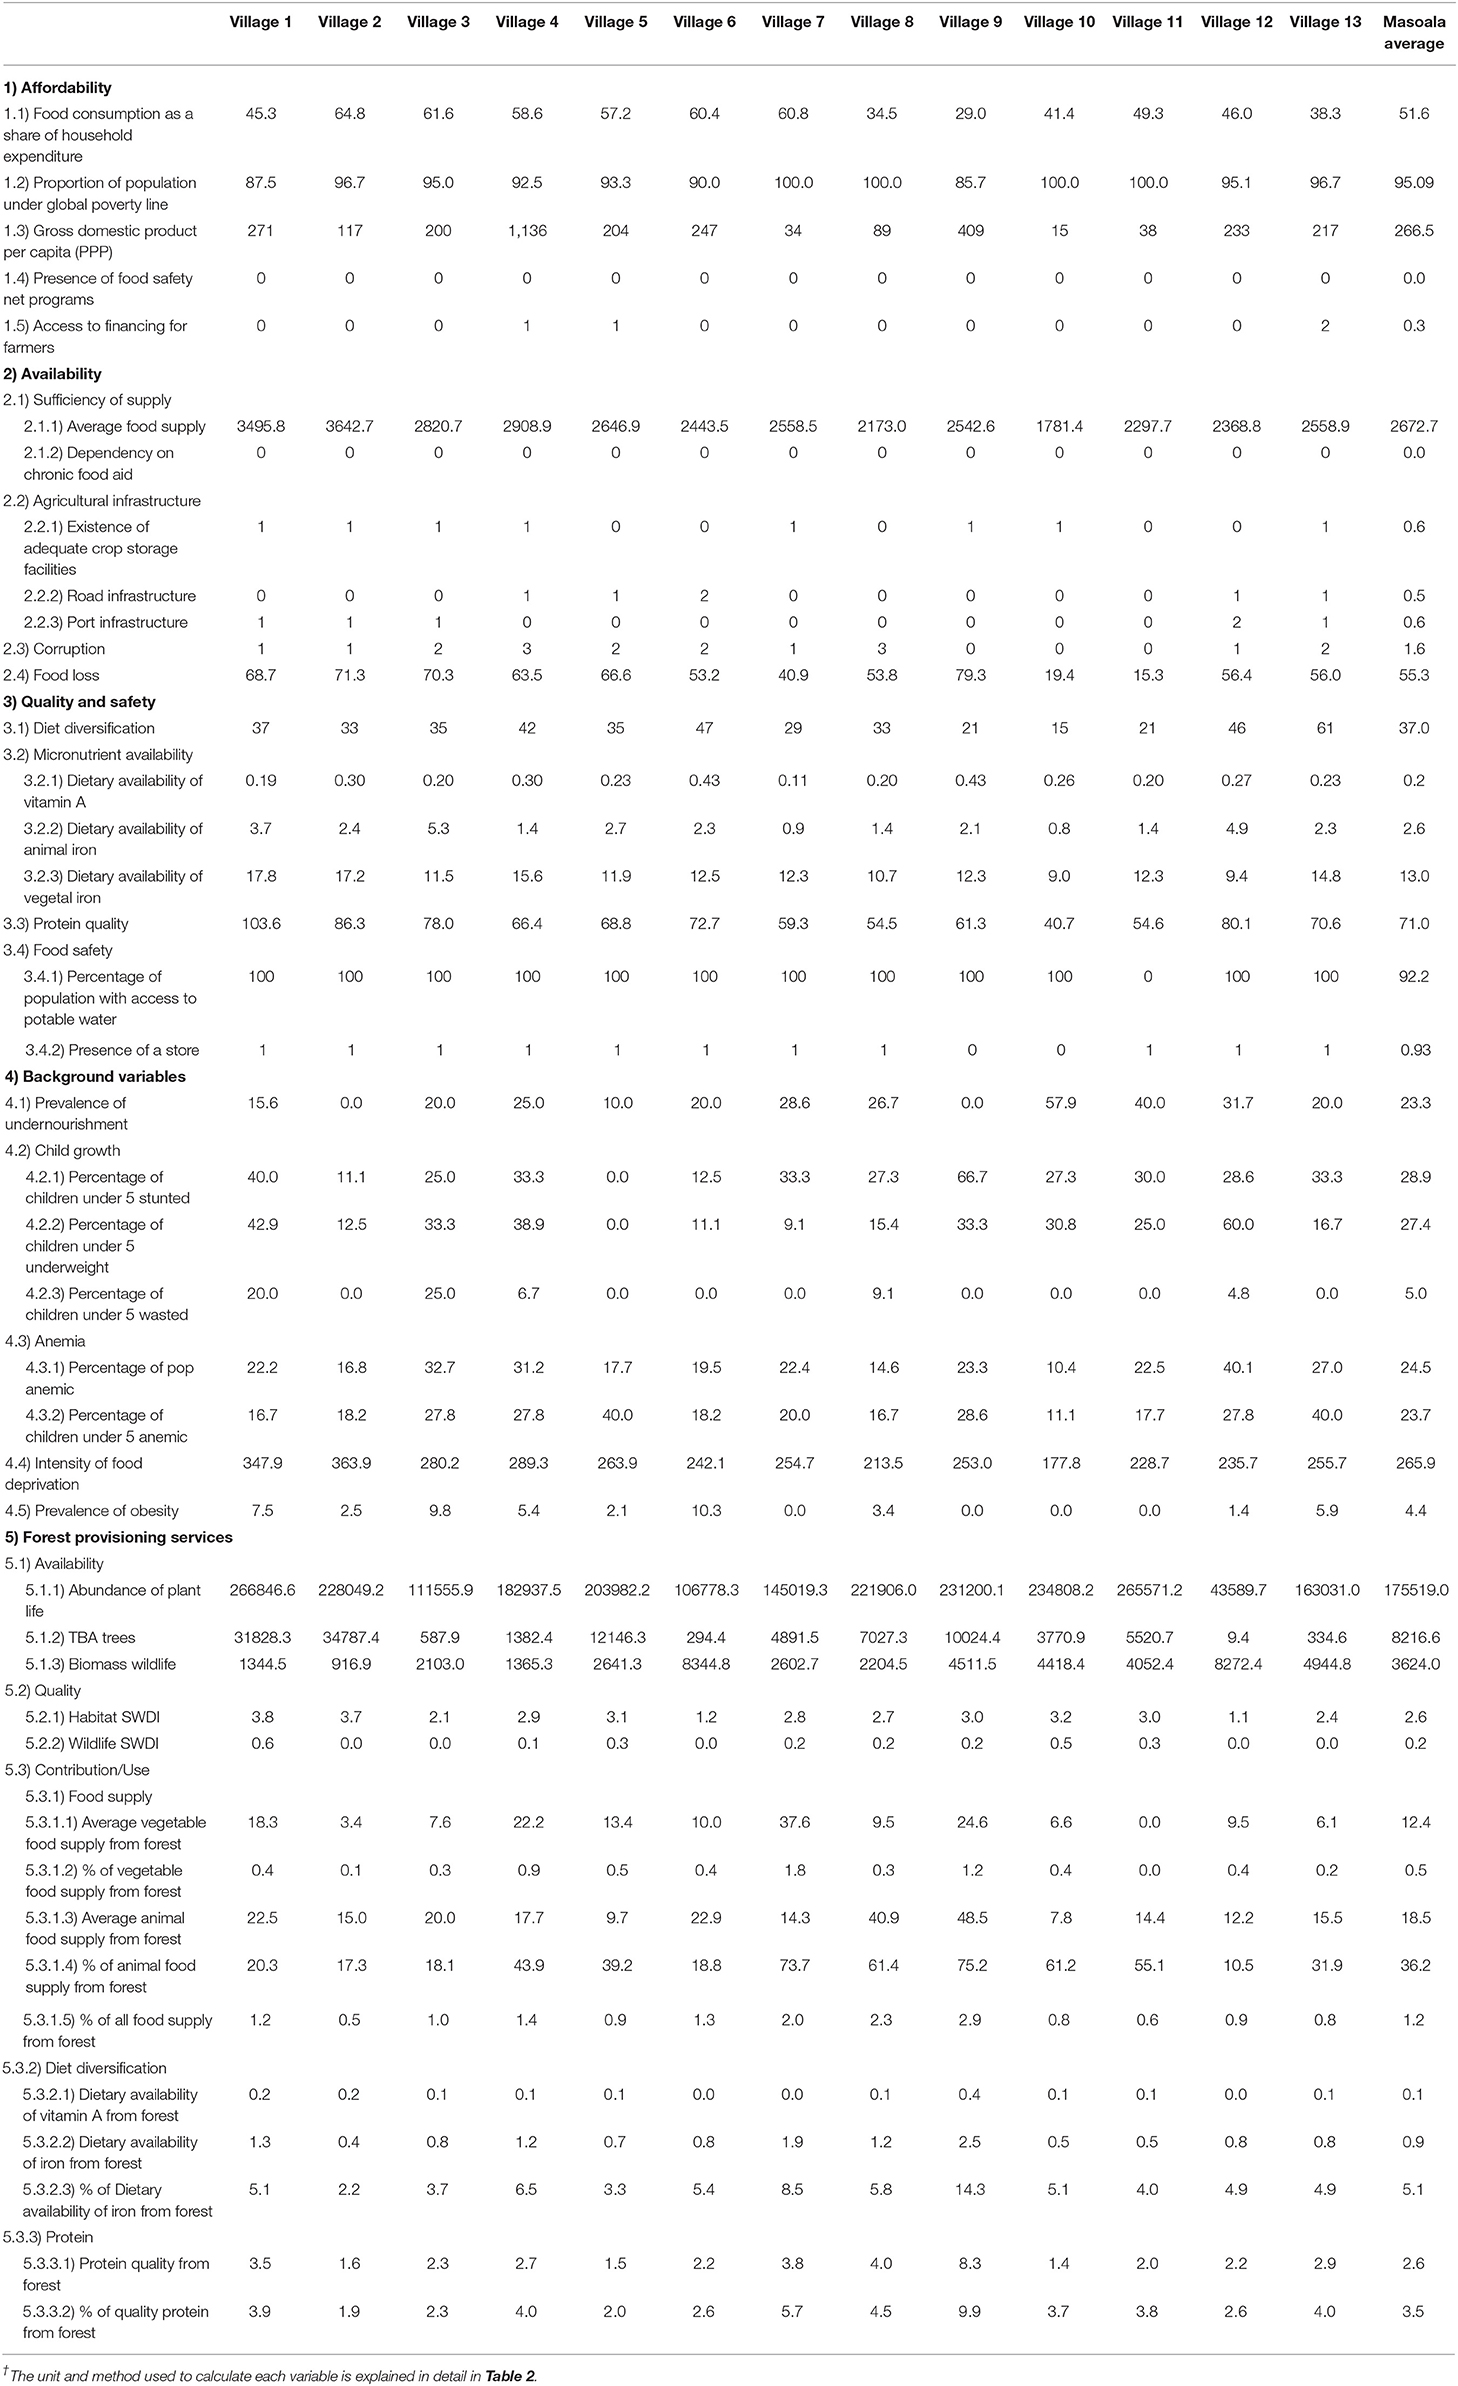
Table 1. Masoala food security (2015)†.
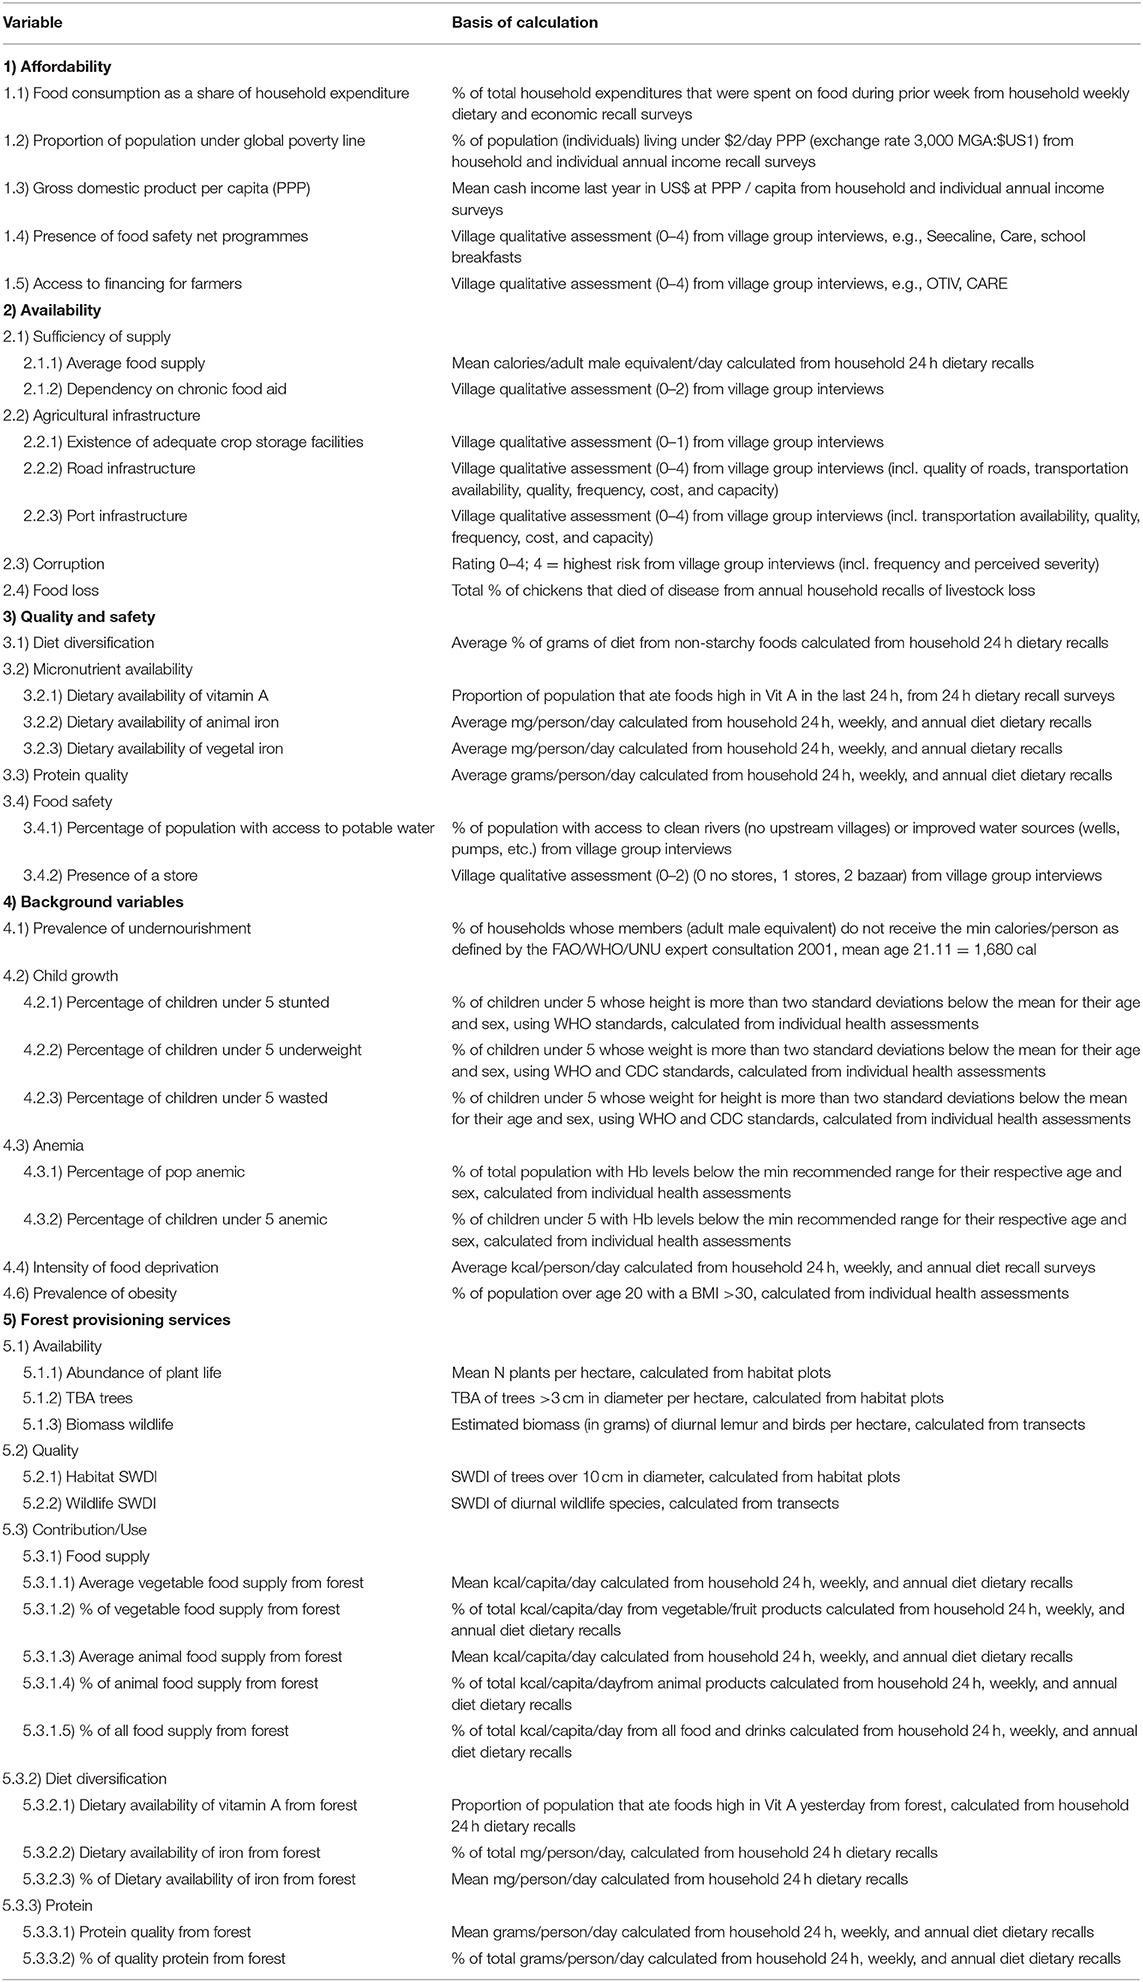
Table 2. Units and methods used to calculate Masoala food security variables (2015).
We asked households about the quantity of 160 different types of food they ate, including 24 forest mammals (Table 3), during the prior 24-h, week, month, and year (depending on how frequently the food was regularly consumed) and used data from the Food and Agriculture Organization of the United Nations (FAO) (FAO, 2012) and GENuS (Smith et al., 2016) to calculate dietary nutrient intake. We converted all household members into their adult-equivalent score using FAO guidelines (Food Agriculture Organization, 2004; Weisell and Dop, 2012). We recorded the quantities of foods eaten in local serving sizes and the weighed each serving size 10 times to determine a mean weight for calculations. For rarely consumed animals, we calculated the mean body mass of animals using previously published data (Goodman, 2011, 2012; Soarimalala and Goodman, 2011; Borgerson, 2015, 2016). Dietary diversity was measured using the Women's Dietary Diversity Scale (WDDS) (FAO, 2010).
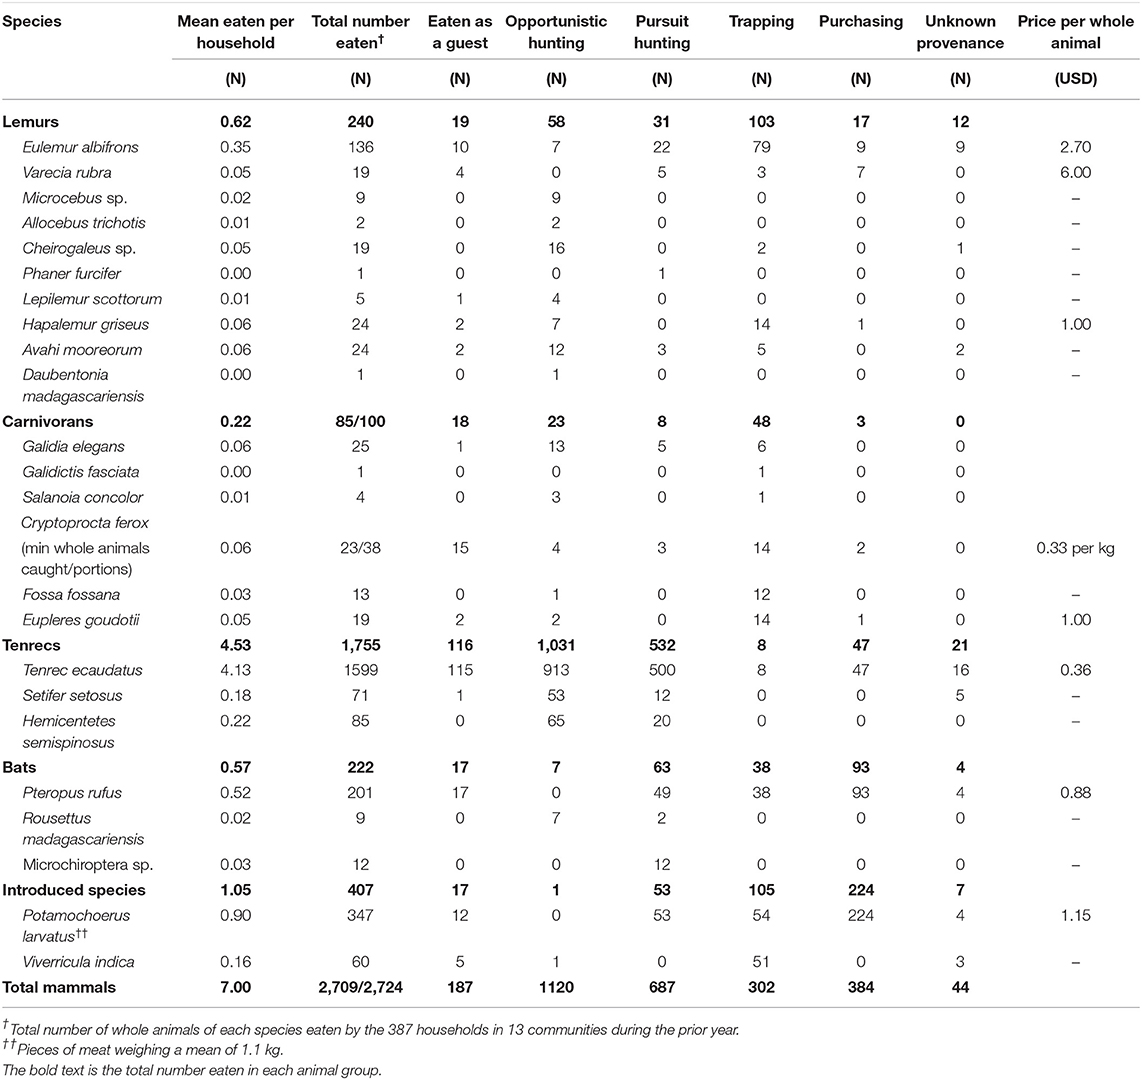
Table 3. Consumption and hunting of forest mammals during the prior year by members of 387 households in 13 communities surveyed near the Masoala National Park (2015).
Measurements of Human Health
During interviews, CB and BJRR collected 27 indicators of human health from 1,750 individuals aged 2 weeks to 91 years old (all available members of the 387 interviewed households). We measured individual height and weight, and used non-invasive photospectrometry to assess oxygen saturation and hemoglobin status using a MASIMO Pronto 7 hemoglobinometer. We also asked about each individual's overall morbidity. We used WHO and CDC guidelines to determine whether individuals were stunted, underweight, wasted, had severely low BMIs, or were anemic (WHO, 2006, 2011; Centers for Disease Control Prevention, 2012).
Lemur and Bird Surveys
BR used distance sampling methods (Buckland et al., 1993; Buckland, 2001) to assess the density, biomass, abundance, and population demographics of all diurnal lemur and bird species (groups of animals which are hunted and can be reliably surveyed using distance sampling methods). We established a total of 172 kilometers of transects (using a GPS) on the peninsula. Each of the 13 village sites contained two 2 km long transects. BR and a local field assistant walked each transect line at a maximum rate of 1 km/h, a minimum of 20 times. Two additional transects (total of 140 areal km in length) extended from the western border of the Masoala National Park through the interior, and ended at the eastern border, through the parks northern and southern regions. Each interior transect was walked twice. Each time we saw a lemur or bird, we recorded the age class, sex, group size/composition, height (m), angle, and the perpendicular distance (m) of the animal (or the center of the group of animals) from the transect line. We used published and estimated body weight data (Goodman, 2011, 2012; Soarimalala and Goodman, 2011; Borgerson, 2015, 2016) for different age/sex classes to determine biomass.
Habitat Sampling
DR and a local assistant collected botanical information using 156 forest plots, each 20 m in diameter. We employed the same 15 transect lines used for wildlife surveys for habitat sampling. At each of the village sites, 10 habitat plots were established in 200 meters increments at a 20 m distance from each of the wildlife transects. For the interior transects, plots were located every 5 km. Each plot was composed of three concentric circles. In the first circle (1 m radius), we sampled all small plants, i.e., woody seedlings and herbaceous ground cover with a diameter <2.5 cm, and estimated the percentage of ground cover for each species. In the second circle (3 m radius) we identified, counted, and measured the diameter at breast height (DBH) and height of woody stems of all medium plants, i.e., shrubs, saplings, and woody and herbaceous climbers (vines and lianas) between 2.5 and 10 cm in diameter. In the third circle (10 m radius), we identified the local species name of each large plant with a DBH ≥10 cm, and measured its DBH, crown width, height, bole height, and angle and distance from the plot center.
Results
Food Security
We found a high prevalence of both food insecurity and poverty on the Masoala Peninsula with 78% of Malagasy households being highly food insecure, experiencing food insecurity a mean of 3.26 days during the prior week [CSI mean 4.88 (range: 0–42); weighted CSI mean 11.74 (range: 0–99)]. We recorded data across 8 months which included prior week recalls of food insecurity during seasons of both low and high food security. The most frequently reported mechanisms for coping with food insecurity during the prior week were to: limit the portion size of all household members (16% of all incidences of coping strategies used); eat at the households of friends or family (13%); and rely on less preferred or less expensive foods (12%).
The mean household HFAIS score was 2.86 (household range 0–11). Participants reported two lean seasons, one in the austral winter and one in the summer, just before each rice harvest. The winter lean period was reported to be the most severe. During the prior year, nearly half of households (43.9%) worried that their household would not have enough food. Because of a lack of food-resources, 38.0% were unable to eat preferred foods and a third of households ate just a few kinds of food day after day (30.2%). A quarter of households ate less during meals than needed (27.1%) and believed they lost weight because of inadequate food (24.6%). One in every five households experienced a time during the prior year when there was no food at all in their household and/or fields and no financial resources to acquire more (19.4%), and/or reduced the number of meals they ate in a day (17.6%). Nearly one in ten (8.0%) households sold assets, land, or livestock to buy food during the prior year.
Over 95% of the surveyed population was under the global poverty line (defined as the percentage of individuals living under $2 per person per day) (Tables 1, 2), and cash income was primarily spent on food (Mean = 51.7%). Of food expenses, 73.2% of these were used to purchase ingredients for a meat or vegetable sauce to complement their rice staple. Comparatively, only 22% was spent on rice, 1% on tubers, and 4% on snacks.
Nutrition, Dietary Diversity, and Health
Overall nutrition was poor and dietary diversity was low (Tables 1, 2). A mean of 37.0% of all grams of food eaten during the prior week were from non-starchy foods. The diets of most households (77.3%) were moderately diverse during the prior week (Tables 1, 2, 4). One in four households ate any food high in Vitamin A within the previous 24 h (Tables 1, 2), and individuals ate a mean of 2.63 mg of iron from animal sources, 12.97 mg from all other food sources, and 70.97 g of quality protein per day.
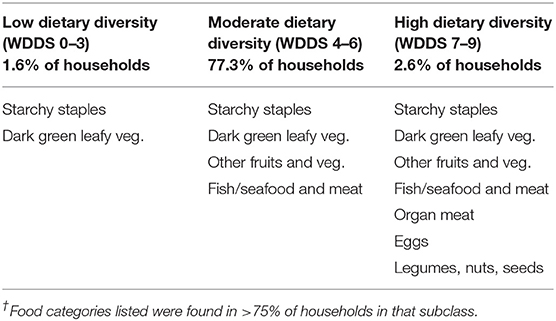
Table 4. Foods characterizing diets with low, moderate, and high diversity using a WDDS scale†.
We found high levels of stunting, underweight, wasting, and anemia and a moderate to high prevalence of anemia throughout all sub-populations measured on the Masoala (Tables 5, 6). There was notable variation between communities in these variables. Focusing on children under five, some communities reached levels of 67% stunting, 60% underweight, 25% wasting, and 40% anemia (Tables 1, 5). On average, however, the severity of the prevalence of stunting, underweight, wasting, and anemia in children under five on the peninsula is classified as medium for stunting, high for children who are underweight, and medium for wasting (Table 6; WHO, 2012).
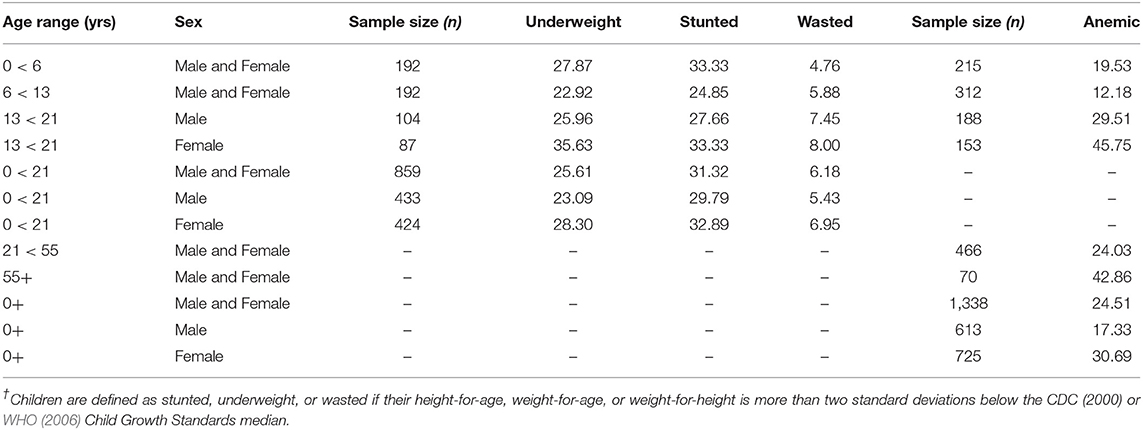
Table 5. Percentages of individuals (n = 1,750) classified as stunted, underweight, wasted, and anemic in the 13 communities surveyed near the Masoala National Park (2015)†.
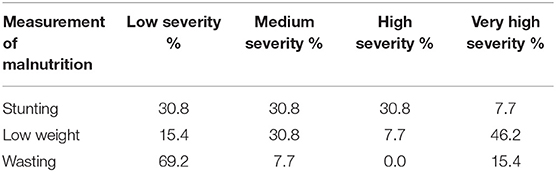
Table 6. The percentage of communities measured (n = 13) experiencing different levels of severity for child malnutrition (under age 5) on the Masoala Peninsula (2015) using WHO standards (2017).
Natural Resource Use
Local people reported a high reliance on the forest for food. Surveyed households ate 6,726 forest animals during the prior year (Table 3). Of the micro- and macro-nutrients provided by domestic and wild animal products (including fish, eggs, insects, honey, etc.), a mean of 36.2% of all calories (kcal) from animal products, 44.5% of all animal iron, and 38.4% of animal protein came from wild forest animals (Tables 1, 2). There was significant variation among communities. In some communities, as much as 75.2% of animal products came from forest animals, while in others, as little as 10.5% did (Tables 1, 2). People relied less on the forest for vegetables than they did for meat. Only 0.5% of all vegetables (kcal) eaten came from the forest, and communities were similar in their reliance on the forest for vegetable foods (Tables 1, 2). In total, an average of 1.2% of all kcal consumed per day came from forest products (village range = 0.5–2.9%).
Members of almost all households reported eating the meat of forest animals during the prior year (89.1%); 73.4% had eaten at least one forest mammal and 72.9% at least one forest bird. Household members ate a mean of 6.9 forest mammals and 10.4 forest birds, or 14.56 kg of wild meat per household per year. Nearly a third of households (30.0%) had eaten a threatened mammal during prior year. These households ate a mean of 1.3 threatened mammals. Tenrecs were eaten by the greatest percentage of households (50.9%), followed by the meat of bushpigs (34.9%), lemurs (18.9%), euplerids (13.7%), introduced carnivorans (10.6%), and bats (10.6%). The vast majority of catch was eaten by members of the hunter's own household and was not sold (Table 3). Of the 6,726 forest animals eaten, 40.3% were mammals and 59.7% were birds. Tenrecs were the most frequently caught forest mammal (64.8% of the total number of forest mammals caught), followed in number by bushpigs (12.8%), lemurs (8.9%), bats (8.2%), native euplerid carnivorans (3.1%), and introduced carnivorans (2.2%) (Table 3). Because the hunting of many species is prohibited, the hunting and consumption of many animal species is likely under-reported. Actual levels of hunting are likely higher than reported here.
Eighty-six percent of measured households ate any kind of fish or meat during the prior week, and 57.1% ate the meat of domestic animals. Chickens were the most commonly owned domestic livestock, followed by ducks (Table 7). Yet, over three-quarters of poultry (79.0%) died during the prior year from an illness consistent with the symptoms and timing of Newcastle disease.

Table 7. The range and mean of household livestock assets on the Masoala Peninsula (2015).
Biodiversity
The availability and quality of habitat varied greatly between villages (Tables 1, 2). A total of 0.64 km2 of forested land were cleared for new (not in fallow) agricultural lands over the prior year; 13.7% of households cleared this land at a mean distance of 81 min from their home. Households cleared an average of 12,065 m2 of land (or 1,652 m2 when including households that did not clear land); 84.2% of this land was subsequently used for subsistence agriculture, 11.3% for cash crops, 1.9% for livestock, and 1.9% was sold.
Lemurs were more abundant and found in larger cluster sizes within the Masoala National Park than near villages. Varecia rubra were found throughout the park interior at a mean density of 8.3 animals per square kilometer (expected cluster size = 5.6), and Eulemur albifrons were found at a mean density of 58.1 animals per square kilometer (expected cluster size = 5.5). V. rubra were present at five of the thirteen village sites at densities ranging from 0–13.6 per km2. The mean density of V. rubra at all village sites was 2.9 animals per square kilometer (expected cluster size = 2.2). E. albifrons were present at eight of the thirteen village sites at densities ranging from 0 to 91.3 animals per square kilometer. The mean density of E. albifrons at all village sites was 16.5 animals per square kilometer, with an expected cluster size of 4.3.
Forest plots were significantly richer, in all plant size classes, within the Masoala National Park than near villages (Small plants: T = 17.56, DF = 151, P < 0.0001; Medium plants: T = 16.66, DF = 151, P < 0.0001; Large plants: T = 14.40, DF = 151, P < 0.0001). Medium and large plants also had significantly larger DBH (Medium plants: T = 5.33, DF = 1,036, P < 0.0001; Large plants: T = 2.29, DF = 1,315, P = 0.02) and were significantly taller (Medium plants: T = 7.21, DF = 1,036, P < 0.0001; Large plants: T = 22.06, DF = 1,315, P < 0.0001). There were significantly more medium and large plants and significantly fewer small plants in forest plots within the Masoala National Park than those plots near villages (Small plants: T = 4.11, DF = 151, P < 0.0001; Medium plants: T = 11.82, DF = 151, P < 0.0001; Large plants: T = 6.10, DF = 151, P < 0.0001). Further, there were 10 times as many stems of small plants whose identity was unknown within the park. These differences in habitat resulted in a total basal area of plants per hectare 50% larger and a total available crown area per hectare twice as large within the park than outside of it (Total basal area: 9,027.13 vs. 6,927.63 m2; Total available crown area: 19,112.39 vs. 7,606.61 m2).
Discussion
The future of lemurs, 94% of which are threatened with extinction (Schwitzer et al., 2013), depends on the sustainable diets of a malnourished human population who commonly hunts them for food (Borgerson, 2015; Borgerson et al., 2016). We found a high prevalence of both food insecurity and poverty surrounding the Masoala National Park, a UNESCO World Heritage Site. Eighty percent of households on the Masoala experienced food insecurity over the course of a year and 95% lived in persistent poverty. Both food insecurity and poverty on the Masoala are higher than national averages (WHO, 2012), which already place Madagascar as the third least food secure nation in the world (Economist Intelligence Unit, 2017). The prevalence of poverty on the Masoala exceeds that of Burundi and the Democratic Republic of Congo, the only two nations that are ranked below Madagascar in food security, and, unlike Madagascar, are recovering from violent civil wars (Economist Intelligence Unit, 2017).
Children on the Masoala were highly malnourished and one-quarter of the population was anemic, far higher than in other regions of Madagascar (Mould et al., 2016). In order to meet the requirements for a healthy diet, local people relied on the forest for food, yet still often failed to meet these objectives. While wild meats are not a staple food, most households depended on them. Wildlife consumption was common throughout the region; 89% of households ate wildlife within the prior year on the Masoala, nearly twice the prevalence of other regions worldwide (Rowland et al., 2016). Those surveyed ate 6,726 forest animals (mean of 7 mammals and 10 birds per household), or ~3.27 kg of wild meat per person (4.48 kg per adult equivalent) during the prior year. This amount of wildlife is much higher than that reported in other regions of Madagascar including Kianjavato (Borgerson et al., 2018a), Alaotra (Borgerson et al., 2018b), and Betampona (Golden et al., 2014b), but it is similar to that reported in nearby Makira (Golden et al., 2014a; Brook et al., 2019), and far less than the amount eaten in the Amazon and Congo basins (63 and 51 kg/capita/year, respectively; Nasi et al., 2011). Further, as much as 75% of all meat eaten in some communities was from forest animals. People ate very low quantities of iron and protein and in some communities as much as 76% of protein and 74% of iron came from forest meats.
Healthy forests can support the food security of the most vulnerable households in a region by directly supplying a wide variety of wild foods that increase the quality, security, and diversity of local diets. The meat of wild animals provided valuable micronutrients to people experiencing food insecurity and malnutrition, yet the hunting of threatened species is an untenable solution to food insecurity. Further, continued habitat loss in the region will likely only reduce access to wild foods in the future and increase the reliance on less-diverse foods (Powell et al., 2011; Sunderland, 2011; Sunderland et al., 2017). In order to improve human well-being in the long term, forests must be conserved and hunting must be reduced to sustainable levels.
Conservation efforts to reduce the unsustainable hunting of threatened species are unlikely to alter the behavior of hunters unless they address the goals, reasons, and incentives for hunting. Improving food security can increase the sustainability of hunting, improving both forest conservation and human nutrition in the long term, allowing for forests to provide essential services to those who live near them. Yet, few micronutrient-rich alternatives to wild meats were available in adequate supply and many were highly volatile; 79% of all chickens died from Newcastle disease in the prior year. In order to reduce the unsustainable hunting of threatened species while improving household food security and child health, we suggest testing the effects of increasing the affordability, accessibility, and stability of micro-nutrient rich animal-sourced foods in remote communities, where forests contribute the most to food security.
In conclusion, we believe that by using an integrated approach to improve food security in one of the world's most biodiverse and least food secure nations, we can both conserve Madagascar's unique biodiversity and improve the nutrition and health of Madagascar's people.
Ethics Statement
We collected this data during May until December 2015 and all research was approved by Human Subjects Institutional Review Boards (Protocols #15-0331 Wildlife Conservation Society and #15-2230 Harvard T. H. Chan School of Public Health), the Republic of Madagascar and Madagascar National Parks (Permits 111/13, 325/14, 111/15, 218/15, 270/15, /MEEF/SG/DGF/DCB.SAPP/SCB). We obtained oral informed consent and/or assent from all participants.
Author Contributions
CB, BR, DR, and BJRR collected the data. CB designed the study and completed data analysis. CB and CG interpreted the data and wrote this manuscript. All authors approved the final manuscript.
Funding
This research was funded by grants from the National Geographic Society Conservation Trust (C280–14 and C021–17) and the National Science Foundation SBE-IBSS Postdoctoral Research Fellowship (1513638).
Conflict of Interest
The authors declare that the research was conducted in the absence of any commercial or financial relationships that could be construed as a potential conflict of interest.
Acknowledgments
We would like to extend our deepest gratitude to the villages of the Masoala and the warm welcome we received from the many people there. Without you, this project would have been impossible. We would also like to thank Laurie R. Godfrey and Margaret A. McKean for their support during the design of the project; the Madagascar Health and Environmental Research (MAHERY) team during the execution of the research; our editor, Amy Ickowitz, and the reviewers who substantially improved this manuscript; and the Republic of Madagascar, Madagascar National Parks, and MICET for their continued support.
References
Allnutt, T. F., Asner, G. P., Golden, C. D., and Powell, G. V. N. (2013). Mapping recent deforestation and forest disturbance in northeastern Madagascar. Trop. Conserv. Sci. 6, 1–15. doi: 10.1177/194008291300600101
Black, R. E., Victora, C. G., Walker, S. P., Bhutta, Z. A., Christian, P., de Onis, M., et al. (2013). Maternal and child undernutrition and overweight in low-income and middle-income countries. Lancet 382, 427–51. doi: 10.1016/S0140-6736(13)60937-X
Borgerson, C. (2015). The effects of illegal hunting and habitat on two sympatric endangered primates. Int. J. Primatol. 36, 74–93. doi: 10.1007/s10764-015-9812-x
Borgerson, C. (2016). Optimizing conservation policy: the importance of seasonal variation in hunting and meat consumption on the Masoala peninsula of Madagascar. Oryx 50, 405–418. doi: 10.1017/S0030605315000307
Borgerson, C., Johnson, S. E., Louis, E. E, Holmes, S. M., Gasta, A. E. J., Randriamady, H. J., et al. (2018a). The use of natural resources to improve income, health, and nutrition within the forests of Kianjavato, Madagascar. Madag. Conserv. Dev. 13, 45–52. doi: 10.4314/mcd.v13i1.6
Borgerson, C., McKean, M.A., Sutherland, M.R., and Godfrey, L.R. (2016). Who hunts lemurs and why they hunt them. Biol. Conserv. 197, 124–130. doi: 10.1016/j.biocon.2016.02.012
Borgerson, C., Vonona, M. A., Vonona, T, et al. (2018b). An evaluation of the interactions among household economies, human health, and wildlife hunting in the Lac Alaotra wetland complex of Madagascar. Madagascar Conservation & Development 13, 25–33. doi: 10.4314/mcd.v13i1.5
Brook, C. E., Herrera, J., Borgerson, C., Fuller, E., Andriamahazoarivosoa, P., Rasolofoniaina, B. J. R., et al. (2019). Population viability and bushmeat harvest sustainability for Madagascar lemurs. Conserv. Biol. 33, 99–111. doi: 10.1111/cobi.13151
Buckland, S. T. (2001). Introduction to Distance Sampling: Estimating Abundance of Biological Populations. London, UK: Oxford University Press
Buckland, S. T., Anderson, D. R., Burnham, K. P., and Laake, J. L. (1993). Distance Sampling: Estimating Abundance of Biological Populations. London, UK: Chapman and Hall London.
Centers for Disease Control Prevention (2012). National Center for Health Statistics CDC Growth Charts. CDC. Available online at: http://www.cdc.gov/growthcharts/ (accessed July 10, 2019).
Coates, J., Swindale, A., and Bilinsky, P. (2007). Household Food Insecurity Access Scale (HFIAS) for Measurement of Household Food Access: Indicator Guide (v. 3). Food and Nutrition Technical Assistance Project. Washington, DC: Academy for Educational Development.
Economist Intelligence Unit (2014). Global Food Security Index 2014: An Annual Measure of the State of Global Food Security. London, UK: The Economist Intelligence Unit Limited.
Economist Intelligence Unit (2016). Global Food Security Index 2016: An Annual Measure of the State of Global Food Security. London, UK: The Economist Intelligence Unit Limited.
Economist Intelligence Unit (2017). Global Food Security Index 2017: An Annual Measure of the State of Global Food Security. London, UK: The Economist Intelligence Unit Limited.
Ezzati, M., Lopez, A. D., Rodgers, A., Hoorn, S. V., and Murray, C. J. L. (2002). Selected major risk factors and global and regional burden of disease. Lancet 360, 1347–1360. doi: 10.1016/S0140-6736(02)11403-6
Fa, J. E., Currie, D., and Meeuwig, J. (2003). Bushmeat and food security in the Congo Basin: linkages between wildlife and people's future. Environ. Conserv. 30, 71–8. doi: 10.1017/S0376892903000067
FAO (2010). Guidelines for Measuring Household and Individual Dietary Diversity. Rome: Nutrition and Consumer Protection Division, Food and Agriculture Organization of the United Nations. 60.
FAO (2012). West African Food Composition Table. Rome: Food and Agriculture Organization of the United Nations. 171.
Food and Agriculture Organization (2004). Human Energy Requirements. Report of a Joint FAO/WHO/UNU Expert Consultation. FAO Food and Nutrition Technical Report Series No. 1. Rome: FAO.
Food and Agriculture Organization. (2013). “Forests and trees outside forests are essential for global food security and nutrition,” in Summary of the International Conference on Forests for Food Security and Nutrition (Rome: FAO).
Golden, C. D., Bonds, M. H., Brashares, J. S., Rasolofoniaina, B. J. R., and Kremen, C. (2014a). Economic valuation of subsistence harvest of wildlife in Madagascar. Conserv. Biol. 28, 234–243. doi: 10.1111/cobi.12174
Golden, C. D., Fernald, L. C. H., Brashares, J. S., Rasolofoniaina, B. J. R., and Kremen, C. (2011). Benefits of wildlife consumption to child nutrition in a biodiversity hotspot. Proc. Natl. Acad. Sci. U.S.A. 108:19653–19656. doi: 10.1073/pnas.1112586108
Golden, C. D., Rabehatonina, J. G. C., Rakotosoa, A., and Moore, M. (2014b). Socio-ecological analysis of natural resource use in Betampona Strict Natural Reserve. Madagas. Conserv. Dev. 9, 83–89. doi: 10.4314/mcd.v9i2.4
Goodman, S. M. (2011). Les Chauves-Souris de Madagascar. Madagascar: Association Vahatra Antananarivo.
Ickowitz, A., Powell, B., Salim, M. A., and Sunderland, T. C. H. (2014). Dietary quality and tree cover in Africa. Glob. Environ. Change 24, 287–294. doi: 10.1016/j.gloenvcha.2013.12.001
Ickowitz, A., Rowland, D., Powell, B., Salim, M. A., and Sunderland, T. (2016). Forests, trees, and micronutrient-rich food consumption in Indonesia. PLoS ONE 11:e0154139. doi: 10.1371/journal.pone.0154139
International Food Policy Research Institute (2016). Global Nutrition Report 2016: From Promise to Impact: Ending Malnutrition by 2030. Washington, DC: IFRI.
Johnson, K. B., Jacob, A., and Brown, M. E. (2013). Forest cover associated with improved child health and nutrition: evidence from the Malawi demographic and health survey and satellite data. Glob. Health Sci. Pract. 1, 237–248. doi: 10.9745/GHSP-D-13-00055
Kremen, C. (2003). “The Masoala Peninsula,” in The Natural History of Madagascar, eds S. M. Goodman and J. P. Benstead (Chicago, IL: The University of Chicago Press), 1459–1466.
Kremen, C., Razafimahatratra, V., Guillery, R. P., Rakotomalala, J., Weiss, A., and Ratsisompatrarivo, J. S. (1999). Designing the Masoala National Park in Madagascar based on biological and socioeconomic data. Conserv. Biol. 13, 1055–1068. doi: 10.1046/j.1523-1739.1999.98374.x
Lopez, A. D., Mathers, C. D., Ezzati, M., Jamison, D. T., and Murray, C. J. L. (2006). Global and regional burden of disease and risk factors, 2001: systematic analysis of population health data. Lancet 367, 1747–1757. doi: 10.1016/S0140-6736(06)68770-9
Mould, D., Carlson, A., Christofides, N., and Greiner, K. (2016). Socio-Cultural Determinants for the Adoption of Essential Family Practices in Madagascar. Athens, OH: The Institute for the African Child.
Myers, N., Mittermeier, R. A., Mittermeier, C. G., da Fonseca, G. A. B., and Kent, J. (2000). Biodiversity hotspots for conservation priorities. Nature 403, 853–858. doi: 10.1038/35002501
Nasi, R., Taber, A., and van Vliet, N. (2011). Empty forests, empty stomachs? Bushmeat and livelihoods in the Congo and Amazon Basins. Int. Forestry Rev. 13, 355–368. doi: 10.1505/146554811798293872
Powell, B., Hall, J., and Johns, T. (2011). Forest cover, use and dietary intake in the East Usambara Mountains, Tanzania. Int. Forestry Rev. 13, 305–317. doi: 10.1505/146554811798293944
Rice, B. L., Golden, C. D., Anjaranirina, E. J. G., Matella Botelho, C., Volkman, S. K., and Hartl, D. L. (2016). Genetic evidence that the Makira region in northeastern Madagascar is a hotspot of malaria transmission. Malaria J. 15, 596–608 doi: 10.1186/s12936-016-1644-4
Rowland, D., Ickowitz, A., Powell, B., Nasi, R., and Sunderland, T. (2016). Forests foods and healthy diets: quantifying the contributions. Environ. Conserv. 44, 102–114. doi: 10.1017/S0376892916000151
Sarti, F. M., Adams, C., Morsello, C., van Vliet, N., Schör, T., Yagüe, B, Tellez, L., et al. (2015). Beyond protein intake: bushmeat as source of micronutrients in the Amazon Tri- Frontier region. Ecol. Soc. 20:22. doi: 10.5751/ES-07934-200422
C., Schwitzer, R. A., Mittermeier, N., Davies, S., Johnson, J., Ratsimbazafy, J., Razafindramanana. (eds.). (2013). Lemurs of Madagascar: A Strategy for Their Conservation 2013–2016. Bristol: IUCN SSC Primate Specialist Group; Bristol Conservation and Science Foundation, and Conservation International, 1–197.
Siren, A., and Machoa, J. (2008). Fish, wildlife, and human nutrition in tropical forests: a fat gap? Interciencia 33, 186–193.
Smith, M. R., Micha, R., Golden, C. D., Mozaffarian, D., and Myers, S. S. (2016). Global Expanded Nutrient Supply (GENuS) model: a new method for estimating the global dietary supply of nutrients. PLoS ONE. 11:e0146976. doi: 10.1371/journal.pone.0146976
Soarimalala, V., and Goodman, S. M. (2011). Les Petits Mammiferes de Madagascar. Madagascar: Association Vahatra Antananarivo.
Sunderland, T., Powell, B., Ickowitz, A., Foli, S., Pinedo-Vasquez, M., Nasi, R., et al. (2017). Food Security and Nutrition: The Role of Forests. Discussion Paper. Bogor: CIFOR. 1–20.
Sunderland, T. C. H. (2011). Food security: why is biodiversity important? Int. Forestry Rev. 13, 265–274. doi: 10.1505/146554811798293908
Tata, C. Y., Ickowitz, A., Powell, B., and Colecraft, E. K. (2019). Dietary intake, forest foods, and anemia in Southwest Cameroon. PLoS ONE 14:e0215281. doi: 10.1371/journal.pone.0215281
van Vliet, N., Moreno, J., Gómez, J., Zhou, W., Fa, J. E., Golden, C. D., et al. (2017). Bushmeat and human health: Assessing the evidence in tropical and sub-tropical forests. Ethnobiol. Conserv. 6, 1–45. doi: 10.15451/ec2017-04-6.3-1-45
Weisell, R., and Dop, M. C. (2012). The adult male equivalent concept and its application to household consumption and expenditures surveys (HCES). Food Nutr. Bull. 33, S157–S162 doi: 10.1177/15648265120333S203
WHO (2006). WHO Child Growth Standards. Geneva: World Health Organization. Available online at: http://www.who.int/childgrowth/standards/en/ (accessed July 10, 2019).
WHO (2011). Hemoglobin Concentrations for the Diagnosis of Anemia and Assessment of Severity. Vitamin and Mineral Nutrition Information System. Geneva: World Health Organization. Available online at: http://www.who.int/vmnis/indicators/haemoglobin.pdf (accessed March 21, 2017).
WHO (World Health Organization) (2012). WHO Global Database on Child Growth and Malnutrition. Available online at: https://goo.gl/1JsvCd (accessed July 10, 2019).
Wilkie, D. S., Wieland, M., Boulet, H., Le Bel, S., van Vliet, N., Cornelis, D., et al. (2016). Eating and conserving bushmeat in Africa. Afr. J. Ecol. 54, 402–414. doi: 10.1111/aje.12392
Zaehringer, J. G., Schwilch, G., Andriamihaja, O. R., Ranamonjosoa, B., and Messerli, P. (2017). Remote sensing combined with socio-ecological data: the importance of diverse land uses for ecosystem service provision in north-eastern Madagascar. Ecosyst. Serv. 25, 140–152. doi: 10.1016/j.ecoser.2017.04.004
Keywords: bushmeat, conservation, food security, hunting, lemur, Madagascar, Masoala National Park, nutrition
Citation: Borgerson C, Razafindrapaoly B, Rajaona D, Rasolofoniaina BJR and Golden CD (2019) Food Insecurity and the Unsustainable Hunting of Wildlife in a UNESCO World Heritage Site. Front. Sustain. Food Syst. 3:99. doi: 10.3389/fsufs.2019.00099
Received: 03 February 2019; Accepted: 14 October 2019;
Published: 01 November 2019.
Edited by:
Amy Ickowitz, Center for International Forestry Research, IndonesiaReviewed by:
Bronwen Powell, Pennsylvania State University, United StatesStephen A. Wood, The Nature Conservancy, United States
Lauren Coad, Center for International Forestry Research, Indonesia
Copyright © 2019 Borgerson, Razafindrapaoly, Rajaona, Rasolofoniaina and Golden. This is an open-access article distributed under the terms of the Creative Commons Attribution License (CC BY). The use, distribution or reproduction in other forums is permitted, provided the original author(s) and the copyright owner(s) are credited and that the original publication in this journal is cited, in accordance with accepted academic practice. No use, distribution or reproduction is permitted which does not comply with these terms.
*Correspondence: Cortni Borgerson, borgersonc@montclair.edu