Piloting Citizen Science Methods to Measure Perceptions of Carbon Footprint and Energy Content of Food
 Beth Armstrong1
  Gemma Bridge2
  Libby Oakden1
  Christian Reynolds1,3*
  Changqiong Wang4
  Luca A Panzone5
  Ximena Schmidt Rivera6 Astrid Kause7
  Charles Ffoulkes8 Coleman Krawczyk9 Grant Miller10
  Stephen Serjeant11
- 1Department of Geography, Faculty of Social Sciences, The University of Sheffield, Sheffield, United Kingdom
- 2Leeds Business School, Leeds Beckett University, Leeds, United Kingdom
- 3Center for Food Policy, City, University of London, London, United Kingdom
- 4Wolfson Institute of Preventive Medicine, Barts and The London School of Medicine and Dentistry, Queen Mary University of London, London, United Kingdom
- 5School of Natural Science and Environment, Newcastle University, Newcastle upon Tyne, United Kingdom
- 6Institute of Energy Futures, College of Engineering, Design and Physical Sciences, Brunel University London, Uxbridge, United Kingdom
- 7Centre for Decision Research & Priestley International Centre for Climate, University of Leeds, Leeds, United Kingdom
- 8Sustainable Food and Farming, Agricultural Development Advisory Service (ADAS), Wolverhampton, United Kingdom
- 9Institute of Cosmology and Gravitation, University of Portsmouth, Portsmouth, United Kingdom
- 10Zooniverse, University of Oxford, Zooniverse, United Kingdom
- 11Faculty of Science, Technology, Engineering & Mathematics, School of Physical Sciences, The Open University, Milton Keynes, United Kingdom
There is a food knowledge disconnect between the food research community, and the general population. Food experts know detailed information about foods, but there is a lack of understanding about what citizens know. Citizen science has been used successfully in various fields however, is virtually absent from food research. This pilot study explores the efficacy of Zooniverse citizen science platform as a method of food citizen research, and assesses the impact of response method, food type, portion size and weight information, on estimates of carbon footprint and energy content. Estimates of the carbon footprint (grams of carbon dioxide equivalent) and energy content (Kcal) of 10 foods were measured in a 3 (Between: Response Method; multiple-choice, slider, text box) × 3 (Within: portion size; small, medium, large) × 2 (Between: weight information; present, absent) observational survey. Citizens (N = ~516, unique IP addresses) were recruited via informal email networks. Kruskal–Wallis and Chi-square analyses compared citizen estimations with validated values, and assessed the impact of the variables on estimations. The majority of carbon footprint and energy content estimates were inaccurate, with citizens typically overestimating values. We observe an unexpected correlation between carbon footprint and energy content estimates. Portion size impacts perceptions, with estimations increasing with larger portion sizes. Weight information impacts perceptions, with estimations of carbon footprint being lower, and estimates of energy content being higher when weight information is present. Input method significantly affects observed values, estimates of carbon footprint and energy content estimates were lowest using the text box, followed by the slider tool, highest estimates were given using multiple choice. Citizens are unable to accurately estimate the carbon footprint and energy content of foods, though citizens may possess understanding of the hierarchy of values. These compelling findings highlight the need for consumer education, with a focus on carbon footprint, to precede interventions intended to move consumers toward more sustainable and healthy diets. We have demonstrated that citizen science can be used to measure food carbon footprint and energy content perceptions, and the slider tool offers greater sensitivity of estimation and functionality than other input methods.
Introduction
Sustainable food consumption is considered critical for climate change mitigation and adaptation strategy (Hyland et al., 2017; Tirado-Von Der Pahlen, 2017; Clark, 2019). Sustainable food choices are key to reducing environmental impact (CCC, 2020) with the food lifecycle contributing 20–30% of global greenhouse gas emissions (GHGE) (Kause et al., 2009; Poore and Nemecek, 2018). Similarly, increasing healthy diet choices are key to improving consumer health by reducing diet-related chronic diseases. Consequently, it is essential to move consumers toward more sustainable and healthy diets.
Evidence based dietary guidelines, advice, and policy encourages people toward sustainable and healthy diets (Kause et al., 2009; Health Council of the Netherlands, 2011; Ministers NC, 2014; Reynolds et al., 2014; Monteiro et al., 2015; Fischer and Garnett, 2016; Freidberg, 2016; van't Veer et al., 2017; Poore and Nemecek, 2018; CCC, 2020). However, recent research suggests there is a food-knowledge disconnect between the food research community, and the general public, with the citizens typically underestimating the carbon footprint, misestimating portion sizes, and energy content of foods (Rolls et al., 2002; Choi and Pak, 2006; Carels et al., 2007; Steenhuis and Vermeer, 2009; Chernev and Chandon, 2010; Miyazaki et al., 2011; Lee et al., 2012; Holmstrup et al., 2013; Cohen and Story, 2014; Liu et al., 2015; Jones et al., 2016; Panzone et al., 2016, in press; Hartmann and Siegrist, 2017; Edelson et al., 2018; Shi et al., 2018; Camilleri et al., 2019; Kemper et al., 2019; Thomas and Kyung, 2019). The public are motivated to reduce the environmental impact of their diet with two thirds of surveyed EU consumers being open to changes in diet and 40% having already reduced or stopped red meat consumption. However, the public lack understanding about the environmental impact of their own food choices (Bureau Européen des Unions de Consommateurs, 2020). Bureau Européen des Unions de Consommateurs (2020) recommend that advice and guidance about the sustainability of food should be provided, allowing the public to make more informed and sustainable food choices.
Studies have shown that estimating portion sizes is still a problem across society. Misestimating portion sizes can lead to overconsumption, which may contribute diet-related chronic diseases such as obesity, diabetes, heart disease, and food waste which can contribute to carbon emissions, and climate change (Rolls et al., 2002; Steenhuis and Vermeer, 2009; Miyazaki et al., 2011). Consequently, it is imperative to understand perceptions about portion size, energy content and the carbon footprint of food, to develop effective interventions to tackle both climate change and diet-related chronic diseases (Camilleri et al., 2019).
Previous studies have used various survey and response input methods to collect estimates of carbon footprint (embodied carbon emissions) or energy content (calories), these include blank text boxes (Camilleri et al., 2019; Panzone et al., in press), slider tools (Shi et al., 2018), and multiple choice (Panzone et al., 2016). A direct comparison of input methods on self-report drinking behavior found that responses using a slider were inflated compared to those input using a text box (Kemper et al., 2019), however it is not clear whether this effect will be present in measures related to perceptions of energy content and carbon footprint. As input method can impact participant response (Kemper et al., 2019; Thomas and Kyung, 2019), it is important to identify the most appropriate input method to gauge an accurate understanding of carbon footprint and energy content knowledge of citizens.
Perception of portion sizes using images and self-reporting have also been studied, with technology (e.g., apps) being used to aid consumers with nutritional and portion size information (Panzone et al., 2016). The current study will assess whether the input method impacts citizen estimates of carbon footprint and energy content. Three input methods (multiple choice, slider tool, text box) were selected because they had been used independently in previous studies (Panzone et al., 2016; Shi et al., 2018; Camilleri et al., 2019), and are three Zooniverse data input methods that could be used with numerical input. The functionality of these methods within citizen science and impact on perceptions of carbon footprint and energy content has not been assessed. As an accurate understanding of citizens perception of this understanding is an essential component for future research, citizens focused communication and engagement with these topics, it is important to identify the most effective and appropriate input method.
Previous studies relied on survey methods with either pilot or small representative sample sizes, some of which were carried out via online platforms [e.g., N = 42 (Panzone et al., 2016), N ≤ 226 (Shi et al., 2018), N ≤ 518 (Camilleri et al., 2019), and N = 1511 (Panzone et al., in press)]. The number of food types surveyed ranged from three (Shi et al., 2018), to 67 (Panzone et al., 2016), with other variables such as portion size and linguistic modifiers (geographic origin, seasonality, production practice) (Shi et al., 2018). These variables were found to have an effect on estimations. For example, Shi et al. (2018) observed that the climate impact locally produced (vs. imported) meats, and organic (vs. conventional) foods were underestimated. An approximate hierarchy of climate impact was reported, however participants were not able to clearly distinguish between the climate impact of some food groups, with vegetarian protein sources being estimated as having a similar climate impact to chicken.
The data collection and recruitment methods used by previous research (Panzone et al., 2016; Shi et al., 2018; Camilleri et al., 2019), inherently provide access to a limited number of participants, due to experimental set-up and budget, among others. However, citizen science provides a digital engagement and data collection methodology that allows larger and wider participation [e.g., Zooniverse currently has 1,865,612 registered users (Zooniverse, 2020)], measurement of current perception, changes in knowledge, and the opportunity for education. Citizen science invites members of the public to participate in scientific thinking and to collaboratively support researchers in their data collection around a set theme or experiment. For example, Zooniverse has been used to explore the properties of spiral galaxies (Hart et al., 2017) and young stars (Silverberg et al., 2020). Besides being a data collection mechanism, citizen science strives to engage broader audiences, to educate participants about the topics they are observing, and to experience the processes used in scientific investigations, thus providing impetus for possible changes in practice (van't Veer et al., 2017). Citizen science methods have been used successfully in the fields of astronomy, ornithology, and ecology (Dickinson et al., 2010) and for research in other areas of the food system, however, is virtually absent from the broader nutrition science literature (Rowe and Alexander, 2016; Ryan et al., 2018). Citizen science provides an opportunity to engage with a larger and wider population sample to understand current perceptions of carbon footprint, energy content and portion size perceptions in the general population. This understanding will contribute to the design of more effective and targeted communication strategies, interventions and decision-making processes (Ryan et al., 2018) on the topic.
Addressing the paucity of research in the area, the current study uses the Zooniverse citizen science platform to address a series of aims; to measure perceptions of carbon footprint (embodied carbon emissions) and energy content (Kcal); to assess the impact of three different data input methods on responses; to assess how portion sizes and food type impacts perceptions. This pilot assesses the potential of the Zooniverse citizen science platform as a data collection methodology to explore perception of foods of carbon footprint and energy content.
Methods
Citizen Science Platform
The Zooniverse citizen science platform was selected as it is the largest citizen science platform on the internet with over 900,000 volunteers registered, and upwards of 90+ citizen science projects running at any one time (Smith et al., 2013; Simpson et al., 2014). The Zooniverse citizen science platform started in 2007 with the Galaxy Zoo project. To date, more than 175,000 citizens provided shape analyses of more than 1 million galaxy images. These 60 million galaxy “classifications” have been used to produce more than 50 peer-reviewed publications, based not only on the original project but also because of serendipitous discoveries made by the volunteer community. Researchers can use the Zooniverse platform to create projects, and recruit using Zooniverse citizens (public) or to a select group of citizens using a website link to the survey (private).
Recruitment
The pilot was promoted via informal university networks (i.e., participant email lists). A private website link directed citizens to the survey which was hosted on the Zooniverse platform. Data collection ran for ~5 weeks (13/06/2018–20/07/2018). Full Zooniverse membership (which would identify which classifications were made by a citizen) was not required to take part in the study. Consequently, participation was anonymous, apart from five registered Zooniverse members. As it is not possible to determine the exact number of citizens, the associated IP addresses provide a proxy. 8,484 valid classifications were made from 516 different IP addresses.
Materials
Ten types of food were selected with a range of carbon footprint and energy content (boiled rice, cheese, puffed rice cereal, boiled rice, baked beans, chicken breast, beef mince, fried chips, sliced apple, raw carrot). The carbon footprint values (kgCO2e/100 g product) for the foods were based on data published by Audsley et al. (2010), Clune et al. (2017), and Poore and Nemecek (2018) who, respectively conducted systematic reviews of 369 and 570 published studies and a meta-analysis which provides generalizable data on the carbon footprint values associated with different foods. The values represent average emissions to produce primary food commodities to the point of the regional distribution center in the UK. Energy content data (Kcal/100 g product) were taken from the National Diet and Nutrition Survey databank (Bates et al., 2014; Public Health England, 2018). See Supplementary Material 2 for additional information on the portion weight, carbon footprint and energy content of foods used in the study. A photograph of a small, medium, and large portion of each food was selected from the Intake24 image bank (Crawley et al., 2002; Simpson et al., 2017; Newcastle University, Food Standards Scotland, 2018). A text description of the pictured food was added to each image (Figure 1). Food images were displayed with and without portion weight (grams) information.
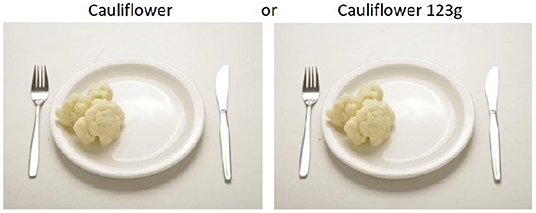
Figure 1. Portion with and without weight information.
The Survey
Three data input methods were selected within the Zooniverse platform multiple choice, slider tool, and text box. All carbon footprint scale anchor points (i.e., slider minimums and maximum values, the ranges on the multiple choice options) were provided in 101 throughout the experiment. The anchor values of the slider bar input were set at 0 and 1/3rd higher than the greatest carbon footprint and energy content of the sampled foods, i.e., 815 g of gCO2e × 101 and 930 kcal. These 1/3rd higher values were to allow overestimation using the slider and multiple choice inputs. The calculated ranges for carbon footprint and energy content were divided into five equal multiple choice options (see Table 1). Slider bars were set to zero as default. The carbon footprint and the energy content of four example portions were provided in a “Help” file for citizens: a medium portion of roast Lamb (~90 g), a portion of parsnips (~60 g), bread roll (~112 g), chocolate bar (~50 g). We did not include detailed information about energy content and carbon footprint within the “Help” file as we intend to measure current citizen understanding.
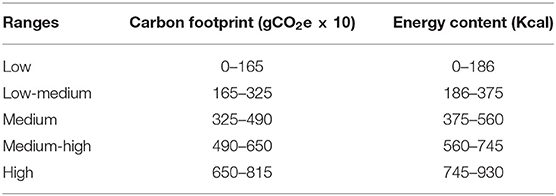
Table 1. Multiple choice ranges of carbon footprint and energy content.
Due to the functionality of Zooniverse, 12 “workflows” were prepared to allow a counterbalanced design. The independent variables in the workflow were: input method (multiple choice, slider tool, text box) × portion size (small, medium, large) × portion weight (with weight, without weight) × food type (boiled rice, cheese, puffed rice cereal, boiled rice, baked beans, chicken breast, beef mince, fried chips, sliced apple, raw carrot) × task order (Carbon footprint 1st, energy content 1st). carbon footprint and energy content ratings formed the dependent variables (DV). The data input method (multiple choice, slider tool or text box) and presence of portion weight (with weight or without weight) remained consistent within a workflow (see Figure 1). Workflows presented all portion sizes and food types, with either carbon footprint or energy content questions first. This resulted in 360 possible images/input combinations. Participants could retire at any point of the survey. Following completion of the study, citizens were asked to provide written feedback on the survey content and functionality via an online form.
Procedure
Each citizen scientist was randomly allocated to a single workflow (per IP address or Zooniverse ID), and could provide perceptions of up to 30 images using the same data input method. After 15 answers were collected for an image in a single workflow, the image was withdrawn from workflow circulation. Hence, for each data input method there were 60 answers per image: 15 carbon asked first with weight shown; 15 carbon asked first without weight shown; 15 energy asked first with weight shown; 15 energy asked first without weight shown. Image order was random for each participant. Exact questions and additional text information provided to citizens can be found in the online Supplementary Material 1.
Data Analysis
8,484 classifications were submitted which included an estimate of carbon footprint and energy content. Of the 8,484 estimates submitted for energy content, 1,285 contained no response, and 30 responses submitted using the text box were above the designated range (>930 kcal). 7,169 energy content classifications were used for further analysis. Citizen perceptions of energy content were compared against validated figures (Public Health England, 2018). As the energy content, and accuracy tolerance of food labels can vary between regions (European Commission, 2012; Public Health England, 2012; Jumpertz et al., 2013), estimates within a ±10% range of approved figures were classified as correct. 8,484 carbon footprint estimates were submitted, 1,464 contained no response, and 56 responses submitted using the text box were out of the designated range (0–815 g of gCO2e × 101). 6,964 carbon footprint classifications were used for further analysis. Citizen perceptions of carbon footprint were compared against values calculated based on validated figures from existing research. To provide a comparable range to energy content, estimates within a range ±10% of the approved figures were classified as correct. Descriptive data and exclusions for each data input method and information about the chosen analysis are listed in Supplementary Material 3. Using SPSS, the Kruskal Wallis H test and subsequent pairwise comparisons (Bonferroni corrections applied) were used to explore the impact of input method, portion size, weight information and food type on citizen estimates of carbon footprint and energy content. Qualitative feedback from citizens was manually coded.
Results
Carbon Footprint Perception
The majority of citizens overestimated (74.6%) with fewer underestimating (11.3%) or estimating within the ±10% range (14.0%), [χ(4) = 2015.82, p < 0.001]. However, when the input method is considered, estimates submitted using the slider tool and text box are least likely to fall within the validated range, with the majority being above or below (see Table 2). Estimates made using the multiple choice tool appear to be more accurate, however the large range within each multiple choice increases the chance of “correct” answers being given. When we consider food type (see Figure 2), there are two exceptions to the typical pattern for the text box, with the largest proportion of estimates falling below the validated range for mince (69.3%) and rice (50.0%), (see Supplementary Material 4 for additional information).
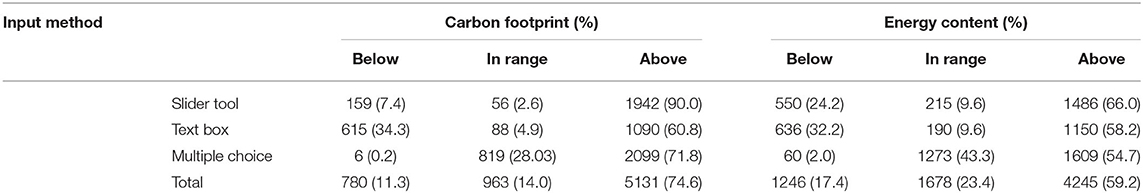
Table 2. Accuracy of carbon footprint and energy content estimates for each data input method.
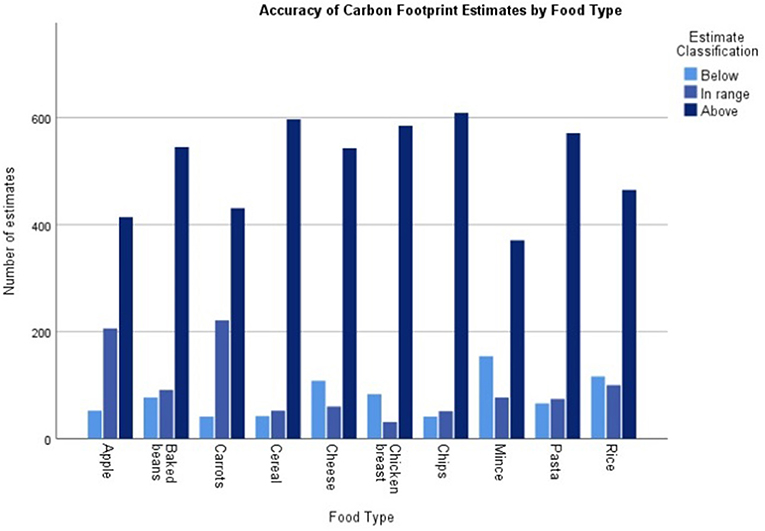
Figure 2. Accuracy of carbon footprint estimates for each food type.
Energy Content Perception
Overall, consumers are more likely to overestimate (59.2%), than correctly guess (23.4%) or underestimate (17.4%) calorie content of food [χ(2) = 2199.77, p < 0.001]. However, this pattern is not observed when the input method is considered. The text box and slider yield the fewest correct estimates, with the majority falling above and below (see Table 2). Overestimates are most frequent using multiple choice though the number of correct responses is higher compared to other methods.
We next explored the impact of food type on the frequency of energy content estimates which fall within range of validated values. Due to the issues with multiple choice responses discussed above, the analysis was conducted with data from the text box and slider methods. We observe that the majority of participants are unable to accurately estimate the energy content (calorie content) of foods with most responses being above (62.4%) or below (28.1%) the defined range. The calorie content of apple and carrot were most frequently overestimated [χ(9) = 132.35, p < 0.001], the energy content of mince and pasta were most often underestimated [χ(9) = 181.07, p < 0.001]. Only a small proportion (9.6%) of estimates fell within the designated range, however mince and baked beans estimates fell within range most often [χ(9) = 75.67, p < 0.001], see Figure 3.
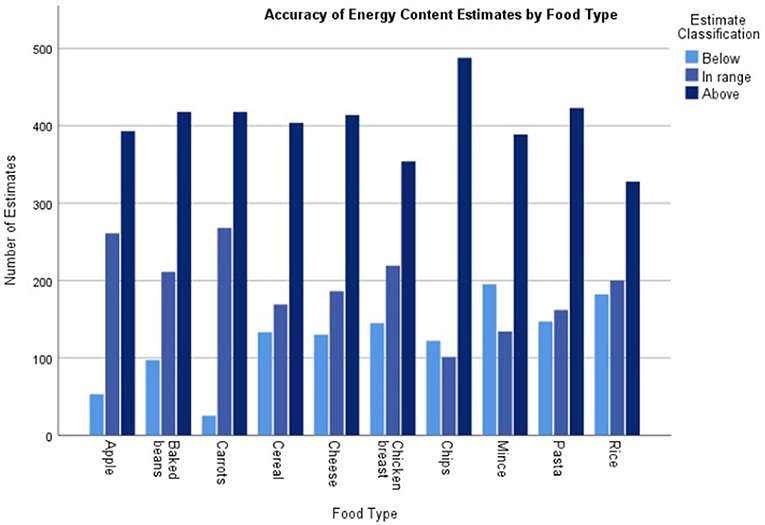
Figure 3. Accuracy of energy content estimates for each food type.
Impact of Input Method
Input method had a significant impact on perceptions of carbon footprint [H(2) = 452.42, p < 0.001] and energy content [H(2) = 645.99, p < 0.001]. Carbon footprint and energy content estimates were lowest using the text box, followed by the slider tool, and the highest estimates being given using multiple choice (Mean rank carbon footprint: text box = 1807.69, slider tool = 3217.96, multiple choice = 4732.56; energy content: text box = 2882.73, slider tool = 3258.04, multiple choice = 4306.85). Pairwise comparisons indicate significant differences are present between each input method for carbon footprint [text box–slider tool: χ2(1) = 22.25, p < 0.001, text box–multiple choice: H(1) = −48.95, p < 0.001, slider tool–multiple choice: H(1) = −26.77, p < 0.001] and energy content [text box–slider tool: H(1) = 5.90, p < 0.001, text box–multiple choice: H(1) = −23.74, p < 0.001, slider tool–multiple choice: H(1) = −18.16, p < 0.001]. See Supplementary Material 5 for additional analyses.
Impact of Portion Size
Portion size significantly impacts perception of carbon footprint [H(2) = 85.33, p < 0.001] and energy content [H(2) = 961.70, p < 0.001]. Carbon footprint (Mean rank: Small = 3349.60, Medium = 3820.63, Large = 3909.25) and energy content (Mean rank: Small = 3015.52, Medium = 3824.84, Large = 4914.95) estimates increased in line with portion size. Pairwise comparisons reveal that carbon footprint estimates do not differ between Small and Medium portions [H(1) = 1.17, p = 0.73], however a Large portion is perceived to have a significantly greater carbon footprint than a Medium portion [H(1) = 6.62, p < 0.001]. Energy content estimated were significantly different between each portion size [Small-Med: H(1) = 13.08, p < 0.001, Small-Large: H(1) = 30.59, p < 0.001, Med-Large: H(1) = 14.52, p < 0.001].
Impact of Weight Information
Citizens estimated the carbon footprint of foods to be significantly lower when weight information is present [H(1) = 7.37, p = 0.007, Mean rank: With Weight = 3415.19, Without Weight = 3545.76]. Conversely, the presence of weight information results in a significantly higher energy content estimate than when weight information is absent [H(1) = 14.06, p < 0.001, Mean rank: With Weight = 3674.50, Without Weight = 3491.80].
Impact of Food Type
The type of food shown significantly influences carbon footprint estimates [H(9) = 1002.15, p < 0.001]. Carrot (Mean rank = 2211.99) and mince (Mean rank = 4945.37) were estimated to have the lowest and highest carbon footprint (see Table 3). With the exception of sliced apple, all foods were estimated to have significantly greater carbon footprint than carrot batons [H(1) = 1.24, p = 0.21]. All foods were perceived as having a lower carbon footprint than mince. Energy content perception significantly differs with food type [H(9) = 2444.83, p < 0.001]. Carrot batons (Mean rank = 1554.14) and chips (Mean Rank: 5552.19) were estimated to have the lowest and highest energy content (see Table 3). All foods were perceived as having significantly higher energy content than carrot batons, with the exception of apple slices [H(1) = 1.24, p = 0.21]. A series of pairwise analyses indicate that all foods significantly differ in energy content estimates, with the exception of chicken and cheese [H(1) = 0.27, p = 1.00], chicken and baked beans [H(1) = 1.25, p = 1.00], cheese and baked beans [H(1) = 0.99, p = 1.00], rice and cereal [H(1) = 1.25, p = 1.00], and rice and pasta [H(1) = −2.95, p = 0.14].
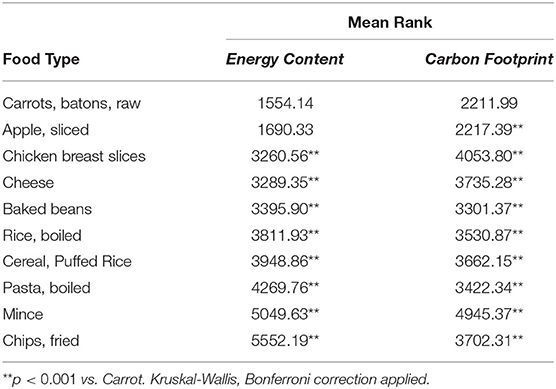
Table 3. Impact of Food Type on Carbon Footprint and Energy Content perception.
Impact of Task Order
Next, we consider whether task order impacts energy content and carbon footprint. We observe energy content estimates are significantly lower [H(1) = 17.57, p < 0.001] when rated before (Mean rank = 3489.47) than after carbon footprint (Mean rank = 3694.15). When considering input method for energy content estimates, the data indicate an impact of task order is present for the text box [H(1) = 12.40, p < 0.001, Mean rank: 1st = 950.30; 2nd = 1041.80] and multiple choice [H(1) = 8.15, p = 0.004, Mean rank: 1st = 1431.60; 2nd = 1516.79], showing lower ratings when energy content is rated first. However, the slider [H(1) = 0.87, p = 0.35, Mean rank: 1st = 1113.02; 2nd = 1138.58] does not show order effects. This pattern was not initially reflected with carbon footprint estimates [H(1) = 1.26, p = 0.26] which remained stable whether rated before (Mean rank = 3,388) or after (Mean rank = 3,576) energy content. However, when input method was investigated the data show the impact of task order, ratings of carbon footprint were greater when rated before energy content for using the slider [H(1) = 18.53, p < 0.001, Mean rank: 1st = 1158.68; 2nd = 1041.75]. Conversely, estimates were lower when carbon footprint was rated first when using the text box [H(1) = 18.28, p < 0.001, Mean rank: 1st = 856.93; 2nd = 963.54] or multiple choice input methods [H(1) = 5.31, p < 0.02, Mean rank: 1st = 1426.87; 2nd = 1496.65]. For additional analyses exploring order effects, see Supplementary Material 5. Qualitative feedback from citizens is outlined in Supplementary Material 6.
Carbon Footprint and Energy Content Correlation
Due to the similarity between the carbon footprint and energy content estimates, a series of analyses were conducted to explore the perceived relationship between the variables. We identified that the carbon footprint and energy content values (of the ten foods used in the current research) established by previous research (Reynolds et al., 2014; Rolls et al., 2002) do not correlate [r(10) = 0.38, p = 0.28]. Due to the relatively low sample (10 foods), the analysis was repeated with the data for additional foods from existing research. The second analysis confirms that the carbon footprint and energy content of foods are not inherently related [r(101) = 0.14, p = 0.15]. However, when we look at carbon footprint and energy content estimates from the current research, we find a strong correlation [r(6, 822) = 0.53, p < 0.001], indicating the citizens are unable to distinguish between the variables.
Discussion
The current research provides two key findings. First, that the majority of citizens are unable to accurately estimate or distinguish between the energy content and carbon footprint of food. This compelling observation highlights the need for citizens to be further educated, with particular focus on the carbon footprint of food. Second, we have demonstrated the value of Zooniverse as a platform to conduct nutrition science research and identified that, of the methods assessed, the slider tool as the most appropriate input method for estimations of energy content and carbon footprint.
We observe that citizens are unable to estimate the approximate (±10%) carbon footprint and energy content of food, and unexpectedly, a strong correlation indicating that citizens are not able to easily distinguish between the variables. Citizens appear to have a slightly better understanding of energy content than carbon footprint, with the majority of participants over estimating the carbon footprint of food. This result differs from the findings of Camilleri et al. (2019), who found that all carbon footprints, entered via a text box, were underestimated. Supporting the hierarchy of carbon footprint values collected using a slider input (Choi and Pak, 2006), we found that beef mince was perceived to have a larger carbon footprint than chicken, and carrots and apples were ranked as possessing the lowest footprint of the rated foods. This hierarchy of values was reflected in citizen estimations of energy content. Foods with a lower calorie content, such as carrots and apples, ranked lower than other types of food, and higher calorie foods, such as fried chips and mince ranked higher than other types of food.
Displaying the weight of a portion impacted estimates of energy content and carbon footprint, however the effect differed between the variables. This variability may be due to a lack of familiarity with the factors being estimated. Future insight into the impact of weight information could be gleaned by comparing the effect on known, and unknown variables.
Estimates of carbon footprint varied in-line with portion size, with larger portions being assigned greater estimates than smaller portions. This again supports the proposal that citizens possess some understanding of footprint hierarchy (Choi and Pak, 2006) rather than numerical accuracy.
Reflecting the pattern of carbon footprint estimations for differing portion sizes, citizens demonstrate a general awareness of the relative, though not numerically accurate, calorie content for different types of food. In line with previous research (Matheson et al., 2002; Boushey et al., 2009; Schap et al., 2011; Food Climate Research Network, 2018), we suggest that citizens understand the impact which portion size has on calorie content, being more or less than a previous portion, however estimates lack the numerical accuracy required to effectively gauge appropriate portion sizes and nutritional content of foods. As previous literature has highlighted the contribution of misestimating portion sizes to overeating and food waste (Rolls et al., 2002; Health Council of the Netherlands, 2011; Panzone et al., 2016), we suggest that inventions developed to tackle diet-related chronic diseases (Holmstrup et al., 2013) and climate change through diet, must first educate the general public about portion size, energy content and carbon footprint of food (and understand current levels of knowledge).
Increasing public knowledge (and comprehension) about the relationship between portion size and energy content of foods would allow consumers to make more informed dietary choices, supporting the move toward healthier diets. Increasing public knowledge and comprehension of the carbon footprint associated with foods, in line with dietary recommendations (Bureau Européen des Unions de Consommateurs, 2020), would support the public's desire to move toward a diet with a lower environmental impact. Public education of carbon footprints could be delivered through informational campaigns or an on pack labeling system, which have shown to be successful in influencing consumer food purchases (e.g., Emrich et al., 2017; Panzone et al., in press).
The current study explored the validity and comparable accuracy of input methods used in previous research [multiple choice (Shi et al., 2018), slider tool (Choi and Pak, 2006), text box (Holmstrup et al., 2013; Panzone et al., in press)]. We found that the tool chosen can significantly impact carbon footprint and energy content estimates. We observed that the multiple choice input resulted in the most overestimates and correct responses compared to other methods. This is due to two inherent issues of the multiple choice method. First, the multiple choice options provide a greater calorie ranges than the slider and text box (±10%), increasing the likelihood of a correct estimate. Second, the multiple choice ranges do not enable differentiation between portion sizes of some foods. For example, the energy content estimate for small, medium and large portions of apple slices range are all encompassed within a single (0–186 Kcal) multiple choice response. Though multiple choice had a high response rate, there are inherent issues with the method, providing less sensitivity in estimations, especially when a large range of values are included within the same survey. The text box allows high levels of accuracy but has a lower response rate, compared to other methods and previous research indicates that this method may deflate the range of numerical responses (Kemper et al., 2019). Hence, we recommend the slider tool as the most appropriate method for numerical estimates, having a high response rate and allowing a more accurate representation of citizen perceptions.
Limitations
We were unable to collect demographic information, unless citizens are registered on Zooniverse. It would be valuable to know the level of understanding in different consumer groups in order to maximize the impact of information and behavior change campaigns. A limited number of typically western foods were used within the pilot. Though sufficient for the proof-of-principle, this limits the application of the findings to the general population and cuisines from other cultures. The pictured food were accompanied by basic descriptions, stating the food type and, if relevant, how the food was cooked e.g., cheese, boiled rice. It is likely that additional information about the origin of the food, such as whether it was locally produced or imported, would impact carbon footprint, and potentially calorie estimates.
Implications
The current research offers some novel findings and insight into citizen understanding of the calorie content and carbon footprint of food. We have identified the need for citizens to be educated about the environmental sustainability of different foods. The ability to quantify the carbon footprint of a food is essential, as this understanding must be established before sustainable purchase decisions can be made. Increased consumer knowledge about the environmental impact of foods will support the public's intention to move toward more sustainable diets (Bureau Européen des Unions de Consommateurs, 2020). As the food life cycle contributes 20–30% of global greenhouse gas emissions (Kause et al., 2009; Poore and Nemecek, 2018) guiding consumers toward foods with a lower carbon footprint could reduce the environmental impact of the global food system. In addition, the current research demonstrates the value of the Zooniverse platform functionality as a device for nutrition science research. Zooniverse can provide key evidence to underpin policy change, consumer education and behavioral change interventions which will move consumers toward more sustainable and healthy diets.
Future Research
Based on our findings we suggest three areas for future research. First, to further explore citizen understanding, future research could explore citizen perceptions of a greater number of foods, and replicate the study in different countries or cultures with a different range of cuisines. Second, we found that citizens may possess understanding of the hierarchy of variables, having some understanding of hierarchy, but are unable to accurately identify the energy content and particularly, the carbon footprint of food. It would be beneficial to develop and assess consumer facing communications to improve awareness and understanding of the numerical value of carbon footprint associated with different foods. Finally, previous research has used a variety of recruitment methods and traditional online platforms such as Qualtrics (Choi and Pak, 2006; Holmstrup et al., 2013; Shi et al., 2018), some of which limit the number of participants. Replicating such research through Zooniverse would allow data to be collected from a larger and more diverse sample, and, in addition, provides the opportunity to educate the citizens, addressing the knowledge disconnect which exists between academic communities and the general public.
Conclusion
This pilot has demonstrated that citizen science platform, Zooniverse, can be successfully used to measure perceptions of carbon footprint and energy content. We suggest that citizens possess some understanding of the hierarchy of the carbon footprint and energy content of food, however lack numerical accuracy of these concepts. This presents a clear direction and opportunity for citizen science to engage and educate inquisitive members of the public from wider groups. Citizen science platforms offer the opportunity to not only measure perceptions, but influence citizen behavior. This is extremely important considering future policy interventions to meet climate change targets and improve health. Future citizen science projects could relate to sustainable diets, reduction of obesity and overweight children and adults, carbon allowances. Thus, using citizen science approaches engagement, perception, and behavior change could be measured over time, an advantage when compared to traditional survey methods.
Data Availability Statement
The raw data supporting the conclusions of this article will be made available by the authors, without undue reservation.
Ethics Statement
The studies involving human participants were reviewed and approved by Geography Department, University of Sheffield ethics panel Reference Number 019076. The participants provided their written informed consent to participate in this study.
Author Contributions
CR: PI and grant holder, he designed and set up the survey in zooniverse, managed data, and analyzed and wrote first drafts of the paper. CW: data management and analysis of the data (e.g., statistical analysis, data visualization, etc.). LP and AK: research collaborator, peer-reviewed drafts. XR: research collaborator, peer-reviewed drafts, and helped write the last version of this paper. She collaborated drafting zooniverse information. BA: peer-reviewed and wrote the last version of this paper, conducted additional data analysis. CF: peer-reviewed design methodology and draft reports. All authors contributed to the article and approved the submitted version.
Funding
This work was funded by STFC Food Network+ pilot funding (ST/P003079/1), and STFC twenty-first century challenge funding (ST/T001410/1) Piloting Zooniverse for food, health, and sustainability citizen science. CR was supported from the HEFCE Catalyst-funded N8 AgriFood Resilience Programme and matched funding from the N8 group of Universities. Additional funding was provided by Research England via the project Food based citizen science in UK as a policy tool.
Conflict of Interest
The authors declare that the research was conducted in the absence of any commercial or financial relationships that could be construed as a potential conflict of interest.
Acknowledgments
Thanks to Dr. Emma Foster and the Intake 24 team (Newcastle) for the use of their portion images. This publication uses data generated via the Zooniverse.org platform, development of which is funded by generous support, including a Global Impact Award from Google, and by a grant from the Alfred P. Sloan Foundation.
Supplementary Material
The Supplementary Material for this article can be found online at: https://www.frontiersin.org/articles/10.3389/fsufs.2020.00120/full#supplementary-material
References
Audsley, E., Brander, M., Chatterton, J. C., Murphy-Bokern, D., Webster, C., and Williams, A. G. (2010). How Low Can We Go? An Assessment of Greenhouse Gas Emissions from the UK Food System and the Scope Reduction by 2050. Technical Report, WWF and Food Climate Research Network.
Bates, B., Lennox, A., Prentice, A., Bates, C., Page, P., Nicholson, S., et al. (2014). National Diet and Nutrition Survey : Results from Years 1–4 (Combined) of the Rolling Programme, Executive Summary, Vol. 4. London: Public Health England, 1–24.
Boushey, C. J., Kerr, D. A., Wright, J., Lutes, K. D., Ebert, D. S., and Delp, E. J. (2009). Use of technology in children's dietary assessment. Eur. J. Clin. Nutr. 63, S50–S57. doi: 10.1038/ejcn.2008.65
Bureau Européen des Unions de Consommateurs (2020). One Bite at a Time: Consumers and the Transition to Sustainable Food. Analysis of a Survey of European Consumers on Attitudes Towards Sustainable Food. Available online at: https://www.beuc.eu/publications/beuc-x-2020-042_consumers_and_the_transition_to_sustainable_food.pdf (accessed June 12, 2020).
Camilleri, A. R., Larrick, R. P., Hossain, S., and Patino-Echeverri, D. (2019) Consumers underestimate the emissions associated with food but are aided by labels. Nat. Clim. Change 9, 53–58. doi: 10.1038/s41558-018-0354-z
Carels, R., Konrad, K., and Harper, J. (2007). Individual differences in food perceptions and calorie estimation: an examination of dieting status, weight, and gender. Appetite 49, 450–458. doi: 10.1016/j.appet.2007.02.009
CCC (2020). Land Use: Policies for a Net Zero UK. Available online at: https://www.theccc.org.uk/publication/land-use-policies-for-a-net-zero-uk/ (accessed January 23, 2020).
Chernev, A., and Chandon, P. (2010). “Calorie estimation biases in consumer choice,” in Leveraging Consumer Psychology for Effective Health Communications: The Obesity Challenge, eds R. Vatra, K. P. Anand, and V. J. Strecher (Armonk, NY: M.E. Sharpe), 104–121.
Choi, B., and Pak, A. (2006). Multidisciplinarity, interdisciplinarity and transdisciplinarity in health research, services, education and policy: 1. definitions, objectives, and evidence of effectiveness. Clin. Invest. Med. 29:351.
Clark, M. (2019). “Healthy diets as a climate change mitigation strategy,” in Environmental Nutrition (Academic Press), 243–261. Available online at: https://www.sciencedirect.com/science/article/pii/B978012811660900014X?via%3Dihub. doi: 10.1016/B978-0-12-811660-9.00014-X (accessed January 23, 2020).
Clune, S., Crossin, E., and Verghese, K. (2017). Systematic review of greenhouse gas emissions for different fresh food categories. J. Cleaner Prod. 140, 766–783. doi: 10.1016/j.jclepro.2016.04.082
Cohen, D. A., and Story, M. (2014). Mitigating the health risks of dining out: the need for standardized portion sizes in restaurants. Am. J. Public Health 104, 586–590. doi: 10.2105/AJPH.2013.301692
Crawley, H., Mills, A., Patel, S., and Food Standards Agency (2002). Food Portion Sizes, 3rd Edn. London: The Stationery Office.
Dickinson, J. L., Zuckerberg, B., and Bonter, B. N. (2010). Citizen science as an ecological research tool: challenges and benefits. Annu. Rev. Ecol. Evol. Syst. 41, 149–172. doi: 10.1146/annurev-ecolsys-102209-144636
Edelson, D. C., Kirn, S. L., Baukus, A., Blair, R., Ford, M., Grow, S., et al. (2018). Designing Citizen Science for Both Science and Education. A Workshop Report, Colorado Springs, CO: BSCS Science Learning. Available online at: https://media.bscs.org/tech-report/2018-1/2018-1.pdf (accessed January 23, 2020).
Emrich, T. E., Qi, Y., Lou, W. Y., and L'Abbe, M. R. (2017). Traffic-light labels could reduce population intakes of calories, total fat, saturated fat, and sodium. PLoS ONE 12:e0171188. doi: 10.1371/journal.pone.0171188
European Commission (2012). Guidance Document For Competent Authorities For The Control of Compliance With Eu Legislation on: Regulation (EU) No 1169/2011 of the European Parliament and of the Council of 25 October 2011 on the Provision of Food Information to Consumer…. (2012). Available online at: https://ec.europa.eu/food/sites/food/files/safety/docs/labelling_nutrition-vitamins_minerals-guidance_tolerances_1212_en.pdf (accessed February 12, 2020).
Fischer, C. G., and Garnett, T. (2016). Plates, Pyramids, and Planets: Developments in National Healthy and Sustainable Dietary Guidelines: A State of Play Assessment. Oxford: FAO and The University of Oxford.
Freidberg, S. (2016). Wicked nutrition: the controversial greening of official dietary guidance. Gastronomica J. Crit. Food Stud. 16, 69–80. doi: 10.1525/gfc.2016.16.2.69
Hart, R. E., Bamford, S. P., Hayes, W. B., Cardamone, C. N., Keel, W. C., Kruk, S. J., et al. (2017). Galaxy Zoo and SPARCFIRE: constraints on spiral arm formation mechanisms from spiral arm number and pitch angles. Mon. Not. R. Astron. Soc. 472, 2263–2279. doi: 10.1093/mnras/stx2137
Hartmann, C., and Siegrist, M. (2017). Consumer perception and behaviour regarding sustainable protein consumption: a systematic review. Trends Food Sci. Technol. 61, 11–25. doi: 10.1016/j.tifs.2016.12.006
Health Council of the Netherlands (2011). Guidelines for a Healthy Diet: The Ecological Perspective. The Hague: Health Council of the Netherlands
Holmstrup, M., Stearns-Bruening, K., and Rozelle, J. (2013) Quantifying accurate calorie estimation using the think aloud method. J. Nutr. Educ. Behav. 45, 77–81. doi: 10.1016/j.jneb.2012.04.007
Hyland, J., Henchion, M., McCarthy, M., and McCarthy, S. (2017). The role of meat in strategies to achieve a sustainable diet lower in greenhouse gas emissions: a review. Meat Sci. 132, 189–195. doi: 10.1016/j.meatsci.2017.04.014
Jones, A., Vanderlee, L., White, C., Hobin, E., Bordes, I., and Hammond, D. (2016). “How many calories did I just eat?” An experimental study examining the effect of changes to serving size information on nutrition labels. Public Health Nutr. 19, 2959–2964. doi: 10.1017/S1368980016000665
Jumpertz, R., Venti, C. A., Le, D. S., Michaels, J., Parrington, S., Krakoff, J., et al. (2013). Food label accuracy of common snack foods. Obesity 21, 164–169. doi: 10.1002/oby.20185
Kause, A., Bruine de Bruin, W., Millward-Hopkins, J., and Olsson, H. (2009). Public perceptions of how to reduce carbon footprints of consumer food choices. Environ. Res. Lett. 14:114005. doi: 10.1088/1748-9326/ab465d
Kemper, N. S., Campbell, D. S., Earleywine, M., and Newheiser, A. (2019). Likert, slider, or text? reassurances about response format effects. Addict. Res. Theory 1–9. doi: 10.1080/16066359.2019.1676892
Lee, C. D., Chae, J., Schap, T., Kerr, D. A., Delp, E. J., Ebert, D. J., et al. (2012). Comparison of known food weights with image-based portion-size automated estimation and adolescents' self-reported portion size. J. Diabetes Sci. Technol. 6, 428–434. doi: 10.1177/193229681200600231
Liu, P. J., Bettman, J. R., Uhalde, A. R., and Ubel, P. A. (2015). “How many calories are in my burrito?” Improving consumers' understanding of energy (calorie) range information. Public Health Nutr. 18, 15–24. doi: 10.1017/S1368980014000627
Matheson, D. M., Hanson, K. A., McDonald, T. E., and Robinson, T. N. (2002). Validity of children's food portion estimates: a comparison of 2 measurement aids. Arch. Pediatr. Adolesc. Med. 156, 867–871. doi: 10.1001/archpedi.156.9.867
Ministers, NC (2014). Nordic Nutrition Recommendations 2012. Copenhagen: Nordic Council of Ministers.
Miyazaki, T., de Silva, G., and Aizawa, K. (2011). “Image-based calorie content estimation for dietary assessment,” in 2011 IEEE International Symposium on Multimedia (Dana Point, CA), 363–368. doi: 10.1109/ISM.2011.66
Monteiro, C., Cannon, G., Moubarac, J., Bortoletto Martins, A., Martins, C., Garzillo, J., et al. (2015). Dietary guidelines to nourish humanity and the planet in the twenty-first century. A blueprint from Brazil. Public Health Nutr. 18, 2311–2322. doi: 10.1017/S1368980015002165
Newcastle University Food Standards Scotland. (2018). Intake24 Food Database and Full Image Database. Newcastle University, Food Standards Scotland.
Panzone, L. A, Sniehotta, F., Comber, R., and Lemke, F. (in press). The effect of traffic-light labels time pressure on estimating kilocalories carbon footprint of food. Appetite.
Panzone, L. A., Lemke, F., and Petersen, H. L. (2016). Biases in consumers' assessment of environmental damage in food chains and how investments in reputation can help. Technol. Forecast Soc. Change 111, 327–337. doi: 10.1016/j.techfore.2016.04.008
Poore, J., and Nemecek, T. (2018). Reducing food's environmental impacts through producers and consumers. Science 360, 987–992. doi: 10.1126/science.aaq0216
Public Health England (2012). The Composition of Foods Integrated Dataset—User Guide 2012. Available online at: https://assets.publishing.service.gov.uk/government/uploads/system/uploads/attachment_data/file/788485/McCance_Widdowson_Comp_Foods_Integrated_Dataset_User_Guide_2019__1_.pdf (accessed February 12, 2020).
Public Health England (2018). National Diet and Nutrition Survey. Results from Years 7–8 (Combined) of the Rolling Programme (2014/15 to 2015/16). Available online at: https://www.gov.uk/government/statistics/ndns-results-from-years-7-and-8-combined (accessed January 6, 2020).
Reynolds, C., Buckley, J., Weinstein, P., and Boland, P. (2014). Are the dietary guidelines for meat, fat, fruit and vegetable consumption appropriate for environmental sustainability? A review of the literature. Nutrients 6, 2251–2265. doi: 10.3390/nu6062251
Rolls, B., Morris, E., and Roe, L. (2002). Portion size of food affects energy intake in normal-weight and overweight men and women. Am. J. Clin. Nutr. 76, 1207–1213. doi: 10.1093/ajcn/76.6.1207
Rowe, S., and Alexander, N. (2016). Citizen science: does it make sense for nutrition communication? Nutr. Today 51, 301–304. doi: 10.1097/NT.0000000000000180
Ryan, S. F., Adamson, N. L., Aktipis, A., Andersen, L. K., Austin, R., Barnes, L., et al. (2018). The role of citizen science in addressing grand challenges in food and agriculture research. Proc. R. Soc. B 285:20181977. doi: 10.1098/rspb.2018.1977
Schap, T. E., Six, B. L., Delp, E. J., Ebert, D. S., Kerr, D. A., and Boushey, C. J. (2011). Adolescents in the United States can identify familiar foods at the time of consumption and when prompted with an image 14 h postprandial, but poorly estimate portions. Public Health Nutr. 14, 1184–1191. doi: 10.1017/S1368980010003794
Shi, J., Visschers, V., Bumann, V., and Siegrist, M. (2018). Consumers' climate-impact estimations of different food products. J. Cleaner Prod. 172, 1646–1653. doi: 10.1016/j.jclepro.2016.11.140
Silverberg, S. M., Wisniewski, J. P., Kuchner, M. J., Lawson, K. D., Bans, A. S., Debes, J. H., et al. (2020). Peter pan disks: long-lived accretion disks around young M stars. Astrophys. J. 890:106. doi: 10.3847/1538-4357/ab68e6
Simpson, E., Bradley, J., Poliakov, I., Jackson, D., Olivier, P., Adamson, A. J., et al. (2017). Iterative development of an online dietary recall tool: INTAKE24. Nutrients 9:118. doi: 10.3390/nu9020118
Simpson, R., Page, K. R., and De Roure, D. (2014). “Zooniverse: observing the world's largest citizen science platform,” in Proceedings of the 23rd International Conference on World Wide Web (Oxford), 1049–1054. doi: 10.1145/2567948.2579215
Smith, A. M., Lynn, S., and Lintott, C. J. (2013). “An introduction to the zooniverse,” in First AAAI Conference on Human Computation and Crowdsourcing (Chicago, IL).
Steenhuis, I., and Vermeer, W. (2009). Portion size: review and framework for interventions. Int. J. Behav. Nutr. Phys. Act. 6:58. doi: 10.1186/1479-5868-6-58
Thomas, M., and Kyung, E. J. (2019). Slider scale or text box: how response format shapes responses. J. Consum. Res. 45, 1274–1293. doi: 10.1093/jcr/ucy057
Tirado-Von Der Pahlen, M. C. (2017). Sustainable and Healthy Dietary Patterns Addressing Climate Mitigation While Promoting Health. Abstract retrieved from UNFCC. Available online at: https://unfccc.int/sites/default/files/resource/474_Sustainable%20and%20Healthy%20dietary%20patterns.pdf (accessed February 12, 2020).
van't Veer, P., Poppe, K. J., and Fresco, L. O. (2017). Towards a European Food and Nutrition Policy. Wageningen University & Research. Available online at: https://library.wur.nl/WebQuery/wurpubs/fulltext/423602
Zooniverse. (2020). Zooniverse [online]. Available online at: https://www.zooniverse.org/about (accessed February 12, 2020).
Keywords: carbon footprint, methods, citizen science, portion size, energy content, consumer perception, food environmental impact
Citation: Armstrong B, Bridge G, Oakden L, Reynolds C, Wang C, Panzone LA, Rivera XS, Kause A, Ffoulkes C, Krawczyk C, Miller G and Serjeant S (2020) Piloting Citizen Science Methods to Measure Perceptions of Carbon Footprint and Energy Content of Food. Front. Sustain. Food Syst. 4:120. doi: 10.3389/fsufs.2020.00120
Received: 30 April 2020; Accepted: 02 July 2020;
Published: 21 August 2020.
Edited by:
Bálint Balázs, Environmental Social Sciences Research Group, HungaryReviewed by:
Taiyang Zhong, Nanjing University, ChinaYuhui Qiao, China Agricultural University, China
Copyright © 2020 Armstrong, Bridge, Oakden, Reynolds, Wang, Panzone, Rivera, Kause, Ffoulkes, Krawczyk, Miller and Serjeant. This is an open-access article distributed under the terms of the Creative Commons Attribution License (CC BY). The use, distribution or reproduction in other forums is permitted, provided the original author(s) and the copyright owner(s) are credited and that the original publication in this journal is cited, in accordance with accepted academic practice. No use, distribution or reproduction is permitted which does not comply with these terms.
*Correspondence: Christian Reynolds, c.reynolds@sheffield.ac.uk