Seasonal Nitrous Oxide Emissions From Hydroponic Tomato and Cucumber Cultivation in a Commercial Greenhouse Company
 Stefan Karlowsky
 Markus Gläser2
  Dietmar Schwarz
- 1Leibniz Institute of Vegetable and Ornamental Crops (IGZ), Großbeeren, Germany
- 2Fontana Gartenbau GmbH, Küstriner Vorland, Germany
Nitrous oxide (N2O) is considered as the most critical greenhouse gas (GHG) emitted by agricultural and horticultural food production. Hydroponic vegetable cultivation in greenhouse systems has a high potential for N2O emissions due to the intense application of nitrogen-containing fertilizers. Previous studies on model hydroponic systems indicate that N2O emissions per unit area can be several times higher than typically found during field cultivation. However, reliable data from production-scale hydroponic systems is missing. Here we report our findings from monitoring the N2O emissions in a commercial production greenhouse, located in the east of Germany, over a period of 1 year. We used the static chamber method to estimate N2O fluxes in the root zones of hydroponic tomato and cucumber cultures on rock wool growing bags with drip fertigation. Regular sampling intervals (weekly-biweekly) were used to calculate whole season cumulative N2O emissions and N2O emission factors (EFs) based on the amount of nitrogen fertilizer applied. Our results indicate that the seasonal N2O emissions from hydroponic greenhouse cultivation are considerably smaller than expected from previous studies. In total, we estimated average cumulative N2O emissions of 2.3 and 1.5 kg N2O–N ha−1 yr−1 for tomato and cucumber cultures, respectively. Average EFs were 0.31% for tomato cultivation with drain re-use (closed hydroponic system), and 0.13% for cucumber cultivation without drain re-use (open hydroponic system). These values lie below the general EF for N2O from agricultural soils, noted with 1% by the intergovernmental panel on climate change (IPCC). In conclusion, considering the high yield of greenhouse cultivation, hydroponic systems provide a way of producing vegetables climate-friendly, in terms of direct GHG emissions. Further attention should be given to reducing energy inputs, e.g., by using regenerative sources or thermal discharge from industrial processes, and to increasing circularity, e.g., by using recycling fertilizers derived from waste streams. Especially in urban and peri-urban areas, the use of hydroponics is promising to increase local and sustainable food production.
Introduction
The global food sector is responsible for about 26% of total anthropogenic greenhouse gas (GHG) emissions (Poore and Nemecek, 2018), of which roughly 12% can be attributed to the use of manure and synthetic fertilizers on agricultural soils (Smith et al., 2014). The excessive use of fertilizers also leads to eutrophication of aquatic systems, losses in biodiversity and comprised drinking water (Robertson and Vitousek, 2009; Steffen et al., 2015). Additionally, the current industrial agriculture is very resource intensive in terms of land and water consumption (Campbell et al., 2017; Springmann et al., 2018). Therefore, more sustainable ways for providing the growing world population with food are searched for (Jurgilevich et al., 2016; FAO, 2019; Gerten et al., 2020), including the reduction of GHG emissions from plant cultivation and fertilizer losses to the environment. As one recommendation is to shift human nutrition to a more plant-based diet (Poore and Nemecek, 2018; Springmann et al., 2020), minimizing environmental impacts from vegetable cultivation might become crucial in future. Greenhouse cultivation, especially in hydroponic systems, has the potential to grow vegetables in a very resource-efficient way (Gruda, 2009; Savvas et al., 2013), by maximizing yield per area and by minimizing water consumption and nutrient losses. However, there is little knowledge about fertilizer-derived GHG emissions from greenhouse vegetable cultivation (Gruda et al., 2019). Direct GHG emissions from fertilized plant cultivation mainly consist of the release of nitrous oxide (N2O) and methane (CH4) from soils or other growing substrates, while carbon dioxide (CO2) emissions from the root zone are considered to be in balance with photosynthetic CO2 fixation by the aboveground biomass (Smith et al., 2014). While CH4 emissions mainly occur in flooded soils under anaerobic conditions, N2O emissions also occur under well-aerated conditions. N-fertilizers (e.g., ammonium and nitrate) that are not immediately taken up by plants are available to microbial N-transformation processes, such as nitrification and denitrification, which are associated with the release of N2O (Firestone and Davidson, 1989; Baggs, 2011). N2O has a global warming potential about 300 times higher than CO2 on a 100-year scale and, in addition, depletes the vital stratospheric ozone layer (Myhre et al., 2013). Due to the high amounts and dosage rates of N fertilizers as well as favorable climate conditions, N2O emissions from greenhouse systems might be generally high (Gruda et al., 2019). Indeed, the few existing studies on hydroponically grown cucumbers (Daum and Schenk, 1996b; e.g., Daum and Schenk, 1996a, 1998) and tomatoes (e.g., Hashida et al., 2014; Yoshihara et al., 2014, 2016) revealed substantial N2O emission rates, with average values of up to 70 g N2O–N ha−1 d−1. These studies from only two teams, however, were selective and conducted under laboratory experimental greenhouse conditions and may not properly reflect N2O emissions from commercial tomato and cucumber production. A more recent study on cucumbers cultivated in a large phytotron with cabins of 30 m2, which was specifically constructed to measure gas fluxes in the root zones of multiple plants, found relatively low N2O emission rates of ~17 g N2O–N ha−1 d−1 during plant cultivation (Nett et al., 2019). Nevertheless, the same study also showed that under certain conditions, like the enhanced degradation of roots after fruit removal and shoot-cutting, N2O emission rates can rise to high levels in the range of 180–390 g N2O–N ha−1 d−1. In general, the N2O release from growing media is known to depend on complex interactions of different variables (Butterbach-Bahl et al., 2013) and has been extensively studied for soils (Stehfest and Bouwman, 2006). The redox potential and oxygen status are of major importance for the microbial processes related to N2O production (Davidson et al., 2000; Baggs, 2011). Sub-oxic hot-spots together with the supply of organic carbon (C), e.g., as root exudates or from decaying roots, typically increase denitrification rates (Morley and Baggs, 2010; Giles et al., 2017), yielding N2O emissions from the reduction of nitrate or nitrite. In contrast, nitrifying microorganisms, which convert ammonium to nitrate with N2O as a side product, typically favor aerobic conditions and are mostly independent of organic C supply (Firestone and Davidson, 1989). Further variables known to affect microbial N cycling are temperature and pH in the growing medium (Farquharson and Baldock, 2007). Because the influence of the different variables on N2O emission rates can strongly vary over time and with plant growth stage (Daum and Schenk, 1996a), it is important to monitor the emissions regularly during the growing season. In this study we report for the first time seasonal data on N2O and CO2 emissions from the root zones of tomato and cucumber plants cultivated in a commercial production greenhouse using rock wool hydroponic systems. Our objectives were to (i) estimate whole-season N2O emissions and N2O emission factors from the amount of applied fertilizers, (ii) relate the N2O emission rates to various influencing variables, including climate conditions inside the greenhouse and plant growth stage, (iii) assess how organic growing substrates alter N2O and CO2 emission rates from tomato cultivation compared to rock wool substrate, and (iv) determine how the re-use of rock wool substrate affects N2O and CO2 emission rates from cucumber cultivation compared to the use of factory-fresh rock wool. We hypothesized that (a) N2O emissions from hydroponic vegetable cultivation vary widely over the growing season and are higher on a per unit area basis than for comparable soil-based crops, (b) organic growing substrates increase N2O and CO2 emission rates from the root zone of tomato plants, and (c) re-used rock wool with root residues from previous cultivation increases N2O and CO2 emissions from cucumber cultivation.
Materials and Methods
Study Location
The study site at Fontana Gartenbau GmbH, a small to mid-sized enterprise, is located in the east of Germany in the Oderbruch valley (52°33′06.5″N, 14°33′23.0″E). The company mainly produces tomatoes, cucumbers and ornamental plants on a total greenhouse area of 2.15 ha. Tomatoes and cucumbers are gown hydroponically on growing bags, mostly plastic-coated rock wool mats, in heated glasshouses (Supplementary Figure 1). Tomato cultivation is done in a modern Venlo type glasshouse with a height of 4.8 m, inclined roof openings and adjustable thermal screens above the plant canopy. Cucumber cultivation is done in a ridge and furrow type glasshouse with a height of ~2.4 m and inclined roof openings. Tomatoes are typically cultivated in a year-round culture from January to November. Cucumbers are cultivated in two distinct cultures, an early season culture from March to May/June and a late season culture from June/July to October. In both, tomato and cucumber cultures, the CO2 concentration is enriched in the greenhouse air in order to enhance plant productivity and fruit yield. For this purpose, the CO2 concentration is monitored in the center of each greenhouse at a height of 1.7 m using an NDIR CO2 sensor (EE820, E+E Elektronik Ges.m.b.H, Engerwitzdorf, Austria) connected to a climate computer system with software from Priva Building Intelligence GmbH (Tönisvorst, Germany). When CO2 concentrations <800 ppm are measured, technical CO2 (≥99.7% CO2, AIR LIQUIDE Deutschland GmbH, Düsseldorf, Germany) is supplied from a storage tank, resulting in average CO2 concentrations between 400 and 600 ppm during the day. The CO2 supply is regulated by solenoid valves and distribution in the greenhouse is via perforated PE pipes (19 mm inner diameter, opening slots every 15 cm) at the bottom of every second plant row. Climate variables are measured with sensors provided by Priva Building Intelligence GmbH (Tönisvorst, Germany) and processed by the Priva climate software. In each greenhouse, temperature, and relative humidity are measured on top of the plant stand (3/2 m height in the tomato/cucumber greenhouse) at two locations, one in the south block and one in the north block. The average values from the two locations in each greenhouse are used by the climate software to control heating and ventilation. Solar radiation, wind direction, wind speed, outdoor temperature, and precipitation are measured at a weather station outside the greenhouses and used to control ventilation and shading/energy shielding (only in the tomato greenhouse: up to 50% shading at solar radiation values >500 W/m2 and energy shielding during the night). The radiation values inside the greenhouse are calculated by correcting the measured values of solar radiation from outside with the light transmittance of the greenhouses and the proportion of shading used. Irrigation amounts and frequencies are automatically adjusted according to greenhouse temperatures and solar radiation.
Tomato Cultivation
GHG emissions from year-round tomato cultivation were monitored mainly in the 2019 culture and partly in the 2020 culture, because the measurements were not possible before 14 March 2019. Tomato (Solanum lycopersicum) seedlings, grafted with two shoots on one scion of the cultivar Pureza (Enza Zaden, Enkhuizen, The Netherlands) on a rootstock cv. Maxifort (De Ruiter Seeds, Bleiswijk, The Netherlands) and pre-cultivated on rock wool cubes (10 × 10 × 6.5 cm), were planted on 14 January 2019 in the greenhouse and continuously grown until 21 November 2019. The rock wool cubes with seedlings were put in a distance of 0.5 m on growing bags (filled with nutrient solution on 9 January 2019), yielding a shoot density of 2.4 m−2. For gas flux measurements, growing bags of three different substrates, with four replicates each, were used: (1) rock wool mats (100 × 20 × 7.5 cm; Grotop master, Grodan B.V., Roermond, The Netherlands), (2) coir mats (100 × 15.5 × 8.5 cm; Coir Project GbR, Segnitz, Germany), and (3) perlite granules mixed with wood fibers (henceforth referred to as “perlite/wood fiber;” 100 × 19.5 × 6.5 cm; Kleeschulte Erden GmbH & Co. KG, Rüthen, Germany). The growing bags for sampling were distributed in the middle of the plant stand of a 4,300 m2 greenhouse section, always in distance of 6 m to the central gangway (Supplementary Figure 2). The growing bags were installed on elevated, hanging panels with gutters at both sides allowing the collection of drain solution. Water and nutrients were supplied via drip fertigation in a closed-cycle system, where the collected drain solution is reutilized after bio-filtration (aerated slow filtration through rock wool with a flow rate of 2.4 m3 h−1). Mineral fertilizers (Supplementary Table 1) were added to obtain EC values of 3–4 mS cm−1 and the pH of the supplied nutrient solution was adjusted to 5.6 using nitric acid. The volumes and EC values of added nutrient solution were adjusted according to plant demand/seasonal timing. No nutrient solution was added after 2 November 2019 in order to drying out the growing bags by plant water uptake. In total, nitrogen fertilizers corresponding to 612 kg N ha−1 were added to the tomato culture from March to November 2019. Tomato shoots were trained on a wire, and were successively lowered and hanged around the gutters when reaching the top of the wire. Old leaves and lateral shoots were regularly pruned, always leaving 12–14 leaves at one shoot. Harvesting of red tomato fruits was done once or twice per week from April to November. Total yield of marketable tomatoes was around 361 t ha−1 for the tomato culture of 2019. The tomato cultivation in 2020 followed the above described protocol. Growing bags were filled with nutrient solution on 14 January 2020 and tomato seedlings were planted on 20 January 2020. For gas flux measurements, only rock wool growing bags were used and six sampling points were distributed analogously to 2019 in the greenhouse section (Supplementary Figure 2). In total, nitrogen fertilizers corresponding to 127 kg N ha−1 were added to the tomato culture from January to February 2020.
Cucumber Cultivation
GHG emissions from cucumber cultivation were monitored in the late season culture of 2019 and in the early season culture of 2020. Cucumber (Cucumis sativus) seedlings of the cultivar Sencere (Nunhems B.V., Nunhem, The Netherlands), pre-cultivated on rock wool cubes (10 × 10 × 6.5 cm), were planted on 6 June 2019 in the south block and on 9 July 2019 (due to late delivery of seedlings) in the north block of the greenhouse. The rock wool cubes with seedlings were put in a distance of 0.5 m on growing bags with rock wool mats (100 × 20 × 7.5 cm; Grotop expert, Grodan B.V., Roermond, The Netherlands), yielding a shoot density of 1.4 m−2. For gas flux measurements, four new growing bags and four growing bags, which were already used in the early season culture of 2019 (re-used), were distributed within the cucumber greenhouse (Supplementary Figure 2). The growing bags for sampling were located in the middle of the plant stand of the 6,000 m2 greenhouse, always in distance of 6 m to the central gangway. Normally, the growing bags were placed on a 5 cm polystyrene layer on the ground. For measurement purposes, the growing bags were additionally put on panels, as they are used for tomato cultivation. Water and nutrients were supplied via drip fertigation in an open system, where the drain solution is discarded. Mineral fertilizers (Supplementary Table 1) were added to obtain EC values of 2.5–3 mS cm−1 and the pH of the supplied nutrient solution was adjusted to 5.6 using nitric acid. The volumes and EC values of added nutrient solution were adjusted according to plant demand/seasonal timing, and in order to obtain a surplus volume of about 30% as drain solution. No nutrient solution was added after 19 October 2019 in order to drying out the growing bags by plant water uptake. In total, nitrogen fertilizers corresponding to 725 and 516 kg N ha−1 (excluding the surplus of 30%) were added to the south and north blocks, respectively, during the late season cucumber culture in 2019. Cucumber shoots were trained on a wire and lateral shoots were removed before the main shoot reached the top of the wire. Thereafter, the main shoot was cut off and the uppermost two-three lateral shoots were allowed to grow downwards. Harvesting of cucumber fruits started on 21 June 2019 in the south block and on 29 July in the north block, and was from then on done six times per week until the end of the culture on 23 October 2019. Total yield of marketable cucumbers was around 359 t ha−1 for the late season culture of 2019. The early season culture in 2020 was similar to 2019. Both, the south and north block, were planted on 27 February 2020. For gas flux measurements, only new rock wool growing bags were used and six sampling points were distributed analogously to 2019 in the greenhouse (Supplementary Figure 2). Cultivation was done until 19 May for the first half of the greenhouse (problems with powdery mildew) and until 2 June for the second half of the greenhouse.
Measurement of Greenhouse Gas Emissions
To measure the fluxes of greenhouse gases (CO2, CH4 and N2O) in the root zone of tomato and cucumber plants the closed chamber method described for soil by Parkin and Venterea (2010) was used and modified for hydroponics. Acrylic glass chambers, previously described by Halbert-Howard et al. (2020), were installed around the growing bags separating root zone air space from shoot air space (Supplementary Figure 3). To make this possible, the chambers consisted of two halves and had two openings on top for the plant stems. Air exchange was prevented by rubber gaskets (foam rubber and silicone) on the bottom of the chambers, between the two chamber halves and around the plant stems. Pressure imbalances and temperature effects inside the chamber were avoided by a vent tube and reflective aluminum foil on the chamber outside. The chamber air space differed depending on the type of studied growing bag and was 15.6, 18.3, and 19.0 dm3 for rock wool, coir and perlite with wood fiber, respectively. Gas samples were drawn through a butyl septum on the camber top using a 50 ml polypropylene syringe with a stainless steel needle. For each gas flux determination, four gas samples were taken at 20 min intervals over 1 h (0, 20, 40, and 60 min after closing the chamber). For transport, 30 cm3 of gas sample was deposited into previously vacuumed 20 ml glass vials with magnetic screw caps and silicone/PTFE septa (model N 18, Macherey-Nagel GmbH and Co KG, Düren, Germany), yielding a slight overpressure to avoid contaminations from ambient air. To ensure tightness of glass vials, the vacuum was checked prior to sampling and only vials with a pressure <100 mbar were utilized. Gas analyses were carried out directly on the day of sampling using a gas chromatograph (GC 2,010 Plus, Shimadzu Corporation, Kyoto, Japan) with an electron capture detector (ECD) for N2O, a thermal conductivity detector (TCD) for CO2, and a flame ionization detector (FID) for CH4. External standards (AIR LIQUIDE Deutschland GmbH, Düsseldorf, Germany) were used to calibrate the GC system for each measuring sequence. Standard concentrations were 0.285, 0.380, 0.592, 1.97, 5.12, and 9.4 ppm (±10%) for N2O; 310, 604, and 1011 ppm (±2%) for CO2; and 1.04, 5.02, and 10.1 ppm (±2%) for CH4. Depending on sample N2O concentrations, a low calibration curve (0.285–0.592 ppm) and a high calibration curve (0.592–5.12/9.4 ppm) were used, as background effects were more pronounced for small N2O concentrations (<0.592 ppm).
Data Evaluation
Gas fluxes were calculated using the R software [version 3.6.3; R core team (2020)] and the R package “gasfluxes” [version 0.4-4; Fuss (2020)], with the latter automatically selecting for the best fit model from either linear, robust linear, and non-linear (HMR model) regressions. For flux calculation, the measured concentrations (in ppm) were transformed to μmol m−3 according to the ideal gas law under the assumption of SATP conditions (T = 25°C and p = 101.3 kPa). Because each chamber measurement always included two plants, the area (A) to which the fluxes referred was calculated as: A = 2 × Dp−1, with Dp being the plant density (in m−2). Further input variables for flux calculation were the chamber air volume (in m3) and the time after closing the chamber (in h). The use of non-linear regression was restricted, as suggested by the gasfluxes package authors, by using the margin of uncertainty from the external standards (±10% for N2O and ±2% for CO2 and CH4) as surrogate for the measurement precision of the GC system. The resulting gas fluxes (in μmol m−2 h−1) were further converted to g N2O–N ha−1 d−1, g CH4 ha−1 d−1 and kg CO2 ha−1 d−1 based on molar masses. Cumulative emissions (kg N2O–N ha−1 and Mg CO2 ha−1) were calculated on the basis of daily N2O and CO2 emission rates by linear interpolation between sampling days and summing up daily emission rates over the study periods (trapezoidal method). N2O emission factors (in %) were calculated through dividing cumulative N2O emissions by the total amount of N (in kg N ha−1) supplied in the nutrient solution during the study period. Yield-scaled N2O emissions (in mg N2O–N ) were calculated through dividing cumulative N2O emissions by marketable yield (in kg ha−1). CO2 equivalents (in Mg CO2 ha−1) were calculated from cumulative N2O emissions (in kg N2O ha−1) through multiplying by the 100-yr global warming potential of 298 for N2O (Myhre et al., 2013).
Statistical Analyses
All statistical analyses were performed in the R software (version 3.6.3). Linear mixed-effects models (LMMs) were done using the R package “lme4” [version 1.1-21; Bates et al. (2015)]. LMMs on N2O and CO2 emission rates from tomato cultivation in 2019 included sampling date and location inside the greenhouse (north or south block) as fixed factors, and growing bag identity as random intercept. LMMs on N2O and CO2 emission rates from cucumber cultivation in the late season of 2019 included sampling date, location inside the greenhouse (north or south block) and substrate (new or re-used rock wool) as fixed factors, and growing bag identity as random intercept. LMMs on N2O and CO2 emission rates from tomato cultivation on different substrates in spring 2019 included sampling date and substrate (rock wool, coir or perlite with wood fiber) as fixed factors, and growing bag identity as random intercept. Prior to LMM analyses, data were log(x + 1)- or sqrt-transformed to fulfill the requirements of LMMs (i.e., normality and homogeneity of variances). Regression analyses between mean gas (N2O and CO2) emission rates and climate parameters were done for tomato and cucumber cultivation in 2019 using the “lm” function from the R base package. Prior to analysis, N2O fluxes were log-transformed to fulfill the assumptions of normality and homogeneity of variances, and all flux and climate data were studentized for better comparability between different units and scales. The sampling dates when no nutrient solutions were supplied to plants were excluded from regression analyses to avoid potential bias because gas emissions were strongly reduced, likely due to dry conditions strongly limiting microbial activity. Permutational ANOVAs were done to determine exact P-values for block and substrate effects on cumulative emissions from cucumber cultivation in the late season of 2019 (substrate and block effects) and tomato cultivation in spring 2019 (only substrate effects) using the R package “lmPerm” [version 2.1.0; Wheeler and Torchiano (2016)]. If a significant substrate or block effect was found (Pexact < 0.05), a Tukey HSD post-hoc test was done on the results from ordinary ANOVA on (1/x)-or sqrt-transformed data using a level of significance of α = 0.05.
Results
Greenhouse Gas Emissions From Hydroponic Tomato Cultivation
The N2O emission rates showed a strong variation over the growing season in 2019 (Figure 1A; Table 1), with average values ranging from 1.7 g N2O–N ha−1 d−1 in April to 18.7 g N2O–N ha−1 d−1 in July. After a first peak (11.3 g N2O–N ha−1 d−1) at the start of tomato harvest on 4 April, the emission rates balanced at a low level (~4 g N2O–N ha−1 d−1) until 19 June. Consistently high average emission rates (16.3–18.7 g N2O–N ha−1 d−1) were measured during July and August, when temperature and solar radiation were relatively high (Supplementary Figure 4A). However, there was no correlation between emission rates and greenhouse climate variables (Table 2), as high solar radiation during April and June, together with the highest temperatures in June, did not relate to increased N2O emissions. In addition, there was a very high variability of N2O emission rates between the four replicates in July and August. The emission rates then continuously declined from end of August to end of September (7.8 g N2O–N ha−1 d−1 on 25 September) but increased again during October (13.7 g N2O–N ha−1 d−1 on 22 October), coinciding with an increased occurrence of excessive root growth due to Agrobacterium rhizogenes infection. Following the cessation of irrigation and nutrient supply, the average N2O emission rates dropped below 1.7 g N2O–N ha−1 d−1 in November. The measurements in 2020 showed very low N2O emission rates (<0.4 g N2O–N ha−1 d−1) during the first 7 weeks (15 January to 4 March) of tomato cultivation (Figure 2A). These fluxes were in the range of the measurement uncertainty and even a negative flux value was found in one replicate, which was hence excluded from the calculation of cumulative N2O emissions. After a 2-month sampling break due to the COVID-19 pandemic, missing the onset of harvest, N2O emission rates in May 2020 (1.1–2.6 g N2O–N ha−1 d−1) were slightly lower compared to May 2019 (2.5–3.5 g N2O–N ha−1 d−1). Cumulative N2O emissions were calculated from 14 March to 13 November 2019 and 15 January to 04 March 2020 (Table 3). Assuming that the N2O emission rates in the first 2 months of cultivation in 2019 were similar to the ones from 2020, the total N2O emissions for one tomato cultivation season were on average 2.3 kg N2O–N ha−1. This corresponds to about 1.100 kg CO2 ha−1 based on the 100-year global warming potential of N2O. The CO2 emission rates from tomato cultivation also exhibited a distinct seasonal dynamic during 2019 (Figure 1B; Table 1), with highest values during the warm summer months. In contrast to N2O, the CO2 emission rates strongly correlated with greenhouse temperature and less pronounced with solar radiation (Table 2). The highest average emission rate of 88.7 kg CO2 ha−1 d−1 was measured on 5 June, when the temperature inside the greenhouse was also highest (Supplementary Figure 4A). The lowest emission rates were found on 29 March (10.0 kg CO2 ha−1 d−1), prior to the harvest, and in November (13.0-14.8 kg CO2 ha−1 d−1), after cutting off the nutrient solution supply. Regarding the measurements in 2020, the CO2 emission rates continuously increased from 1.9 kg CO2 ha−1 d−1 on 15 January to 13.5 kg CO2 ha−1 d−1 on 4 March (Figure 2B). The values measured in May 2020 (33.7–47.2 kg CO2 ha−1 d−1) were comparable to May 2019 (29.8–54.7 kg CO2 ha−1 d−1). In total, the cumulative CO2 emissions from 14 March 2019 to 3 March 2020 were about 11.8 Mg CO2 ha−1 (Table 3). Over the whole study period no significant CH4 fluxes were detected (calculated fluxes ranged from −0.6 to 0.3 g CH4 ha−1 d−1 and were all below the minimum detection limit; Supplementary Figure 5).
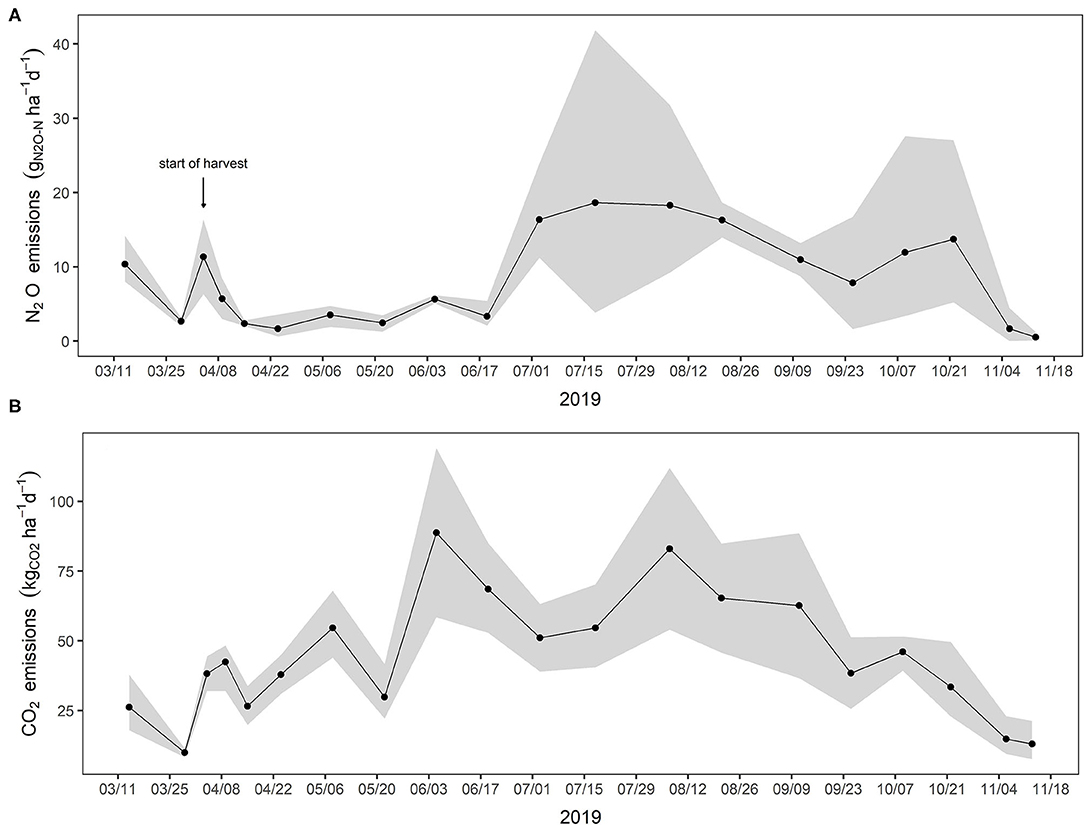
Figure 1. Time series of N2O (A) and CO2 (B) emission rates from the root zone of tomatoes grown on rock wool growing bags in a closed-loop hydroponic system in 2019. Circles show mean values of n = 4 replicates and shaded areas the corresponding 95% confidence intervals.
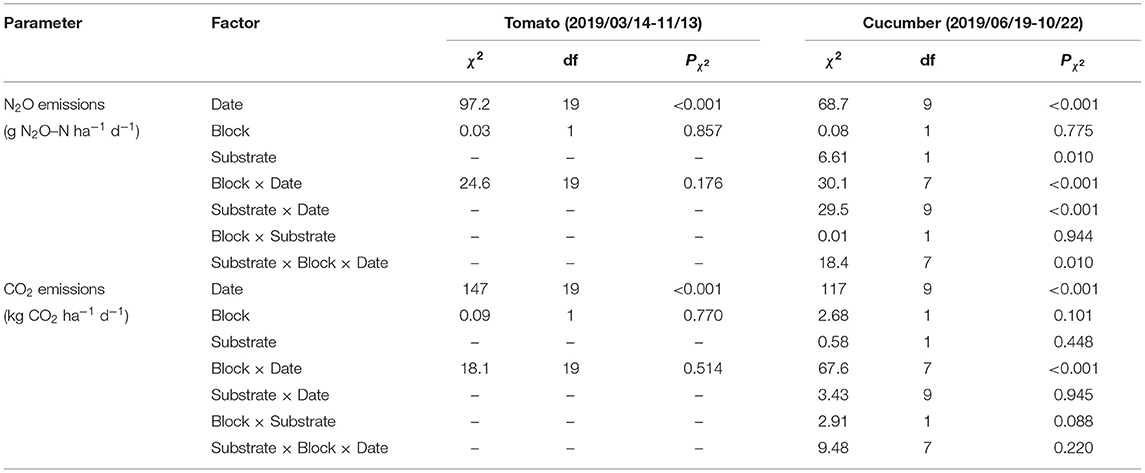
Table 1. Results of linear mixed-effects models analyzing the fixed effects of location inside the greenhouse (Block) and the utilization of new or re-used rock wool growing bags (Substrate, for cucumber cultivation only), and the random effects of individual growing bags on N2O and CO2 emission rates from 2019.
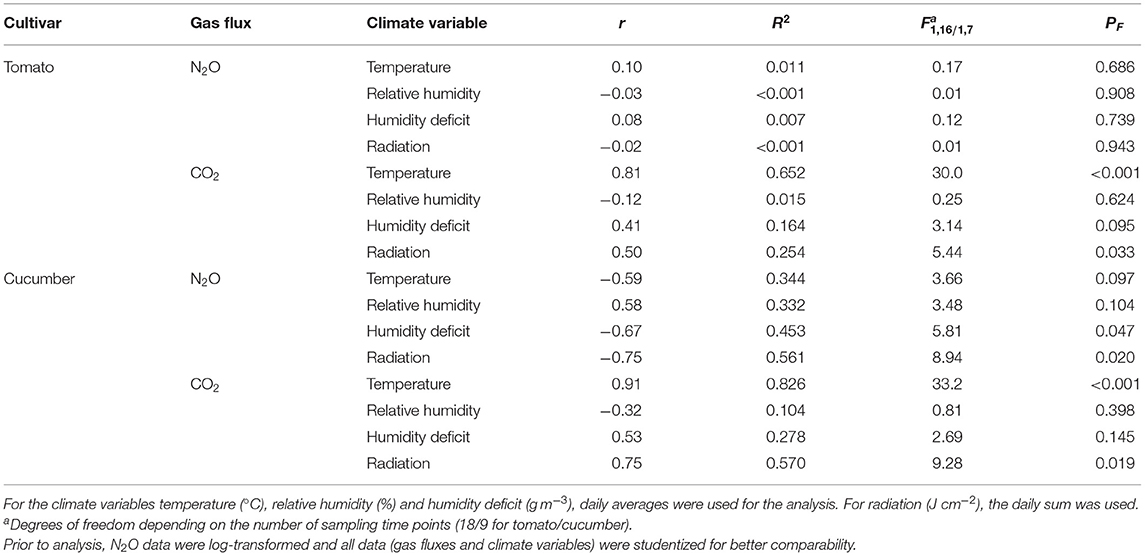
Table 2. Results of linear regression analyses between average N2O or CO2 emission rates (without time points at the end of the growing season when no nutrient solution was applied) and greenhouse climate variables at the corresponding sampling dates in 2019.
Figure 2. N2O (A) and CO2 (B) emission rates from the root zone of tomatoes grown on rock wool growing bags in a closed-loop hydroponic system in early 2020. Circles show mean values of n = 6 replicates and shaded areas the corresponding 95% confidence intervals. Sampling was restricted in March and April due to the COVID-19 pandemic.
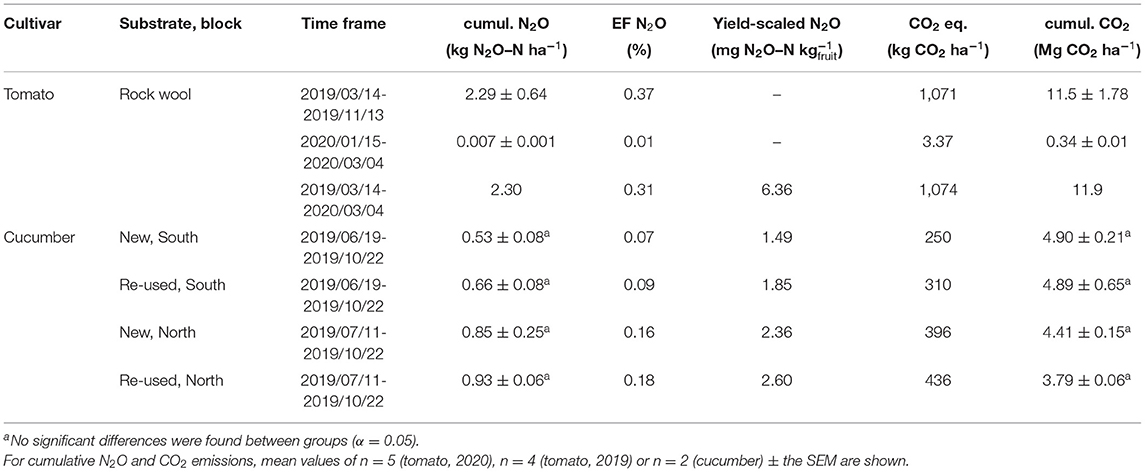
Table 3. Cumulative N2O emissions (cumul. N2O), N2O emission factors (EF N2O) from applied nitrogen fertilizers, yield scaled N2O emissions, CO2 equivalents of cumulative N2O emissions (CO2 eq.), and cumulative CO2 emissions (cumul. CO2) from the root zones of tomato and cucumber plants.
Greenhouse Gas Emissions From Hydroponic Cucumber Cultivation
In the late season 2019, the N2O emission rates strongly varied over time and between the north and south block of the greenhouse (Figure 3A; Table 1). The emission rates were generally low (on average 3.1 g N2O–N ha−1 d−1) until 11 September and increased to high values at 25 September and 9 October in the north block (on average 25.2 g N2O–N ha−1 d−1), while in the south block moderately increased emission rates (on average 14.6 g N2O–N ha−1 d−1) were found at 25 September only. Independent of the block, the N2O emission rates declined to very low values (on average 0.7 g N2O–N ha−1 d−1) on 22 October, following the cessation of irrigation and nutrient supply. In addition to the temporal and block effects, the emission rates were also affected by the utilized substrate (Table 1), with slightly higher values from re-used rock wool than from new rock wool growing bags at most sampling time points (Figure 3A). This was also reflected in the linear mixed-effects model by a significant interaction effect of substrate, block and sampling date on N2O emission rates (Table 1). Overall, the N2O emission rates from late season cucumber cultivation negatively correlated with solar radiation and humidity deficit (Table 2). However, the increase of N2O emission rates in September and October was also coinciding with a substantial spread of mildew, especially in the north block of the greenhouse. Only a few data points could be collected during the early season cucumber cultivation in 2020 (Supplementary Figure 6A), because for most of the time sampling was not possible due to the COVID-19 pandemic. The existing data from new rock wool growing bags showed very low N2O emission rates (on average 0.5 g N2O–N ha−1 d−1) at the beginning of the cultivation period on 4 March, and low emission rates (on average 1.6 g N2O–N ha−1 d−1) at the end of the cultivation period in May (still with fertigation). Cumulative N2O emissions from the late season cultivation in 2019 were on average 0.74 kg N2O–N ha−1 (Table 3). Despite the shorter cultivation period, the N2O emissions were about 50% higher in the north block (on average 0.89 kg N2O–N ha−1) compared to the south block (on average 0.60 kg N2O–N ha−1). Compared to the new rock wool growing bags, the re-used rock wool growing bags had on average 9 and 25% higher N2O emissions in the north and south block, respectively. Permutational two-way ANOVA showed that the block effect (Pexact = 0.0254) was significant, while the substrate effect was not significant. The N2O emissions from cucumber cultivation for the whole year (new rock wool growing bags are used in early season and re-used in late season) could only be roughly estimated as the double of the emissions from the late season, i.e., 1.48 kg N2O–N ha−1, as the data collected from the early cultivation season in 2020 was insufficient. The CO2 emission rates from the late season cucumber cultivation in 2019 showed a trend to decreasing values from June to October (Figure 3B), which strongly correlated with temperature and to a lesser extend with solar radiation inside the greenhouse (Table 2). Highest values were found in the south block in June and July (on average 60.4 kg CO2 ha−1 d−1). The CO2 emission rates were lower in the north block during July (on average 39.8 kg CO2 ha−1 d−1) but increased in August to their maximum (on average 49.6 kg CO2 ha−1 d−1) and were then higher during September than in the south block. The seasonal difference between the two blocks was expressed as a significant interactive effect of block and date in the linear mixed model (Table 1). The lowest emission rates (on average 9.8 kg CO2 ha−1 d−1) were measured on 22 October, when the nutrient solution supply was already cut off. The little available data from the early cultivation season in 2020 (Supplementary Figure 6B) showed that the CO2 emission rates were very low at the beginning of cultivation on 4 March (on average 3.4 kg CO2 ha−1 d−1), and then reached values in May 2020 (on average 39.1 kg CO2 ha−1 d−1) comparable to July 2019. The cumulative CO2 emissions from the late season cucumber cultivation in 2019 were on average 4.5 Mg CO2 ha−1. The CO2 emissions were, in contrast to cumulative N2O emissions, higher in the south block (on average 4.9 Mg CO2 ha−1) than in the north block (on average 4.1 Mg CO2 ha−1). The utilization of new or re-used rock wool growing bags had no consistent effect on cumulative CO2 emissions. This was supported by permutational two-way ANOVA showing a significant block effect (Pexact = 0.0095), while the substrate effect was insignificant. Assuming similar CO2 emissions from early and late season, whole year CO2 emissions from cucumber cultivation were estimated approximately as 9.0 Mg CO2 ha−1. Over the whole study period no significant CH4 fluxes were detected (calculated fluxes ranged from −0.1 to 0.2 g CH4 ha−1 d−1 and were all below the minimum detection limit; Supplementary Figure 7).
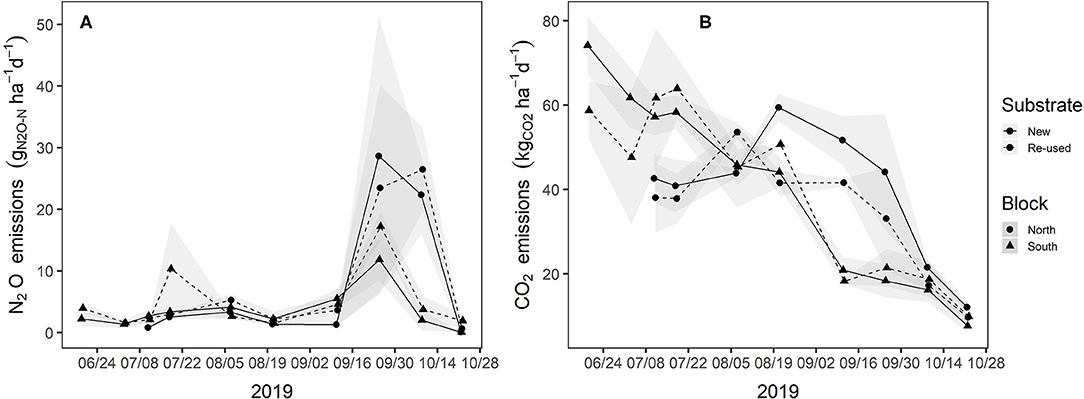
Figure 3. Time series of N2O (A) and CO2 (B) emission rates from the root zone of cucumbers grown on rock wool growing bags in an open-loop hydroponic system in the second half of 2019. Half of the studied rock wool growing bags were new (solid lines), while the other half was previously used in the first half of 2019 (Re-used, dotted lines). Due to a delayed delivery of seedlings, cultivation in the north block (circles) started 3 weeks later than in the south block (triangles) of the greenhouse. Symbols show mean values of n = 2 replicates and shaded areas the corresponding 95% confidence intervals.
Effects of Organic Growing Substrates on N2O and CO2 Emissions
The N2O emission rates from well-drained rock wool, coir and perlite/wood fiber substrates were similar from 14 March to 9 April (Figure 4A), with average values ranging from 2.7 to 12.0 g N2O–N ha−1 d−1 and varying over time. However, the emission rates from the two waterlogged coir growing bags were substantially higher during this time (Supplementary Figure 8A), yielding average values of 51 to 316 g N2O–N ha−1 d−1. After the waterlogging was eradicated, N2O emission rates from the previously waterlogged growing bags declined and were similar to the ones from well-drained growing bags on 15 April (Figure 4A). From 24 April to 5 June both, coir and perlite/wood fiber growing bags, had about twice as high emission rates (on average 7.6 and 6.7 g N2O–N ha−1 d−1 for coir and perlite/wood fiber, respectively) than rock wool growing bags (on average 3.3 g N2O–N ha−1 d−1). On contrast, all substrates had similar emission rates at the last sampling on 19 June. The varying substrate effect over time was reflected by the linear mixed-effects model as a significant interaction effect of substrate and sampling date on N2O emission rates (Table 4). The cumulative N2O emissions were calculated from 14 March to 5 June, because only two replicates each were measured on 19 June for coir and perlite/wood fiber. The cumulative N2O emissions from coir and perlite/wood fiber were on average about 50% higher compared to rock wool, while the waterlogged coir growing bags had even 10 times higher emissions (Table 5). In both cases, with and without water-logged coir growing bags, a significant substrate effect on cumulative N2O emissions (Pexact < 0.01) was found in permutational one-way ANOVA. The CO2 emission rates from coir and perlite/wood fiber growing bags mostly reflected the dynamics found in rock wool (Figure 4B), and no significant substrate effects were found in the linear mixed-effects model (Table 4). In consequence, also the cumulative CO2 emissions were comparable between all substrates (Table 5). Only slightly higher CO2 emissions were found from the waterlogged coir growing bags (Supplementary Figure 8B). However, there was no significant substrate effect found in permutational one-way ANOVA, regardless of whether the waterlogged coir growing bags were included or excluded.
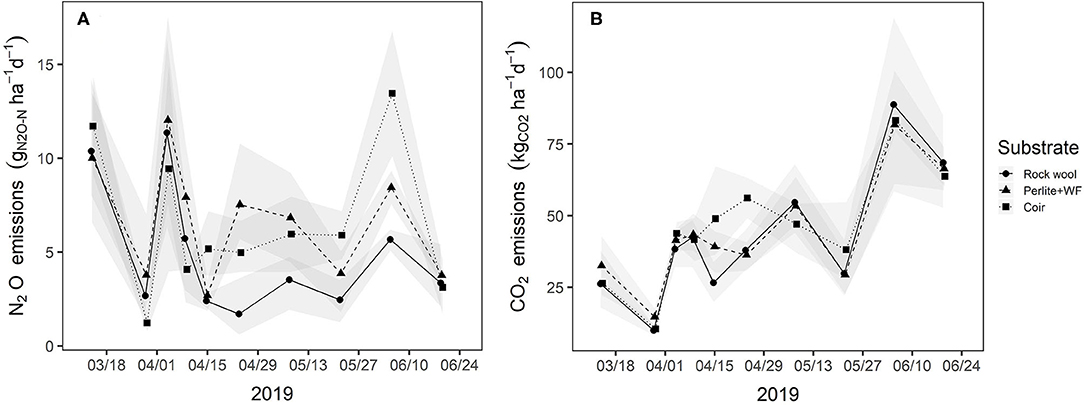
Figure 4. N2O (A) and CO2 (B) emission rates from the root zone of tomatoes grown in perlite/wood fiber growing bags (Perlite+WF, triangles and dashed lines) and coir growing bags (squares and dotted lines) compared to rock wool growing bags (circles and solid lines) in spring 2019. Symbols show mean values of n = 4 replicates (n = 2 for the first four points of Coir, and for the last point of Coir and Perlite+WF) and shaded areas the corresponding 95% confidence intervals.
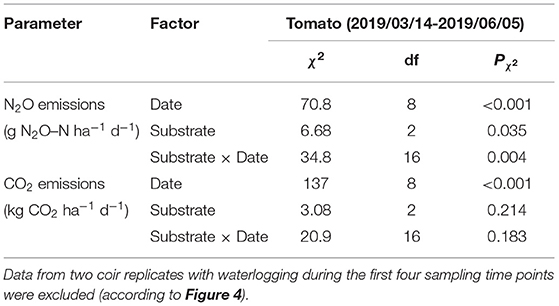
Table 4. Results of linear mixed-effects models analyzing the fixed effects of utilized substrate (rock wool, perlite/wood fiber or coir), and the random effects of individual growing bags on N2O and CO2 emission rates from tomato cultivation in spring 2019.
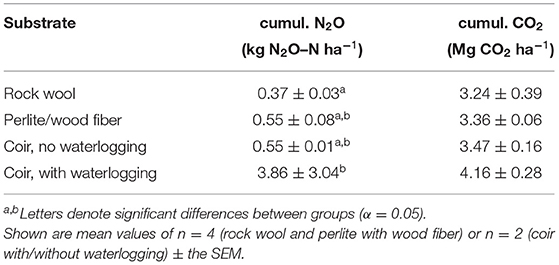
Table 5. Cumulative N2O emissions (cumul. N2O) and cumulative CO2 emissions (cumul. CO2) from the root zones of tomato plants grown on rock wool, perlite/wood fiber and coir, with and without waterlogging during the first sampling time points.
Discussion
Increasing the sustainability of food production is indispensable regarding current global changes in climate and population. One way of approaching this goal is to increase irrigation and fertilizer efficiency (Gerten et al., 2020). Greenhouse cultivation is known to be very resource-efficient, however, for its expansion potential trade-offs, such as GHG emissions from fertilizer application, need to be assessed (Gruda et al., 2019). In this study, we focused on determining the N2O emissions from hydroponic tomato and cucumber cultivation under real production conditions. Although the CO2 emissions from the root zone were about 10 times higher than the N2O emissions converted to CO2 equivalents (Table 3), the measured CO2 emissions do not affect the greenhouse gas budget of plant cultivation because of the preceding photosynthetic CO2 fixation (Smith et al., 2014). In contrast, CH4 emissions would also affect the GHG budget of plant cultivation but were not traceable in this study. Possibly, CH4 production was suppressed by rather aerobic conditions in the growing bags and by the high abundance of nitrate fertilizer (Le Mer and Roger, 2001). Despite a few gaps, the data collected during 2019 and 2020 was sufficient for estimating seasonal N2O emissions from rock wool substrates, since the combined dataset from both years covers all different growth stages of the two vegetable plants. Remarkably, the N2O emissions reported here are about 10 times smaller compared to findings from previous studies on rock wool-based hydroponic systems. Daum and Schenk (1996a) found that on average 1.2% of the applied N-fertilizer was emitted as N2O during cucumber cultivation, and Hashida et al. (2014) reported that 4–8% of applied the N-fertilizer was emitted as N2O during tomato cultivation. In contrast, in our study we found N2O emission factors of 0.1–0.2% and 0.31% (Table 3) for the N supplied during the cultivation of cucumbers and tomatoes, respectively. These values are clearly below the general N2O emission factor of 1% utilized by the Intergovernmental Panel on Climate Change for estimating N2O emissions from crop cultivation on soils (IPCC, 2019).
The lower N2O emissions compared to previous studies could be due to various factors depending on the hydroponic setup. Especially the irrigation rate (Abalos et al., 2014; Yoshihara et al., 2014) and the draining of the substrate could have decreased the emissions by providing more aerobic conditions, thereby decreasing N2O production from denitrification. The irrigation technique has been found to be a major influencing factor on N2O emissions from field-based tomato cultivation (Kennedy et al., 2013; Ye et al., 2019). Indeed, we also found strongly increased N2O emissions from accidentally water-logged growing bags (Table 5; Supplementary Figure 8A), with up to 40 times higher average N2O emission rates, underpinning the critical role of precise irrigation and oxygen supply to the root zone in minimizing N2O production. Another factor limiting N2O emissions might have been the slightly acidic nutrient solution (pH ~ 5.6) that was supplied to the plants. The activity of nitrifying and denitrifying bacteria is typically highest under neutral and slightly alkaline conditions and decreases with lower pH values (Farquharson and Baldock, 2007). Furthermore, it cannot be excluded that the measurement chambers used here are relatively prone to gas leaking, because the installation and tightening of the chambers in the production greenhouses is very difficult and smaller leaks might have been missed. Nevertheless, mostly linear increases of N2O and CO2 concentrations in the chambers over the measurement period of 1 h and extremely high N2O emission rates found in water-logged substrates (Supplementary Figure 8) indicate that the chamber measurements generally worked well. On the other side, it is possible that we rather over-estimated the N2O emission rates, because the shown gas fluxes were measured during daytime and extrapolated to 24 h. Additional measurements at different daytimes exhibit that the gas emission rates decrease during nighttime (Supplementary Figure 9), when no nutrient solution was supplied and when the temperature inside the greenhouse is lower. Remarkably, comparable N2O emission rates and N2O emission factors were reported by Kennedy et al. (2013) for field tomato cultivation, amounting to 0.5 and 0.8% of the applied N-fertilizer from drip-fertigated and conventionally fertilized crops, respectively. Llorach-Massana et al. (2017) found that lettuce crops on perlite bags emitted 0.7-0.9% of the applied N-fertilizer as N2O. Similarly, low N2O emission rates were found by (Nett et al., 2019) for cucumber cultivation on substrate-filled pots.
The study of Nett et al. (2019) also showed that N2O emission rates can strongly increase if sufficient organic C is available in the substrate, as demonstrated by a peak of N2O emissions following the degradation of roots after cutting shoots. The N2O emissions from hydroponic systems are probably mainly due to denitrification, as nitrate is typically used as primary N-fertilizer in such systems (de Kreij et al., 2003). Because microbial denitrification is a predominantly heterotrophic process depending on the supply of organic C (Baggs, 2011), the degradation of plant residues can increase the N2O production by denitrifying microorganisms (Chen et al., 2013), likely also by limiting oxygen availability due to increased C mineralization (Morley and Baggs, 2010). Previous studies (Hashida et al., 2014; Kazuhiro Shoji, 2014) found a strong increase of N2O emissions from the long-term use of rock wool substrate. However, in this study the N2O emissions were only slightly increased in re-used rock wool compared to fresh rock wool growing bags used for cucumber cultivation (Figure 3A; Table 1). Nevertheless, root biomass remained from the previous cultivation in the re-used rock wool growing bags (Supplementary Table 2). Possibly, the effect of re-used substrate was overlaid by the strong block effect, which was due to the delayed planting of the north greenhouse block. Because of technical restrictions, the smaller cucumber plants in the north block received the same amount and composition of nutrient solution as the larger plants in the south block. Consequently, the lower water and nutrient demand of cucumber plants in the north block might have resulted in higher moisture and nitrate contents in the growing bags, yielding increased N2O emission rates compared to the south block (Figure 3A). In contrast, we could find a clear effect of the presence of organic material in the growing substrate of tomato plants (Figure 4A; Table 4), showing that the use of coir and perlite with wood fiber growing bags increased N2O emissions almost by 50% compared to rock wool growing bags after 5 months of cultivation in June (Table 5). This effect might even be higher at the end of the growing season, as emissions from rock wool growing bags increased in July and remained at a relatively high level until the end of October (Figure 1A).
In general, we could hardly find a correlation between the greenhouse climatic conditions and the N2O emission rates (Table 2). On the contrary, the CO2 emissions clearly reflected the changes in temperature over the growing season, as expected for the general microbial activity involved in the decomposition of labile organic C (Davidson and Janssens, 2006). Despite the known temperature sensitivity of N2O emissions (Grant and Pattey, 2008) the lowest daily mean temperatures found in the greenhouse may have already been at the optimum for denitrification (Farquharson and Baldock, 2007) or a higher share of N2O was further reduced to molecular nitrogen (N2) with increasing temperature (Maag and Vinther, 1996). Similarly to temperature, no clear effect of the supplied amount of nutrient solution was visible in our study. The irrigation frequency was adjusted during the cultivation period according to temperature and solar radiation (Supplementary Figure 10), whereby strong fluctuations in moisture contents inside the growing bags should have been avoided. In hydroponic systems, the N2O emission rate was found to strongly depend on plant growth stage (Daum and Schenk, 1996a; Hashida et al., 2014). In line with this, we found that the onset of harvest can temporarily increase N2O emissions from tomato cultivation, potentially by altering plant C allocation with more C substrates translocated to roots. The increase of N2O emission rates at the end of the growing season from both, tomato and cucumber cultivation, can be explained by the accumulation of senescent roots delivering C substrates needed for denitrification. In this way, the higher N2O emission factors from tomato cultivation compared to cucumber cultivation (Table 3) might be explained by the higher root biomass of tomato plants (Supplementary Table 2), with a potential further increase in organic C due to the re-use of collected drain solution. However, the higher emission rates in September and October might also be related to a lower plant N uptake, considering the negative relation of photosynthetically active radiation and N2O emission rates found by Yoshihara et al. (2016). In addition, observed plant diseases at the end of the growing season, like the Agrobacterium rhizogenes (“Crazy Roots”) infection of tomato plants or the mildew on cucumber plants, could also have affected microbial N2O production by increasing C allocation to roots.
In conclusion, our study demonstrated that hydroponic systems offer a possibility to cultivate vegetable crops with low N2O emissions if optimal conditions are provided. In particular, high moisture contents together with high C availability in the root zone should be avoided to minimize N2O production from denitrification. In addition, other reduction possibilities for GHG emissions from greenhouse cultivation should be considered as well. The production of rock wool is associated with high CO2 emissions, which could be avoided by using alternative (bio-degradable) substrates (Dannehl et al., 2015; Kennard et al., 2020). However, there is more research needed on the interaction of different substrates and GHG emissions as well as yield and quality. Considering the moderate increase in N2O emissions when using organic-based substrates in our study, there might still be a high reduction potential compared to GHG emissions from rock wool production. Similarly, the GHG emissions from fertilizer production might be reduced by utilizing fertilizers recycled from waste streams. First investigations show that recycling fertilizers are suitable for hydroponic tomato production without increasing N2O emissions (Halbert-Howard et al., 2020). Other measures that can contribute to reducing GHG emissions from greenhouse cultivation include avoiding heat losses by improved greenhouse insolation, using alternative heating and electricity sources, installing energy-efficient lamps, and using renewable sources for CO2 enrichment in the canopy (Gruda et al., 2019). Taken all these measures together, hydroponic greenhouse cultivation could help to ensure sustainable vegetable production by reducing the distance between producers and consumers. Because of the high yield to area ratio and the possibility to control most environmental conditions, hydroponic or even aquaponic systems seem to be very promising for food production in urban areas or regions with otherwise adverse climatic conditions.
Data Availability Statement
The original contributions presented in the study are included in the article/Supplementary Material, further inquiries can be directed to the corresponding author/s.
Author Contributions
DS and KH initiated the study. MG and KH managed greenhouse technics and plant cultivation during the study period. SK and MG conducted the GHG measurements. SK analyzed the gas samples, evaluated the gas flux data, and prepared the manuscript. All authors were involved in the planning, critically read the manuscript, and provided their feedback.
Funding
The measurement and evaluation of GHG emissions were facilitated by the HydroN2O project (Verringerung der Distickstoffoxidemissionen beim hydroponischen Anbau von Pflanzen im Gewächshaus; ptBLE-FKz 28-1-B2.041-16 and ptBLE-FKz 28-1-B2.042-16), which was supported by funds of the Federal Ministry of Food and Agriculture (BMEL) based on a decision of the Parliament of the Federal Republic of Germany via the Federal Office for Agriculture and Food (BLE) under the innovation support program. In addition, the study received co-funding from the company Fontana Gartenbau GmbH. The company had following involvement with the study: operation of the production greenhouses, plant cultivation, collection of climate data, and assistance during the measurement.
Conflict of Interest
KH is the managing director of the company “Fontana Gartenbau GmbH” and MG is employed by this company.
The remaining authors declare that the research was conducted in the absence of any commercial or financial relationships that could be construed as a potential conflict of interest.
Publisher's Note
All claims expressed in this article are solely those of the authors and do not necessarily represent those of their affiliated organizations, or those of the publisher, the editors and the reviewers. Any product that may be evaluated in this article, or claim that may be made by its manufacturer, is not guaranteed or endorsed by the publisher.
Acknowledgments
The authors want to thank Dr. Hans-Peter Kläring, a former member of the Leibniz Institute of Vegetable and Ornamental Crops (IGZ) e.V., for initiating the contact with the Fontana Gartenbau GmbH as well as for conceiving the first project ideas. The IGZ student assistants Oscar Monzon, Uwe Bolduan and Alexander Tako are acknowledged for their help during gas sampling. Further thanks go to the gardeners of the Fontana Gartenbau GmbH for plant care. The authors also thank Dr. Kirsten Weiß and Gabriele Sommer from the Humboldt University of Berlin for enabling and supporting the GC analyses.
Supplementary Material
The Supplementary Material for this article can be found online at: https://www.frontiersin.org/articles/10.3389/fsufs.2021.626053/full#supplementary-material
References
Abalos, D., Sanchez-Martin, L., Garcia-Torres, L., van Groenigen, J. W., and Vallejo, A. (2014). Management of irrigation frequency and nitrogen fertilization to mitigate GHG and NO emissions from drip-fertigated crops. Sci. Total Environ. 490, 880–888. doi: 10.1016/j.scitotenv.2014.05.065
Baggs, E. M. (2011). Soil microbial sources of nitrous oxide: recent advances in knowledge, emerging challenges and future direction. Curr. Opin. Environ. Sustain. 3, 321–327. doi: 10.1016/j.cosust.2011.08.011
Bates, D., Mächler, M., Bolker, B., and Walker, S. (2015). Fitting linear mixed-effects models using lme4. J. Stat. Softw. 67, 1–48. doi: 10.18637/jss.v067.i01
Butterbach-Bahl, K., Baggs, E. M., Dannenmann, M., Kiese, R., and Zechmeister-Boltenstern, S. (2013). Nitrous oxide emissions from soils: how well do we understand the processes and their controls? Philos. Trans. R. Soc. Lond. B. Biol. Sci. 368, 1–13. doi: 10.1098/rstb.2013.0122
Campbell, B. M., Beare, D. J., Bennett, E. M., Hall-Spencer, J. M., Ingram, J. S. I., Jaramillo, F., et al. (2017). Agriculture production as a major driver of the Earth system exceeding planetary boundaries. Ecol. Soc. 22. doi: 10.5751/ES-09595-220408
Chen, H., Li, X., Hu, F., and Shi, W. (2013). Soil nitrous oxide emissions following crop residue addition: a meta-analysis. Glob. Chang. Biol. 19, 2956–2964. doi: 10.1111/gcb.12274
Dannehl, D., Suhl, J., Ulrichs, C., and Schmidt, U. (2015). Evaluation of substitutes for rock wool as growing substrate for hydroponic tomato production. J. Appl. Bot. Food Qual. 88, 68–77. doi: 10.5073/JABFQ.2015.088.010
Daum, D., and Schenk, M. K. (1996a). Gaseous nitrogen losses from a soilless culture system in the greenhouse. Plant Soil 183, 69–78. doi: 10.1007/BF02185566
Daum, D., and Schenk, M. K. (1996b). Influence of nitrogen concentration and form in the nutrient solution on N2O and N2 emissions from a soilless culture system. Plant Soil 203, 279–288. doi: 10.1023/a:1004350628266
Daum, D., and Schenk, M. K. (1998). Influence of nutrient solution pH on N2O and N-2 emissions from a soilless culture system. Plant Soil 203, 279–287. doi: 10.1023/A:1004350628266
Davidson, E. A., and Janssens, I. A. (2006). Temperature sensitivity of soil carbon decomposition and feedbacks to climate change. Nature 440, 165–173. doi: 10.1038/nature04514
Davidson, E. A., Keller, M., Erickson, H. E., Verchot, L. V., and Veldkamp, E. (2000). Testing a conceptual model of soil emissions of nitrous and nitric oxides. Bioscience 50:667. doi: 10.1641/0006-3568(2000)050[0667:TACMOS]2.0.CO;2
de Kreij, C., Voogt, W., and Baas, R. (2003). Nutrient Solutions and Water Quality for Soilless Cultures. Naaldwijk: Applied Plant Research, Division Glasshouse.
FAO (2019). Sustainable Food and Agriculture: An Integrated Approach. New York, NY: Academic Press).
Farquharson, R., and Baldock, J. (2007). Concepts in modelling N2O emissions from land use. Plant Soil 309, 147–167. doi: 10.1007/s11104-007-9485-0
Firestone, M. K., and Davidson, E. A. (1989). “Microbiological basis of NO and N2O production and consumption in soil,” in Exchange of Trace Gases Between Terrestrial Ecosystems and the Atmosphere: Report of the Dahlem Workshop on Exchange of Trace Gases Between Terrestrial Ecosystems and the Atmosphere, eds M. O. Andreae and D. S. Schimel (New York, NY: Wiley), 7–21.
Fuss, R. (2020). gasfluxes: Greenhouse Gas Flux Calculation from Chamber Measurements. Version 0.4-4 ed.
Gerten, D., Heck, V., Jägermeyr, J., Bodirsky, B. L., Fetzer, I., Jalava, M., et al. (2020). Feeding ten billion people is possible within four terrestrial planetary boundaries. Nat. Sustain. 3, 200–208. doi: 10.1038/s41893-019-0465-1
Giles, M. E., Daniell, T. J., and Baggs, E. M. (2017). Compound driven differences in N2 and N2O emission from soil; the role of substrate use efficiency and the microbial community. Soil Biol. Biochem. 106, 90–98. doi: 10.1016/j.soilbio.2016.11.028
Grant, R. F., and Pattey, E. (2008). Temperature sensitivity of N2O emissions from fertilized agricultural soils: Mathematical modeling in ecosys. Glob. Biogeochem. Cycl. 22:3273. doi: 10.1029/2008GB003273
Gruda, N. (2009). Do soilless culture systems have an influence on product quality of vegetables? J. Appl. Bot. Food Qual. 82, 141–147. doi: 10.18452/9433
Gruda, N., Bisbis, M., and Tanny, J. (2019). Impacts of protected vegetable cultivation on climate change and adaptation strategies for cleaner production—a review. J. Clean. Prod. 225, 324–339. doi: 10.1016/j.jclepro.2019.03.295
Halbert-Howard, A., Hafner, F., Karlowsky, S., Schwarz, D., and Krause, A. (2020). Evaluating recycling fertilizers for tomato cultivation in hydroponics, and their impact on greenhouse gas emissions. Environ. Sci. Pollut. Res. Int. 10461. doi: 10.1007/s11356-020-10461-4
Hashida, S.-n., Johkan, M., Kitazaki, K., Shoji, K., Goto, F., and Yoshihara, T. (2014). Management of nitrogen fertilizer application, rather than functional gene abundance, governs nitrous oxide fluxes in hydroponics with rockwool. Plant Soil 374, 715–725. doi: 10.1007/s11104-013-1917-4
IPCC (2019). “2019 Refinement to the 2006 IPCC guidelines for national greenhouse gas inventories,” in Ambio eds.E. Calvo Buendia, Tanabe, K., Kranjc, A., Baasansuren, J., Fukuda, M., Ngarize, S., Osako, A., Pyrozhenko, Y., Shermanau, P. and Federici, S. (Switzerland: The Intergovernmental Panel on Climate Change), 1581–1586.
Jurgilevich, A., Birge, T., Kentala-Lehtonen, J., Korhonen-Kurki, K., Pietikäinen, J., Saikku, L., et al. (2016). Transition towards circular economy in the food system. Sustainability 8:69. doi: 10.3390/su8010069
Kazuhiro Shoji, K. K. (2014). Influence of nitrogen limitation and long-term use of rockwool on nitrous oxide emissions in hydroponic systems. J. Horticult. 01:113. doi: 10.4172/2376-0354.1000113
Kennard, N., Stirling, R., Prashar, A., and Lopez-Capel, E. (2020). Evaluation of recycled materials as hydroponic growing media. Agronomy 10:1092. doi: 10.3390/agronomy10081092
Kennedy, T. L., Suddick, E. C., and Six, J. (2013). Reduced nitrous oxide emissions and increased yields in California tomato cropping systems under drip irrigation and fertigation. Agric. Ecosyst. Environ. 170, 16–27. doi: 10.1016/j.agee.2013.02.002
Le Mer, J., and Roger, P. (2001). Production, oxidation, emission and consumption of methane by soils: a review. Eur. J. Soil Biol. 37, 25–50. doi: 10.1016/S1164-5563(01)01067-6
Llorach-Massana, P., Muñoz, P., Riera, M. R., Gabarrell, X., Rieradevall, J., Montero, J. I., et al. (2017). N2O emissions from protected soilless crops for more precise food and urban agriculture life cycle assessments. J. Clean. Prod. 149, 1118–1126. doi: 10.1016/j.jclepro.2017.02.191
Maag, M., and Vinther, F. P. (1996). Nitrous oxide emission by nitrification and denitrification in different soil types and at different soil moisture contents and temperatures. Appl. Soil Ecol. 4, 5–14. doi: 10.1016/0929-1393(96)00106-0
Morley, N., and Baggs, E. M. (2010). Carbon and oxygen controls on N2O and N2 production during nitrate reduction. Soil Biol. Biochem. 42, 1864–1871. doi: 10.1016/j.soilbio.2010.07.008
Myhre, G., Shindell, D., Bréon, F.-M., Collins, W., Fuglestvedt, J., Huang, J., et al. (2013). “Anthropogenic and Natural Radiative Forcing,” in Climate Change 2013: The Physical Science Basis. Contribution of Working Group I to the Fifth Assessment Report of the Intergovernmental Panel on Climate Change, eds T.F. Stocker, D. Qin, G.-K. Plattner, M. Tignor, S.K. Allen, J. Boschung, A. Nauels, Y. Xia. (New York, NY: Cambridge University Press), 163–174.
Nett, L., Hauschild, I., and Kläring, H. P. (2019). Carbon sink reduction by fruit removal triggers respiration but not nitrous oxide emissions from the root zone of cucumber. Ann. Appl. Biol. 175, 111–118. doi: 10.1111/aab.12516
Parkin, T. B., and Venterea, R. T. (2010). “Chapter 3. Chamber-Based Trace Gas Flux Measurements,” in Sampling Protocols. eds R.F. Follett. (Maryland: U.S. Department of Agriculture, Agricultural Research Service), 39.
Poore, J., and Nemecek, T. (2018). Reducing food's environmental impacts through producers and consumers. Science 360, 987–992. doi: 10.1126/science.aaq0216
R core team (2020). R: A Language and Environment for Statistical Computing. Vienna, Austria: R Foundation for Statistical Computing.
Robertson, G. P., and Vitousek, P. M. (2009). Nitrogen in agriculture: balancing the cost of an essential resource. Annu. Rev. Environ. Resour. 34, 97–125. doi: 10.1146/annurev.environ.032108.105046
Savvas, D., Gianquinto, G., Tuzel, Y., and Gruda, N. (2013). “Good agricultural practices for greenhouse vegetable crops—principles for mediterranean climate areas, 12: soilless culture,” in FAO Plant Production and Protection Paper. (Rome: Food and Agriculture Organization of the United Nations).
Smith, P., Bustamante, M., Ahammad, H., Clark, H., Dong, H., Elsiddig, E. A., et al. (2014). “Agriculture, forestry and other land use (AFOLU),” in Climate Change 2014: Mitigation of Climate Change. Contribution of Working Group III to the Fifth Assessment Report of the Intergovernmental Panel on Climate Change, eds. O. Edenhofer, R. Pichs-Madruga, Y. Sokona, E. Farahani, S. Kadner, K. Seyboth,. (New York, NY: Cambridge University Press), 112.
Springmann, M., Clark, M., Mason-D'Croz, D., Wiebe, K., Bodirsky, B. L., Lassaletta, L., et al. (2018). Options for keeping the food system within environmental limits. Nature 562, 519–525. doi: 10.1038/s41586-018-0594-0
Springmann, M., Spajic, L., Clark, M. A., Poore, J., Herforth, A., Webb, P., et al. (2020). The healthiness and sustainability of national and global food based dietary guidelines: modelling study. BMJ 370. doi: 10.1136/bmj.m2322
Steffen, W., Richardson, K., Rockstrom, J., Cornell, S. E., Fetzer, I., Bennett, E. M., et al. (2015). Planetary boundaries: guiding human development on a changing planet. Science 347, 1259855–1259855. doi: 10.1126/science.1259855
Stehfest, E., and Bouwman, L. (2006). N2O and NO emission from agricultural fields and soils under natural vegetation: summarizing available measurement data and modeling of global annual emissions. Nutri. Cycl. Agroecosyst. 74, 207–228. doi: 10.1007/s10705-006-9000-7
Ye, X., Liu, H., Zhang, X., Ma, J., Han, B., Li, W., et al. (2019). Impacts of irrigation methods on greenhouse gas emissions/absorptions from vegetable soils. J. Soils Sediments 20, 723–733. doi: 10.1007/s11368-019-02422-3
Yoshihara, T., Tokura, A., Hashida, S.-n., Kitazaki, K., Asobe, M., Enbutsu, K., et al. (2014). A precise/short-interval measurement of nitrous oxide emission from a rockwool tomato culture. Environ. Control Biol. 52, 137–147. doi: 10.2525/ecb.52.137
Keywords: horticulture, food systems, soilless cultivation, greenhouse gas emissions, Solanum lycopersicum, Cucumis sativus, N2O (nitrous oxide)
Citation: Karlowsky S, Gläser M, Henschel K and Schwarz D (2021) Seasonal Nitrous Oxide Emissions From Hydroponic Tomato and Cucumber Cultivation in a Commercial Greenhouse Company. Front. Sustain. Food Syst. 5:626053. doi: 10.3389/fsufs.2021.626053
Received: 04 November 2020; Accepted: 20 July 2021;
Published: 24 August 2021.
Edited by:
Ngonidzashe Chirinda, Mohammed VI Polytechnic University, MoroccoReviewed by:
Rakesh S, National Academy of Agricultural Research Management (ICAR), IndiaLuca Vitale, National Research Council of Italy (CNR), Italy
Copyright © 2021 Karlowsky, Gläser, Henschel and Schwarz. This is an open-access article distributed under the terms of the Creative Commons Attribution License (CC BY). The use, distribution or reproduction in other forums is permitted, provided the original author(s) and the copyright owner(s) are credited and that the original publication in this journal is cited, in accordance with accepted academic practice. No use, distribution or reproduction is permitted which does not comply with these terms.
*Correspondence: Stefan Karlowsky, karlowsky@igzev.de