Optimizing Pasteurized Fluid Milk Shelf-Life Through Microbial Spoilage Reduction
 Forough Enayaty-Ahangar
 Sarah I. Murphy
 Nicole H. Martin
 Martin Wiedmann
 Renata Ivanek
- 1Population Medicine & Diagnostic Sciences, Cornell University, Ithaca, NY, United States
- 2Department of Food Science, Cornell University, Ithaca, NY, United States
Psychrotolerant spore-forming bacteria, entering raw milk primarily on-farm, represent a major challenge for fluid milk processors due to the ability of these bacteria to survive heat treatments used for milk processing (e.g., pasteurization) and to cause premature spoilage. Importantly, fluid milk processors require tools to identify optimal strategies for reducing spore-forming bacteria, thereby extending product shelf-life by delaying spoilage. Potential strategies include (i) introducing farm-level premium payments (i.e., bonuses) based on spore-forming bacteria counts in raw milk and (ii) investing in spore reduction technologies at the processing level of the fluid milk supply chain. In this study, we apply an optimization methodology to the problem of milk spoilage due to psychrotolerant spore-forming bacteria and propose two novel mixed-integer linear programming models that assess improving milk shelf-life from the dairy processors' perspective. Our first model, imposed to a budgetary constraint, maximizes milk's shelf-life to cater to consumers who prefer milk with a long shelf-life. The second model minimizes the budget required to perform operations to produce milk with a shelf-life of a certain length geared to certain customers. We generate case studies based on real-world data from multiple sources and perform a comprehensive computational study to obtain optimal solutions for different processor sizes. Results demonstrate that optimal combinations of interventions are dependent on dairy processors' production volume and quality of raw milk from different producers. Thus, the developed models provide novel decision support tools that will aid individual processors in identifying the optimal approach to achieving a desired milk shelf-life given their specific production conditions and motivations for shelf-life extension.
1. Introduction
Dairy products represent 17% of the total value of food wasted at the retail and consumer levels and are among the top food categories that contributed to the food waste in the United States in 2010 (United States Department of Agriculture, 2014). In the United States, the waste of fluid milk primarily occurs at point-of-retail and end-consumer levels (Buzby et al., 2014). For example, 31% of all dairy products and 32% of fluid milk were estimated to be wasted at these stages in 2010 (United States Department of Agriculture, 2014). A large portion of fluid milk waste is due to people throwing out (i) products that spoil before they are able to be consumed and (ii) products that are not spoiled based on organoleptic characteristics but are beyond their identified “best by” or “expiration" date (Hall-Phillips and Shah, 2017). Both of these are of concern to processors since they may lose customers because of short shelf-life or premature microbial spoilage of their product. Therefore, the microbial spoilage of milk leading to waste becomes a challenge for the dairy processors. Thus, they would benefit from decision support tools to determine optimal strategies to extend milk's shelf-life through microbial spoilage reduction in order to allow them to address their customers' needs by producing milk of a certain target shelf-life. A typical milk supply chain structure in the United States is described in the Supplementary Material.
There are two primary routes through which spoilage bacteria enter the fluid milk supply chain: (i) contamination of raw milk on farms with psychrotolerant Gram-positive spore-forming bacteria (Martin et al., 2019) and (ii) contamination of milk at the processing level with Gram-negative bacteria after pasteurization (i.e., post-pasteurization contamination) (Martin et al., 2018). When post-pasteurization contamination is prevented (e.g., through Good Manufacturing Practices), psychrotolerant Gram-positive spore-forming bacteria (e.g., Bacillus spp. and Paenibacillus spp.) are the primary causes of pasteurized fluid milk spoilage. This is because spores (i.e., the resistant structure produced by the spore-forming bacteria) can survive commonly used pasteurization methods (e.g., HTST) (Martin et al., 2019) and subsequently grow at refrigeration temperatures over a period of 14–17 days after pasteurization (Ranieri and Boor, 2009). Some technologies such as ultra-high pasteurization [e.g., pasteurization at 138°C (280°F) for 2 s (International Dairy Food Association, n.d.)] are known to effectively reduce bacterial spores in fluid milk. However, compared to HTST pasteurization, these alternative pasteurization methods are undesirable by processors, because of their considerably higher cost, and by many United States consumers, because higher pasteurization temperatures produce defects such as “cooked" and “stale" flavors (Mehta, 1980; Rysstad and Kolstad, 2006). As such, compared to alternative methods, the market for HTST pasteurized fluid milk remains strong. Thus, control of bacterial spores in HTST pasteurized fluid milk in the United States remains a considerable challenge for the dairy industry.
Factors that determine the concentration of spore-forming bacteria in pasteurized fluid milk include (i) the initial concentration of spores in the raw milk at the production level, (ii) spore reductions that can occur at the processing level, and (iii) bacterial growth that can take place at the transportation, distribution, retail, and consumer levels. In order to reduce the spore-forming bacteria level of the final product, different strategies associated with each of the three factors need to be considered. Now, we provide more details about these strategies:
(i) Initial concentration of spores at the production level— The original source of spore-forming bacteria often is farms where spores are ubiquitous and can easily find their way (e.g., through dirty udders) to enter bulk tank raw milk. Efforts to reduce the initial concentration of spores in raw milk at the production level need to account for the heterogeneous quality of milk supplied by multiple producers. This means that even if the majority of the producers supply milk with low concentrations of spores, having a few producers with high spore concentrations can lead to high enough contamination levels in the silo milk to contaminate the majority of packaged products with >1 spore, which can subsequently grow and cause spoilage. Strategies to reduce the initial concentration of spores in raw milk require producers to perform on-farm interventions (e.g., training milking parlor employees). These interventions, with different impacts on raw milk's spore concentration, require a specific amount of time for implementation. More importantly, most United States producers do not currently have financial incentives to produce raw milk with low spore counts, making the producers reluctant to implement additional interventions. Statistical analysis in Saenger et al. (2013) shows that incentivizing producers for consistent high-quality milk and/or penalizing them for supplying low-quality milk encourages them to invest in quality-improving inputs that results in higher quality milk. Thus, one strategy for dairy processors to motivate the producers to perform on-farm interventions would be through a premium/penalty system by which the processors would test collected raw milk for spores and based on the result of each sample test, they would incentivize (or penalize) the producers for supplying raw milk with a desirable (or undesirable) quality. While such premium/penalty system would be new for the United States producers, there are examples of limited applications of such systems elsewhere, e.g., the Netherlands where some producers receive deduction on the milk price because of a high level of contamination of raw milk with spores (Vissers et al., 2007a).
Currently, in the United States, milk pricing is based on individual components (i.e., fat, protein, solids) and a blend price, which is based on the utilization of raw milk for different dairy products and geographic location, per 100 lb (i.e., CWT or hundredweight), along with additional potential premiums (i.e., quality premiums) based on different factors that will quantify its quality. According to Munch et al. (2020), premiums are often offered as a tool to reward/penalize producers for their milk's somatic cell counts. Based on data provided by three different dairy organizations in the United States, we estimate that premiums can vary between $-0.60 to $3 per CWT. Negative values mean the processors also apply penalties when the milk quality is not desirable. These premiums are currently paid based on raw milk quality parameters such as somatic cell count, added water (i.e., the freezing point of milk), laboratory pasteurization count, coliform bacteria count, and total bacteria count (but not spore count which is the focus of this study), which are tested for when raw milk is collected from the producers. As mentioned earlier, in the absence of post-pasteurization contamination, spore-forming bacteria are the primary bacterial agents that limit fluid milk shelf-life; therefore, in this paper, we propose a new flexible milk premium/penalty system that is solely based on raw milk's initial spore counts at the production level that would be implemented independently or instead of the current premium/penalty system described above and motivate producers to implement on-farm interventions. This novel system would require testing raw milk for the level of spores (i.e., spore counts) at the production stage of the supply chain.
(ii) Spore reduction at the processing level— The concentration of spores in raw milk can be reduced at the processing level, however, the spore reduction technologies (SRTs), such as microfiltration (MF) and bactofugation (BF), require units that are costly to purchase, install, and run. A brief description of these technologies can be found in the Supplementary Material.
(iii) Spore-forming bacteria growth after the processing level— Growth of bacteria in pasteurized fluid milk occurs when conditions are favorable for vegetative growth (e.g., refrigerated storage temperature). In such cases, certain strains of spore-forming bacteria are able to germinate (i.e., return to a metabolically active state from the dormant spore state) and then bacterial growth can occur (Huck et al., 2007; Masiello et al., 2014). Growth of bacteria in packaged pasteurized fluid milk after it leaves the processing facility has been studied by Buehler et al. (2018) who developed a Monte Carlo simulation model to estimate packaged milk's shelf-life given the distribution of initial concentration of spores in raw milk.
The strategies associated with each of these factors require operational and monetary resources; thus, their implementations need to be investigated first. The critical question is how a dairy processor should determine the optimal combination of strategies for their unique situation.
In this paper, the processor is defined as the entity in the chain that is responsible for purchasing raw milk from the producers and processing it prior to distribution. Thus, we consider the strategies that can be employed by the processor, which have effects on the initial concentration of spores at the production level and their reductions at the processing level. However, we use a Monte Carlo model, adapted from the model in Buehler et al. (2018), to simulate the bacterial growth after it leaves the processing facility. Note that it is unlikely for spores to germinate during the transportation between the suppliers and the processors due to (i) cold temperature at which the raw milk is kept in tanker trucks and (ii) the fact that the transportation time between farms and processing facilities is typically shorter than the amount of time needed for spore germination at low temperatures. Therefore, spore germination and subsequent bacterial growth at the transportation level is negligible and is not considered here.
Limited existing studies have focused on the reduction of spores at the production level (e.g., McKinnon and Pettipher, 1983; Christiansson et al., 1999; Evanowski et al., 2020) and processor level (e.g., Guerra et al., 1997; Hurt et al., 2015; Doll et al., 2017; Griep et al., 2018). However, these studies focus on only one level of the fluid milk supply chain and do not consider the strategies for more entities involved in the chain. There have been few mathematical modeling studies in the literature for improving the shelf-life for other dairy products. For example, Lütke Entrup et al. (2005) have developed a mixed-integer linear programming formulation for a yogurt production planning and scheduling problem. However, to the best of our knowledge, no optimization research has taken into account the effect of spore-forming bacteria at both the production and processing levels on the pasteurized fluid milk's shelf-life.
In this paper, using optimization techniques, we identify the best combinations of processing level interventions and production level incentive structures to optimize milk's shelf-life. We consider two types of interventions: (i) interventions that affect the production level: a flexible milk premium/penalty system based on milk quality categories, defined by raw milk's spore counts, that allows incentivizing and penalizing producers, and (ii) interventions at the processing level: implementing SRTs. These SRTs are (1) MF, (2) single-BF, and (3) double-BF which is performing BF twice.
Mathematical modeling has become a popular approach for solving real-world supply chain problems (e.g., McDonald and Karimi, 1997; AhmadBeygi et al., 2009; Enayaty-Ahangar et al., 2019; Jabbarzare et al., 2019; Sheikh-Zadeh and Rossetti, 2020). In the past decades, researchers have been using different operation research tools to improve decision-making processes in the food supply chains in order to minimize the food loss along the chain or maximize the profit (Lemma et al., 2014). Among these tools, a few deterministic modeling techniques have been widely used to solve agricultural supply chains (Ahumada and Villalobos, 2009), such as linear programming [e.g., Apaiah and Hendrix (2005) for pea-based products, Jiao et al. (2005) for sugar cane farms, Glen (1986) for crop and beef production plans], mixed integer programming [e.g., Higgins (2002) for sugar cane farms], and dynamic programming [e.g., Stoecker et al. (1985) for irrigation and crop production]. Many planning models developed for perishable agri-foods lack consideration of the shelf-life aspect. This is mainly due to the added complexity that the shelf-life feature presents in the different echelons of the chain bring to the modeling of the problem (Ahumada and Villalobos, 2009). This could also be because of biological factors that impact the shelf-life and embedding these factors in an optimization model is difficult. A few research studies have taken into account the shelf-life of perishable products such as flowers, grapes, and tomatoes when optimizing the distribution, harvesting, and other operations in the chain (e.g., Widodo et al., 2006; Ferrer et al., 2008; de Keizer et al., 2017; Ghezavati et al., 2017). To the best of our knowledge, no optimization research study has focused on optimizing operations in a pasteurized fluid milk processing facility by considering factors that determine the concentration of spore-forming bacteria in pasteurized fluid milk and thus, have the most influence on milk's shelf-life. Here, we use mixed-integer linear programming (MILP) to model this fluid milk problem. Our objective is to determine the intervention strategies that maximize the milk shelf-life subject to the processor's available budget or minimize the budget required to reach a set shelf-life target.
2. Materials and Methods
2.1. Problem Definition
We define two optimization problems in this paper. In both, we try to identify the strategies for interventions that managers at the processing level should select to achieve their desired outcome (e.g., maximized average shelf-life of all pasteurized fluid milk packages) during a planning horizon. The decisions of the models consist of determining: (1) whether or not to implement the proposed novel premium/penalty system based on raw milk's spore counts and (2) whether or not to implement one or two of the SRTs. The primary restriction in model one is the processor's budget allocated to implement these strategies. The second model, on the other hand, requires to meet a minimum shelf-life. There are a set of assumptions in the problem which are presented as follows.
⇒ A large portion of fluid milk waste is due to people throwing out (i) products with unacceptable quality (i.e., spoiled product) and (ii) products with acceptable quality (i.e., not spoiled) that are past their “best by” dates. Processors desire to not lose customers because of a short shelf-life or premature microbial spoilage of their product and that requires them to find the optimal way to reduce that risk. Thus, the main focus of this paper is on extending pasteurized fluid milk's shelf-life.
⇒ Each day, the collected milk is stored in one or more silos at the processing facility and then goes through the same processing equipment for pasteurization; thus, we assume that the number of spores in milk packages in that day equals to the weighted average of spore counts of all the raw milk collected from the producers.
⇒ The spore counts are presented in logarithmic form because microbial counts are typically highly skewed. To match food microbiology practices regarding reduction in food contamination, any reduction of the spore count is presented in logarithmic (i.e., log10) values. Also, in rare cases, the initial spore count (ISC) can be so low that not all units of milk (i.e., half-gallon packages) will contain at least one spore. In these cases, we assume the number of the contaminated half-gallon packages (HGPs) is equal to the total number of spores, meaning that there is one spore per package, and consider the rest as not contaminated.
⇒ Due to the relatively high cost of a spore test, we assume testing for spore counts occurs once a week (rather than daily) for each producer if the premium/penalty system is implemented. Days on which raw milk sampling and testing occur are randomly selected by the processor so that daily routines do not change by the producers. Note that with this approach, the difference between two consecutive tests can be within the range of 1 to 13 days. Then, the producer would be paid premiums or penalized for the total volume of milk produced in that week based on the one-time sample test result. Note that these payments can occur at any time (e.g., at the end of each week or month). Paying producers for the milk's blend price (for the volume of sold milk) occurs regardless of any spore reduction strategies implemented by the producer and thus, milk blend price is not part of our optimization models.
⇒ To calculate the impact of the premium/penalty system on the initial spore count at the production level, we assume that each producer's main interest is in the premium that would be paid if the quality of their milk is improved one or two categories.
⇒ According to experts, there is about 1–1.25% of milk shrinkage (i.e., the difference between the processed milk volume and the raw milk volume) due to MF and BF in the processing facility. The milk shrinkage has impacts on the number of sold packages but not on the shelf-life. Due to the focus of this model being on the shelf-life extension of milk, we do not account for the shrinkage in this paper. However, we acknowledge that the shrinkage due to SRT implementations may affect processor decision making and will consider it for the future direction of this work.
⇒ We appreciate that the implementation of both BF and MF in a single given fluid milk processing plan is extremely unusual and may not be feasible; however, in our model, we allow the use of multiple SRTs and consider their impacts as independent from each other. Due to the lack of data, we do not account for any possible reductions in effectiveness when using multiple SRTs. Further research is needed to determine whether or not using two SRTs can have additive/reductive effects on spore counts.
⇒ Paying premiums is a continuous process and processors cannot stop doing it when the quality of milk is improved as the producers might stop doing on-farm interventions and return to their original production management and if so, their milk quality will diminish. Therefore, the premium payments occur until the end of the planning horizon in our models. This simulates a situation in which milk processors make a commitment to keep a certain bonus scheme. In agriculture, this can be enforced by a contract between dairy processors and milk producers. It is assumed that, for the length of a planning horizon, producers do not choose to stop supplying and/or switch between processors depending on their premium/penalty systems, and also, that producers would not be “dropped” (i.e., fired or let go by the processor). We also assume that it is feasible to establish a contract between the two parties and to set provisions about quality requirements and bonuses/penalties for a specific amount of time (e.g., 5 years). Note that similar contracts already exist in industries with livestock commodities such as chicken broilers, eggs, and milk (United States Department of Agriculture, 1996).
⇒ In this problem, we do not consider the processor facility is owned by the farmers since it only applies to a small fraction of the cases.
2.2. Definition and Explanation of Models
In this section, we present two novel MILP models for the production and processing stages of the milk supply chain: (1) milk shelf-life optimization problem (MSLOP) that focuses on processors' desire to reach the longest shelf-life of their final product to please consumers who prefer longer shelf-life and (2) milk processor budget optimization problem (MPBOP) that needs to produce milk with a uniform shelf-life of certain length geared to certain customers.
2.2.1. Milk Shelf-Life Optimization Problem (MSLOP)
In this model, there is a set of producers p ∈ P that supply milk for a processor in a fixed planning horizon (i.e., |D| days or |W| weeks). On day d ∈ D, raw milk supplied by producer p ∈ P falls into one of the |C| categories of raw milk based on its ISC value, , when collected by a tanker truck. Note that the superscripts in the parameters and variables' notations are part of their names and only the subscripts represent indices. Categories c ∈ C are non-overlapping intervals . Given the values, the weighted average of ISC, , for all the raw milk collected at the processing facility in day d is then calculated. Note that a smaller value of for day d ∈ D means a longer shelf-life for all the HGPs of milk processed on that day.
To reduce the value, the processing facility can implement MF, single-BF, and double-BF. There are fixed (i.e., purchasing, installation, maintenance) and variable (i.e., electricity and operational) costs associated with each of these technologies which results in a different log reduction in the values. These parameters are presented in Table 1. There is a set of on-farm interventions q ∈ Q that can occur to achieve premium payments. These interventions will result in a log reduction of producers' daily ISC values and subsequently in the average daily spore count values. These reductions can be different in size and starting time. For example, one of the short-term on-farm control strategies is laundering re-usable cloth towels, used for cleaning the udder and teats during milking preparation, through the use of detergent and chlorine bleach and fully drying (Evanowski et al., 2020); the impact of this strategy is immediate and here we assume it results in a fixed spore reduction for as long as it is performed. Another intervention can be investing in parlor employees training designed to teach them to focus on cleaning teat ends thoroughly during milking preparation.
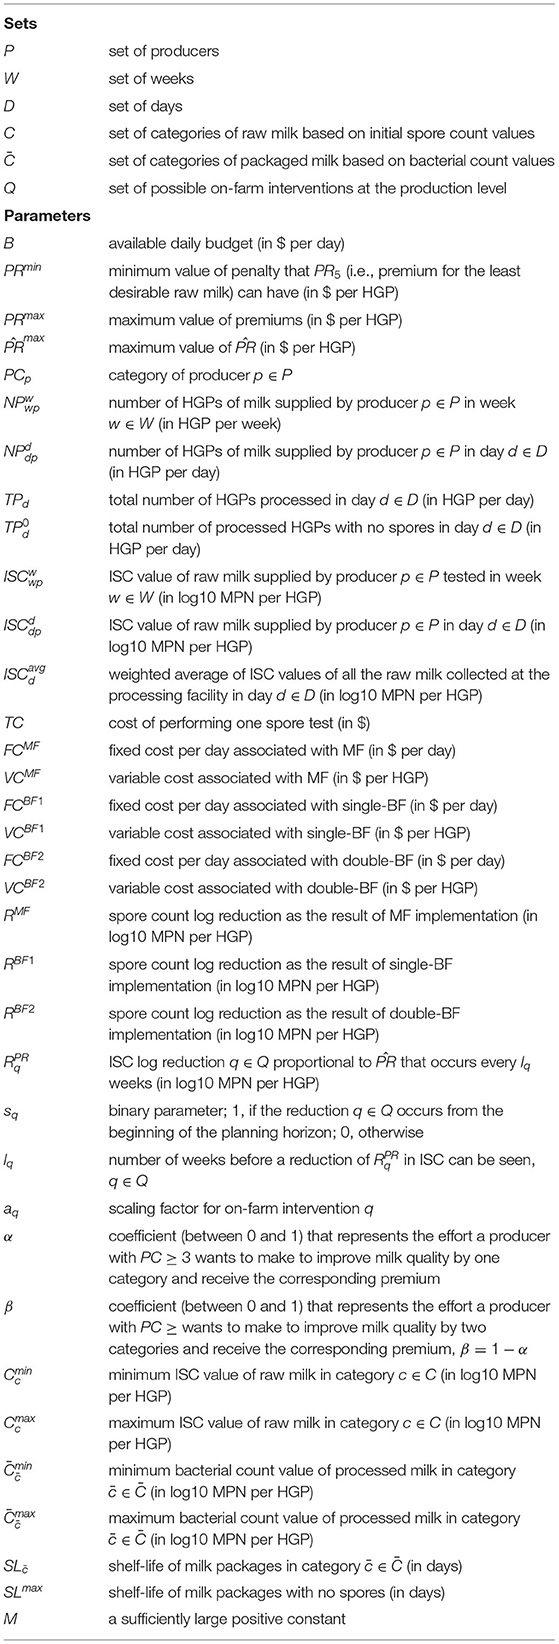
Table 1. Notation - Sets and parameters.
The main variables in the model are xMF, xBF1, xBF2, and xPR that show whether or not the processor implements MF, single-BF, double-BF, and premium/penalty system, respectively. Given the premium/penalty system is implemented (i.e., xPR = 1), variable PRc, c ∈ C denotes the premium paid for the raw milk in category c. Depending on the values the variables take, the average spore count of each day's milk will be reduced. As a result, the corresponding milk category of the processed milk on day d ∈ D and its shelf-life, , are determined. Categories are also non-overlapping intervals used to categorize the spore count values of packaged milk on day .
The problem is then to determine the set of values for the variables that maximize the average shelf-life of all the milk packages produced in the planning horizon, SLAvg, subject to the processor's daily budget, B, limit. We explain our model settings in the following passages:
⇒ The produced and processed milk are represented by unit half-gallon package (HGP) throughout the supply chain. A half-gallon is approximately equal to 1,900 milliliters (mL).
⇒ Spore count and any reductions in it are measured in log10 MPN/HGP. The distribution of the initial concentration of spores in raw milk was determined by the most probable number (MPN) method described by Masiello et al. (2014) and Buehler et al. (2018). The MPN method estimates the population density of the microbial count on the basis of the probability theory without the actual count of single colonies (Alexander, 1983).
⇒ There are five categories of raw milk where categories one to five have the most to the least desirable qualities, respectively. Also, there are eight categories of packaged milk where categories one to eight, respectively have the lowest to highest bacterial counts.
⇒ Generally speaking, the shelf-life for one package of milk is defined as the period of time between processing/packaging until it no longer meets the consumer's acceptable quality standard; that is until it starts exhibiting any physical or organoleptic defects while it is kept under practical storage conditions (Bishop and White, 1986; Muir, 1996; Schroeter et al., 2016). The consumer threshold was quantified to be 6 log10 CFU/mL bacterial count by Carey et al. (2005) and Martin et al. (2012). Thus, we too define the shelf-life of all the processed milk packages in a day to be the number of days between the packaging and the first day when 5% of packages are defective meaning that they have bacterial counts in excess of 6 log10 CFU/mL (i.e., 9.3 log10 CFU/HGP). Note the CFU, colony-forming unit, is used to present bacterial level in the finished product, while MPN is used to determine spore counts due to their low concentrations in raw milk.
⇒ The shelf-life for each of the eight categories of packaged milk is equal to the shelf-life of a representative point in that category.
The complete sets and parameters; and variables are presented in Tables 1, 2, respectively, followed by the first MILP formulation.
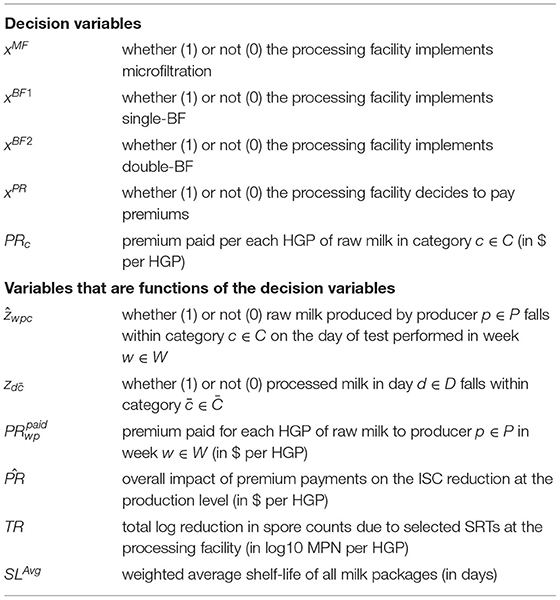
Table 2. Notation - Variables.
The objective function, (1), is to maximize the weighted average shelf-life of all the milk packages processed in the planning horizon. The only variable in the objective function, SLAvg, is calculated in constraint (23) which is explained later. The processor can either implement single-BF or double-BF but not both; this is enforced by constraint (2). Constraint (3) ensures that the premiums do not decrease as the quality of the category increases. Constraint (4) sets a lower limit on the premium of category 5, PR5. This lower limit can be negative and act as a penalty for the producers who supply milk with the least desirable raw milk. If at least one of the categories' premiums takes a non-zero value, it means that the processor implements the premium/penalty system; therefore, xPR should be equal to one. This restriction is enforced by constraints (5-6). Note that all premiums are defined only for an HGP and their absolute value is less than a small value (<1). This means we do not need a coefficient on the right-hand side of the constraints to allow take the value of one in case one of the premiums is non-zero. Note that PR5 is the only premium that can be negative and act as a penalty, hence constraint (6) is only defined for category five. Constraint (7) sets upper bounds for the premium variables to ensure that premiums do not have an unlimited impact on the raw milk spore reduction. The variable , representing the overall impact of premium payments on the ISC reductions, is calculated in constraint (8). This variable is dependent on how much milk each producer produces and the usual quality of their milk (i.e., PCp). For example, if a producer's milk is usually in category three (PCp = 3), then the premiums of the next two better categories (i.e., two and one) act as incentives for them and motivate them to perform on-farm interventions so the category of their produced raw milk improves. Two parameters, α and β, define the producer's motivation to produce milk in those two categories. Note that if a producer's usual milk quality is in category two, then they merely consider the premium for category one as an incentive (i.e., α = 1 and β = 0). Category-one producers are already producing the most desirable milk, therefore, they are not considered in the calculation. However, they will be paid the premium for category one. Constraint (9) sets an upper bound for which is later explained in section 2.3. If all the producers are already producing the most desirable milk, paying premiums will not change the objective function value (OFV), hence should be zero. This is ensured by constraint (10). On the other hand, constraint (11) ensures if there is no producer supplying undesirable milk (i.e., producers in categories 3–5), PR5 cannot be negative, meaning no penalty is applied.
Constraints (12-17) are intended to calculate the total premiums the processor should pay the producers according to their quality of milk. The quality of raw milk for each producer is determined based on the weekly spore tests. The producers will be paid the premium based on (1) the spore category of tested milk and (2) the total volume of the milk produced in that week. Constraint (12) guarantees that each producer's milk is assigned to one category of milk based on the weekly test results. Constraints (14-15) determine the category of milk produced by producer p in week w after considering the impacts of the premium payments on the ISC. Such impact consists of the overall , , aq, and how frequently the reductions can occur which are calculated by ⌊w/lq⌋ and ⌈w/lq⌉. If sq = 0, it means that the impact of intervention q does not occur from the beginning of the planning horizon and requires lq weeks before it shows any impact on the spore count. This reflects situations when a producer requires time to implement a strategy that improves the quality of their milk. Hence the floor of w/lq is considered in constraints (14-15). For instance, for intervention q with lq = 52 weeks, there will be no spore reductions occurring in w = 1, …, 51 since ⌊w/lq⌋ = 0. However, starting week 52nd, the intervention at the production level will begin to show its impact and one log10 MPN/HGP occurs if . This remains the same until week 103rd. One the other hand, if , we use which means intervention q′ at the production level shows its impact from the beginning of the planning horizon. For a similar case, where is 52 weeks and , reduction is seen once when w = 1, …, 51 since . Constraints (16-17) capture the premium paid to each producer in each week. For each producer p in week w, the paid premium is equal to PRc if the milk quality falls in category c (i.e., ẑwpc = 1). Note that for other categories where ẑwpc = 0, the two constraints do not pose any limit on the value of the paid premium (i.e., ). The total expenditure of the processor, including the spore tests' cost, premium payments, and the fixed and variable costs associated with the implementations of the SRTs (i.e., MF, single-BF, and double-BF), should not exceed the total budget in the planning horizon; this is imposed in constraint (18).
The purpose of constraints (19-23) is to calculate the weighted average shelf-life of all the HGPs during the planning horizon. The total reduction of spore count values due to the SRT implementations at the processing facility is calculated in constraint (19). Constraint (20), similarly to constraint (12), assigns all the packaged milk processed on a day to one category of milk. The two constraints (21-22) are similar to constraints (14-15) but they also consider the possible spore reductions that take place at the processing level (i.e., TR). Be reminded that all the units associated with the spore counts in the model are expressed as log10 MPN/HGP; thus, any log reduction of the spore count values should be deducted from the initial logarithmic value. For instance, for an ISC value of 3 log10 MPN/HGP (i.e., 1000 MPN/HGP) and TR of 1 log10 MPN/HGP, which means it reduces the absolute spore count by 90% (= 1 − 10−1), the final spore count is going to be 2 (= 3 − 1) log10 MPN/HGP (i.e., 1000 * 0.1 = 102 MPN/HGP). As the result of three constraints (20-22), the variable captures the category of milk processed on day d. Variables connect the daily spore count values to the daily shelf-life which is used to calculate the average shelf-life in constraint (23). Taking into account the amount of daily processed milk, constraint (23) calculates the weighted average shelf-life during the planning horizon. In this constraint, the shelf-life of the milk packages with at least one spore (i.e., ) and those packages with no spores since the production level are added. Finally, the sign constraints (24)-(29) declare the type of each variable.
2.2.2. Milk Processor Budget Optimization Problem (MPBOP)
In the MSLOP model, the goal is to determine how to allocate a fixed budget of a processor to different intervention options so that the final products' average shelf-life is maximized. However, in many cases, processors do not have a fixed and predefined value for the budget they can allocate to extend their milk's shelf-life. They first need to determine the financial benefits of shelf-life extension (e.g., $ per day of extended shelf-life, which may not be linear) and then decide whether or not it is in their best interest to invest in interventions that target a specific shelf-life. To this end, we propose a second model, milk processor budget optimization problem (MPBOP), in which we assume that a processor's goal is to increase milk's shelf-life to a specific day and the model's objective is to determine how much daily budget they need to achieve that. There are a few differences between the two models. In MPBOP, B is a decision variable and there are one additional parameter that represents the shelf-life goal of the processor (SLmin) and one more constraint. The objective functions are also different in the two models. The MILP formulation of MPBOP is presented below.
Here, the objective, (30), is to minimize the daily budget required to reach the set shelf-life target. In constraint (31), the average shelf-life needs to be at least equal to SLmin and B is a non-negative continuous variable, as shown in (32). The rest of the constraints are the same as MSLOP. Note that B in constraint (18) is a parameter in MSLOP and a variable in MPBOP.
2.3. Experimental Design
In this section, we explain how instances, to be used for evaluating the proposed MSLOP and MPBOP models, are generated based on real-world data. We used a variety of sources for our data collection such as (1) experts in the Colleges of Agriculture and Life Sciences, Veterinary Medicine, and Business at Cornell University, (2) industry partners (names redacted to respect the confidentiality), (3) experts at SRT companies (names redacted to respect the confidentiality), (4) Journal articles (e.g., Pafylias et al., 1996; Rysstad and Kolstad, 2006; Masiello et al., 2014, 2017; Buehler et al., 2018), and (5) Online resources [e.g., The United States Department of Agriculture (U.S. Energy Information Administration, 2019)].
2.3.1. Instance Generation Process
There are a variety of fluid milk processing facilities that differ in size. Processing facilities can be categorized into three groups based on annual lb of milk processed: small (less than 10M lb/yr), medium ([10M, 100M) lb/yr), and large (100M and more lb/yr) (Martin et al., 2012). We generated two different sizes for each category. Other parameters are determined by the following steps:
Number of producers and their herd sizes – The first step includes generating producers and their herd sizes in order to have enough lactating cows to produce a targeted annual milk volume for each processor. Producers' herd sizes follow the probability distribution presented in the last row of Table 3. This data was obtained from National Agricultural Statistics Service (2019). Herds with fewer than 50 cows were not considered in our instance generation procedure. After generating each producer's herd category, a value is randomly selected between the minimum and the maximum number of cows in that category (e.g., 50 and 99). This process continues until the total number of cows across all herds is adequate to produce the targeted annual volume of milk assuming each cow produces an average daily milk volume for a cow. Finally, we reduce the last producer's herd size if it causes the total volume of milk to be more than the target value.

Table 3. Dairy cattle herd size by inventory and sales: 2017 (National Agricultural Statistics Service, 2019).
Daily production volume – The next step is to generate each producer's exact daily production and ISC value. The average volume of daily produced milk by a cow is generated using a normal distribution. To determine the parameters of this distribution, mean and standard deviation, we use the data reported for 24 selected states in the United States in 2018 (United States Department of Agriculture, 2019). As shown in Table 4, an average of 1,951 lb milk was produced by one cow in each month, which is equal to 64.13 lb or 15.36 half-gallon per day. We use one-fourth of the range (i.e., (65.9 − 62.3)/4 lb) in the sample of the average daily milk over 12 months as an approximation of the distribution's standard deviation. Thus, the daily milk production of each cow follows a normal distribution with a mean of 64.13 lb (15.36 HGP) and a standard deviation of 0.98 lb (0.23 HGP).
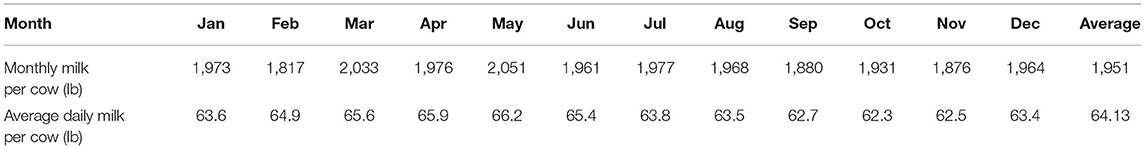
Table 4. Milk production for 24 selected states in the United States in 2018 (United States Department of Agriculture, 2019).
Daily initial spore count values – To generate an ISC value for each producer's daily raw milk, we assign each producer to one of the five categories of raw milk. This means without introducing any new on-farm interventions, one producer consistently produces milk in one category; however, they may produce milk within the neighboring categories on some days. We now explain the raw milk categories.
We define five non-overlapping intervals as the five categories of raw milk. Previously, Masiello et al. (2014) and Buehler et al. (2018) have reported data regarding psychrotolerant spore formers in bulk tank milk across New York State collected between 2009 and 2010. According to these studies, the fitted distribution of the initial spore count in milk approximately follows a lognormal distribution with parameters mean −0.72 MPN/ml and standard deviation 0.99 MPN/ml. This distribution is equivalent to a lognormal distribution with parameters mean 2.56 MPN/HGP and standard deviation 0.99 MPN/HGP. We use the same distribution to generate the producers' initial spore count. Using this distribution, we define five non-overlapping intervals, each with a probability of 0.2, as shown in Figure 1. Each interval represents one category of raw milk.
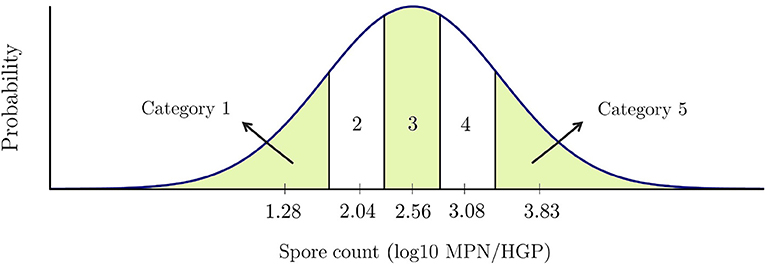
Figure 1. Five categories of raw milk based on spore count values.
The details of these categories are presented in Table 5. The last column of the table shows the relative frequency (%) of each farm falling in each category based on data presented in Masiello et al. (2017), which includes sample data from 56 different farms in New York state. As an example, given a random producer, there is an 18% chance that it usually produces raw milk in category five. Note that the MPN/HGP values are integer values and not fractional in reality but our non-overlapping intervals need to cover all the continuous values since the model cannot round up final average spore counts that may be fractional. Therefore, we partitioned the intervals in a way that they contain all the intended spore levels. For example, in reality category two represents milk with 53-203 spores, but the interval for this category is [53.5001,203.4999]. Also, note that the current categories of raw milk consider spore levels between –4 and 7 log MPN/HGP. These values were based on the existing data (Masiello et al., 2017); however, if applicable to a particular processor, the raw milk categories could include even higher contamination levels.
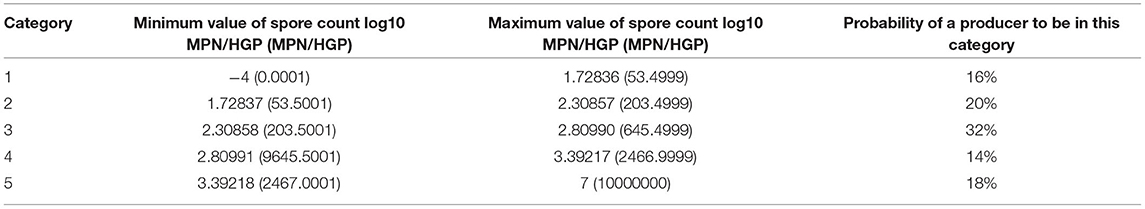
Table 5. Five categories of raw milk used for initial contamination data generation.
Masiello et al. (2017) reported spore count data for 10 farms with data collected for each month in a year. After categorizing the data based on our five spore count intervals, we calculate that farms produce milk in one main category and its first and second-hand neighboring categories with probability 70, 20, and 10%, respectively. This means producers do not always produce milk in one category and it is possible for them to produce better or worse quality milk on some days depending on many on-farm factors.
We now explain how daily spore counts are generated for each producer. All random numbers are generated based on the spore count distribution of lognormal (2.56, 0.99) MPN/HGP adapted from Buehler et al. (2018). For each day and producer (e.g., producer p with PC = 4), with a probability of 70%, we keep generating values until it is within the PCp category, which is four for producer p. With a probability of 20%, the generated value is within the neighboring categories, which are three and five for producer p. With the remaining 10% probability, the value should be within the second-hand neighboring categories, which is just category two for producer p.
Daily weighted average of initial spore counts – The weighted average of spore counts on day d is calculated using the following formula. In this formula, we calculate the weighted average of absolute spore counts in MPN/HGP and then translate it back to the logarithmic format.
In rare cases, the total number of spores in all collected milk can be less than the total number of packages of milk that day. In such a case, we assume that is equal to one spore in HGP for of the packages and zero for the remaining ones.
Parameters associated with MF and BF – The costs and spore reduction parameters associated with MF and BF are explained in the Supplementary Material. Note that all the costs associated with SRT units are translated into daily costs.
Daily budget – In the MSLOP, the processor has a fixed budget that can cover the costs of sample tests, premiums, and expenditures of SRTs' implementation and utilization. This budget can be provided by a few sources such as a possible existing budget for the current premium payments and the income they gain because of any extension in the shelf-life. Note that budgets for our case studies are solely provided by the first source and considering the profit that the processors might gain for any extension in the shelf-life is beyond the scope of this paper. We calculate the daily budget for different sizes of processors based on the data we obtained from our industry partners. The existing premium payment systems suggest that processor pay $2-$3 for each 1000 lb of raw milk. We assumed small, medium, and large processors pay premiums up to $3, $2.5, $2, respectively, for each 1000 lb of raw milk in a day (e.g., smaller processors may pay more because they have more personal relationships with their producers), but we appreciate that the relationship between processors size and premium payment may be different.
Premium/penalty systems – According to our experts, a spore test [e.g., test for aerobic bacterial spores (Frank et al., 2004)] of one raw milk sample costs $25 in a laboratory; however, a contract lab charge is between $10.75 and $21 if asked to perform regular tests on multiple samples each week. Therefore, we assume each test's cost to be $21, $16, and $11 if less than 10, between 11–20 and more than 21 weekly tests are requested, respectively.
On-farm intervention parameters – There are a variety of on-farm interventions that can result in supplying raw milk with a lower spore count. Producers with different milk quality can select from a variety of on-farm interventions to improve their milk's quality regardless of what category of milk they supply. In our models, we consider two different types of interventions that producers can apply in order to improve their raw milk quality. The first one includes interventions that start from day one and lasts until the intervention is ceased. We assume a reduction of log10 MPN/HGP for this intervention; examples of these interventions include (i) enhanced laundering of towels used in the milking parlor and (ii) training of milking parlor employees (Evanowski et al., 2020). The second one is a hypothetical repetitive intervention that gradually improves the milk quality by a small amount each year and continues reducing the spore counts by log10 MPN/HGP compared to the previous year. Note that for each of these two types, there are a variety of interventions from which producers with different milk quality can select. Even though high-quality milk producers may already be doing many of the on-farm interventions, due to the absence of data about their behavior and effectiveness of different interventions, we assume that they could implement additional strategies to further improve milk quality. This simplifying assumption should be tested when more data becomes available. Note that due to the limitation of all the units being in logarithmic values, in this model, we cannot have farm-specific values of reduction as it is impossible to calculate the final average spore levels by linear functions.
Given the on-farm interventions' impact and the differences between the spore levels of consecutive categories in Table 5, producers are able to improve their milk quality one category in the short run and two categories in the long run via on-farm interventions. In our model, we assume α = 0.7 and β = 0.3 since intuitively it takes less time (e.g., 1–2 years) and effort for a producer to improve their raw milk to be in the next better category and remain there for a long time until they can reach the next category which for our purposes we assume can take up to 5 years. Note that when generating the data for the daily ISCs of each producer, the probability of the spore counts being in the producer's main category was equal to 0.7. That is also why the effort to reach the next category is 0.7 compared to 0.3 for the second next category. Also, in the long run, it is unlikely that producers would improve their milk more than two categories as it requires more than 1 log10 MPN/HGP spore reduction and this would be challenging unless they had very high initial spore contamination levels. Thus, just the two next categories' premiums are the ones with which the producers are concerned.
Since represents how much producers are motivated by the premium for just one HGP of milk, its value going to be small, so we need to scale its impact by multiplying it by a scaling factor (i.e., aq). In order to estimate this value, we assume to be exactly the same as the current average premiums; that is $2-3 for 1000 lb or $0.0083-0.0125 for an HGP. Considering the middle range of $0.01 for , aq has to be equal to 100, so that for each , one reduction of occurs. Thus, in our model, aq = 100 for both of the on-farm interventions. We also set to be 0.02 so that do not exceed two. This means the premium payments' impact has a limit (i.e., for intervention q) on the reductions resulted from the on-farm interventions. PRmax is also considered to be equal to 0.1, which means a premium for a CWT cannot exceed $2.4. Based on the current premium/penalty system values $2.4 is a fairly large upper bound for the premiums.
Generated instances – We present 24 generated instances (representing 24 processors) in Table 6. These instances mainly vary in parameters: (i) processor size, (ii) number of producers, and (iii) planning horizon. Among these 24 instances, there are eight cases each for small (i.e., S1-S8), medium (i.e., M1-M8), and large (i.e., L1-L8) processors. Note that the size of the problems are based on the annual lb of processed milk by the processor explained earlier in this section. For each of the three processor size categories, we selected two numbers as the annual lb of milk processed (i.e., 4M, 8M, 40M, 70M, 100M, and 150M) and generated instances for planning horizons of 5 and 10 years. Then, for each of the combinations, we generated two instances, one with a lower and one with a higher number of producers (e.g., instances M1 and M2 have three and nine producers, respectively).
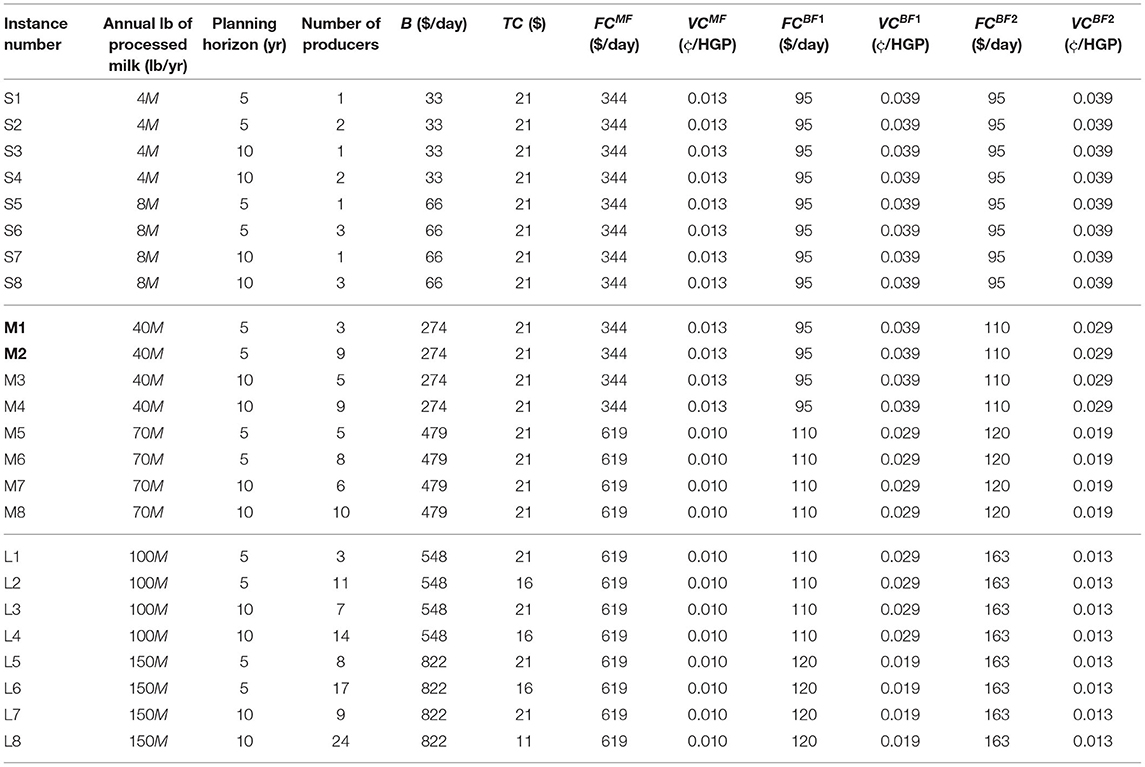
Table 6. Instance data.
The maximum penalty for these instances is considered to be $0.6 per 100 lb of raw milk in category five. Finally, based on the number of producers and the daily volume of milk that needs to be processed, the daily budget and costs (e.g., test costs, MF costs) are determined, as shown in the remaining columns of the table. In the next section, the optimal solutions of the model for these instances are presented. All optimization problems were conducted on a 6-core 16 GB computer in Python using Gurobi 8.1.1. with a time-limit of one hour. Note that due to reasonable solving time of the problems with a standard solver (i.e., Gurobi), it was not deemed necessary to develop a new solution approach for this application paper.
2.3.2. Monte Carlo Model
In order to predict the shelf-life of packaged milk which is contaminated with a given level of spores, we first determine the category of milk for this level of spore contamination and then assume its shelf-life is equal to the shelf-life of the representative point of that category. To this end, we first calculate the shelf-life for the representative points of the five categories of raw milk, shown in Figure 1, by using a Monte Carlo simulation model in R software adapted from the model in Buehler et al. (2018). This model is further explained in the Supplementary Material. In our adaptation of the model by Buehler et al. (2018), the underlying Monte Carlo simulations are based on exactly the same parameters with the only exception that the initial contamination level of spore-formers was used as a set of fixed values shown in Table 7 instead of a probability distribution. This change allowed us to reduce the number of iterations from 100,000 to 50,000, while still being able to effectively sample the whole probability space (this was confirmed by obtaining the same predictions in simulations ran with five different random seeds).
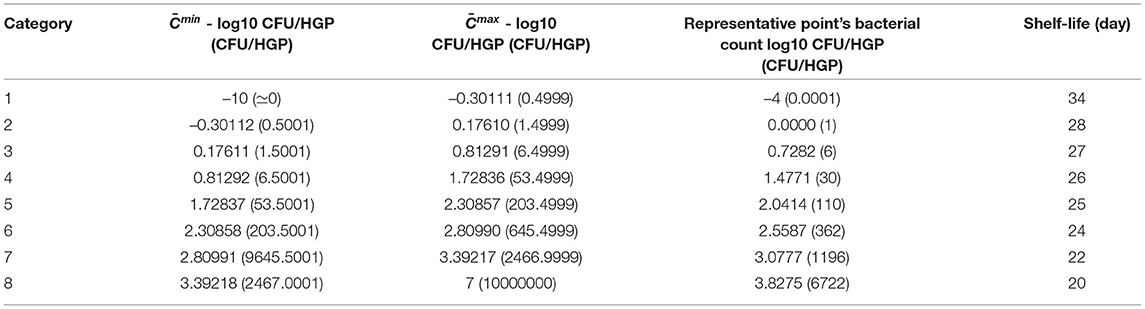
Table 7. Eight categories of packaged milk used for shelf-life calculation.
For the five raw milk categories shown in Figure 1, we determine representative points whose cumulative distribution functions are equal to 0.1, 0.3, 0.5, 0.7, and 0.9. For example, category 2 is the interval [1.73, 2.31] with 2.04 as its representative point. Running our Monte Carlo model for each of the five representative points' values, the predicted shelf-lives are 26, 25, 24, 22, 20 days, respectively. After examining other values of ISCs with the simulation model, we notice considerable differences between shelf-lives of category one's values and the other categories. Since implementing SRTs will result in lower levels of spore counts in packaged milk compared to raw milk, we took a closer look at the category 1 and tried multiple values of ISCs other than its representative point. We break down category one into four subcategories making the total number of subcategories for packaged pasteurized fluid milk's bacterial counts equal to eight. Table 7 presents the details of the eight categories and their assigned shelf-lives obtained from the Monte Carlo simulation model.
3. Results
In this section, we present the results of the proposed models for the 24 case studies (instances), described in section 2.3, and sensitivity analysis for the main parameter of each model.
3.1. Computational Results of MSLOP
Table 8 shows the optimal solutions of the MSLOP model for the 24 instances. In columns 2-6, we show the percentages of annual milk volume in each category. These percentages help us better understand the relationship between the distribution of raw milk in different categories and the premium values in the optimal solutions. The details of the optimal solutions, the optimal objective values, and the solution times are presented in columns 8-16, 17, and 18, respectively. The solutions include whether or not the processors should implement any of the SRTs or pay premiums, and the premium they should pay for each category of raw milk. Note that a blank cell means the value of the corresponding variable is zero in the optimal solution. We also compute the optimal objective value assuming no intervention is implemented, which is shown in column 19. In the last column, the increases in the objective values when interventions are allowed are shown.
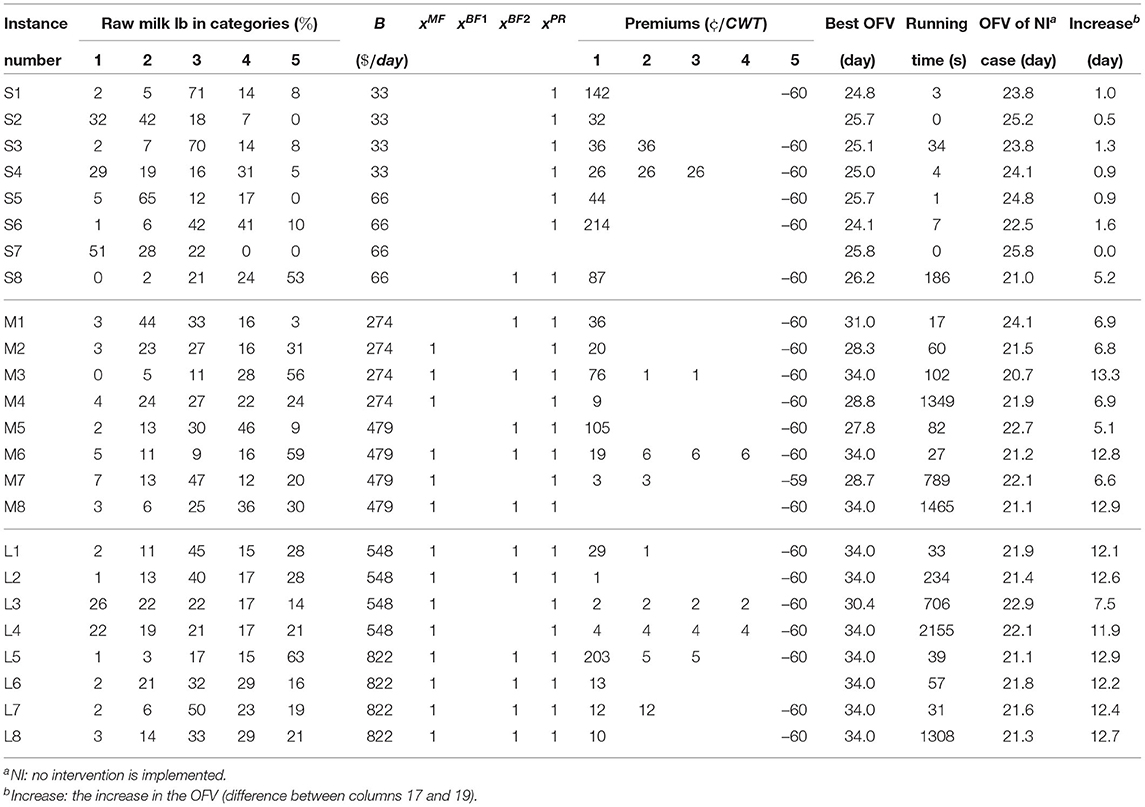
Table 8. Computational results - MSLOP model.
Looking at the optimal solutions' details, it seems that the majority of the small processors do not have enough budget to implement any of the SRTs and they mainly take advantage of the premium/penalty system to improve their raw milk quality. Note that except for instance S7, all the small processors need to apply penalties for the least desirable milk. This means that the premium payments for categories 1-4 are sourced by the processors' available daily budgets and the income gained from the applied penalties. The only small processor that did not implement any of the interventions, including the premium/penalty system, is instance S7. In this instance, the optimal objective value does not change when we allow the implementation of the interventions. This is because the processor in instance S7 is already supplied by raw milk with good quality (i.e., 51 and 28% of its supplied raw milk volume is in categories 1 and 2, respectively). On the other hand, the processor in instance S8, which has the same budget, is supplied by producers whose milk is in categories with lower qualities (i.e., 53 and 24% of their supplied milk is in categories 5 and 4, respectively). This allows the processor to take advantage of the premium/penalty system. The gained income from the penalty application allows them to implement double-BF to improve the milk's shelf-life. Note that its best weighted average shelf-life is more than that of instance S7. This means the optimal strategies are highly dependent on the structure of the supplied raw milk's quality and can increase the average shelf-life up to 5.2. days.
Comparing different medium processors, we can infer that all the processors should take advantage of the premium/penalty system. However, whether or not they should implement SRTs varies amongst these processors. For example, the processors for instances M1, M2, M4, M5, and M7 need to implement MF or double-BF. The optimal weighted average shelf-lives of these five instances are between 28.3 and 31 days. Other medium-sized processors' optimal solutions suggest implementing both MF and double-BF so that they can reach higher shelf-life (i.e., 34 days). This means that the other five medium processors the budget (including the income obtained from the penalties) was restricting the average shelf-life.
In the larger instances, except for L3 and L4, the processors use the premium/penalty system, apply the maximum penalty, and implement MF and double-BF resulting in a maximum weighted average shelf-life of 34 days; however, premiums are different as the quality of raw milk is different. In the two instances, L3 and L4, they just use MF which is still adequate for L4 to obtain the 34 days of shelf-life. This means that many of the larger processors either have a large budget or, if raw milk quality is poor, the resulting income from penalties may be used to implement both MF and double-BF.
Overall, the computational results suggest that optimal solutions for the small processors are mostly focused on the premium/penalty system rather than implementing SRTs due to their costly implementations; however, depending on their supplied milk's quality, penalizing the producers can allow them to implement SRTs, which will increase the maximum weighted average shelf-life. Medium processors' best solutions showed to be the most variable. This means that the optimal strategic decisions are highly dependent on the processors' specific situation, including raw milk quality and the processor's budget. The optimal solutions for the medium-sized processors show shelf-life increases between 5.1 and 13.3 days compared to the cases where no intervention is allowed. Larger processors showed to have the most similar results. Due to their high volumes of processed milk, which allow them to have a higher budget, and penalizing producers with undesirable quality of raw milk, which provide them with more income, most of them can reach the maximum possible weighted average shelf-life, which are 7.5–12. days more than when no intervention is allowed.
3.2. Computational Results of MPBOP
Table 9 shows the optimal solutions of the MPBOP model for the 24 instances. The MPBOP model varied when compared to the MSLOP model by targeted shelf-life which is the fixed value of 28 days for the MPBOP model. Note that all instances were solved in less than an hour except for L7 and L8; however, the final integer solution for those instances are included in the table.
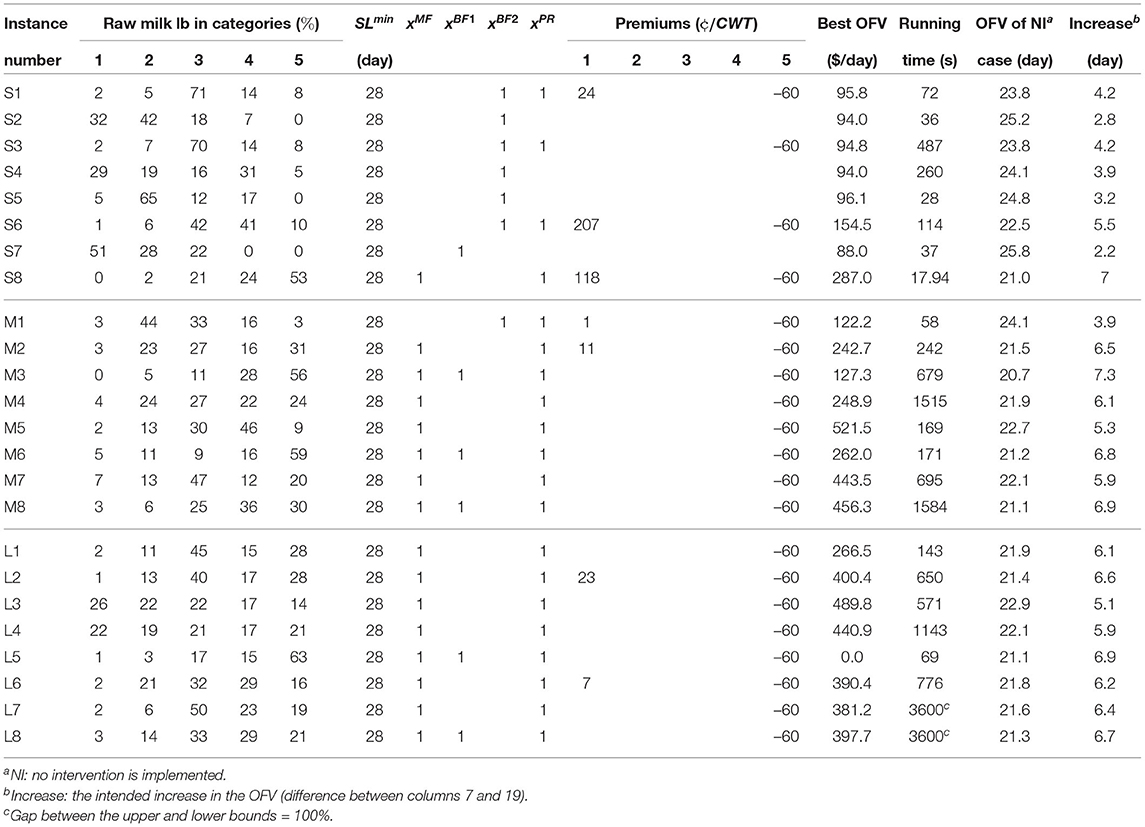
Table 9. Computational results - MPBOP model.
To reach the shelf-life of 28 days, small processors require to allocate between $94.0 and $287.0 per day. Not all of them are required to use the premium/penalty system but they all need to use at least one of the SRTs. The objective values for the medium and large processors, varies between $122.2–$521.5 per day and $0–$489.8 per day, respectively. They are all required to use the premium/penalty system and at least one of the SRTs. An interesting case in Table 9 is instance L5 which does not need to allocate any budget to extend its milk shelf-life to 28 days. Since they process a large volume of milk 63% of which is in category five, the money they gain through the penalties is enough for implementing SRTs.
Comparing the results between the two models, it is noticed that when maximizing the shelf-life, many of the medium and large processors use double-BF and never use single-BF while in MPBOP, single-BF is more popular, and double-BF is used mostly in smaller processing facilities. This is because the targeted shelf-life is 28 days and the processors do not demand the milk's shelf-life to be more; thus, they do not need to spend more on the second round of bactofugation to reach a lower level of spore counts. Another main difference between the two models is that premiums are paid less for categories 1-4 milk and in most of the cases, they are just used to penalize suppliers who produce milk in category five.
3.3. Sensitivity Analysis
In this subsection, we analyze the sensitivity of the two models to two important parameters. Table 10 shows the sensitivity of the MSLOP model to parameter PRmin and Table 11 shows the sensitivity of the MPBOP model to parameter SLmin.
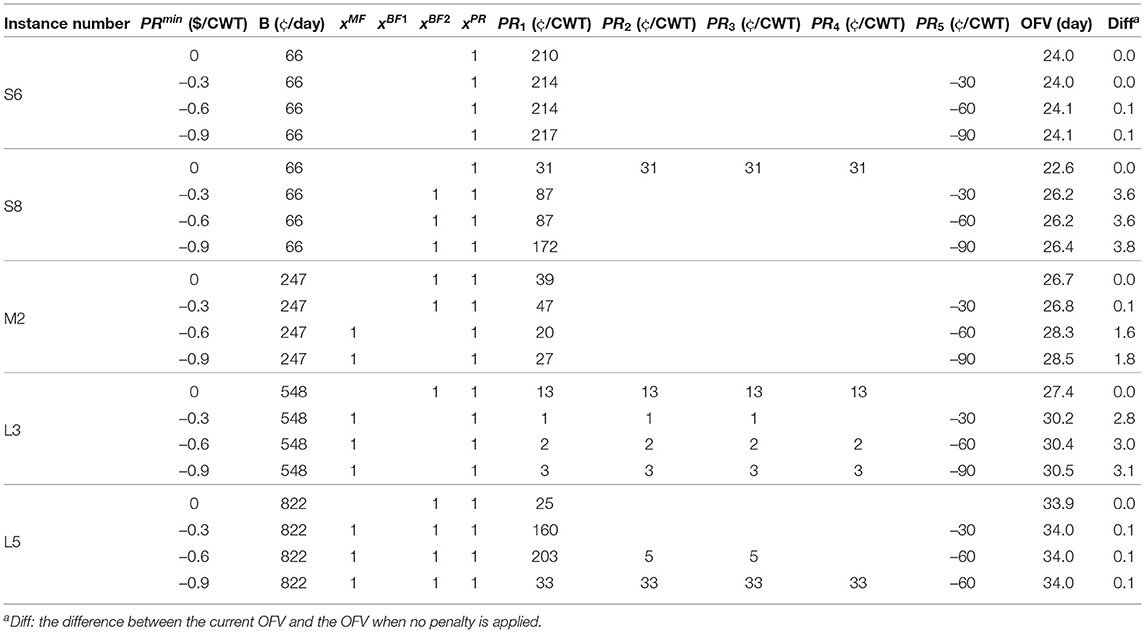
Table 10. MSLOP sensitivity to parameter PRmin.
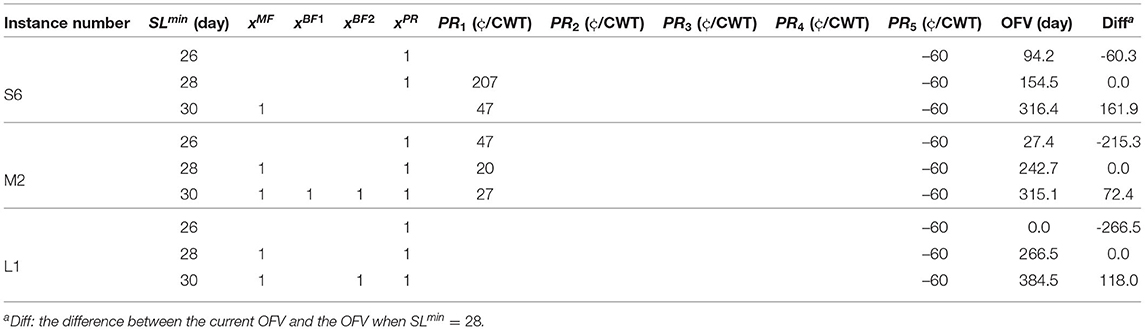
Table 11. MPBOP sensitivity to parameter SLmin.
We perform sensitivity analysis to examine the sensitivity of optimal solutions in MSLOP for the maximum allowable penalty, PRmin, since the total acquired penalty is proportional to parameter PRmin and the volume of milk processed. The former can be changed by the managers at the processing facilities in the MSLOP model; therefore, it can alter the best strategies in the optimal solutions for different problem sizes. We solve five instances S6, S8, M2, L3, and L5, described in section 2.3, for different values of PRmin (see Table 10). The five instances are solved with maximum penalties of $0, $0.3, $0.6, and $0.9 per 100 lb, shown in the second column of the table. The details of the optimal solutions and the effects of the changes in PRmin on the optimal objective values are shown in columns 4-13 and 14, respectively. Note that the percentages of raw milk in category five (which incurs a penalty) for these instances are 10, 53, 31, 14, and 63% for instances S6, S8, M2, L3, and L5, respectively.
Comparing the results for small instance S6, we conclude that applying penalties has a very small impact (i.e., up to 0.1 days) on the maximum weighted average shelf-life. This is because only 10% of the milk is in category five. However, the results for the second small instance, S8, is different since the majority (i.e., 53%) of its supplied milk represents the lowest quality category. Applying penalties for this instance improves the objective value between 3.6 and 3.8 days. This means that even if the total volume of processed milk is relatively low, the quality of milk plays an important role in applying penalties.
The impact of the penalty parameter is more significant for the medium-sized processor, M2. The maximum weighted average shelf-life shows that the optimal objective value will suffer 1.5 (= 28.3 − 26.8) days if the original maximum allowable penalty is cut in half (i.e., $0.6 to $0.3) and 1.6 days if the penalty is not applied. In both of these cases, the optimal solutions suggest implementing double-BF instead of MF and paying higher premiums. On the other hand, increasing the penalty by $0.3 per 100 lb only improves the objective value by 0.2 (= 28.5 − 28.3) days; this means applying more penalty does not always result in significant improvement in the shelf-life and the processors need to investigate the impacts of different levels of penalties with this model to decide what level of penalty works best for them without penalizing producers more than required.
We purposefully selected two different instances in categories of small and large processors from Table 6 so that we have two small and two large instances with a smaller percentage of low milk quality (i.e., S6 and L3) and two with a larger percentage of milk with low-quality (i.e., S8 and L5). In contrast with the two small instances, we observe different changes in the objective values for the two larger instances. L3, in which only 14% of milk in category five, benefits from applying penalties more than L5, which is supplied 63% by low-quality milk. Applying penalties for instance L5 can only increase the average shelf-life by 0.1 days whereas in L3, applying a small amount of penalty can improve the objective value by 2.8 days. This happens because the volume of milk processed by L5 is higher, hence they have assigned more budget to increase their shelf-life. The results for L5 show that it is not always the best action to penalize producers even when the majority of the supplied milk is in category five.
Overall, the sensitivity analysis of the maximum allowable penalty parameter shows that its impact is highly dependent on the quality of the supplied milk and the assigned budget by the processor which is relative to the total volume of processed milk.
In the MPBOP model, parameter SLmin, minimum shelf-life, defines the main limitation of the problem. Therefore, we perform sensitivity analysis for three instances, S6, M5, and L1, with three values of 26, 28, and 30 days for this parameter (see Table 11). The second column of the table shows the minimum shelf-life for each problem and the last column presents the difference in the objective value of each problem to that of the problem where SLmin = 28. The rest of the table is similar to Table 10.
As seen in this table, 2 days difference in the targeted shelf-life can have a significant impact on the amount of required budget. This difference varies for different processors. For example, if the processor in instance S6 decides to have a 26-day shelf-life, then they can spend $60.3 per day less compared to when they targeted 28 days of shelf-life. On the other hand, it will cost them an additional $161.9 to increase the shelf-life by 2 days. Therefore, the MPBOP model provides dairy processors a tool by which they can determine the increase in costs when aiming for a higher shelf-life compared to their product's current shelf-life. Such information would allow them to evaluate whether or not each day of shelf-life extension is profitable for them depending on their knowledge of how much additional income they can gain by each day of extension in the shelf-life.
3.4. Use of MSLOP and MPBOP Models Simultaneously
It should be noted that the models are meant to be used separately since they solve two different problems [i.e., when the processor has (i) a limited budget or (ii) a shelf-life threshold]. However, processors with limited budgets can also take advantage of both models simultaneously. In order to use both models, the processor would first use the MSLOP model to reach the optimal value of shelf-life they can obtain with their limited budget. Then, they feed the obtained optimal shelf-life value (or a rounded down value) as an input value to MPBOP model and see if they can reach that shelf-life threshold with a lower value of budget. Running both models for problem instances S6, S8, M2, L3, and L5, we found that larger processors who typically have higher budget values can take advantage of this and optimize interventions to reach the same shelf-life with a reduced budget. Among the five instances, only processor L5 could benefit from running both models. Instead of spending a budget of $822/day, processor L5 can spend $672.2/day to reach the same value of shelf-life (i.e., 34 days).
4. Discussion
In this study, we developed two models to facilitate decision-making for dairy processors. Specifically, the MSLOP model can be used to determine the maximum shelf-life that can be reached within a processor's defined budget (e.g., $100/day), whereas the MPBOP can be used to assess the minimum cost of reaching a set shelf-life target (e.g., 21-day shelf-life). In total, 24 case studies, varying by (i) processor size (i.e., small, medium, or large) and its annual lb. of milk processed, (ii) number of producers and the quality of milk they supply to the processors with respect to contamination with spores of Psychrotolerant bacteria, (iii) processor's budget for shelf-life improvement, and (iv) planning horizon (i.e., 5 or 10 years), were evaluated for both the MSLOP model and the MPBOP model, respectively (Table 6). Overall, our findings showed that the optimal solutions across the case studies appear to differ by processor size and are determined by the quality of raw milk with which processors are supplied, giving rise to processor-specific optimal combinations of the proposed premium/penalty system and SRT interventions. As such, the developed models provide a novel tool that will aid processors in the optimization of their pasteurized fluid milk's shelf-life.
4.1. Optimal Combinations of the Proposed Novel Premium/Penalty System and SRT Interventions Are Processor-Specific
Fluid milk processors who aim to extend product shelf-life need evidence-based solutions that are optimal for their raw milk supply and processing characteristics. Our previous studies have shown nearly 50% of HTST pasteurized fluid milk spoils due to sporeforming bacteria (Alles et al., 2018; Reichler et al., 2018); however, the reasons for spoilage vary within a facility across time and among products (Murphy et al., 2021). Our study specifically addresses needs of processors whose product is primarily spoiled by psychrotolerant sporeforming bacteria (i.e., not dealing with spoilage issues due to post-pasteurization contamination). Optimal solutions differed considerably between the small, medium and large processors (referred to in our models as “instances"), and they were the most diverse across the medium-sized processors.
Notably, our findings demonstrate that premium/penalty systems are often beneficial for processors targeting shelf-life extension through the reduction of spores in their raw milk. However, the optimal system to implement will depend on a number of processor-specific factors (e.g., expected quality of the raw milk supply, volume of milk processed, and available budget). Based on our findings, we recommend that fluid milk processors seeking to extend shelf-life by reducing spore levels in raw milk, consider implementation of premium/penalty systems based on raw milk spore count. Given this novel finding, it is necessary to discuss the value and potential implications of implementing a premium/penalty system for both processors and producers.
Previous studies support that premiums and penalties are used as a tool to motivate producers (e.g., Sargeant et al., 1998; Valeeva et al., 2007; Nightingale et al., 2008). While there are examples of premium payment systems for low-spore raw milk (Vissers et al., 2007a,b), the majority of studies evaluating aspects of quality-based premium payment programs for raw milk focus on somatic cell count (Sargeant et al., 1998; Nightingale et al., 2008; Botaro et al., 2013; Volpe et al., 2016). In practice, these systems may include only penalties for low-quality raw milk (Sargeant et al., 1998), only premiums for high-quality raw milk (Nightingale et al., 2008), or a combination of penalties and premiums (Botaro et al., 2013; Volpe et al., 2016). For example, Nightingale et al. (2008) evaluated the impact of a premium payment system implemented by a large United States milk cooperative, which paid producers a premium for supplying raw milk with a low somatic cell count (<100,000 cells/mL), and found that implementing premiums was effective in reducing mean somatic cell counts in overall raw milk supplied to the cooperative. Nightingale et al. (2008) also reported that only relatively high premium levels provided enough incentive for producers to lower somatic cell counts in their raw milk; thus, the authors recommended that a combined penalty and premium payment program would be most effective for motivating producers to strive toward reducing somatic cell counts in their raw milk. Considering our findings, the design of such a premium/penalty system based on spore levels in raw milk should be processor-specific. While penalties may provide motivation to producers, there also could be unforeseen consequences of such a system (e.g., potential for negative impact on producer-processor relationship), which should be considered. Importantly, our study showed that the impact of applying a penalty, as part of a premium/penalty system, will not always have a significant impact on shelf-life. Thus, prior to implementing a system that includes a penalty for low-quality raw milk, a processor should assess the potential impacts of different levels of penalties (e.g., using our MSLOP model) to decide the appropriate level of penalty that will benefit the processor while without penalizing producers more than is required. Overall, implementing a premium/penalty system may be relatively attainable especially for processors with restricted budgets below what is needed to implement an SRT. For an individual processor that considers implementing a premium/penalty system based on spore levels in their supplied raw milk, we recommend our models be used to assess the optimal design of this system to maximize the processor's budget (using the MPBOP model) and/or to achieve a target shelf-life (using the MSLOP model). It should be noted that for such processors, we recommend baseline spore levels of the incoming raw milk be determined (e.g., to be used as an input for expected raw milk quality in our models), prior to implementation.
Installing, operating, and maintaining SRTs are expensive (e.g., the purchasing cost of a MF unit is $1-2M); therefore, it can be challenging for processors to decide to implement an SRT in their facility. Our findings suggest that a processor aiming to greatly extend the shelf-life of their HTST fluid milk will need to invest in one or multiple SRTs in order to achieve the desired shelf-life. Again, it is important to emphasize that this finding only applies to processors with milk consistently spoiling due to sporeforming bacteria and not due to post-pasteurization contamination. In particular, for small processors, implementing a SRT is often not economically feasible and thus, providing a premium for the highest quality raw milk and/or a penalty for the lowest quality raw milk has been shown here a more affordable option in some cases. While not considered in our case studies, a processor may have reasons to invest in the SRT technologies that are not motivated by extension of their pasteurized milk shelf-life. For example, MF is used in cheese making to increase cheese yield and thus, increase profit (Papadatos et al., 2002). This means certain processors may already have a MF unit for other purposes. An advantage of our models is their capability of being customized for the processors who already implemented one of the SRTs. This means by changing the cost parameters and fixing the associated variables (e.g., xMF = 1 if they already implemented MF), they can address and assess their specific processing situation.
4.2. The Developed Models Provide a Novel Tool for Processors to Optimize Shelf-Life of Pasteurized Fluid Milk
Our study provides two novel mixed-integer linear programming models that can be used as decision support tools for dairy processors to set economically rational shelf-life targets for their final products. Importantly, our two MILP models are capable of providing decision support for individual dairy processors by applying processor-specific parameters. Thus, managers can use our models to reach their optimal strategies in regards to maximizing the weighted average shelf-life depending on their available budget (MSLOP) or minimizing their budget depending on their targeted weighted average shelf-life (MPBOP).
In contrast to our study, most optimization models developed for perishable agri-foods lack the consideration of the shelf-life aspect. For example, Papadatos et al. (2002, 2003) developed non-linear optimization models to investigate how MF can be used to increase cheese yield and increase the revenue without considering its impact on the shelf-life. Regarding agri-food planning models, Ahumada and Villalobos (2009) suggest shelf-life is often excluded from planning models because shelf-life features complicate the problem. Yet, it is obvious that shelf-life has major practical implications for the dairy industry and thus should be considered when developing models for perishable foods. As such, our models specifically focus on maximizing shelf-life that is directly influenced by microbial aspects of raw milk quality. It is well-established that a major cause of spoilage in many perishable foods is due to microorganisms. However, the majority of previous studies including optimization models targeting the shelf-life of dairy products (e.g., Lütke Entrup et al., 2005; Bilgen and Çelebi, 2013), such as studies focusing on how dairy products can gain the maximum profit by considering the operations scheduling, transportation, and distribution aspects of the milk supply chain, do not address the impact of microbial contamination on product shelf-life. For example, Lütke Entrup et al. (2005) developed a mathematical model that maximized the contribution margin considering a shelf-life-dependent pricing component in the yogurt supply chain, but did not address the impact of spoilage microorganisms on product shelf-life. Similarly, Bilgen and Çelebi (2013) optimized an integrated production scheduling and distribution planning for a yogurt supply chain and maximized the profit by taking into account the shelf-life-dependent pricing component and costs such as processing, storage, and transportation costs, but also did not consider the impact of microorganisms on product shelf-life. Thus, this paper presents a valuable foundational approach for studying optimization models for milk and other food supply chains in which microorganisms play a crucial role in diminishing the shelf-life and/quality of the food.
We acknowledge that there were limitations in defining the problem and parameterization of the models in this work. In particular, an intervention study is necessary to establish an understanding of the actual impact a premium/penalty system would have on the spore levels in raw milk at the processing level. Additionally, while the impact of individual MF and BF on spore levels in raw milk has been studied, the impact of combining MF and BF in a facility, needs to be investigated. It should be noted that the scope of our models was limited to the spore-forming bacteria in raw milk; however, our models could be adapted in the future to consider other spoilage microorganisms (e.g., whose source is contamination during processing). Also, due to the novelty of the proposed premium payment system, no suitable data were available for validation of that component of our optimization models. However, other components of our optimization models were based on synthesis of published data and models, including the Monte Carlo model that has been validated in Buehler et al. (2018). Additionally, as also mentioned in Section 2.3.2, our optimization models as presented in this study incorporated the output of predicted shelf-life of packaged milk from a Monte Carlo model (Buehler et al., 2018). The Monte Carlo model had limitations that, in turn, impacted our optimization models. Specifically, the Monte Carlo model had an assumption of constant storage temperature across the milk supply chain; version 2 of the Monte Carlo model, which is currently under development, will allow for modeling of temperature variation, which will in turn, allow for further development of our optimization models to include this feature. Finally, a more comprehensive model should be developed to consider the monetary impact of extension in the shelf-life, by considering shrinkage caused by the SRT units (which was omitted here) and evaluating the overall Return on Investment for shelf-life extension.
5. Conclusion
In this paper we propose a new raw milk premium/penalty system structure based on levels of psychrotolerant spores in raw milk, a microbiological agent which limits the shelf-life of conventionally pasteurized fluid milk products. Our novel approach, which combines microbiology and operations research in the form of two mixed-integer linear programming models is aimed at addressing these shelf-life limitations from the dairy processors' perspective. Using our models, processors of various sizes, with unique processing parameters and distinct raw milk supplies, will be able to optimize their available budgets to obtain shelf-life goals. These decision support tools will ultimately allow processors to reach new markets, improve distribution efficiencies and provide consumers with long-lasting, high quality dairy products. The future development of a user-friendly interface will facilitate more widespread use of these models.
Data Availability Statement
The raw data supporting the conclusions of this article will be made available by the authors, without undue reservation.
Author Contributions
RI and MW supervised the project and with FE-A defined the objective of the article. FE-A and NM collected information for the optimization model. SM coded the Monte Carlo model. FE-A developed, coded, and analyzed the optimization model and drafted the manuscript. All authors participated in the interpretation of results.
Funding
The research reported in this publication was supported by the Foundation for Food and Agriculture Research under award number – Grant ID: CA18-SS-0000000206. The content of this publication is solely the responsibility of the authors and does not necessarily represent the official views of the Foundation for Food and Agriculture Research.
Conflict of Interest
The authors declare that the research was conducted in the absence of any commercial or financial relationships that could be construed as a potential conflict of interest.
Acknowledgments
Authors would like to thank Dr. Negin Enayaty Ahangar, Dr. Carmen Moraru, Dr. Aaron Adalja, Dr. Aljosa Trmcic, Mr. Michael Phillips, our industry partners, and SRT companies' experts for assisting with model development and data parameterization.
Supplementary Material
The Supplementary Material for this article can be found online at: https://www.frontiersin.org/articles/10.3389/fsufs.2021.670029/full#supplementary-material
Abbreviations
BF, Bactofugation; CFU, Colony-forming units; HGP, Half-gallon package; HTST, High-temperature short-time; ISC, Initial spore count; MF, Microfiltration; MILP, Mixed-integer linear program; MPBOP, Milk processor budget optimization problem; MPN, Most probable number; MSLOP, Milk shelf-life optimization problem; OFV, Objective function value; SRT, Spore reduction technology.
References
AhmadBeygi, S., Cohn, A., and Weir, M. (2009). An integer programming approach to generating airline crew pairings. Comput. Oper. Res. 36, 1284–1298. doi: 10.1016/j.cor.2008.02.001
Ahumada, O., and Villalobos, J. R. (2009). Application of planning models in the agri-food supply chain: a review. Eur. J. Oper. Res. 196, 1–20. doi: 10.1016/j.ejor.2008.02.014
Alexander, M. (1983). Most probable number method for microbial populations. Methods Soil Anal. Chem. Microbiol. Propert. 9, 815–820. doi: 10.2134/agronmonogr9.2.2ed.c39
Alles, A. A., Wiedmann, M., and Martin, N. H. (2018). Rapid detection and characterization of postpasteurization contaminants in pasteurized fluid milk. J. Dairy Sci. 101, 7746–7756. doi: 10.3168/jds.2017-14216
Apaiah, R. K., and Hendrix, E. M. (2005). Design of a supply chain network for pea-based novel protein foods. J. Food Eng. 70, 383–391. doi: 10.1016/j.jfoodeng.2004.02.043
Bilgen, B., and Çelebi, Y. (2013). Integrated production scheduling and distribution planning in dairy supply chain by hybrid modelling. Ann. Oper. Res. 211, 55–82. doi: 10.1007/s10479-013-1415-3
Bishop, J., and White, C. (1986). Assessment of dairy product quality and potential shelf-life-a review. J. Food Protect. 49, 739–753. doi: 10.4315/0362-028X-49.9.739
Botaro, B. G., Gameiro, A. H., and Santos, M. V. D. (2013). Quality based payment program and milk quality in dairy cooperatives of southern brazil: an econometric analysis. Sci. Agricola 70, 21–26. doi: 10.1590/S0103-90162013000100004
Buehler, A., Martin, N., Boor, K., and Wiedmann, M. (2018). Psychrotolerant spore-former growth characterization for the development of a dairy spoilage predictive model. J. Dairy Sci. 101, 6964–6981. doi: 10.3168/jds.2018-14501
Buzby, J. C., Farah-Wells, H., and Hyman, J. (2014). The Estimated Amount, Value, and Calories of Postharvest Food Losses at the Retail and Consumer Levels in the United States. USDA-ERS Economic Information Bulletin, 121.
Carey, N., Murphy, S., Zadoks, R., and Boor, K. (2005). Shelf lives of pasteurized fluid milk products in new york state: a ten-year study. Food Protect. Trends 25, 102–113. Available online at: https://www.foodprotection.org/publications/food-protection-trends/archive/2005-02shelf-lives-of-pasteurized-fluidmilk-products-in-new-york-state-a-ten-year-study/; https://pubag.nal.usda.gov/catalog/3096923
Christiansson, A., Bertilsson, J., and Svensson, B. (1999). Bacillus cereus spores in raw milk: factors affecting the contamination of milk during the grazing period. J. Dairy Sci. 82, 305–314. doi: 10.3168/jds.S0022-0302(99)75237-9
de Keizer, M., Akkerman, R., Grunow, M., Bloemhof, J. M., Haijema, R., and van der Vorst, J. G. (2017). Logistics network design for perishable products with heterogeneous quality decay. Eur. J. Oper. Res. 262, 535–549. doi: 10.1016/j.ejor.2017.03.049
Doll, E. V., Scherer, S., and Wenning, M. (2017). Spoilage of microfiltered and pasteurized extended shelf life milk is mainly induced by psychrotolerant spore-forming bacteria that often originate from recontamination. Front. Microbiol. 8:135. doi: 10.3389/fmicb.2017.00135
Enayaty-Ahangar, F., Rainwater, C. E., and Sharkey, T. C. (2019). A logic-based decomposition approach for multi-period network interdiction models. Omega 87, 71–85. doi: 10.1016/j.omega.2018.08.006
Evanowski, R. L., Kent, D. J., Wiedmann, M., and Martin, N. H. (2020). Milking time hygiene interventions on dairy farms reduce spore counts in raw milk. J. Dairy Sci. 103, 4088–4099. doi: 10.3168/jds.2019-17499
Ferrer, J.-C., Mac Cawley, A., Maturana, S., Toloza, S., and Vera, J. (2008). An optimization approach for scheduling wine grape harvest operations. Int. J. Prod. Econ. 112, 985–999. doi: 10.1016/j.ijpe.2007.05.020
Frank, J., Yousef, A., Wehr, H., and Frank, J. (2004). Standard Methods for the Examination of Diary Product. Washington, DC: American Public Health Association.
Ghezavati, V., Hooshyar, S., and Tavakkoli-Moghaddam, R. (2017). A benders' decomposition algorithm for optimizing distribution of perishable products considering postharvest biological behavior in agri-food supply chain: a case study of tomato. Central Eur. J. Oper. Res. 25, 29–54. doi: 10.1007/s10100-015-0418-3
Glen, J. (1986). A linear programming model for an integrated crop and intensive beef production enterprise. J. Oper. Res. Soc. 37, 487–494. doi: 10.1057/jors.1986.83
Griep, E. R., Cheng, Y., and Moraru, C. I. (2018). Efficient removal of spores from skim milk using cold microfiltration: spore size and surface property considerations. J. Dairy Sci. 101, 9703–9713. doi: 10.3168/jds.2018-14888
Guerra, A., Jonsson, G., Rasmussen, A., Nielsen, E. W., and Edelsten, D. (1997). Low cross-flow velocity microfiltration of skim milk for removal of bacterial spores. Int. Dairy J. 7, 849–861. doi: 10.1016/S0958-6946(98)00009-0
Hall-Phillips, A., and Shah, P. (2017). Unclarity confusion and expiration date labels in the United States: a consumer perspective. J. Retail. Consum. Serv. 35, 118–126. doi: 10.1016/j.jretconser.2016.12.007
Higgins, A. J. (2002). Australian sugar mills optimize harvester rosters to improve production. Interfaces 32, 15–25. doi: 10.1287/inte.32.3.15.41
Huck, J. R., Woodcock, N. H., Ralyea, R. D., and Boor, K. J. (2007). Molecular subtyping and characterization of psychrotolerant endospore-forming bacteria in two new york state fluid milk processing systems. J. Food Protect. 70, 2354–2364. doi: 10.4315/0362-028X-70.10.2354
Hurt, E., Adams, M., and Barbano, D. (2015). Microfiltration of skim milk and modified skim milk using a 0.1-μm ceramic uniform transmembrane pressure system at temperatures of 50, 55, 60, and 65°c. J. Dairy Sci. 98, 765–780. doi: 10.3168/jds.2014-8775
International Dairy Food Association (n.d.). Pasteurization. Available online at: https://www.idfa.org/news-views/media-kits/milk/pasteurization (accessed June 2020).
Jabbarzare, Z., Zolfagharinia, H., and Najafi, M. (2019). Dynamic interdiction networks with applications in illicit supply chains. Omega 96:102069. doi: 10.1016/j.omega.2019.05.005
Jiao, Z., Higgins, A. J., and Prestwidge, D. B. (2005). An integrated statistical and optimisation approach to increasing sugar production within a mill region. Comput. Electron. Agric. 48, 170–181. doi: 10.1016/j.compag.2005.03.004
Lemma, Y., Kitaw, D., and Gatew, G. (2014). Loss in perishable food supply chain: an optimization approach literature review. Int. J. Sci. Eng. Res. 5, 302–311. Available online at: https://www.ijser.org/researchpaper/loss-in-perishable-food-supply-chain-an-optimization-approach-literaturereview.pdf; https://www.ijser.org/onlineResearchPaperViewer.aspx?Loss-in-Perishable-Food-Supply-Chain-An-Optimization-Approach-Literature-Review.pdf
Lütke Entrup, M., Günther, H.-O., Van Beek, P., Grunow, M., and Seiler, T. (2005). Mixed-integer linear programming approaches to shelf-life-integrated planning and scheduling in yoghurt production. Int. J. Prod. Res. 43, 5071–5100. doi: 10.1080/00207540500161068
Martin, N., Carey, N., Murphy, S., Wiedmann, M., and Boor, K. (2012). A decade of improvement: New York state fluid milk quality. J. Dairy Sci. 95, 7384–7390. doi: 10.3168/jds.2012-5767
Martin, N. H., Boor, K. J., and Wiedmann, M. (2018). Symposium review: effect of post-pasteurization contamination on fluid milk quality. J. Dairy Sci. 101, 861–870. doi: 10.3168/jds.2017-13339
Martin, N. H., Kent, D. J., Evanowski, R. L., Hrobuchak, T. J. Z., and Wiedmann, M. (2019). Bacterial spore levels in bulk tank raw milk are influenced by environmental and cow hygiene factors. J. Dairy Sci. 102, 9689–9701. doi: 10.3168/jds.2019-16304
Masiello, S., Kent, D., Martin, N., Schukken, Y., Wiedmann, M., and Boor, K. (2017). Longitudinal assessment of dairy farm management practices associated with the presence of psychrotolerant bacillales spores in bulk tank milk on 10 new york state dairy farms. J. Dairy Sci. 100, 8783–8795. doi: 10.3168/jds.2017-13139
Masiello, S., Martin, N., Watters, R., Galton, D., Schukken, Y., Wiedmann, M., and Boor, K. (2014). Identification of dairy farm management practices associated with the presence of psychrotolerant sporeformers in bulk tank milk. J. Dairy Sci. 97, 4083–4096. doi: 10.3168/jds.2014-7938
McDonald, C. M., and Karimi, I. A. (1997). Planning and scheduling of parallel semicontinuous processes. 1. production planning. Indus. Eng. Chem. Res. 36, 2691–2700. doi: 10.1021/ie960901+
McKinnon, C. H., and Pettipher, G. L. (1983). A survey of sources of heat-resistant bacteria in milk with particular reference to psychrotrophic spore-forming bacteria. J. Dairy Res. 50, 163–170. doi: 10.1017/S0022029900022962
Mehta, R. (1980). Milk processed at ultra-high-temperatures–a review. J. Food Protect. 43, 212–225. doi: 10.4315/0362-028X-43.3.212
Muir, D. D. (1996). The shelf-life of dairy products: 1. factors influencing raw milk and fresh products. Int. J. Dairy Technol. 49, 24–32. doi: 10.1111/j.1471-0307.1996.tb02616.x
Munch, D. M., Schmit, T. M., and Severson, R. M. (2020). Differences in Milk Payment Structures by Cooperative and Independent Handlers: An Examination from New York State. Ithaca, NY: Department of Applied Economics and Management, Cornell University. Available online at: https://dyson.cornell.edu/wp-content/uploads/sites/5/2020/06/WP_2020-03-Differences_in_Milk_Payment_-VD.pdf
Murphy, S. I., Reichler, S. J., Martin, N. H., Boor, K. J., and & Wiedmann, M. (2021). Machine learning and advanced statistical modeling can identify key quality management practices that affect postpasteurization contamination of fluid milk. J. Food Protect. doi: 10.4315/JFP-20-431
National Agricultural Statistics Service (2019). Census 2017 report - National Agricultural Statistics. Available online at: https://www.nass.usda.gov/Publications/AgCensus/2017/Full_Report/Volume_1,_Chapter_1_US/usv1.pdf
Nightingale, C., Dhuyvetter, K., Mitchell, R., and Schukken, Y. (2008). Influence of variable milk quality premiums on observed milk quality. J. Dairy Sci. 91, 1236–1244. doi: 10.3168/jds.2007-0609
Pafylias, I., Cheryan, M., Mehaia, M., and Saglam, N. (1996). Microfiltration of milk with ceramic membranes. Food Res. Int. 29, 141–146. doi: 10.1016/0963-9969(96)00007-5
Papadatos, A., Berger, A., Pratt, J., and Barbano, D. (2002). A nonlinear programming optimization model to maximize net revenue in cheese manufacture. J. Dairy Sci. 85, 2768–2785. doi: 10.3168/jds.S0022-0302(02)74364-6
Papadatos, A., Neocleous, M., Berger, A., and Barbano, D. (2003). Economic feasibility evaluation of microfiltration of milk prior to cheesemaking. J. Dairy Sci. 86, 1564–1577. doi: 10.3168/jds.S0022-0302(03)73742-4
Ranieri, M., and Boor, K. (2009). Bacterial ecology of high-temperature, short-time pasteurized milk processed in the United States. J. Dairy Sci. 92, 4833–4840. doi: 10.3168/jds.2009-2181
Reichler, S., Trmčić, A., Martin, N., Boor, K., and Wiedmann, M. (2018). Pseudomonas fluorescens group bacterial strains are responsible for repeat and sporadic postpasteurization contamination and reduced fluid milk shelf life. J. Dairy Sci. 101, 7780–7800. doi: 10.3168/jds.2018-14438
Rysstad, G., and Kolstad, J. (2006). Extended shelf life milk-advances in technology. Int. J. Dairy Technol. 59, 85–96. doi: 10.1111/j.1471-0307.2006.00247.x
Saenger, C., Qaim, M., Torero, M., and Viceisza, A. (2013). Contract farming and smallholder incentives to produce high quality: experimental evidence from the vietnamese dairy sector. Agric. Econ. 44, 297–308. doi: 10.1111/agec.12012
Sargeant, J. M., Schukken, Y. H., and Leslie, K. E. (1998). Ontario bulk milk somatic cell count reduction program: progress and outlook. J. Dairy Sci. 81, 1545–1554. doi: 10.3168/jds.S0022-0302(98)75720-0
Schroeter, C., Nicholson, C. F., and Meloy, M. G. (2016). Consumer valuation of organic and conventional milk: does shelf life matter? J. Food Distrib. Res. 47, 118–133. doi: 10.22004/ag.econ.250003. Available online at: https://ageconsearch.umn.edu/record/250003/
Sheikh-Zadeh, A., and Rossetti, M. D. (2020). Classification methods for problem size reduction in spare part provisioning. Int. J. Prod Econ. 219, 99–114. doi: 10.1016/j.ijpe.2019.05.011
Stoecker, A., Seidmann, A., and Lloyd, G. (1985). A linear dynamic programming approach to irrigation system management with depleting groundwater. Manage. Sci. 31, 422–434. doi: 10.1287/mnsc.31.4.422
U.S. Energy Information Administration (2019). Electric Power Monthly with Data for November 2019. Available online at: https://www.eia.gov/electricity/monthly/epm_table_grapher.php?t=epmt_5_3
United States Department of Agriculture (1996). Farmers' Use of Marketing and Production Contracts. Available online at: https://www.ers.usda.gov/webdocs/publications/40764/18614_aer747a_1_.pdf?v=41063 (accessed November, 2020).
United States Department of Agriculture (2014). The Estimated Amount, Value, and Calories of Postharvest Food Losses at the Retail and Consumer Levels in the United States. Available online at: https://www.ers.usda.gov/webdocs/publications/43833/43680_eib121.pdf
United States Department of Agriculture (2019). Milk Production. Available online at: https://www.nass.usda.gov/Publications/Todays_Reports/reports/mkpr0819.pdf
Valeeva, N., Lam, T., and Hogeveen, H. (2007). Motivation of dairy farmers to improve mastitis management. J. Dairy Sci. 90, 4466–4477. doi: 10.3168/jds.2007-0095
Vissers, M., Driehuis, F., Te Giffel, M., De Jong, P., and Lankveld, J. (2007a). Minimizing the level of butyric acid bacteria spores in farm tank milk. J. Dairy Sci. 90, 3278–3285. doi: 10.3168/jds.2006-798
Vissers, M., Te Giffel, M., Driehuis, F., De Jong, P., and Lankveld, J. (2007b). Minimizing the level of Bacillus cereus spores in farm tank milk. J. Dairy Sci. 90, 3286–3293. doi: 10.3168/jds.2006-873
Volpe, R. J., Park, T. A., Dong, F., and Jensen, H. H. (2016). Somatic cell counts in dairy marketing: quantile regression for count data. Eur. Rev. Agric. Econ. 43, 331–358. doi: 10.1093/erae/jbv021
Keywords: dairy supply chain, pasteurized fluid milk, microbial spoilage, premium/penalty system, optimization, mixed-integer linear programming
Citation: Enayaty-Ahangar F, Murphy SI, Martin NH, Wiedmann M and Ivanek R (2021) Optimizing Pasteurized Fluid Milk Shelf-Life Through Microbial Spoilage Reduction. Front. Sustain. Food Syst. 5:670029. doi: 10.3389/fsufs.2021.670029
Received: 20 February 2021; Accepted: 06 April 2021;
Published: 08 July 2021.
Edited by:
Santanu Basu, Swedish University of Agricultural Sciences, SwedenReviewed by:
Veronica Ortiz Alvarenga, Federal University of Minas Gerais, BrazilGuadalupe Virginia Nevárez-Moorillón, Autonomous University of Chihuahua, Mexico
Copyright © 2021 Enayaty-Ahangar, Murphy, Martin, Wiedmann and Ivanek. This is an open-access article distributed under the terms of the Creative Commons Attribution License (CC BY). The use, distribution or reproduction in other forums is permitted, provided the original author(s) and the copyright owner(s) are credited and that the original publication in this journal is cited, in accordance with accepted academic practice. No use, distribution or reproduction is permitted which does not comply with these terms.
*Correspondence: Forough Enayaty-Ahangar, forough.enayaty@cornell.edu