A malleable workflow for identifying the issues and indicators that define and measure sustainability in food systems
 Nathaniel P. Springer
 Allan D. Hollander
 Patrick R. Huber
 Courtney Riggle2
  Thomas P. Tomich
- 1Institute on the Environment, University of Minnesota, St. Paul, MN, United States
- 2Department of Environmental Science and Policy, University of California Davis, Davis, CA, United States
A variety of stakeholders are concerned with many issues regarding the sustainability of our complex global food system. Yet navigating and comparing the plethora of issues and indicators across scales, commodities, and regions can be daunting, particularly for different communities of practice with diverse goals, perspectives, and decision-making workflows. This study presents a malleable workflow to help different stakeholder groups identify the issues and indicators that define food system sustainability for their particular use case. By making information used in such workflows semantically-consistent, the output from each unique case can be easily compared and contrasted across domains, contributing to both a deeper and broader understanding of what issues and indicators define a resilient global food system.
Defining and measuring sustainable food systems: A historical context
The landmark definition of sustainable development set forth in the Brundtland Report more than three decades ago—“development that meets the needs of the present without compromising the ability of future generations to meet their own needs”—has helped to solidify the concept of sustainability as a necessary and worthwhile policy goal (Brundtland, 1987). Yet practically, this definition provides little tangible guidance for comprehensively defining and measuring sustainability—in this case in the context of global food systems—and has been the source of much debate in subsequent decades (Dixon and Fallon, 1989; Howarth, 1997; Connelly, 2007).
First, sustainability is a multi-dimensional concept that crosses the traditional institutional boundaries that commonly divide economic, social, and environmental spheres, leading to characterizations of sustainable food systems that are often one-dimensional, or partial to one sphere over others. Definitions of sustainability stemming from economic foundations are derived from concepts of maintaining the discounted capital stock for future generations (Hotelling, 1931; Dasgupta and Heal, 1974) in attempts to maintain intergenerational wealth over long periods of time (Solow, 1974; Hamilton, 1999; Dasgupta, 2007a). This foundational research has led to the expansion of the concept of capital to include other forms such as natural and social capital, assuring that wealth in the form of ecosystem services, natural resource stocks, knowledge, and social institutions can be included as well (Pearce, 1988; Goodland, 1995; Dasgupta, 2007b). Such work has led to further criticism of those defining sustainability from primarily one-dimension, such as the common approach of using traditional economic indicators of human welfare (Hamilton, 1994; Bell and Morse, 1999; Ayres et al., 2001) or the lack of focus on important human, social, and political dimensions such as poverty, public health, women's rights, property rights, and governance (Chambers and Conway, 1992; Sen, 1997; Bebbington, 1999; Scoones, 2009). Fortunately, global sustainability assessments include issues from all of these dimensions in setting goals, benchmarking indicators, and suggesting strategies (Millennium Ecosystem Assessment, 2005; UN, 2008). Springer et al. (2015) looked at a number of sustainability communications from a variety of sources and found that the degree of focus on these different sustainability categories can vary greatly depending on one's perspective and specific focus.
This multi-dimensionality becomes even more complex when one considers the possible conceptual frameworks that may link issues together and highlight those of particular importance. For instance, one framework for assessing the importance of particular issues is to isolate the issues that are directly impacted by a particular action or strategy (Millennium Ecosystem Assessment, 2003; Tomich et al., 2010; Brown et al., 2015). On the other hand, a corollary framework for assessment could isolate those issues that impact a particular system of interest, such as a supply chain. In other words, this second framework conceptualizes sustainability as the reduction of one's vulnerability and the growth of one's resilience or adaptive capacity to any given variable, either directly or indirectly due to a reaction within the system of relationships (Folke et al., 2002; Turner et al., 2003; Perrings, 2006; Seekell et al., 2017). This includes consistent ways to measure the resiliency of sustainable food systems, which we see as the “capacity over time of a food system and its units at multiple levels, to provide sufficient, appropriate and accessible food to all, in the face of various and even unforeseen disturbances” (Tendall et al., 2015). For instance, considering climate change: under the first framework, one should adopt a strategy to reduce one's impact by mitigating emissions (IPCC, 2014b) while under the second framework one may choose to increase resilience by adopting a new technology that is more adaptable to possible climate variations (IPCC, 2014a). Frameworks can also embed both impacts and resilience components simultaneously (Beddington et al., 2012; Garnett, 2013).
Sustainability is also a multi-scale concept that must be defined and measured at various scopes from local to global levels of spatial resolution and decade to century levels of temporal resolution (Ostrom et al., 1999; Scholes et al., 2010). Multi-scale measurement is particularly relevant for food systems since globalization has increased the connectivity across the globe related to sourcing, processing, transport and storage, and consumption demands (Brown et al., 2015; Seekell et al., 2018). The issues that are important and how they are accurately and usefully measured may differ substantially depending on these scales and scopes. For instance, sustainability defined at a broad scale and scope may result in more macro-indicators at the national policy level (Millennium Ecosystem Assessment, 2005; UN, 2008) while sustainability defined at a specific location may result in more detailed indicators at the individual or community level (Stewardship Index for Specialty Crops, 2011; COSA, 2012). Inclusion of multiple scales and scopes becomes even more difficult if the chosen conceptual frameworks include driving forces that span both local and global systems, such as ecosystem management or technological change (Scholes et al., 2010; Brown et al., 2015).
Furthermore, achieving a sustainable global food system requires input, buy-in, and coordination from a vast array of stakeholders—public and private, profit and non-profit, consumer and producer, owner and worker, poor and rich—to successfully agree on issues, choose indicators, collect data, develop strategies, implement projects, improve practices, and ultimately achieve a sustainable path forward (Pretty, 1995; Cash et al., 2003; van Kerkhoff and Lebel, 2006; Beddington et al., 2012). Defining and measuring sustainable food systems, therefore, must be an inclusive, “bottom-up” effort that allows all interested parties to provide input. Evidence shows that the “co-creation” of transdisciplinary research and conceptual frameworks can improve credibility, relevance, and legitimacy, ultimately helping overcome traditional social and political boundaries, and improving the chances of strategy implementation (Ostrom et al., 1999; Lucas et al., 2010; Clark et al., 2011).
The necessity of an inclusive and comprehensive approach also becomes apparent when one considers the volume of potential tradeoffs between issues that must be considered. For instance, if a strategy is implemented to address a specific set of important issues, this strategy may have unintended and adverse effects on other issues not within the scope of the framework considered. Such results are especially relevant for non-linear, complex systems where socioeconomic and ecological drivers can interact to produce tipping points and emergent properties that affect the system in unintentional and unforeseen ways (Costanza et al., 1993; Beisner et al., 2003; Dasgupta and Mäler, 2004).
As a result of these complexities, many within the sustainability community have promoted multi-criteria decision-support tools that allow groups of stakeholders to address multiple, orthogonal objectives simultaneously to more comprehensively assess issue tradeoffs (Keeney and Raiffa, 1976; Romero and Rehman, 1987; Zander and Kächele, 1999; Munda, 2005). For instance, researchers within the integrated assessment community attempt to achieve a more comprehensive assessment of sustainability impacts by linking planning and scenario models across the natural and social sciences, allowing them to assess multiple, often incongruent issues simultaneously (Lotze-Campen, 2008; Tschakert et al., 2008; Rosenzweig et al., 2013). Still, such modeling efforts are often integrated to assess a few important issues—such as the impacts of climate or nutritional status—and are not set in the context of a larger conceptual framework that includes the comprehensive set of sustainability issues and tradeoffs one could potentially consider (van der Linden et al., 2020).
Each one of these challenges can lead to incongruities between issue and indicator sets that are used by various stakeholders to define and measure sustainability for any particular context, and these incongruities can deepen since our understanding of sustainable food system issues is not static. Our information base is constantly advancing and changing, even for established issues such as water scarcity or poverty. New issues arise as other issues are addressed, and the definition of sustainable food systems must be flexible enough to deal with this dynamic foundation. Although indicator sets and indices have been proposed to define and measure food policy goals such as increased food security various contexts (The Economist, 2013), these remain specific to scales, scopes, and communities of practice. Lacking is a consistent template for formalizing decision workflows for selecting this information to not only assure completeness, but allows information to be linked and shared across different communities of practice (Olde et al., 2016).
To address these questions about the definition and measurement of sustainable food systems—and present some insight into possible solutions—this paper presents a malleable workflow to define stakeholder-specific definitions that can be linked together to enhance both local and global definitions of concepts such as sustainability and food security. This workflow template, here called the “checklist generator” workflow, is comprised of a set of tools that can be used define and measure sustainable food systems for any specific stakeholder group, particularly in a way that transparently (1) engages the different communities of practice (CoP) involved, (2) captures and clarifies key information (3) ensures completeness while reducing dimensionality (or ensuring complete coverage of all issues while reducing dimensionality in the number of indicators needed to measure them). The purpose of this process is to give stakeholders the ability to interface with a consistent and transparent network of sustainability information and iteratively select issues and indicators that measure progress toward increasingly sustainable practices.
We present three hypothetical examples to illustrate how different workflows can arise from different applications of this system of tools. To show the diversity of potential outcomes, each of the three examples typifies an archetypal community of practice: a food company, a global government organization, and a regional government planning board. Unique checklist generator workflows may be derived at different temporal and spatial scales, from a disparate set of actors, and have widely different goals; yet the outcomes of these workflows can be compared to enhance our understanding of sustainable food systems across regions, scales, and commodities.
Three key aspects needed for a successful checklist generator workflow
Stakeholder engagement across communities of practice
Many different communities of practice (CoP) are part of the global food system, including farmers, traders, food producers, policymakers, educators, and researchers. Opinions about which issues matter differ both within and across communities, yet each community has specific norms and concepts for thinking about the impacts of their decisions and the impacts of other's decisions on them. Trying to choose and agree on the sustainability issues that matter and ways of measuring them is difficult to negotiate within a CoP, and become even more difficult when multiple CoP are involved in stakeholder groups. Characterizations of the sustainability of food systems that are partial to one community of practice over another may serve a specific function, but can be problematic for ensuring participation in a broader strategy.
A checklist generator workflow that allows different CoP to identify a recognizable set of issues and indicators in parallel with other stakeholders would allow the results of the studies to be interoperable, no matter the commodity, region, or language. The power of interoperability of sustainability issues such as food security will inform the next group of stakeholders through the use of indicators, data, and results, as well as increase transparency of previous stakeholder's progress. New knowledge generated through scientific research, cultural exchange, social development, and practical experience is constantly revealing new issues as other issues are addressed. Consistent approaches to identify sustainability issues of importance and indicators to measure them must be flexible enough to incorporate emerging issues, insights, and data sources (Springer et al., 2015).
Semantics and organization of food system information
Although the multitude of available information on food system sustainability gives stakeholders many ways to define and measure important issues, a central challenge becomes finding, sorting, and choosing key pieces of information that fit the perspective of the communities of practice involved in a given case. Previous work (Springer et al., 2015) presents an information strategy for doing this, organizing the extensive amount of sustainability information from different CoP into a network of semantically consistent sustainability issues and indicators. The database that resulted from this work contains 44 “integrated” sustainability issues, along with 318 more specific “component” sustainability issues, that are linked with a network of 2,000+ sustainability indicators that have been used to measure them in various contexts.
Although this proof-of-concept database is large and fairly comprehensive, in reality it must be connected to broader networks of information to be truly useful. Using controlled vocabularies, like FAO AGROVOC or CABI (Caracciolo et al., 2013; CABI, 2014), can give stakeholder groups flexibility to do this in real time: new issues can be added; new links made to existing issues; new indicators can be searched for, updated, or changed; and new ontological relationships between issues and indictors can be made. The malleability of this Semantic Web of food sustainability information will be necessary for most use cases, and hence this open, linked-data framework will be essential for interoperability within and across communities of practice.
Completeness and reducing dimensionality
Utilizing a semantically linked network described above can ensure that stakeholders have access to a dynamic, global set of indicators and issues and have the ability to communicate across CoP. Yet a useful workflow must help stakeholder groups sort through this global network for the issues and indicators that will be most useful for their group, while simultaneously ensuring (1) completeness in access and consideration of potential issues and indicators (2) reduced dimensionality of chosen issues of material importance to their use case and (3) reduced dimensionality of the set of indicators that can still completely represent all material issues. On one hand, it is unrealistic and unnecessary to track the global set of indicators in each case; on the other, determining material issues and indicators in isolation creates barriers for communication, and it would be beneficial for any issues and indicators chosen to be recognizable and used by the broader community, and also ideally by other stakeholder groups working on similar lists of issues, commodities, and regions. By using sets of information that are semantically linked to all other CoP, one can help assure completeness by accessing the broadest set of possible issues and indicators available. And if issues and indicators could be compared across different stakeholder groups and CoP, the sustainability community as a whole could begin to more comprehensively address questions such as:
- Is there a minimum set of sustainability issues that comprehensively address the complexity of global food systems across all frameworks and contexts?
- What are the key differences across scales, scopes, sectors, commodities, etc.?
- If there are common issues addressed across communities of practice, what indicators should be used to measure progress on each issue and how much similarity do they have across contexts?
Methods: The checklist generator workflow
We present a malleable workflow that addresses these three aspects of CoP engagement, semantics, and completeness by allowing stakeholders to interface with a transparent network of information and iteratively select issues and indicators that makes sense for their use case. Such a workflow has been successful in the conservation community at creating “best-practice” decision-support systems for conservation projects (The Conservation Measures Partnership, 2013). Information technology tools such as MIRADI (https://miradi.org/) help conservation partners develop boundaries, measurements, goals, and strategies for specific uses that can be shared across user groups without a loss of generality. The workflow presented here provides the basis for a similar decision-support and negotiation-support (Van Noordwijk et al., 2001; Clark et al., 2011) platform within the food system sustainability community, helping stakeholders align the issues, indicators, and strategies they will address, track, and implement, thereby improving chances of success. In Figure 1, this workflow fits within the decision and negotiation support boxes for multiple communities of expertise (two boxes on bottom-right).
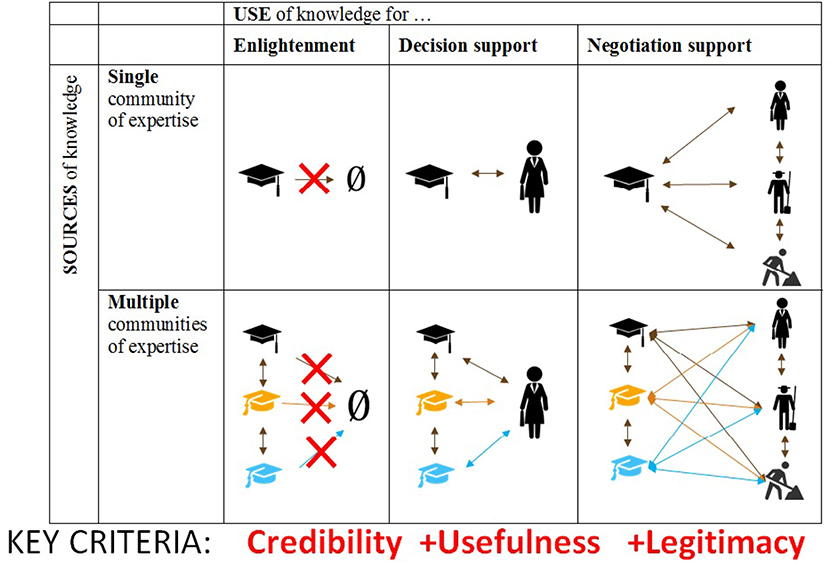
Figure 1. The checklist generator workflow is both a decision support and negotiation support tool, ideal for navigating multiple communities of practice (middle-bottom and bottom-right squares). Figure modified from earlier version published. Source: From Clark et al. (2011).
The checklist generator building blocks
To describe the malleable workflow that can achieve these three aspects of CoP engagement, semantics, and completeness, we need to first define the base set of information and tools that can be used to design a workflow: a group of decisions makers, a graph database, a minimum covering set algorithm, and a software interface.
Group of decision makers
The first requirement is to agree upon a set of actors that will be included. Ideally, this would be a stakeholder group representing the key players within the region and commodity to be addressed. But this group could also be a single institution, such as a company or government agency.
Graph database
The next requirement is an information set, in the form of a graph database with a semantically linked ontology which as the very least requires an overarching set of issues, possible indicators for measuring them, and how each indicator can be used to measure each issue (see Supplementary material for information about this type of data format). For instance, the dataset developed by Springer et al. (2015) provides a set of indicators linked to the issues that they can provide information about. Additional or different datasets could be used as long as they define, for both issues and indicators, the three pieces of the triplestore structure (subject, predicate, object) that make up a semantically-enabled graph database.
Additional information can be specified to help give context to this network of issues and indictors and assist in the selection process. For instance, the dataset developed by Springer et al. (2015) specifies relationships between overarching “integrated” issues and more specific “component” issues to give users more nuance in selecting issues. One could develop a more detailed ontology that adds more specific relationships (predicates) between issues and indicators, and even add new “classes” of subjects and object beyond these two categories, such as spatial data, goals, and strategies. One could even expand the information set to the global Semantic Web of information using defined ontologies and controlled vocabularies used to extract the relevant information for a specific case.
Minimum covering set algorithm
A central tool for ensuring completeness while reducing dimensionality is a minimum covering set (MCS) algorithm. Such an algorithm uses the information provided in the graph database, such as the one presented in Springer et al. (2015), and selects the minimum set of indicators required to represent the issues selected in step two (Huber et al., 2015). Different algorithms can be used to solve the MCS problem, each with distinct advantages as well as computational requirements. The algorithm used by Huber et al. (2015) is based upon the conservation planning tool MARXAN and has its own distinct advantages.
Another more efficient option utilizes the integer programming (IP) method (Balinski and Quandt, 1964), which can be applied in this case to minimize the number of indicators while ensuring that all selected issues are covered by at least one indicator. The IP approach is computationally faster and hence allows users to revise inputs in real time and calculate many different outputs. The IP approach also allows us to add additional constraints to help users in the selection process. For instance, we add a constraint that allows users to define important attributes and then ensure that the selected indicators have these particular attributes such as units, frameworks (measure “impacts” and/or “vulnerability”), or sustainability types (environmental, social, political, physical, financial, and human).
The details of this IP algorithm are described in the Supplementary material, including how to use the graph database as the algorithm input, how to define and select issue and indicator attributes that are required in the minimum set, and how to access open source code and data for running the MCS algorithm.
User interface
This tool allows users to iteratively adjust and modify the graph database and MCS algorithm inputs and outputs, both immediately during the selection process and over time during long-term progress tracking and information updating.
The “front-end” of this application is an user interface that allows users to view the data and run the MCS algorithm. It presents the graph database as lists of issues and indicators, which can then be “checked” on or off depending on the relevance of each issue or indicator to their specific context. The user can then click a button to run the MCS algorithm, view a list of the indicators that cover the issues and attributes they selected, and further adjust the indicator set based on the suggested output. A prototype of this software has been created using R-Shiny, see Supporting Information for details.
The “back-end” of this application allows users to interface with the graph database, adding information and adjusting ontological relationships. This capability is essential for users who may want to use an existing database, such as the one presented in Springer et al. (2015) but want to adjust and update the issues, indicators, and relationships to better fit their use case. Such an interface is useful in transparency and sharing information, as will be considered further in the discussion. A prototype of this interface has been created, see Supplementary material for details.
Checklist generator workflow key steps
These four building blocks are used alongside four key steps to create a checklist generator workflow that produces a manageable set of issues and indicators (Figure 2). Each checklist generator workflow can be unique, and the following four key steps are not exhaustive or in any particular order. But these pieces will be central aspects of helping each stakeholder group define and measure food system sustainability for their particular context.
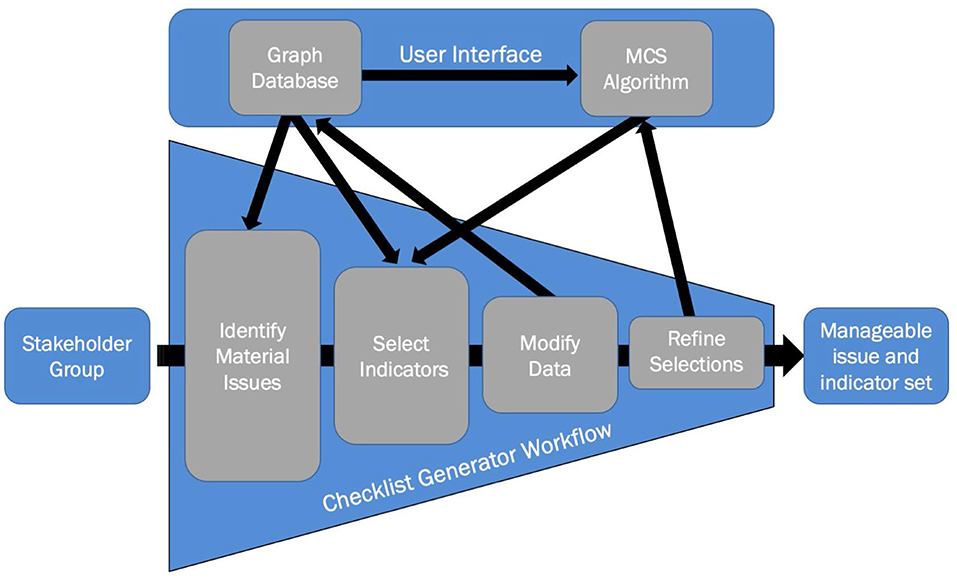
Figure 2. Process map connecting the four key steps in the checklist generator workflow with the four checklist generator “building blocks.”
Identify material issues
Here, users select the specific issues that are relevant for their use case from the standardized and organized list of all possible sustainability issues. This can be as heuristic as choosing a few important issues through discussion with the group, straightforward as using the entire issue set, practical as using a set defined by another group, or detailed as systematic consideration of each issue in the database to assesses its relevancy to the chosen region, commodity, and framework. The subset of issues that result from this step defines the food system sustainability boundaries for that particular group.
Select indicators
In this step, users select the indicators they will use to measure their material issues. The MCS algorithm and interface is essential here, ensuring completeness of issue coverage but also assisting stakeholder in identifying overlaps and efficiently building possible sets. Users may select some indicators upfront, “lock-in” good indicators that the MCS tool selects, or eliminate those that stakeholders cannot agree upon or don't makes sense. The tool can be run as many times as necessary with different iterations to help stakeholders agree on the most useful set for their case.
Modify data
After going through the issue list, stakeholders may feel that there is an issue missing they want to add. Or maybe the group creates a conceptual framework to define issues that drive change within their particular food system boundaries. Such changes and additions can be made to the “back end” interface to the graph database at any time during the workflow process.
Refine selections using attributes
If members of the stakeholder group have certain qualifications that must be met, these can be specified different points in the workflow. For instance, if members agree that data must be available for the study area of all indicators chosen, this can be selected using the MCS tool and any indicators that don't specify this data are removed from the choice set.
Three “checklist generator” workflow examples
To illustrate these steps and how these tools can be applied in unique ways for different use cases, we present three different stories that show how the checklist generator workflow could unfold. The main goal of presenting three different hypothetical cases is to show how this workflow is malleable depending on the specific commodity and region, as well as the goals of the stakeholders involved. Note that these stories are only illustrative of our workflow template and do not represent outcomes of real cases.
A multi-national private food company
Consider a global food production company deciding how to define and measure the vulnerability of their peanuts sourcing networks in Nigeria. The stakeholders in this case are limited to people within the company itself. Say the company has historically tracked some key environmental impacts of their sourcing operations around the world, but now some stakeholders have become concerned about the long-term economic, social, and environmental vulnerability of the company, as well as the vulnerability of the network of producers and traders they depend upon. The company realize that their previous efforts to assess their sustainability impacts have been criticized for not being comprehensive, but are unsure how achieve comprehensiveness while maintaining conciseness. For a database, they decide to use the existing Springer et al. (2015) database, as they want to consider all possible vulnerability issues to peanut sourcing, including those not directly important to the company. From the 36 vulnerability issues in the database, the stakeholders select a subset of 24 issues directly relevant to peanut sourcing in Nigeria. From this dataset, they start the indicator selection step with a list of seven issues they are already addressing and 10 indicators they are using to measure them (Figure 3A). Three of these 10 indicators are not in the database, so before running the MCS tool these indicators are added using the back-end interface, and the stakeholders form the linkages to issues, ensuring that each linkage comes from a scientifically-validated, context-specific source. They use the front-end interface to select the remaining 17 issues as well as the 10 indicators they already use.
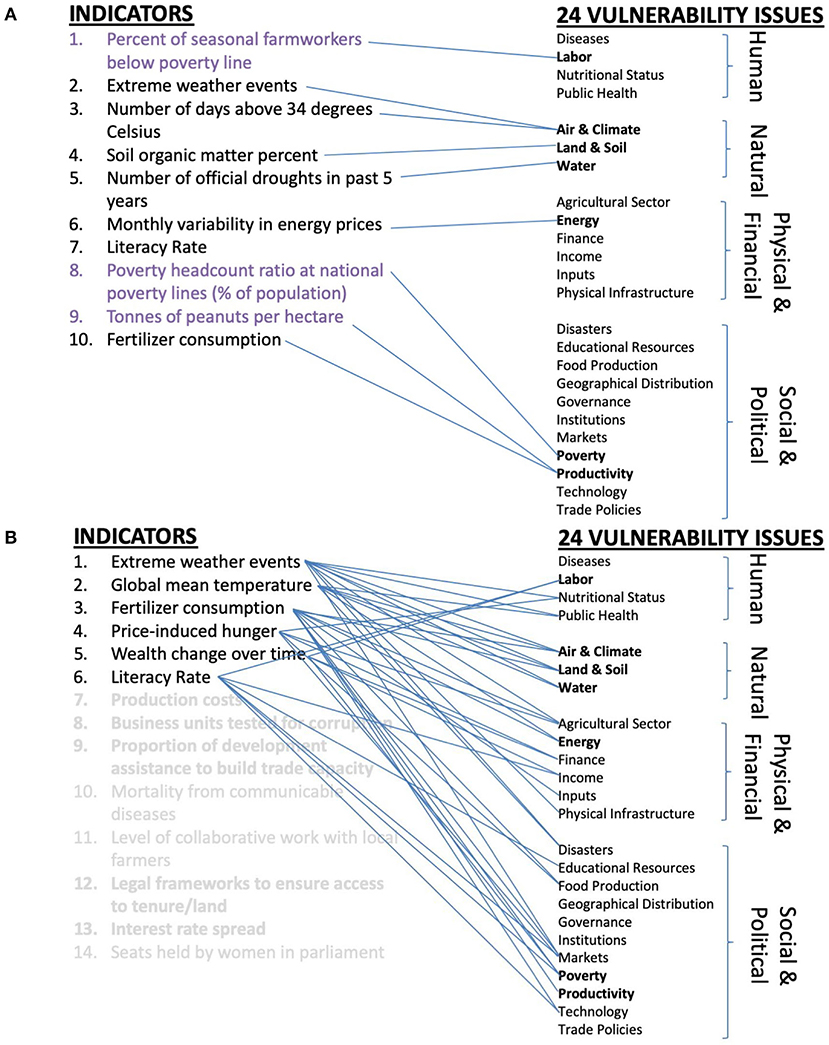
Figure 3. Beginning of checklist generator process in Case 1 with ten indicators covering seven issues (A) compared to end of checklist generator process with six indicators covering 80% of the 24 relevant vulnerability issues (B). Indicators highlighted purple are the three indicators added to the graph database by the stakeholder group, bolded issues are the initial issues covered by the food company, and the grayed-out indicators are those covering the remaining 20% of issues.
They now run the MCS algorithm, which identifies a set of indicators that represents all the vulnerability issues. Yet some of these indicators don't fit their goals, and so they eliminate them from the set and run the MCS algorithm again. This process is iterative until they arrive at an indicator set of 14 indicators that cover all 24 issues.
Upon further discussion, they decide the indicator set it too large and they can't afford to collect data and track that many indicators. As a way to shrink the set, they use the graph database to see how many issues they can cover with a smaller set of indicators. They find that they can cover 80% of the issues with only six of the selected indicators, recognizing the need to address the other eight in the long term to address the remaining 20% of issues (Figure 3B).
A global government environmental organization
Consider a global initiative has spent the past 4 years creating a large set of indicators to measure and track categories of issues that are matched with a set of long-term policy goals. These goals have been formulated to track improvements to the sustainability of food systems around the world. These goals are matched up with issue categories, which are then measured by unique indicators. Yet the group has chosen over 100 indicators to represent their issues and goals, and they have received feedback from the public to reduce the number of indicators. Still, the organization does not want to compromise the number of issues or goals they have chosen, for they want to be comprehensive in their definition of sustainable food systems.
The stakeholder group in this case includes not only the organization but any stakeholder interested in the selection of goals, issues, and indicators. The dataset is their own set of issues and indicators, which they enter into the graph database using the back-end interface. Yet since each issue is measured by a unique indicator, there is no way to reduce the size of the indicator set unless they allow each indicator to represent more than one issue. They therefore decide to “recode” the links between issue and indicators using the back-end interface, looking at each indicator and making a link to every issue that it can be used to measure.
Once this relinking is done, they use the front-end interface to eliminate all issues and indicators except their set, and then run the MCS algorithm. Although this is the minimum set, a few stakeholders protest that some very important indicators have been eliminated, and so there is a negotiation about which ones should be added back in and before the MCS algorithm is run one more time. This set, although a few indicators above the minimum set, includes far fewer indicators than the original set, and the stakeholders agree to use this more efficient outcome.
A local government land planning board
Consider a region with a local economy mainly driven by agriculture. The municipal government in this region is concerned about the potential sustainability impact of their nascent long-term land use plan on the local food system. The planning is done by the local committees and consultants but the decisions are made by the regional planning board. The board has the key issues selected and approved, which are limited to mainly environmental issues but also a few social issues, and want input on choosing indicators (with existing data) to measure sustainability impacts of three alternative land development strategies they could implement during the next 20 years.
The stakeholder group is mainly the board, but there is some negotiation that must happen with the committees and consultants. The graph database is limited to the issues they have already defined, but requires indicators to be linked to those issues. The first step is to semantically cross-reference their issues with the issues from the Springer et al. (2015) dataset, which by transitivity links their issues to the 2,000+ indicators in that dataset. But the planning board also undertakes an additional external search for indicators that (1) have small-scale spatial data for their region or that (2) could feasibly and cost-effectively be collected. Once the search is complete, they add these indicators and metadata for the spatial datasets to the graph database using the back-end interface.
The planning board then uses the front-end interface to select the key issues that have been approved, as well as a few of the regional indicators they found that they are sure they want to use because of the good data available. They then also enable the indicator attribute for “dataset,” which assures that each indicator selected has been tagged to have an available dataset to use. The board runs the MCS and finds the solution “infeasible,” meaning that there are not enough indicators with datasets to represent the issue they care about. The board decides to run the MCS algorithm again without the dataset attribute selected, and it immediately finds a baseline set of indicators, some with datasets and some without. They then lock-in those indicators with datasets, eliminate the others, run the algorithm again, and repeat the process iteratively. They are able to represent 80% of their issues using indicators with available data before they receive an infeasible solution again. This indicator set allows them to analyze the spatial data for the majority of their issues to assist in their scenario planning, while also communicating to other government authorities the data gaps that remain for key issues.
Discussion
These examples illustrate the flexibility of the checklist generator workflow and the potential to adjust the “building blocks” depending on the goals and strategies of the stakeholder groups. This flexibility would be even more evident if comparing the differences in indicator sets between runs. As shown by Huber et al. (2015), eliminating one or two indicators and running the MCS again may produce an indicator set that is markedly different than the previous one. This not only highlights the possibility of countless acceptable indicator sets, but the importance of a user-driven workflow to guide indicator selection. This workflow is designed so that actors are forced to engage in careful discussion at various points throughout the user-defined workflow to assess for themselves whether the indicator list being generated adequately covers each aspect of the issues they care about.
One can imagine many other ways of combining and adapting these building blocks for any number of cases, along with the advantages that would come more and more lists being generated. For instance, consider another example: five different groups of stakeholders are concerned with the sustainability of sourcing of a commodity X, but each group is on a different continent and produces commodity X in distinctive agroecosystems, with disparate technologies, and in different social and institutional contexts. As each group goes through their own unique checklist generator workflow, they will generate their own issue and indicator lists to define and measure the sustainability of sourcing commodity X from their respective regions. By continually adding to and utilizing the growing network of issues and indicators, similarities and differences between the resulting lists could be compared and would provide insight into what sustainability issues have global significance and which are locally specific.
We hypothesize that a significant subset of sustainability issues is applicable in all contexts, although this subset cannot currently be determined a priori. Yet as multi-scale commodity- and region-specific sets are generated for more contexts, patterns in these similarities and differences may begin to elucidate a global picture of sustainable food systems. When considered together, a global set that defines and measures global food system sustainability, given current knowledge, will emerge.
As more sets are generated and additional knowledge on important and useful issues and indicators becomes available, stakeholders can use this new information to update their sets to include issues increasingly deemed as important by other groups and indicators that are often used and becoming particularly established. Consider again the example of commodity X: if one region generates an issue and indicator list, the other four regions might find it useful to see these lists while creating their own. This information can then be stored in the growing Semantic Web of data by using the back-end interface to tag issues and indicators that show up again and again, further strengthening both the indicator attributes and the usefulness to users. While maintaining user privacy, such an open-data Semantic Web platform can allow sharing of previously searched commodities and regions at various scales, the issues the user is concerned with, and the indicators that were chosen in real time.
In this way, the iterative nature and flexibility of the checklist generator workflows allow the global definition and measurement of food system sustainability to emerge and evolve over time, growing from the unique knowledge and experience of the people addressing the issues on the ground. Furthermore, transparency of these workflows using the Semantic Web has the potential to empower communities of practice often left out of the decision making workflow: if their sets are consistently different from those with the influence to change practices, it will become evident to the global community that comprehensive sustainability is not being achieved by this group, putting pressure on those in power to iteratively adjust their sets and expand their stakeholder groups and decision making workflow.
Conclusions and future work
The three examples presented in this study show the potential for the checklist generator workflow to take disparate sustainability information and build context-specific and globally-relevant definitions of food system sustainability. The flexibility of the workflow allows different disciplines and stakeholder groups to contribute to a shared informatics platform, while at the same time giving stakeholders a practical tool to communicate with researchers and negotiate with other interest groups. Our next step for this work is to generate issue and indicator checklists for comparison in partnership with stakeholder groups involved in the supply chains of specific commodities and regions.
A number of further steps are envisioned to improve the usefulness of the existing graph database and checklist generator workflow. Our team has developed a draft typology of indicators that, if applied to each indicator (useful scale, available data, leading/lagging, etc.), would populate the attribute table in the MCS algorithm and allow them easy sorting of indicator types before running the MCS. The continued development of the front-end and back-end application interfaces, alongside the continued development of the controlled vocabularies, allow our tools to be more closely linked to global Semantic Web of sources and data. Furthermore, we are developing an ontology to improve the description of the relationships between issues and indicators. In this current study, a link is only made if an indicator can provide useful information about a given issue. Other relationships could be defined among issues, such as causation between issues, allowing the isolation of underlying drivers. Coupling of these underlying drivers to mechanistic frameworks or models would then allow for explicit testing of actionable solutions such as management practices, policy interventions, and livelihood decisions. Building these complex relationships into the graph database would give users even more information and options, helping them choose issue and indicator sets with even more precision and confidence.
Data availability statement
The original contributions presented in the study are included in the article/Supplementary material, further inquiries can be directed to the corresponding author.
Author contributions
NS led the writing of the manuscript. All authors conceived the foundation of the study, design of the methodology, design of the illustrative case studies, contributed to the preparation, and revision of the manuscript at all stages. All authors contributed to the article and approved the submitted version.
Funding
This work was supported by the USDA NIFA under Grants CA-D*-XXX-7766-H and CA-D-ESP-2100-H and additional financial and in-kind support from Mars, Incorporated, Kraft Foods, Incorporated, and the WK Kellogg Endowed Chair in Sustainable Food Systems at UC Davis.
Acknowledgments
We thank members of our technical advisory committee for valuable feedback.
Conflict of interest
The authors declare that the research was conducted in the absence of any commercial or financial relationships that could be construed as a potential conflict of interest.
Publisher's note
All claims expressed in this article are solely those of the authors and do not necessarily represent those of their affiliated organizations, or those of the publisher, the editors and the reviewers. Any product that may be evaluated in this article, or claim that may be made by its manufacturer, is not guaranteed or endorsed by the publisher.
Supplementary material
The Supplementary Material for this article can be found online at: https://www.frontiersin.org/articles/10.3389/fsufs.2022.684831/full#supplementary-material
References
Ayres, R., van den Berrgh, J., and Gowdy, J. (2001). Strong versus weak sustainability: economics, natural sciences, and consilience. Environ. Ethics 23, 155–168. doi: 10.5840/enviroethics200123225
Balinski, M. L., and Quandt, R. E. (1964). On an integer program for a delivery problem. Operat. Res. 12, 300–304. doi: 10.1287/opre.12.2.300
Bebbington, A. (1999). Capitals and capabilities: a framework for analyzing peasant viability, rural livelihoods and poverty. World Dev. 27, 2021–2044. doi: 10.1016/S0305-750X(99)00104-7
Beddington, J. R., Asaduzzaman, M., Fernandez, A., Clark, M. E., Guillou, M., Jahn, M. M., et al (2012). Achieving Food Security in the Face of Climate Change: Final Report From the Commission on Sustainable Agriculture and Climate Change. CGIAR Research Program on Climate Change, Agriculture and Food Security (CCAFS). Copenhagen, Denmark. Available online at: https://cgspace.cgiar.org/handle/10568/35589 (accessed August 3, 2022).
Beisner, B., Haydon, D., and Cuddington, K. (2003). Alternative stable states in ecology. Front. Ecol. Environ. 1, 376–382. doi: 10.1890/1540-9295(2003)001[0376:ASSIE]2.0.CO;2
Bell, S., and Morse, S. (1999). Sustainability indicators: measuring the immeasurable. EarthScan Publications. p. 175.
Brown, M. E., Antle, J. M., Backlund, P., Carr, E. R., Easterling, W. E., Walsh, M. K., et al (2015). Climate Change, Global Food Security and the US Food System. 146 pp. US Global Change Research Program (10.7930/J0862DC7). U.S. Department of Agriculture (USDA), University Corporation for Atmospheric Research (UCAR), and National Center for Atmospheric Research (NCAR). Available online at: http://www.usda.gov/oce/climate_change/FoodSecurity2015Assessment/FullAssessment.pdf (accessed August 3, 2022).
Brundtland, G. (1987). Report of the World Commission on Environment and Development: Our Common Future. Oxford: Oxford University Press.
CABI (2014). CAB Thesaurus. CABI. Available online at: http://www.cabi.org/cabthesaurus/ (accessed August 3, 2022).
Caracciolo, C., Stellato, A., Morshed, A., Johannsen, G., Rajbhandari, S., Jaques, Y., et al. (2013). The AGROVOC linked dataset. Semantic Web 4, 341–348. doi: 10.3233/SW-130106
Cash, D. W., Clark, W. C., Alcock, F., Dickson, N. M., Eckley, N., Guston, D. H., et al. (2003). Knowledge systems for sustainable development. Proc. Natl. Acad. Sci. U.S.A. 100, 8086–8091. doi: 10.1073/pnas.1231332100
Chambers, R., and Conway, G. (1992). Sustainable Rural Livelihoods: Practical Concepts for the 21st Century. Institute of Development Studies (UK). Available online at: http://opendocs.ids.ac.uk/opendocs/handle/123456789/775 (accessed August 3, 2022).
Clark, W. C., Tomich, T. P., Noordwijk, M., van, Guston, D., Catacutan, D., Dickson, N. M., et al. (2011). Boundary work for sustainable development: natural resource management at the consultative group on international agricultural research (CGIAR). Proc. Natl. Acad. Sci. U.S.A. 113, 4615–622. doi: 10.1073/pnas.0900231108
Connelly, S. (2007). Mapping sustainable development as a contested concept. Local Environ. 12, 259–278. doi: 10.1080/13549830601183289
COSA (2012). Basic Indicators FOR Farm Level (v. 2.1). Committee on Sustainability Assessment (COSA). Available online at: http://thecosa.org/wp-content/uploads/2013/09/Basic-Indicators-v3-4.pdf (accessed August 3, 2022).
Costanza, R., Wainger, L., and Folke, C. (1993). Modeling complex ecological economic systems. BioScience 43, 545–555. doi: 10.2307/1311949
Dasgupta, P. (2007a). Measuring sustainable development: theory and application. Asian Dev. Rev. 24, 1. Available online at: https://www.proquest.com/docview/220282607 (accessed August 3, 2022).
Dasgupta, P. (2007b). The idea of sustainable development. Sustain. Sci. 2, 5–11. doi: 10.1007/s11625-007-0024-y
Dasgupta, P., and Heal, G. (1974). The optimal depletion of exhaustible resources. Rev. Econ. Stud. 41, 3–28. doi: 10.2307/2296369
Dasgupta, P., and Mäler, K.-G. (2004). The Economics of Non-Convex Ecosystems. Springer. Available online at: http://link.springer.com/content/pdf/10.1007/1-4020-2515-7.pdf (accessed August 3, 2022).
Dixon, J. A., and Fallon, L. A. (1989). The concept of sustainability: origins, extensions, and usefulness for policy. Soc. Natur. Resourc. 2, 73–84. doi: 10.1080/08941928909380675
Folke, C., Carpenter, S., Elmqvist, T., Gunderson, L., Holling, C. S., and Walker, B. (2002). Resilience and sustainable development: building adaptive capacity in a world of transformations. AMBIO J. Hum. Environ. 31, 437–440. doi: 10.1579/0044-7447-31.5.437
Garnett, T. (2013). Food sustainability: Problems, perspectives and solutions. Proceedings of the Nutrition Society 72, 29–39. doi: 10.1017/S0029665112002947
Goodland, R. (1995). The concept of environmental sustainability. Ann. Rev. Ecol. Syst. 26, 1–24. doi: 10.1146/annurev.es.26.110195.000245
Hamilton, C. (1999). The genuine progress indicator methodological developments and results from Australia. Ecol. Econ. 30, 13–28. doi: 10.1016/S0921-8009(98)00099-8
Hamilton, K. (1994). Green adjustments to GDP. Resourc. Policy 20, 155–168. doi: 10.1016/0301-4207(94)90048-5
Hotelling, H. (1931). The economics of exhaustible resources. J. Polit. Econ. 39, 157–175. doi: 10.1086/254195
Huber, P. R., Springer, N. P., Hollander, A. D., Haden, V. R., Brodt, S., Tomich, T. P., et al. (2015). Indicators of global sustainable sourcing as a set covering problem: an integrated approach to sustainability. Ecosyst. Health Sust. 1, 1–8. doi: 10.1890/EHS14-0008.1
IPCC (2014a). Climate Change 2014: Impacts, Adaptation and Vulnerability (IPCC 5th Assessment Report) [Working Group II]. IPCC. Available online at: https://www.ipcc.ch/report/ar5/wg3/ (accessed August 3, 2022).
IPCC (2014b). Climate Change 2014: Mitigation of Climate Change (IPCC 5th Assessment Report) [Working Group III]. IPCC. Available online at: http://www.ipcc.ch/report/ar5/wg2/ (accessed August 3, 2022).
Lotze-Campen, H. (2008). The role of modelling tools in integrated sustainability assessment (ISA). Int. J. Innov. Sust. Dev. 3, 70–92. doi: 10.1504/IJISD.2008.018194
Lucas, N., Raudsepp-Hearne, C., and Blanco, H. (2010). “Stakeholder participation, governance, communication, and outreach,” in Ecosystems and Human Well-Being: A Manual for Assessment Practitioners, eds N. Ash, H. Blanco, C. Brown, K. Garcia, T. Henrichs, N. Lucas, C. Ruadsepp-Heane, R. D. Simpson, R. Scholes, T. Tomich, B. Vira, and M. Zurek (Island Press), 115–150. Available online at: https://wedocs.unep.org/bitstream/handle/20.500.11822/8949/EcosystemsHumanWellbeing.pdf (accessed August 3, 2022).
Millennium Ecosystem Assessment (2003). Ecosystems and Human Well-Being: A Framework for Assessment. Island Press. Available online at: https://millenniumassessment.org/en/Framework.html (accessed August 3, 2022).
Millennium Ecosystem Assessment (2005). Glossary (Appendix 4). Millennium Ecosystem Assessment. Available online at: http://millenniumassessment.org/documents/document.59.aspx.pdf (accessed August 3, 2022).
Munda, G. (2005). “Measuring sustainability”: a multi-criterion framework. Environ. Dev. Sust. 7, 117–134. doi: 10.1007/s10668-003-4713-0
Olde, E. M., Moller, H., Marchand, F., McDowell, R. W., MacLeod, C. J., Sautier, M., et al. (2016). When experts disagree: the need to rethink indicator selection for assessing sustainability of agriculture. Environ. Dev. Sust. 19, 1327–1342. doi: 10.1007/s10668-016-9803-x
Ostrom, E., Burger, J., Field, C. B., Norgaard, R. B., and Policansky, D. (1999). Revisiting the commons: local lessons, global challenges. Science 284, 278–282.
Pearce, D. (1988). Economics, equity and sustainable development. Futures 20, 598–605. doi: 10.1016/0016-3287(88)90002-X
Perrings, C. (2006). Resilience and sustainable development. Environ. Dev. Econ. 11, 417–427. doi: 10.1017/S1355770X06003020
Pretty, J. N. (1995). Participatory learning for sustainable agriculture. World Dev. 23, 1247–1263. doi: 10.1016/0305-750X(95)00046-F
Romero, C., and Rehman, T. (1987). Natural resource management and the use of multiple criteria decision-making techniques: a review. Euro. Rev. Agric. Econ. 14, 61–89. doi: 10.1093/erae/14.1.61
Rosenzweig, C., Jones, J. W., Hatfield, J. L., Ruane, A. C., Boote, K. J., Thorburn, P., et al. (2013). The agricultural model intercomparison and improvement project (AgMIP): protocols and pilot studies. Agric. For. Meteorol. 170, 166–182. doi: 10.1016/j.agrformet.2012.09.011
Scholes, R., Biggs, R., Palm, C., and Duraiappah, A. (2010). “Assessing state and trends in ecosystem services and human well-being,” in Ecosystems and Human Well-Being: A Manual for Assessment Practitioners, eds N. Ash, H. Blanco, C. Brown, K. Garcia, T. Henrichs, N. Lucas, C. Ruadsepp-Heane, R. D. Simpson, R. Scholes, T. Tomich, B. Vira, and M. Zurek (Washington, DC; Covelo; London: Island Press), 115–150.
Scoones, I. (2009). Livelihoods perspectives and rural development. J. Peasant Stud. 36, 171–196. doi: 10.1080/03066150902820503
Seekell, D., Carr, J., Dell'Angelo, J., D'Odorico, P., Fader, M., Gephart, J., et al. (2017). Resilience in the global food system. Environ. Res. Lett. 12, 025010. doi: 10.1088/1748-9326/aa5730
Seekell, D., D'Odorico, P., and MacDonald, G. K. (2018). Food, trade, and the environment. Environ. Res. Lett. 13, 100201. doi: 10.1088/1748-9326/aae065
Sen, A. (1997). Editorial: human capital and human capability. World Dev. 25, 1959–1961. doi: 10.1016/S0305-750X(97)10014-6
Solow, R. (1974). Intergenerational equity and exhaustible resources. Rev. Econ. Stud. 41, 29–45. doi: 10.2307/2296370
Springer, N. P., Garbach, K., Guillozet, K., Haden, V. R., Hedao, P., Hollander, A. D., et al. (2015). Sustainable sourcing of global agricultural raw materials: assessing gaps in key impact and vulnerability issues and indicators. PLOS ONE 10, e0128752. doi: 10.1371/journal.pone.0128752
Stewardship Index for Specialty Crops (2011). User's Guide to SISC Farm Level Metrics and Calculator Beta Version 1.1 (Beta Version 1.1). Ag Innovations Network, 41. Available online at: https://dokumen.tips/documents/guide-to-sisc-metrics-v-1-21-stewardship-to-sisc-metricspdfguidetosiscmetricsandcalculatorbetaversion11.html (accessed August 3, 2022).
Tendall, D. M., Joerin, J., Kopainsky, B., Edwards, P., Shreck, A., Le, Q. B., et al. (2015). Food system resilience: defining the concept. Glob. Food Sec. 6, 17–23. doi: 10.1016/j.gfs.2015.08.001
The Conservation Measures Partnership (2013). Open Standards for the Practice of Conservation (Version 3.0), 48. Available online at: https://deeradvisor.dnr.cornell.edu/sites/default/files/CMP-OS-V3-0-Final.pdf (accessed August 3, 2022).
The Economist (2013). Global Food Security Index 2013: An Annual Measure of the State of Global Food Security. EIU Ltd. Available online at: http://foodsecurityindex.eiu.com/Home/About (accessed August 3, 2022).
Tomich, T. P., Argumedo, A., Baste, I., Camac, E., Filer, C., Garcia, K., et al. (2010). “Conceptual frameworks for ecosystem assessment: their development, ownership, and use,” in Ecosystems and Human Well-Being: A Manual for Assessment Practitioners, eds N. Ash, H. Blanco, C. Brown, K. Garcia, T. Henrichs, N. Lucas, C. Ruadsepp-Heane, R. D. Simpson, R. Scholes, T. Tomich, B. Vira, and M. Zurek (Washington, DC; Covelo, London: Island Press), 115–150.
Tschakert, P., Huber-Sannwald, E., Ojima, D. S., Raupach, M. R., and Schienke, E. (2008). Holistic, adaptive management of the terrestrial carbon cycle at local and regional scales. Glob. Environ. Change 18, 128–141. doi: 10.1016/j.gloenvcha.2007.07.001
Turner, B. L., Kasperson, R. E., Matson, P. A., McCarthy, J. J., Corell, R. W., Christensen, L., et al. (2003). A framework for vulnerability analysis in sustainability science. Proc. Natl. Acad. Sci. U.S.A. 100, 8074–8079. doi: 10.1073/pnas.1231335100
UN (2008). Official List of MDG Indicators. UN. Available online at: http://mdgs.un.org/unsd/mdg/Resources/Attach/Indicators/OfficialList2008.pdf (accessed August 3, 2022).
van der Linden, A., de Olde, E. M., Mostert, P. F., and de Boer, I. J. M. (2020). A review of European models to assess the sustainability performance of livestock production systems. Agric. Syst. 182, 102842. doi: 10.1016/j.agsy.2020.102842
van Kerkhoff, L., and Lebel, L. (2006). Linking knowledge and action for sustainable development. Ann. Rev. Environ. Resourc. 31, 445–477. doi: 10.1146/annurev.energy.31.102405.170850
Van Noordwijk, M., Tomich, T. P., and Verbist, B. (2001). Negotiation support models for integrated natural resource management in tropical forest margins. Conserv. Ecol. 5, 21. doi: 10.5751/ES-00344-050221
Keywords: raw material sourcing, Semantic Web (Web 3.0), indicators & metrics, materiality analysis, stakeholder decision-making
Citation: Springer NP, Hollander AD, Huber PR, Riggle C and Tomich TP (2022) A malleable workflow for identifying the issues and indicators that define and measure sustainability in food systems. Front. Sustain. Food Syst. 6:684831. doi: 10.3389/fsufs.2022.684831
Received: 24 March 2021; Accepted: 26 July 2022;
Published: 15 August 2022.
Edited by:
Albie Miles, University of Hawaii–West Oahu, United StatesReviewed by:
Maggie Regan, Center for Indigenous Health Research and Policy OSU, United StatesLe Yu, Renmin University of China, China
Copyright © 2022 Springer, Hollander, Huber, Riggle and Tomich. This is an open-access article distributed under the terms of the Creative Commons Attribution License (CC BY). The use, distribution or reproduction in other forums is permitted, provided the original author(s) and the copyright owner(s) are credited and that the original publication in this journal is cited, in accordance with accepted academic practice. No use, distribution or reproduction is permitted which does not comply with these terms.
*Correspondence: Nathaniel P. Springer, sprin126@umn.edu