Assessment of environmental and farm business impacts of phosphorus policies in two European regions
 Linda Arata1
  Anwesha Chakrabarti1*
  Nelson Ekane2
  Henning Lyngsø Foged3 Christoph Pahmeyer4
  Arno Rosemarin2
  Paolo Sckokai1
- 1Department of Agro-food Economics, Università Cattolica del Sacro Cuore, Piacenza, Italy
- 2Stockholm Environment Institute, Stockholm, Sweden
- 3Organe Institute, Skødstrup, Denmark
- 4Institute for Food and Resource Economics, University of Bonn, Bonn, Germany
This paper presents analyses of the economic and environmental impact of relevant phosphorus management policy scenarios, using representative pig and poultry farms in the Emilia-Romagna region (Po River basin, Italy) and Niedersachsen region (Ems River basin, Germany) as case studies. The analysis was done by using a farm-level linear programming bioeconomic model developed for different farm and animal types—sows, fattening pigs, laying hens and broilers. The baseline for the assessed scenarios involved farms situated within the Nitrate Vulnerable Zones (NVZs) and therefore, were subject to indirect phosphorus fertilization limitations via the Nitrates Directive (ND). The analyzed phosphorus management policy scenarios included the implementation of two different balances of 8.7 kg and 4.35 kg of P per ha per year, inspired by the German Fertilizer Ordinance for phosphorus fertilization implemented in 2007 and later updated from 2017 up to 2023, respectively. We also included a more rigorous zero P balance scenario. The results of the scenario simulations, based on model assumptions, reveal that the introduction of direct phosphorus management policies for pig and poultry farms situated in high livestock dense regions can be done without causing any significant impact on farm gross margin (around 2% of reduction) for both regions and all four animal types, except for sows and broiler production in the Ems River Basin (up to 12% of reduction). Selected technologies and methods, inspired by current practices, have been analyzed for their cost efficiency to achieve the target P balance of the individual scenarios, including export of slurry out of the farm or export of separation solids. Results also highlight that the Nitrates Directive alone is not enough to handle the P issue in monogastric livestock farms.
Introduction
Phosphorus (P) is one of the essential nutrients for plants, animals and humans and is therefore crucial for all life on the planet as well as for food security. Flow analyses show that about 50% of consumed P is lost to the environment (Scholz, 2013). Unsustainable use causes loss of P from wastewater streams and farming activities to water bodies, which leads to eutrophication. Example of effects such as anoxic benthic zones and extensive annual neuro-toxic cyanobacterial blooms includes the Baltic Sea (HELCOM, 2019). In addition, P is a commercially finite mined resource originating from a handful of countries, dominated by Morocco. Over 92% of the P consumed in the EU is imported largely from countries like Morocco and Russia. The pollution generated by an unsustainable use of P and the dependence on foreign countries for its provision have led the European Union (EU) to put P on the EU list of 30 Critical Raw Materials (European Commission, 2020a). This implies that the EU puts special attention to increase the use efficiency of P as well as its reuse. In fact, in the recent Farm-to-fork strategy (European Commission, 2020b), a specific chapter is dedicated to nutrient management policies, with the provision of the adoption of a specific “Integrated nutrient management action plan” by each Member State and the commitment to reduce the use of fertilizers by 20% by 2030.
In the European Union (EU), regions with intensive pig and poultry farming are characterized by high nitrogen (N) and P farm balances, leading to high nutrient loads on the environment. N and P losses pose a threat to air and water quality, biodiversity, and climate. Some regulatory frameworks exist in the EU, but these do not directly regulate P fertilization from manure. Only a few EU member states have limited direct P-fertilization measures stipulated under the Water Framework Directive 2000/60/EC. Following the Nitrates Directive 676/91/EC (ND), P-fertilization in the Nitrate Vulnerable Zones (NVZs) in the EU is only indirectly regulated via a limit of 170 kg N/ha/y. However, the indirect effect of the ND on P management concerns only P from manure and for areas designated as NVZs. As a result, relatively few pig and poultry farms in the EU are controlled in their use of P for fertilization including P from livestock manures. In the case of intensive pig and poultry farming, P emissions are also regulated via the use of Best Available Techniques (BATs) under Directive 2010/75/EU and the Commission Implementing Decision BREF (IRPP) 2017/302 (Santonja et al., 2017), but this does not limit the use of nutrients on croplands. Part of the challenge in addressing P pollution from agricultural practices is that the above-mentioned EU Directives remain insufficient for effective regulation of P fertilization with a minimum loss to the environment.
In this context, the objective of this paper is to analyze the economic and environmental impact of several P management policy scenarios, using representative pig and poultry farms in the Emilia-Romagna region (Po River basin, Italy) and Niedersachsen region (Ems River basin, Germany) as case studies. The analysis was carried out by using a farm-level linear programming bioeconomic model developed for different farm and animal types—sows, fattening pigs, laying hens and broilers.
Challenges in sustainable phosphorus management in farming
In farming the loss of P is especially associated with the manure-crop-feed nutrient cycle (Figure 1). Figure 1, adapted from the “CNP flows interactive model” in Foged (2021), illustrates the flow of nutrients in a livestock farm that produces exactly 170 kg of N after storage. The starting point of the nutrient flow is the amount ex-animal, estimated using standard figures for livestock manure according to mass balance principles. The red arrows indicate flows that needs to be minimized and green arrows indicate those that should or could be maximized in the system. The figure is attempting to illustrate, in a simplified way, the main NP nutrient flows to consider in a real farmgate balance calculation. NP flows that are typically of minor importance, but which principally shall be considered in a farm gate balance calculation according Granstedt et al. (2004) are not shown in the figure, such as atmospheric depositions.
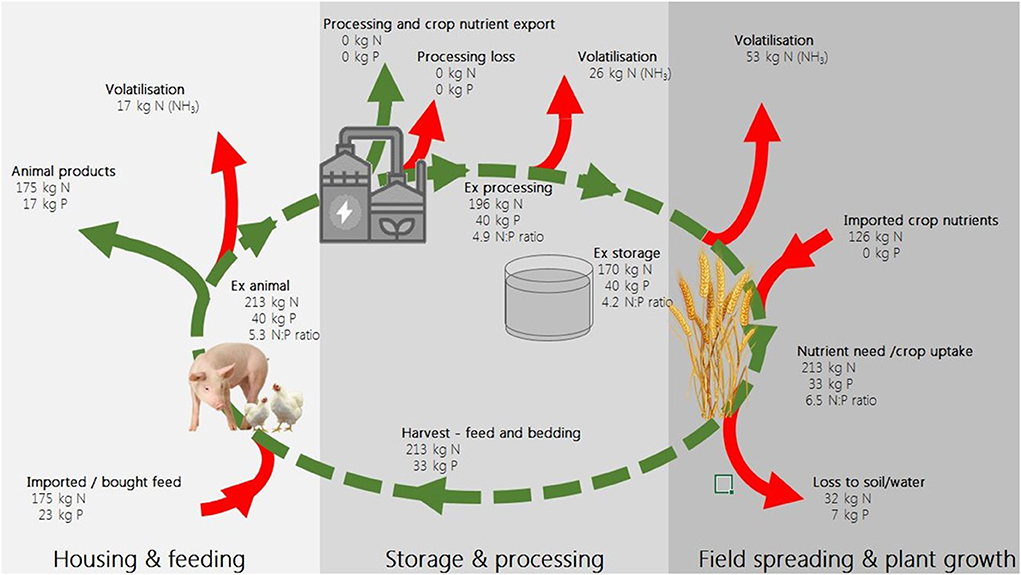
Figure 1. A modeled manure/crop/feed nutrient cycle in a fattening pig farm in N Italy in Nitrate Vulnerable Zone (NVZs), calculated here per 1 ha of cropland. The total farmgate balance of the example is 126 kg N and 6 kg P per ha, and the NUEs (nutrient use efficiencies) of N and P are 43% and 82%, respectively (nutrients taken up by the crop in relation to nutrients ex animal).
Figure 1 assumes that there are no losses of P in livestock housing due to watertight manure collection systems, such as concrete floors or slurry channels of sufficient quality, and similarly no runoff from manure storage that is assumed to be of sufficient size and of leak-free quality. P losses therefore happen predominantly on the farm field, where low nutrient use efficiency occurs because the manure is spread only according to the nitrogen needs of the crop. Due to the loss of nitrogen from manure in the steps from ex-animal to crop uptake, the N:P ratio of the manure is typically lowered considerably until crop uptake, which causes an overdosing with P, especially in cases where no manure P is exported from the farm.
The losses of manure nutrients, i.e., the farm gate N and P balances, would potentially be larger outside NVZs where farms are not met with legal requirements to storage capacity and limiting N fertilization rates. On one hand, the efficient management of P is particularly challenging in monogastric species (like pigs and poultry) because the N:P ratio in those species is lower compared to polygastrics. On the other hand, the demand for pork is growing worldwide, and chicken meat, in particular, is recognized as a healthy food with a high yearly increase in demand and production (Alexandratos and Bruinsma, 2012). Peyraud and MacLeod (2020) points out that the consumption of animal products per capita in the EU is more than twice the world average, that animal production has a very important role in the EU's economy, with a strong impact on employment, and that livestock production is part of the solution for meeting policy targets for climate, environment, and biodiversity. This implies that, for any foreseeable future, pig and poultry production remains an important part of the economy of the EU and therefore, warrants the focus on policies for better management of P flows.
Figure 1 illustrates a considerable loss of NP nutrients at a modeled pig and poultry farm in an NVZ, subject to an Action Programme of tighter agro-environmental regulation, following Annex III of the Nitrates Directive. The NP flows inside the modeled livestock farm could be increased considerably if these losses were lowered and result in reduced farm gate NP balances.
Any change or improvement in NP flows requires an ability to measure progress and make accounts at the farm level. Accountability of NP nutrients requires availability of trustworthy, detailed and updated standard values for livestock manures for tactical and strategic nutrient management planning, such as fertilizer planning, estimation of the sufficient sizes of manure storage facilities and requirements to export nutrients to other farms/regions. Our suggestion is that these values must be based on mass-balance principles. Manure analyses are very unstable due to the difficulty of having a representative sample, and they would logically not clarify the volume, and can alone be a supplementary farm practice to make field spreading more precise in relation to prepared fertilization plans. However, in practice, there is a huge variation in the level of detail and in the standard values for manure despite the fact that genetic breeding material, productivity and production systems are rather similar across professional EU pig and poultry farms. Therefore, an EU initiative is required to improve the situation and enable livestock farmers to make precise estimates of their manure P production. EU must, in this connection, lead the change by making an end on using the grazing equivalent, Livestock Unit (LSU) as an environmental indicator 1.
Responsibility for the produced manure nutrients is another important attention point. Currently, the livestock farms in the NVZs know, and are responsible for, the share of N in their produced manure that is brought to the field for spreading as fertilizer, i.e., manure N ex storage, but they are not held accountable for the losses from housing, processing and storage. The Water Framework Directive (WFD) stipulates the legal basis for regulation of P but is seldom used, and only few EU farmers are aware of the P fertilization resources in their livestock manures. In some countries, e.g., Denmark, the farmers are, by law, even given the right to assume a certain field loss of N, which does not give farmers incentives to use practices and manure processing technologies that would increase the Nutrient Use Efficiency (NUE).
A paradigm shift is therefore required for feeding and fertilization. Conventional description of needs for a minimum of N, protein and P in feeding and fertilization invites overdosing and should be replaced with regulated maximal use of nutrient inputs. In feeding, the use of N must be regulated via maximal protein content in feed rations.
Also, the farm gate balances could be lowered by the use of farm practices and cleantech, such as mandatory BATs in EU Member States according to Implementing Decision (EC/2017/302). Such BATs are required by farms that need an environmental permit. In some cases, BATs could change status and become minimum requirements for all farms. Using slurry separation would, in all livestock farms, be a manure processing technology that would allow exporting excess P out of the farm, best to a regional manure processing plant for further distribution to other farms in the region in need of P nutrients. Similarly, some currently used manure processing is linked with huge losses of NP and should be banned, including composting that typically means losses of 37–60% N and 23–39% P besides a huge production of greenhouse gases and connected loss of C (Tiquia et al., 2002).
Summing up, our claim is that the losses of P nutrients in the manure/crop/feed cycle at farms and the resulting farmgate P balances can be highly influenced in a positive manner by improved nutrient policies. P should not be seen in isolation, as the way to an increased recycling of P in farming also depends on the ability to preserve the N content of livestock manures “ex-animal”. We suggest that the following “4R principles for strengthened phosphorus management policies in farming” must be prioritized in relation to EU targets for phosphorus:
• Resource accounting ability, including trustworthy mass balance figures for manure production must be available for all EU livestock farms
• Reduced use via paradigm shift in feeding and fertilization practices—from minimum requirements to regulated maximal input
• Responsibility to livestock owners—owners of animal must be responsible for the NP in their manure
• Recycling increase though practices and processing—minimum standards must be raised, some polluting practices banned, and more farms given incentives to use BATs
In this paper, we analyze the economic and environmental impact of relevant policy scenarios for P management in EU farming. Specifically, we use a bioeconomic model to explore which P management policy results in the lowest P balances in farming among the several policies analyzed, based to some extent on the “4R principles” mentioned above. We assume that a sustainable P management ideally means a zero farmgate P balance with reference to Figure 1. The bioeconomic model also presents the economic impacts of the analyzed policies, concretely in the form of a relative change in farm gross margin in an otherwise unchanged market, to allow an assessment of the cost-efficiency of a given policy scenario. The relevance of the analyses is ensured by modeling representative farm types as case studies that are situated in the two selected watersheds in EU with widely different P nutrient policies, the Emilia-Romagna region (Po River basin, Italy) and Niedersachsen region (Ems River basin, Germany). In the following, we identify these regions as NW Germany and N Italy.
Methods
In this section we describe the methodology used to develop the bioeconomic model to assess the P management policy impacts on the farm gross margin and the environment. We also present the description of the study locations and the established scenarios.
Bioeconomic model description
In order to investigate the effects of the implementation of different P management policies on the pig and poultry farms' economic and environmental performances, we apply a farm-level linear programming model (Norton and Hazell, 1986). We assume that a representative farmer maximizes gross margin subject to a set of technical and institutional constraints. Formally:
where, Inc is the farm gross margin, x is the vector of farm activities, specifically the number of animals belonging to each animal category bred on the farm and the number of hectares allocated to each crop; p and c are the vectors of per unit price and per unit variables costs associated with each farm activity. Thus, the farm gross margin rewards the farm capital and labor. In addition, A is the matrix of technical coefficients which relates each farming activity to the technical constraints and the institutional rules (b). The model finds the optimal farmer choices related to the number of animals to breed, feed ratio, number of hectares to allocate on each crop and the amount of fertilizer (both mineral and organic) to use to maximize the farm gross margin while complying with the set of technical and institutional boundaries. The different components of the model are shown in Figure 2.
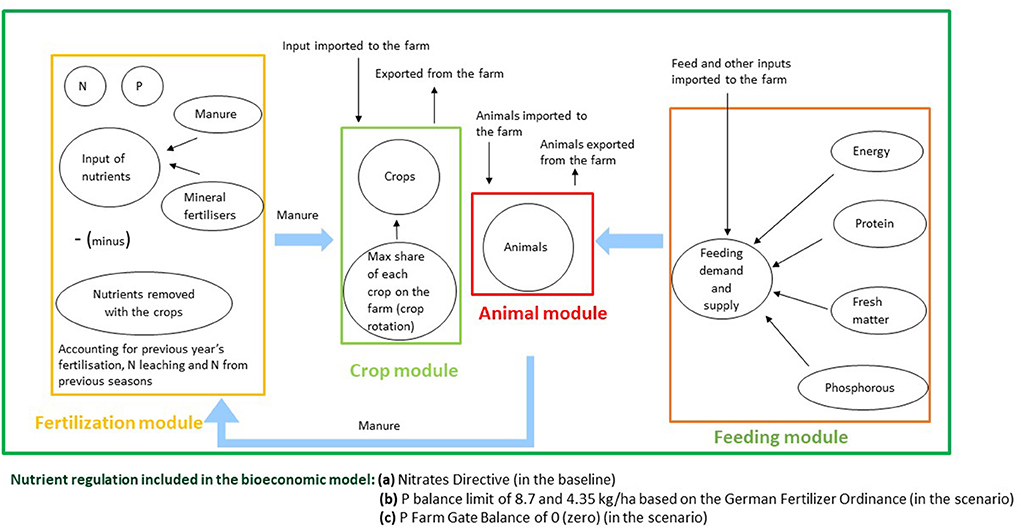
Figure 2. Components of the bioeconomic model.
The technical constraints included in our model can be classified into the following broad categories: constraints related to the number of animals, constraints related to the feeding, constraints related to crop rotation and land endowment, constraints related to fertilization, and constraints related to institutional rules. In the following description of the constraints the variables whose notation starts with “v_” are variables endogenously determined by the model, while the variables whose notation starts with “p_”, they are exogenous variables (i.e., parameters in mathematical programming language).
The maximum number of animals (p_max_animals) for each type of animal (a) that can be held on the farm is defined by the following constraint:
where v_herd_sizea, n is the number of animal type a (animal types being sow, fattening pig, broiler and laying hen) in their fattening phase n in a year raised on the represented farm that is endogenously determined by the model. We set the maximum number of animals that can be held on the representative farm as our programming model is formulated in a static fashion, where the investment dynamics is not accounted for and hence the maximum farm size is an exogenous information. We also account for the relationship among different phases of animals within each animal categories adjusting for the mortality rate of each phase (e.g., among piglets and sows; older and younger fattening pigs; pre-laying chickens and laying chickens).
where n denotes an animal in phase n and m represents the mortality rate.
The feeding constraints represent the animal demand and supply for feed and we model the demand and supply for each animal category. The demand is fulfilled by supplying feed to animals where each feed has a specific content of each nutrient. The feeding constraint guarantees a balance between supply and demand of each nutrient such that the supply of each nutrient by feed cannot be lower than the demand for that nutrient by animals. For simplicity, we assume that all feeds are bought from the market, and all of the farms crop products sold to the market accordingly. The feeding constraint is modeled as follows:
For fattening pigs and broilers:
For sows and laying hens:
where v_Qfeed is endogenously determined by the model and indicates the kg of fresh matter provided to the animals, a is animal type, f is feed type, p_observed_feed is kg of fresh matter from each feed supplied per kg of liveweight increase (for fattening pigs and broilers) or per day (for sows and laying hens), p_weightInc kg of weight increase per phase.
The constraints related to crops maintain the minimum requirement of crop rotation to guarantee soil fertility.
where v_ha results from the model and represents the hectare of land allocated to each crop, c denotes the crop types considered, v_land is the total land available, p_c_yc is the minimum crop rotational break time of crop type c given in years.
We also impose that the sum of land allocated to different crops cannot be larger than the total farmland endowment.
The fertilizer constraints have the same structure as the feeding constraints. We consider the crop requirements for N and P which are satisfied by the supply of N and P through manure and chemical fertilizers. We account for the efficiency of fertilizer, i.e., not all the nutrients provided to the crops are available immediately, as well as for the nutrients already available in the soil due to previous years' fertilization. In the case of N, we also consider the N deposition. The following equation highlights the calculation of the nutrient surplus (v_nutrient_surplusfl) according to the German Fertilizer Ordinance (2017). In principle, the nutrient surplus is calculated by subtracting the nutrient outflow from the nutrient inflow. The nutrient inflow consists of the sum of all chemical fertilizers applied to the crops, as well as the total manure produced on the farm. The nutrient outflow consists of both the nutrient uptake of all crops, as well as the farms exported manure (v_manure_export).
where v_chem is the kg of chemical fertilizer applied to crops, v_manure is the total manure produced by all animals of the same category and they both endogenously result by the model. The parameter p_manure is the total quantity of manure per animal produced in one year, and p_fert_withdr denotes the quantity (kg) of fertilizer absorbed per ha of each crop. The variable v_manure_export is the total surplus of manure on the farm by each animal category, which is exported from the farm eventually. The parameter p_fert_anim_no_lossesa, fl represents the nutrient content of the manure, and the two parameters p_lossCorrectionFactor and p_applicationLossCorrectionFactorsfl account respectively for the nutrient loss in stable and storage and during manure spreading.
Pig and poultry farming in NW Germany and N Italy
Our analyses, carried out via a bioeconomic model, aim to be representative of real farms located in an NVZ and, therefore, use the available field level and market level data for N Italy and NW Germany for the assessment of the impacts of several P management policies on farm economic and environmental performances. In order to identify the farm sizes for the different model regions, regional average farm sizes for pig (NUTS 3) and poultry (NUTS 1) farms have been selected from official statistical data from Italy and Germany (Statistiche-BDN, 2020 and Statistisches Bundesamt, 2020). For pigs, regional data on NUTS 3 (small regions) is used, whereas for poultry data on NUTS 1 level is used as higher-resolution data is not published for reasons of data security in Germany. In principle, similar analyses can be applied to other EU countries as well.
The pig meat sector constitutes about 8.5% of the total EU-27 agricultural output and 35% of meat output (Augère-Granier, 2020). In 2019, Germany was the leading pig meat producer among the EU countries with 22% of the meat output, while Italy produced about 6% of the output. A territorial analysis highlights the importance of the Northern regions in Italy, e.g., Piemonte, Emilia-Romagna, Lombardia, and Veneto, which accounted for 64% of the country's LSU and the regions of Niedersachsen, Bayern and Nordrhein-Westfalen in Germany which accounted for 61% of the German farm animal population (Eurostat FSS, 2010). Figures 3, 4 show the pig and poultry densities in terms of the total Livestock Units per ha of land in Italy and Germany. Our analysis focuses only on the NVZ's in the mentioned regions in N Italy and NW Germany because of their livestock density and the associated risk for P loss to the environment.
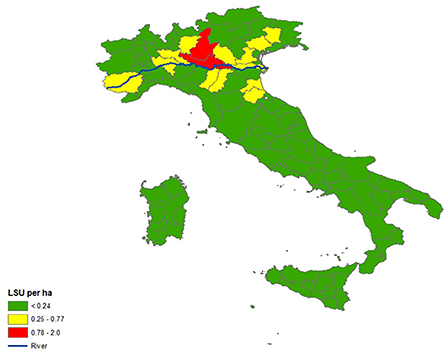
Figure 3. Total livestock unit per ha for pigs and poultry in Italy.
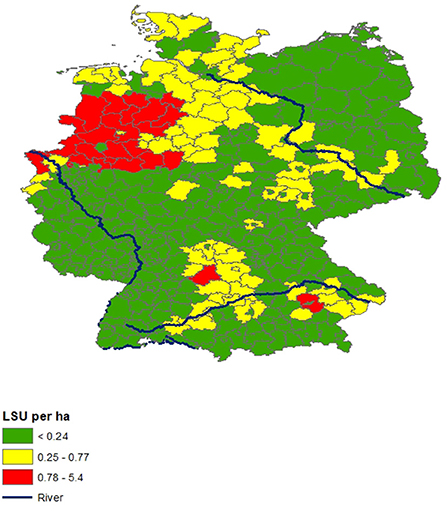
Figure 4. Total livestock unit per ha for pigs and poultry in Germany.
Italian pigs are slaughtered at a higher age of 10–12 months and a higher live weight of 150–170 kg, which leads to a relatively inefficient feeding regime, compared to Germany and other EU countries. Our bioeconomy model assumes a final weight of 160 kg for fattening pigs in Italy, which are mainly used for cured meat products, such as Parma ham, and 122 kg for fattening pigs in Germany, which are mainly used for fresh meat products.
Baseline scenario
The baseline scenario includes only one policy constraint, namely the Nitrates Directive (ND). We assume that the livestock farms have just enough land to comply with the ND which allows a farm to spread 170 kg N per ha per year from manure when the farm is located in an NVZ. While the entire country of Germany falls under the classification of NVZ, most of the Italian area remain outside of NVZs, where farmers are allowed to spread up to 340 kg N per ha. In this paper, we only considered the livestock farms in N Italy that are within the areas designated as NVZs for the sake of comparison with their German counterparts.
Although Germany already regulates P fertilization (BMEL, 2017), our baseline scenario model assumes, for both NW Germany and N Italy, that the Nitrates Directive is the only nutrient related policy implemented in the agricultural sector. The reason for such assumption is to have comparable policy scenarios and comparable bioeconomy model impact assessments. In addition, as our model is a normative model, this assumption does not lead to any model distortion.
Model assumptions
The bioeconomic model uses farm level mathematical programming for assessing impacts of P management policies for four livestock farm specializations: sows, fattening pigs, laying hens and broilers. The constraints presented in a general fashion in Figure 2 are specified for each farm type, including their selection of crop rotation, which furthermore is adapted to conventional cropping practices in the observed regions. All farm types can grow wheat, corn and barley, and the Italian farms, in addition, can also grow sorghum. The farm economic results relate to both livestock and crop production.
The sow farm type represents sow and piglet production. The main revenues of this farm type are due to the sale of live piglets, while other revenues come from selling sows for slaughter at the end of their life cycle. The model assumes that each sow delivers 2.5 litters per year of 10 weaned piglets. The fattening pig farm type assumes piglets are bought on the market at a weight of 30 kg and sold for slaughter once they reach 122 kg (NW Germany) or 160 kg (N Italy). The laying hen farm type gets the main part of their revenues from sale of eggs, while secondary revenues are generated from selling the birds for slaughter at the end of their life cycle. The broiler farm type raises chicken up to 2.3 kg for sale to an abattoir. As fattening pigs and broilers have production cycles of less than 1 year, we account for the multiple production cycles that these farm types realize in 1 year.
For each of the farm types mentioned above, the P balances are calculated per ha per year according to the following two methods:
• German Material Balance (GMB): a German Material Balance for P (hereafter, German P balance) is modeled after the so-called “material balance ordinance” (Stoffstrombilanzverordnung, StoffBilv) in Germany. In simple terms, this balance measures the difference between the influx and efflux of nutrients on the farm. However, in comparison to the principles for calculation of a farmgate balance as presented in Figure 1, the “German P balance” calculation does not consider nutrient losses in housing, storage, processing and field-spreading. In fact, The German calculation method assumes a certain, allowed N loss during housing, storage and field spreading (see Table 1.4 in Appendix) and calculates the difference from this standard loss. This has, due to the mentioned N:P ratio, an importance for the P farmgate balance in scenarios where the ND is the only regulatory measure. Table 1 displays the relevant components and Tables 2–5 present the assumptions for the calculation of the “German P balance” on the influx and efflux side. The different elements on both the influx and efflux side are summed up to a total value, where the difference describes the German balance calculation of the respective nutrient.
• Farmgate Balance (FB): A Farmgate Balance for P is calculated based on the principles shown in Figure 1 and uses the data in Tables 2–5 as pre-conditions, but in addition, it also accounts for the nutrient losses in housing, storage, processing, and field-spreading. Thus, it produces a higher and more realistic balance than the “German P balance”.
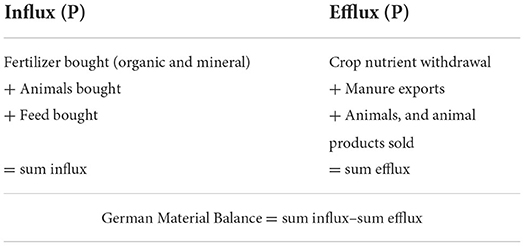
Table 1. The farm gate balance according to the German “material balance ordinance”.
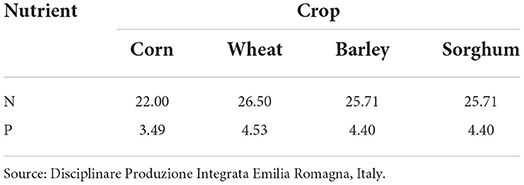
Table 2. Nutrient content in crops, kg per ton.
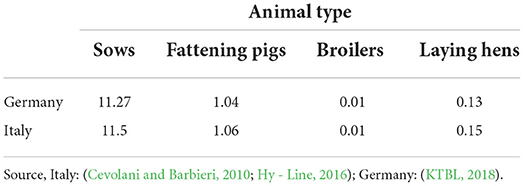
Table 3. P intake from feed, kg per animal place per year.
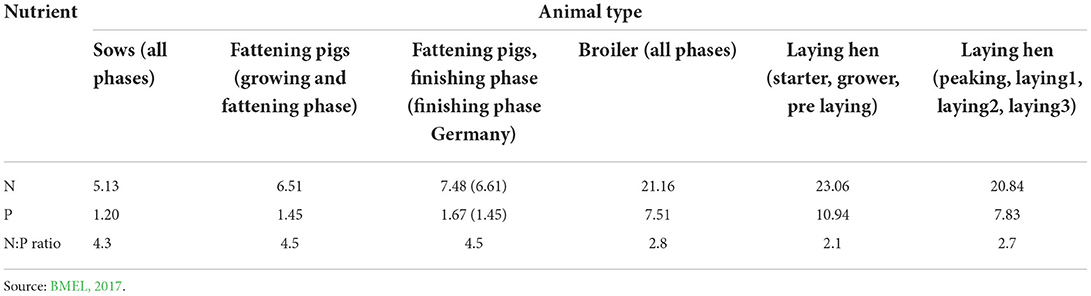
Table 4. Nutrient content, kg per ton, in manure after losses in housing, storage and field spreading.
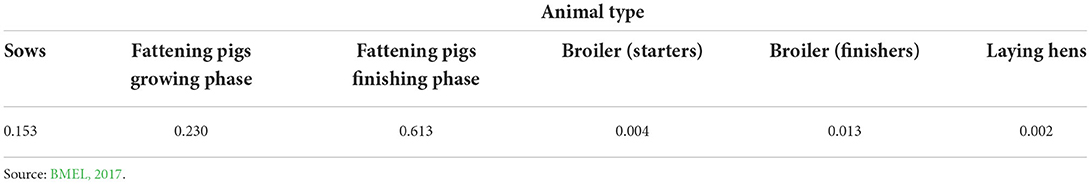
Table 5. P content in animals, kg per ton live weight.
As our model aims to simulate short term responses to the different fertilizer ordinances and scenarios, we made the assumption of fixing herd sizes according to their baseline levels. Some additional pre-conditions used for the bioeconomy model scenario calculations are presented in Appendix 1.
P fertilization policy scenarios
The analyzed P fertilization policy scenarios include implementation of limits on P balances inspired by the 2007 and 2017 German Fertilizer Ordinance which prescribe balances of 8.7 and 4.35 kg P/ha/y (corresponding to 20 and 10 kg phosphate), respectively (Kuhn et al., 2019). The bioeconomic model computes the baseline P balance according to the two methods described in Section Model assumptions and if the baseline P balance exceeds the scenario limits, the excess P is exported from the farms in the form of raw manure at a cost of 12 €/ton or 24 €/ton.
We used two different export prices for manure to assess the economic impact of various scenarios under different market conditions. The choice of a price of 12 €/ton for export of manure was inspired by Kuhn et al. (2019) and it represents the average price of manure on the German market, while 24 €/ton of manure is equal to a normal market price level in the Netherlands (Backus, 2017).
We also ran scenarios where we changed the actual N:P ratio with the aim of assessing whether technologies that reduce the N losses would help to partially address the P surpluses. In some cases, it is economically attractive to export excess P from livestock farms in the form of separation solids. Slurry separation can be done by the use of different separation technologies. Screw pressing is an affordable and uncomplicated slurry separation technology. Using slurry separation has the advantage for the farm that the organic bound nutrients with a low fertilizer value are removed with the separation solids, whereas the mineralised, water soluble and more plant available nutrients remain on the farm to be used as plant fertilizer with effects comparable to that of mineral fertilizers. Studies have shown that, for instance, screw pressing can provide a P separation efficiency while preserving the N fertilizer value in the liquid fractions, thereby making the technique an attractive option in phosphorus vulnerable areas (Pantelopoulos and Aronsson, 2021). The separation scenario assumes that all the manure produced on the farm is separated. We assume separation solids have a volume equal to 20% of the raw manure (AgroTechnologyATLAS, n.d.) and can be disposed of at a cost of 12 €/ton2. It is likewise assumed that separation liquids that remain on the farm have a volume of 80% of the raw manure (Lyons et al., 2021). Slurry separation using screw pressing is adjustable to some extent, meaning that the farm can separate the slurry in a way that ensures the P need of the crops remain in the liquid fraction. Normal separation efficiencies for screw pressing fits well with a situation where the considered farm types would be able to export all excess P as separation solids. Therefore, the separation scenario is a zero P balance scenario. Table 6 provides an overview of the considered scenarios.
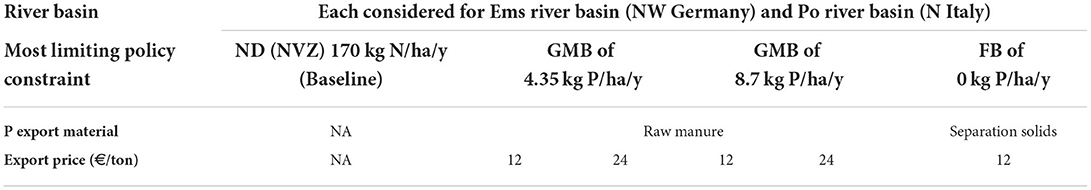
Table 6. Overview of the considered P fertilization policy scenarios.
With reference to Table 6, our scenarios are combinations of 4 farm types, 4 P fertilization policies, 2 river basins, and 2 manure P export prices.
Impacts of P fertilization policies
Resulting P balances
In the Po and Ems River basin where the P fertilization is restricted indirectly via the Nitrates Directive only, the computed P balances using the GMB method are between 7 kg and 36 kg P/ha/y, while the balances range between 7 kg and 54 kg P/ha/y using the FB method. The results for each animal category and for each river basin are reported in Table 7. Several observations follow from Table 7:
- The balances computed using the two methods are quite similar for the sows and laying hens for both the river basins.
- The FB method produces a higher balance for most of the animal categories for the Ems river basin, except for the laying hens. For the laying hens, the balances are quite similar for the two methods.
- The poultry sector produces much higher balance under both computation methods compared to the pig sector.
- The fact that the P balance is higher for the poultry farms compared to the pig farms, is consistent with the expectations, since the N:P ratio in the poultry manure is considerably lower compared to the one in the pig manure—see Table 4.
- The difference between farms of the same type in the two river basins is relatively small.
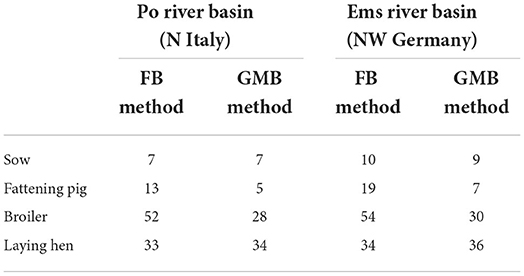
Table 7. Comparison between P balances computed using the FB method and the GMB method in the baseline (kg/ha).
The GMB P balance for the analyzed policy scenarios is set beforehand as 4.35 and 8.7 kg P/ha/y, respectively following the German standard suggested in the Fertilizer Ordinance (2017). The farmgate P balance for the Slurry separation scenario is 0 kg P/ha/y, simply because the separation strength is adjusted so that the amount of P that remains on the farm exactly complies with the P fertilizer needs of the crops.
Noteworthy, as we mentioned in Section Baseline scenario, we set the farmland on each representative farm such that the farm exactly complies with the limit imposed by the ND. Therefore, the farmland in our model strictly depends on the number of animals grown on the farm. This, together with the normalization of the model on a per-hectare basis, makes the resulting nutrient balance independent of the farm size. This allows to assess the impact of the P-regulation given an existing compliance with the ND. With some approximations, the P balance for a given region can thus be found by extrapolating the results in Table 7 in conjunction with total agricultural land and the number of livestock in the region, assuming all livestock farms in such areas fertilize up to the ND-regulated limit of 170 kg N/ha/y in manure.
Economic impacts
The economic impacts of various P management policies are assessed in terms of percentage changes in farm gross margins compared to the baseline. The scenarios do not have any impact on farm revenues, implying that these policies do not affect the output and productivity of the farms. But, to comply with the imposed limits on the P balances, the farms have to either export the excess P as raw manure or as content of separation solids, which in both cases imposes an additional cost to the farm. The impact of the restrictions on the gross margin of most the animal categories is negative, ranging between 0–2 % in the Po valley region and 0–12% for the Ems River basin. Overall, NW Germany farms are impacted more than the N Italy farms in terms of reduction in the gross margin. Results are presented in Table 8.
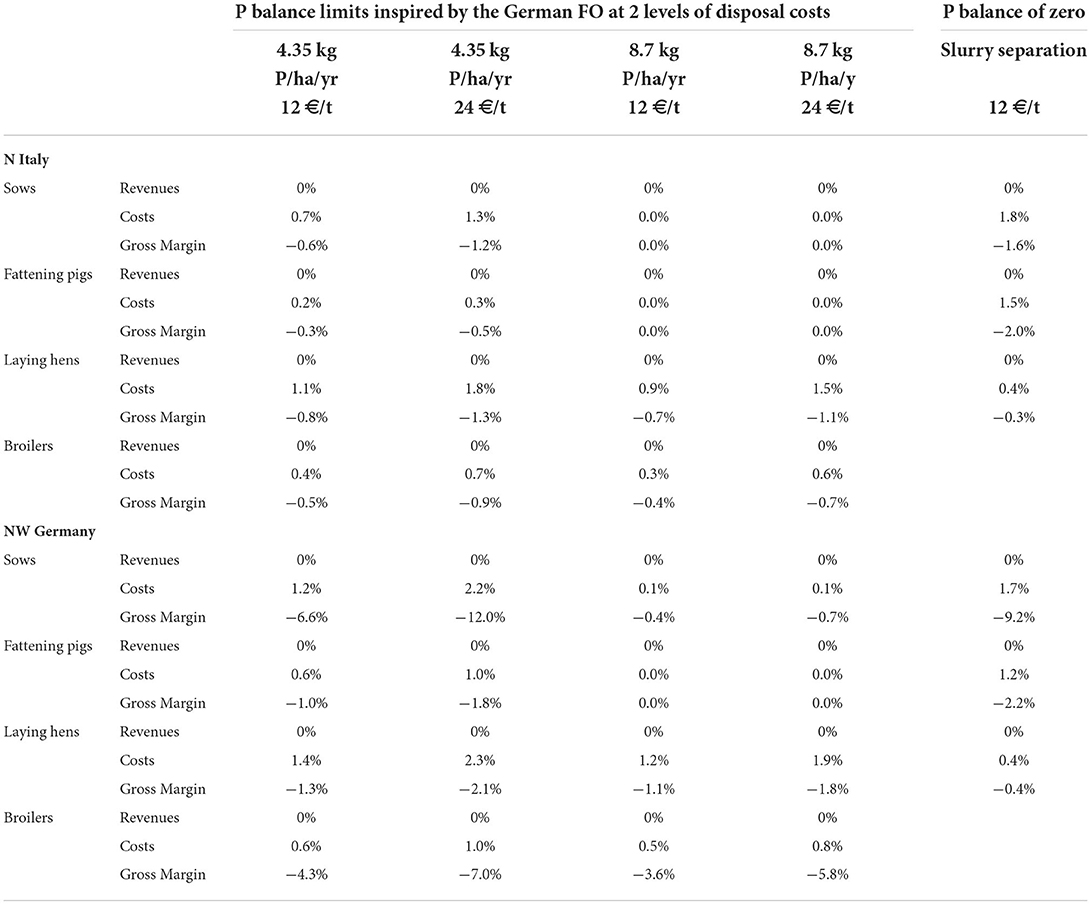
Table 8. Economic impact of considered P balance limits: percentage change compared to the baseline.
Not surprisingly, the stricter P balance limit of 4.35 kg/ha/y with a raw manure export price of 24 € per ton is the most impacting scenario for all farm types. Results show that the sow farms in NW Germany experience the highest loss of gross margin of 12% under this scenario, while their N Italy counterparts face a loss of 1.3% compared to the respective baseline scenarios.
Our results also indicate that, given our model assumptions, achieving a zero P balance using the GMB method through slurry separation has the least economic impact for the poultry farms in both countries compared to the pig farms3. Slurry separation leads to a loss in gross margin in the range of 1.6%−9.2 % for pig farms, while it ranges between 0.3% and 0.4% for laying hen farms.
We also computed the per hectare change in the farm gross margin due to the introduction of the P balance limits (Table 9). We acknowledge that the crop production is not responsible for the drop in the gross margin due to an overproduction of P on the farm, however given the linearity that exists in our model between the number of livestock units and the hectares of farmland, this exercise carries some interesting considerations. As expected, the scenarios with the stricter limit on the P balance and with the highest cost of manure export is the most impacting scenario which leads to a loss of gross margin in the range of 14–96 €/ha for N Italy and 54–110 €/ha for NW Germany. For both regions, the laying hen farms are the most impacted by the policy. The results indicate that for both types of pig farms achieving a balance of 8.7 kg P/ha/yr can be done without any economic loss in N Italy, and at a minimal cost in NW Germany.
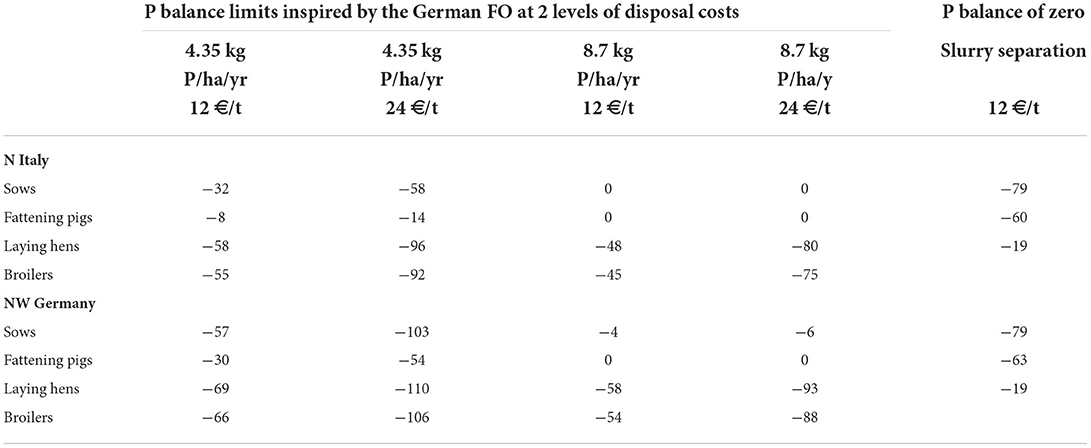
Table 9. Per ha difference in gross margin (€/ha) under various scenarios compared to the baseline.
Impacts on N mineral fertilization
The impact of the analyzed P fertilization policy scenarios on the resulting use of N mineral fertilizer at the representative farms is interesting. Our results suggest that the use of N mineral fertilizer increases when the P balance is restricted by export of manure as assumed in the scenarios based on the German Fertilizer Ordinance, while the application remains the same under the slurry separation scenario.
Limiting the application of manure on farmland by N export in the form of raw manure, resulting in a lower supply of manure N with respect to the crop needs. Conversely, the separation technique allows to concentrate the N content with a high fertilizing effect in the separation liquids, which are still used on the farm. In the Italian representative farm types, the baseline mineral N application is about 126 kg N/ha/y in pig farms and 151 kg N/ha/y in poultry farms. Similarly, for the NW German farms, the baseline application is 108 kg N/ha/y for the pig farms and about 134 kg N/ha/y for the poultry farms. Table 10 reports the baseline use of N fertilizer and the corresponding changes under the P policies analyzed.
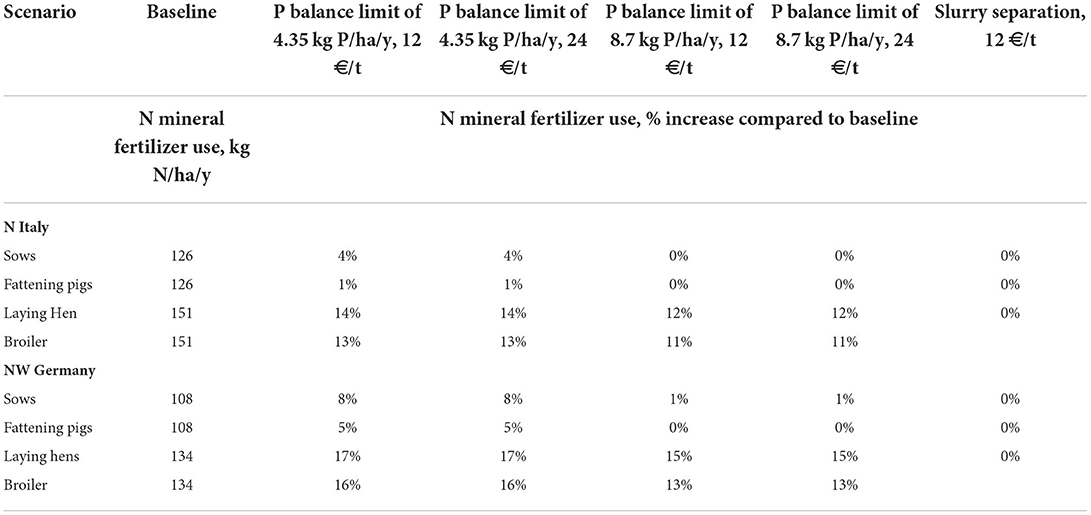
Table 10. Use of mineral N fertilizer: baseline value (kg N) and percentage change in each scenario compared to the baseline.
The results in Table 10 suggest that the implemented P management policies inspired by the German FO has, in most scenarios, the effect that farms would have to use more N mineral fertilizer to compensate for manure N that is exported from the farms in the form of raw manure. This is an expected outcome, the manure N is replaced by chemical N in farms that export manure and chemical N is replaced by manure N in farms that receive the exported manure.
Discussion and conclusions
Our analysis shows that the Nitrates Directive alone is not sufficient to control the soil P balance in pig and poultry farms in N Italy and NW Germany, as indicated by the P balance in the baseline scenario, which is between 7 and 54 kg P per ha. We also report simulations of several scenarios, where policies are combined with market situations, specifically directed toward controlling the P balance and show how the environmentally desirable levels of P balances affects the gross margin of the farmers, which in 13 of 40 considered scenarios that are stronger than indirect ND regulation is 0. This means that stronger P policies can be introduced for the benefit of the environment and EU's dependency in import of critical raw materials without imposing losses/costs on the livestock sector or the society. A key precondition behind our conclusion is the assumption of a well-functioning manure market which ensures that a farmer is able to dispose-off the extra manure P nutrients out of her farm to comply with the nutrient balance restrictions. Another compliance strategy to highlight is the use of slurry separation techniques. A farmer can choose from different separation techniques and transport the separation solids to another arable farm where there is a need for those nutrients. Our results indicate that slurry separation has the least impact on farm gross margin for the poultry farms in both N Italy and NW Germany while achieving the most rigorous environmental target of zero P farmgate balance. For the pig farms, reaching the target of zero P balance through slurry separation is more expensive compared to the scenarios where the farms respond to the limits on P balance by exporting the entire solid excess manure out of the farms.
Our study emphasizes the need for a policy specifically targeting the use of phosphorus in agriculture as an indirect regulation via the ND is insufficient. The need for more rigorous policies to regulate P balance and controlling runoff in agriculture has been emphasized by several studies (Dodd and Sharpley, 2016; Loyon et al., 2016). As noted earlier, some regulatory frameworks exist in the EU, but they do not directly regulate the use of P, specifically its application to cropland as manure. The regulation is mainly enforced through a combination of several legislations. This includes the Nitrates Directive (ND) (91/676/EEC); the Water Framework Directive (WFD) (2000/60/IEC); the Common Agricultural Policy (CAP); and the Integrated Pollution Prevention and Control Directive (IPPC 96/61/EC). Van Grinsven et al. (2016) emphasized the need of coordination between these policies to reach targets in a cost-effective way. Moreover, coordination between the national ministries is required for the implementation of the ND, WFD and CAP (Mohaupt et al., 2007). The problem of conflicting interests between ministries, notably agriculture, water, environment prevails in many countries. The approaches taken by different countries at the national and regional levels vary depending on the focus areas or hotspots (vulnerable zones). For instance, in compliance with the requirements of the ND, farmers in the Netherlands sow catch crops after harvest while farmers in Flanders, Belgium, are paid through CAP to sow catch crops under the agri-environmental scheme (European Court of Auditors, 2008; Bozzini and Hunt, 2015). The above account reveals aspects of the different policy styles adopted and policy instruments implemented by different countries. Wiering et al. (2020) broadly categorize the nature of measures taken in a country into source-based measures pertaining to the implementation of ND and WFD or effect-oriented measures in the implementation of the IPPC and BAT. These are implemented as voluntary or mandatory measures.
Our study presents some limitations. First, it develops a farm-level model for representative farms, thus, not accounting for the heterogeneity in farm characteristics. The use of representative farms is a common practice in the programming models at the cost of losing the relationship between the policy impact and the farm characteristics. Second, we assume that a farm can dispose all the excess of manure on the manure market within a cost range 12–24 €/ton. This cost assumption restricts the manure disposal within a certain distance from the farm. This assumption is reasonable if in the area where the farm is located there is a balance between the number of livestock farms (that need to dispose of manure or separation solids) and the number of non-livestock farms (that can receive manure or separation solids and spread it on their land). The transport of manure over long distance is not feasible, thus the satisfaction of this assumption is required to make our results valid and reliable. Third, our model is in a static fashion, it does not model investment dynamics. When we simulate manure separation scenario, we assume that the technology is already adopted (i.e., only partly accounting for the investment planning and decision). In a dynamic fashion, one may be interested in finding the minimum farm size to make the investment in separation technology economically viable. In addition, we may also consider that a group of nearby livestock farms make the slurry separation investment together and therefore, they share the cost of the investment.
Data availability statement
The original contributions presented in the study are included in the article/Supplementary material, further inquiries can be directed to the corresponding author.
Ethics statement
Ethical review and approval was not required for the animal study because we use secondary data published in agricultural handbooks and expert suggestions. We have not done any direct work with animals.
Author contributions
The manuscript was developed as part of an ERA-Net project (www.pegasus.fbndummerstorf.de). AR and PS conceived and designed the research. LA, AC, HF, and CP worked on the model. LA, AC, NE, and HF drafted the paper. LA, AC, NE, HF, CP, AR, and PS edited and revised the manuscript and approved the final version of the manuscript.
Funding
This project received funding from the European Research Association Networks (ERA-NETs) Cofunds Sustainable Animal Production (SusAn) as part of the PEGaSus project (2817ERA02D).
Acknowledgments
The authors acknowledge the valuable inputs from colleagues of the PEGaSus project.
Conflict of interest
The authors declare that the research was conducted in the absence of any commercial or financial relationships that could be construed as a potential conflict of interest.
Publisher's note
All claims expressed in this article are solely those of the authors and do not necessarily represent those of their affiliated organizations, or those of the publisher, the editors and the reviewers. Any product that may be evaluated in this article, or claim that may be made by its manufacturer, is not guaranteed or endorsed by the publisher.
Supplementary material
The Supplementary Material for this article can be found online at: https://www.frontiersin.org/articles/10.3389/fsufs.2022.852887/full#supplementary-material
Footnotes
1. ^https://ec.europa.eu/eurostat/statistics-explained/index.php?title=Glossary:Livestock_unit_(LSU)
2. ^It is difficult to document a market price for separation solids for pigs and poultry. Kröger and Theuvsen (2013) record a transportation cost of cattle slurry ranging between 10 €/ton and 21 €/ton depending on distance.
3. ^It should be noted that, for poultry, separation of manure from only laying hens is relevant in case of production systems that deliver liquid manure, or where there is a liquefication happening beforehand in case the livestock farm has a biogas plant. For the same reason, the bioeconomic model calculations exclude slurry separation for broiler production, considering this always delivers solid manure in the form of litter.
References
AgroTechnologyATLAS. (n.d.). Available online at: https://www.agrotechnologyatlas.eu/techdescs?techgroup=400 (accessed August 31, 2022)..
Alexandratos, N., and Bruinsma, J. (2012). World agriculture towards 2030/2050: The 2012 Revision. Rome: FAO.
Augère-Granier, M. L. (2020). The EU Pig Meat Sector. EPRS Briefings. European Parliament: European Parliamentary Research Service (EPRS), European Union. Available online at: https://www.europarl.europa.eu/RegData/etudes/BRIE/2020/652044/EPRS_BRI(2020)652044_EN.pdf (accessed September 14, 2022).
Backus, G. B. (2017). Manure Management: An Overview and Assessment of Policy Instruments in the Netherlands. World Bank, Washington D.C. doi: 10.1596/29250
BMEL (2017). Verordnung über die Anwendung von Düngemitteln, Bodenhilfsstoffen,Kultursubstraten und Pflanzenhilfsmitteln nach den Grundsätzen der guten fa-chlichen Praxis. Federal Ministry of Food and Agriculture. Available online at: http://www.gesetze-im-internet.de/d_v_2017/index.html (accessed November 14, 2020).
Bozzini, E., and Hunt, J. (2015). Bringing evaluation into the policy cycle: CAP cross compliance and the defining and re-defining of objectives and indicators. Euro. J. Risk Regulat. 6, 57–67.
Dodd, R. J., and Sharpley, A. N. (2016). Conservation practice effectiveness and adoption: Unintended consequences and implications for sustainable phosphorus management. Nutr. Cycling Agroecosys. 104, 373–392. doi: 10.1007/s10705-015-9748-8
European Commission (2020a). Critical Raw Materials Resilience: Charting a Path towards greater Security and Sustainability. Brussels.
European Commission (2020b). Communication from the Commission to the European Parliament, the Council, the European Economic and Social Committee and the Committee of the Regions: A Farm to Fork Strategy for a fair, healthy and environmentally-friendly food system. COM/2020/381 final. Available online at: https://ec.europa.eu/info/sites/info/files/communication-annex-farm-fork-green-deal_en.pdf (accessed September 14, 2022).
European Court of Auditors (2008). Is Cross-Compliance an Effective Policy? European Court of AuditorsSpecial Report No 8.
Eurostat FSS (2010). Available online at: https://ec.europa.eu/eurostat (accessed June, 2021).
Foged, H. (2021). “CNP Flows Interactive Model” For Illustrating Impacts of Policy Scenarios On The Entire Manure / Crop / Feed Cycle and Forming Basis for Executing Good Governance. Available online at: http://dx.doi.org/10.13140/RG.2.2.18312.14088.
German Fertilizer Ordinance. (2017). Verordnung über den Umgang mit Nährstoffen im Betrieb und betrieblichen Stoffstrombilanzen: Stoffstrombilanzverordnung. Available online at: https://www.bmel.de/SharedDocs/Downloads/DE/_Landwirtschaft/Pflanzenbau/DueV-Englisch.pdf?__blob=publicationFile&v=2 (accessed September 14, 2022).
Granstedt, A., Seuri, P., and Thomsson, O. (2004). Effective Recycling Agriculture Around the Baltic Sea: Background report.
HELCOM (2019). Sufficiency of Measures Analysis to Support the HELCOM BSAP Update. HELCOM Secretariat and HELCOM ACTION project, December 2019, 7.
Kröger, R., and Theuvsen, L. (2013). Separation of cattle slurry: Technical solutions und economic aspects. In First International Conference on Resource Efficiency in Interorganizational Networks–ResEff., 453–464.
KTBL. (2018). Betriebsplanung Landwirtschaft 2018/19 Daten für die Betriebsplanung in der Landwirtschaft. Kuratorium für Technik und Bauwesen in der Landwirtschaft, Darmstadt.
Kuhn, T., Schäfer, D., Holm-Müller, K., and Britz, W. (2019). On-farm compliance costs with the EU-Nitrates Directive: a modelling approach for specialized livestock production in northwest Germany. Agric. Sys. 173, 233–243. doi: 10.1016/j.agsy.2019.02.017
Loyon, L., Burton, C., Misselbrook, T., Webb, J., Philippe, F., Aguilar, M., et al. (2016). Best available technology for European livestock farms: availability, effectiveness and uptake. J. Environ. Manag. 166, 1–11. doi: 10.1016/j.jenvman.2015.09.046
Lyons, G. A., Cathcart, A., Frost, J. P., Wills, M., Johnston, C., Ramsey, R., et al. (2021). Review of two mechanical separation technologies for the sustainable management of agricultural phosphorus in nutrient-vulnerable zones. Agronomy 11, 836. doi: 10.3390/agronomy11050836
Mohaupt, V., Crosnier, G., Todd, R., Petersen, P., and Dworak, T. (2007). WFD and agriculture activity of the EU: first linkages between the CAP and the WFD at EU Level. Water Sci. Technol. 56, 163–170. doi: 10.2166/wst.2007.448
Norton, R. D., and Hazell, P. B. (1986). Mathematical Programming for Economic Analysis in Agriculture. New York, NY, USA: Macmillan.
Pantelopoulos, A., and Aronsson, H. (2021). Two-stage separation and acidification of pig slurry–nutrient separation efficiency and agronomical implications. J. Environ. Manage. 280, 111653. doi: 10.1016/j.jenvman.2020.111653
Peyraud, J. L., and MacLeod, M. (2020). Future of EU Livestock—How to Contribute to a Sustainable Agricultural Sector. Final Report. Brussels, Belgium: Directorate-General for Agriculture and Rural Development (European Commission), 82.
Santonja, G. G., Georgitzikis, K., Scalet, B. M., Montobbio, P., Roudier, S., and Sancho, L. D. (2017). Best available techniques (BAT) reference document for the intensive rearing of poultry or pigs. EUR 28674 EN 11, 898. doi: 10.2760/020485
Scholz, R. W. (2013). EC Consultative Communication on the Sustainable Use of Phosphorus Communication from The Commission to the European Parliament, The Council, the European Economic and Social Committee and The Committee of the Regions.
Statistiche-BDN (2020). Available online at: https://www.vetinfo.it/j6_statistiche/#/ (accessed June 25, 2020).
Statistisches Bundesamt (2020). Land-und Forstwirtschaft, Tiere und tierische Erzeugung. Fachserie 3, Reihe 2.4, Wiesbaden.
Tiquia, S. M., Richard, T. L., and Honeyman, M. S. (2002). Carbon, nutrient, and mass loss during composting. Nutr. Cycling Agroecosys. 62, 15–24. doi: 10.1023/A:1015137922816
Van Grinsven, H. J., Tiktak, A., and Rougoor, C. W. (2016). Evaluation of the Dutch implementation of the nitrates directive, the water framework directive and the national emission ceilings directive. NJAS: Wageningen J. Life Sci. 78, 69–84. doi: 10.1016/j.njas.2016.03.010
Wiering, M., Liefferink, D., Boezeman, D., Kaufmann, M., Crabbé, A., and Kurstjens, N. (2020). The wicked problem the water framework directive cannot solve. The Governance approach in dealing with pollution of nutrients in surface water in the Netherlands, Flanders, Lower Saxony, Denmark and Ireland. Water 12, 1240. doi: 10.3390/w12051240
Keywords: pig, poultry, livestock manure, phosphorus, regulation, bioeconomy, fertilization, policies
Citation: Arata L, Chakrabarti A, Ekane N, Foged HL, Pahmeyer C, Rosemarin A and Sckokai P (2022) Assessment of environmental and farm business impacts of phosphorus policies in two European regions. Front. Sustain. Food Syst. 6:852887. doi: 10.3389/fsufs.2022.852887
Received: 11 January 2022; Accepted: 08 September 2022;
Published: 26 September 2022.
Edited by:
John J. Classen, North Carolina State University, United StatesReviewed by:
Michele Donati, University of Parma, ItalyKelly Zering, North Carolina State University, United States
Copyright © 2022 Arata, Chakrabarti, Ekane, Foged, Pahmeyer, Rosemarin and Sckokai. This is an open-access article distributed under the terms of the Creative Commons Attribution License (CC BY). The use, distribution or reproduction in other forums is permitted, provided the original author(s) and the copyright owner(s) are credited and that the original publication in this journal is cited, in accordance with accepted academic practice. No use, distribution or reproduction is permitted which does not comply with these terms.
*Correspondence: Anwesha Chakrabarti, anwesha.chakrabarti@unicatt.it