Evaluation of fatty acid and antioxidant variation in a complex pasture system as compared to standard cattle feed in the Great Lakes region
 Lucas Krusinski1
  Isabella C. de Faria Maciel2
  Selin Sergin1
  Travis Goeden1
  Humza Ali1 Srikar Kesamneni1
  Vijayashree Jambunathan1
  Kimberly A. Cassida3 Sukhdeep Singh3
  Ilce G. Medina-Meza4
  Jason E. Rowntree2
  Jenifer I. Fenton1*
- 1Department of Food Science and Human Nutrition, Michigan State University, East Lansing, MI, United States
- 2Department of Animal Science, Michigan State University, East Lansing, MI, United States
- 3Department of Plant, Soil and Microbial Sciences, Michigan State University, East Lansing, MI, United States
- 4Department of Biosystems and Agricultural Engineering, Michigan State University, East Lansing, MI, United States
As the demand for grass-fed ruminant products keeps increasing, more data are needed to assess the nutritional value of feedstuffs, especially pastures. In addition, global climate change adds another challenge to the management of grasslands with projections of changing temperature and precipitation patterns. Consequently, the variations in bioactive compounds such as fatty acids and antioxidants in feeds will be harder to predict. Therefore, it is critical to report region and time-specific results of the nutritional value of feeds intended for ruminant nutrition. The objectives of this study were to compare the antioxidant and fatty acid content of commonly used feedstuffs including a complex pasture mixture from the Great Lakes Region and a traditional grain-based diet, and to assess the variations of these bioactive compounds in the pasture over the course of two grazing seasons. Weather parameters including temperature and rainfall were recorded for the length of the study. Feed samples were collected between June and September 2019 and 2020 and analyzed for nutrient composition, chlorophyll A and B, carotenoids, and total phenols. Fatty acids were analyzed by GC-MS. Correlations were reported to analyze the relationship between individual plant species, antioxidants, and fatty acids. We observed higher antioxidant parameters in the pasture compared to the grain diet. Total polyunsaturated fatty acids were higher in the pasture including α-linolenic acid while the grain diet was higher in n-6 polyunsaturated fatty acids including linoleic acid. The n-6:n-3 ratio was more beneficial in the pasture and was 50–90 times higher in the grain diet. Variations in the fatty acid profile of the pasture were observed and varied between 2019 and 2020. Plant growth cycles, climatic conditions, and grazing methods were hypothesized to cause these changes. Altogether, this study increased our knowledge about the nutritional value of feedstuffs and will help ranchers and researchers to better understand the variations of bioactive content based on region, season, and climatic conditions.
Introduction
Grass-fed beef (GFB) is growing in popularity among health and environmentally conscious consumers (Daley et al., 2010; Alothman et al., 2019). The composition of cattle feeds directly impacts the nutrient density of ruminant products (Daley et al., 2010). GFB primarily consume grass forages with hay and other supplementation, while grain-fed cattle predominately consume a diet based on corn and soy in the finishing phase (Gwin, 2009). Grain-finishing cattle is the most common practice, despite GFB having a longer shelf-life and a nutrient profile favoring human health (Gwin, 2009; Provenza et al., 2019; Jain et al., 2020). GFB typically has lower total fat, a lower n-6:n-3 ratio, and higher vitamin and mineral content (Daley et al., 2010). However, a recent survey of GFB demonstrated wide variations in the lipid and micronutrient profile. The n-6:n-3 ratio ranged from 1.8 to 28.3 (Bronkema et al., 2019). Thus, it is important to characterize the composition of cattle diets due to its impact on the nutritional profile of meat.
Grain-based diets have high starch and energy contents, reducing the biohydrogenation rates of unsaturated fatty acids (FAs) (Hatew et al., 2016; Alothman et al., 2019). Grain-based diets, primarily composed of seeds, contain higher concentrations of n-6 polyunsaturated fatty acids (PUFAs) and saturated FAs (SFA) and lower amounts of phenolic compounds and antioxidants compared to forages (Butler, 2014; Alothman et al., 2019). In grasses, there is a strong positive correlation between chlorophyll A and B and C18:3 n-3 (ALA) (Khan et al., 2012). Green forages also contain fat-soluble vitamins with antioxidant properties such as vitamin E and carotenoids (Elgersma et al., 2013). The consumption of complex pastures often results in higher concentrations of vitamins and minerals in GFB (Jain et al., 2020). Nutritional composition of feedstuffs depends on plant maturity and development, conservation method, cutting date, plant species, geography, climate, soil, weather, and light exposure (Dewhurst et al., 2001; Khan et al., 2009; Garcia et al., 2016).
The climate is changing across the world, largely because of anthropogenic activities (Hopkins and Del Prado, 2007; Hatfield et al., 2011; Giridhar and Samireddypalle, 2015). Climate change affects livestock productivity directly and indirectly by modifying the availability and the quality of forages (Giridhar and Samireddypalle, 2015). Key indicators of climate change such as increased mean temperatures, changes in precipitation patterns, and floods occurring more often are triggered by land-use changes (Hopkins and Del Prado, 2007). Climate change impacts grasslands by changing the composition of pastures (e.g., changes in the ratio of grasses to legumes), changing grass growth and quality, and modifying precipitation occurrence (Hopkins and Del Prado, 2007; Giridhar and Samireddypalle, 2015). To complicate this issue, the impacts are dependent on geographic location. Rising temperatures and altered precipitation may have positive or negative impacts on forage availability and quality depending on the specific location (Hatfield et al., 2011). Because of this region-specificity, there is an increased need for predictive capacity as the world's ecosystems are changing (Van Oijen et al., 2018).
Part of adaptation strategies include prioritizing biodiverse pastures since pasture diversity may be crucial for the long-term resilience of ecosystems (Van Oijen et al., 2018). Integrated systems involving various plant species and herbivores may remain more productive in variable climatic conditions, and thus be better equipped to adapt to climate change (Izaurralde et al., 2011). Since changes in forage quantity are straightforward to assess, gaining more knowledge about changes in forage nutritional quality is crucial (Berauer et al., 2020). Therefore, the objectives of this study were to compare the nutrient composition, antioxidant, and FA profile of a traditional grain-based diet and a complex Michigan pasture mixture across the grazing season, and to provide region- and time-specific data to farmers and ranchers from the Great Lakes region.
Materials and methods
All chemicals were purchased from Sigma-Aldrich (St. Louis, MO) unless otherwise noted.
Experimental design and diet characteristics
The study was conducted at Michigan State University Upper Peninsula Research and Extension Center (latitude: 46°20'N, longitude: 86°55'W; elevation: 271 m) located in Chatham, MI. A total mixed feedlot ration (GRAIN) and a mixed-species pasture forage (PAST) were collected between June and September 2019 (n = 15 and n = 21 respectively) and June and September 2020 (n = 10 and n = 24 respectively). For 2019, GRAIN samples consisted of 20% hay, 50% dry corn, 24% high moisture corn, and 6% pellet. For 2020, GRAIN samples were constituted of 20% hay, 74% dry corn, and 6% pellet. Pellets were identical for both years and contained 36% crude protein (n536, Kalmbach Feeds, INC. Upper Sandusky, Ohio). The botanical composition of the diets was reported by Maciel et al. (2021). The pasture consisted of an established mixed forage. The prevalent plant species on this research site included meadow fescue (Schedonorus pratensis (Huds.) P. Beauv.), red clover (Trifolium pratense L.), timothy grass (Phleum pratense), alfalfa (Medicago sativa), white clover (Trifolium repens L.), birdsfoot trefoil (Lotus corniculatus), chicory (Cichorium intybus), orchardgrass (Dactylis glomerata L.), and dandelion (Taraxacum oficinale L.). The monthly botanical composition of the PAST diet is shown in Figure 1.
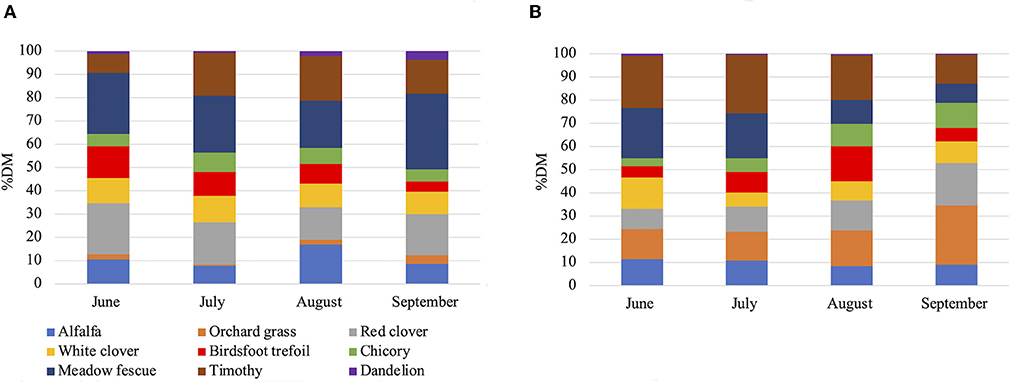
Figure 1. Monthly botanical composition of the pasture in 2019 (A) and 2020 (B) in percentage of dry matter. DM, dry matter.
Collection
PAST samples were collected every 2 weeks in each sub-paddock in pre- grazing areas, immediately before steers were allowed access to fresh forage. The grazing period lasted 80 days in 2019 and 121 days in 2020. Experimental design and animal management were shared with Maciel et al. (2021). Briefly, PAST samples were collected by randomly clipping three 0.25 m2 quadrats to a 5 cm stubble using Gardena 8803 (Ulm, Germany) battery-operated harvest shears. GRAIN samples were sampled every 2 weeks from the mixers from three different pens. At the end of each month, samples collected every 2 weeks were mixed and composited by group. GRAIN samples were expected to have less variations over time. Therefore, we decided to composite GRAIN samples and record less time points. Botanical composition was determined monthly as described by Maciel et al. (2021).
For proximate analysis, wet weights were recorded, and samples were dried at 55 °C in a forced-air oven for 72 h and ground through a 1 mm screen using a Wiley mill (Arthur H. Thomas, Philadelphia, PA) before undergoing subsequent analysis. For FA and antioxidant analysis, a 30 g subsample was taken, packed in a whirl pack bag (air manually removed), and frozen at −20 °C immediately after collection when arriving in the laboratory. To ensure representative PAST samples, 10 g of each replicate was taken by thoroughly mixing the bag content before being combined. Samples spent at most 100 days at −20 °C and were then stored at −80 °C. Before analysis, samples were freeze-dried in a Harvest Right Home Freeze Dryer Large (Harvest Right, North Salt Lake, UT) for 18.5 h, and ground through a 1 mm screen using a Wiley mill (Arthur H. Thomas, Philadelphia, PA) with dry ice. Samples were flushed under nitrogen before undergoing subsequent analysis.
Temperature, precipitation, and growing degree days (GDD) were recorded for the period of the study using the Michigan State University Enviroweather platform at the Chatham, MI weather station. GDD is a useful measurement that represents changes in temperature related to different phases of plant development and refers to the accumulation of heat during the growth of the plant. It can also be an indicator of climate change on plants (Anandhi, 2016). The Baskerville-Emin method with a base temperature of 4 °C was used to calculate GDD. 30-year normal temperature and precipitation (1991-2020) were reported using the National Centers for Environmental Information: National Oceanic and Atmospheric Administration website which records U.S. climate normals in Chatham, MI. Weather conditions were averaged to obtain monthly data for the length of the study.
Proximate analysis for nutritive value of diets
Proximate analysis was performed as described by Maciel et al. (2021). Feed samples were analyzed for ash, neutral detergent fiber (NDF), acid detergent fiber (ADF), crude protein (CP), and gross energy. Briefly, all nutrients were expressed as percentages of dry matter (DM), determined by drying at 105 °C in a forced-air oven for at least 8 h. Ash content was determined after 6 h of oxidation at 500 °C in a muffle furnace. Neutral detergent fiber was analyzed according to Mertens (2002) with the inclusion of amylase and sodium sulfite. Acid detergent fiber was analyzed according to Aoac (2000). Crude protein was determined according to Hach et al. (1987). Gross energy was determined by bomb calorimeter, and net energy values were estimated according to Belyea and Ricketts (1993) using the following conversion equations:
Chlorophyll and carotenoid analysis
Chlorophyll A, chlorophyll B, and total carotenoids were determined as described by Lichtenthaler and Wellburn (1983). Briefly, 2 g of lyophilized feed powder was combined with 70% aqueous acetone, shaken for 30 min, and centrifuged for 20 min (2500 RPM, 4 °C). The supernatant was recovered into a new tube, and extraction was repeated twice. Carotenoid and chlorophyll content of the extracted samples were measured using a UV-Vis Double Beam Spectrophotometer (VWR, Radnor, PA) in cuvettes. The absorbance was recorded at three wavelengths (663, 646, and 470 nm) and used to calculate chlorophyll A, chlorophyll B, and total carotenoids as follows:
Phenolic analysis
A modified method from Nimalaratne et al. (2011) was used to extract phenolic compounds. Briefly, 2 g of lyophilized feed powder was added to 20 mL methanol:distilled water:acetic acid (70:28:2, v/v/v). The tube was shaken for 30 min and then centrifuged for 20 min (2500 RPM, 4 °C). The supernatant was transferred to a new tube. A second solution of 20 mL acetone:distilled water:acetic acid (70:28:2, v/v/v) was added to the original tube. The original tube was shaken again for 10 min and centrifuged for 15 min (2500 RPM, 4 °C). The supernatants were combined and stored at 4 °C until analysis.
The Folin-Ciocalteu assay modified from Singleton and Rossi (1965) was used to quantify total phenolic content (TPC). A gallic acid standard curve was made from a 1 mg/mL gallic acid standard stock solution in methanol, followed by a serial dilution by a factor of two to obtain concentrations ranging from 1 mg/mL to 0.002 mg/mL. Then, 100 μL Folin-Ciocalteu reagent and 800 μL 5% sodium bicarbonate were added to the standard curve and to a 100 μL portion of supernatant. The standard curve and the samples were then heated at 40 °C for 30 min and cooled at room temperature for 10 min. Cooled samples were plated in triplicate in a 96-well plate, scanned at 765 nm, compared against the gallic acid standard curve, and reported as mg of gallic acid equivalents/g of feed.
Fatty acid analysis
A modified version of the microwave assisted extraction (MAE) method described by Bronkema et al. (2019) was used to extract FAs from feed samples using the CEM Mars 6 microwave digestion system, equipped with a 24-vessel rotor and GlassChem vessel set (CEM Corporation, Matthews, NC). This method was also described by Sergin et al. (2021). Briefly, 400 mg of lyophilized feed sample was added to a microwave vessel with 8 mL of 4:1 (v/v) solution of ethyl acetate:methanol and 0.1% butylated hydroxytoluene (BHT) as an antioxidant. FAs were extracted using the following microwave parameters: 55 °C for 15 min with initial ramp of 2 min at 400 W maximum power. Vessel contents were filtered using Whatman lipid free filters (Grade 597) (Weber Scientific; Hamilton, NJ) into a test tube containing 3.5 mL HPLC water. Samples were centrifuged at 2500 RPM for 6 min, and the top organic layer was transferred to a new tube and dried under nitrogen. Extracted oil was resuspended in 4:1 (v/v) dichloromethane:methanol with 0.1% BHT to bring each sample to 20 mg oil/mL. Dichloromethane was purchased from VWR Chemicals (Radnor, PA).
For the creation of fatty acid methyl esters (FAME), a modified methylation described by Jenkins (2010) was conducted. Two mg of suspended oil (100 mL) was aliquoted from each sample, dried under nitrogen, and resuspended in toluene with 20 μg of internal standard (methyl 12-tridecenoate, U-35M, Nu-Chek Prep, Elysian, MN). Two mL of 0.5 N anhydrous potassium methoxide was added and samples were heated at 50 °C for 10 min. Once cool, 3 mL of 5% methanolic HCl was added, and samples were heated at 80 °C for 10 min. Once cool, 2 mL of water and 2 mL hexane were added, samples were centrifuged (2500 RPM at room temperature for 5 min), and the upper organic phase was removed and dried to obtain FAMEs. FAMEs were suspended in 1 mL isooctane to reach a concentration of 2 mg/mL and transferred to GC-MS vials with glass inserts.
One μL of methylated sample was injected in a PerkinElmer (Waltham, MA) 680/600S GC-MS in the electron impact mode (70 eV) equipped with an Agilent Technologies (Santa Clara, CA) HP-88 column (100 m, 0.25 mm ID, 0.2 μM film thickness) for FAME quantification. Injection temperature was set at 250 °C, and the GC temperature parameters were as follows: initial temperature at 80 °C for 4 min; ramp 13.0 °C/min to 175 °C; hold 27 min; ramp 4.0 °C/min to 215 °C; hold 35 min modified from Kramer et al. (2008) previously used for improved separation of FA isomers in beef and dairy products. Helium was used as the carrier gas at a flow rate of 1 mL/min. The MS data were recorded in full scan mode (mass range of m/z 70–400 amu). MS transfer line and ion source temperature were set at 180 °C.
For identification of FAMEs, data analysis was conducted using MassLynx V4.1 SCN 714 (Waters Corporation, Milford, MA). FAs were identified by retention time and EI mass fragmentation in comparison to that of our reference standard. Our GC-MS reference standard was created by using the Supelco 37 Component FAME Mix (Sigma-Aldrich, St. Louis, MO). Fatty acids were analyzed using extracted ion chromatograms of the respective quantitative ions. Fatty acids not included in the reference standard were identified according to elution order reported in literature and confirmed by the EI mass fragmentation (Kramer et al., 2008). Identification of retention times, mass fragmentation, and quantitative ions used are outlined in Supplementary Table S1. For quantification of FAMEs, we utilized a standard curve including our reference and internal standards. The internal standard peak area and analyte peak area relative to the standard curve were used to calculate each FAME concentration. Fatty acids were reported as g/100 g FA quantified.
Statistical analysis
Data from the carotenoid and phenolic analyses were analyzed for their statistical significance using Prism v7.0d for Mac OS X (GraphPad Software, La Jolla, CA) to perform unpaired t-tests. Data from the fatty acid analysis were analyzed using RStudio v1.4.1103. Individual nutrients were analyzed separately for the 2 years after checking for year effect using unpaired t-tests. Treatment significance by date was checked using one-way ANOVA and mean comparison was performed using Tukey's HSD, correcting for multiple comparisons. When included, sampling date was the fixed factor in the ANOVA. Values below the lower limit of detection were treated as zeroes in analysis. Statistical significance for all analyses was set at P < 0.05. Correlations between individual plant species, weather, antioxidants, and selected FAs were assessed using Pearson correlations and graphically displayed using the R package corrplot. Only results with P < 0.05 were shown in the correlation matrix. Weather conditions, antioxidants, and FAs were averaged by month to match the monthly botanical composition data. August 2019 was removed since no sample collection occurred at that time.
Results
Weather conditions and nutritive quality of the diets
The weather conditions for the length of the study are displayed in Figure 2. July was the warmest month in both years. The coldest temperatures were recorded in September. No abnormal trends regarding the average temperatures for the length of the study were observed. Regarding precipitation, notable differences were seen between 2019 and 2020. The highest levels of precipitation were seen in September 2019 and in July 2020. The lowest levels of precipitation were observed in July 2019 and in September 2020. On average, precipitation levels were higher in 2020 compared to 2019.
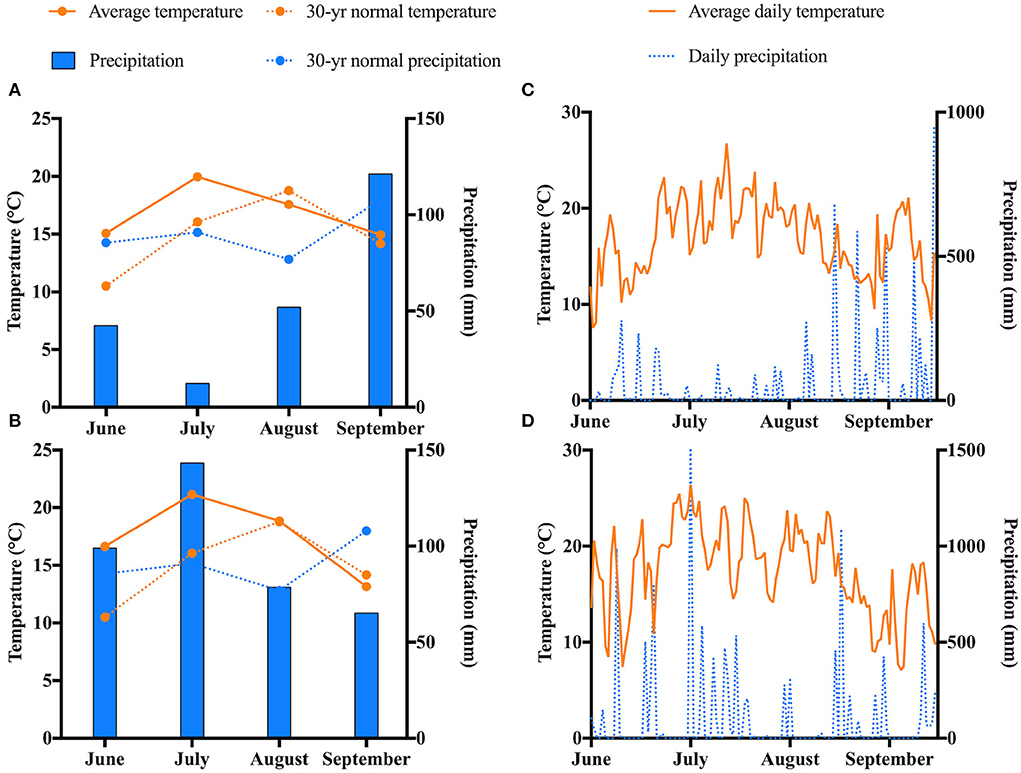
Figure 2. Weather trends at the experimental site in Chatham, MI for the duration of the study. Monthly weather in (A) 2019 and (B) 2020. Daily weather in (C) 2019 and (D) 2020.
The nutritive values of the diets are shown in Table 1. Dry matter was higher for the GRAIN diet compared to PAST. Overall values for DM were higher in 2020 compared to 2019. Crude protein, NDF, ADF, and gross energy values were higher for the PAST diet in both years. Total FAs were higher in the GRAIN diet in both years compared to the PAST diet.
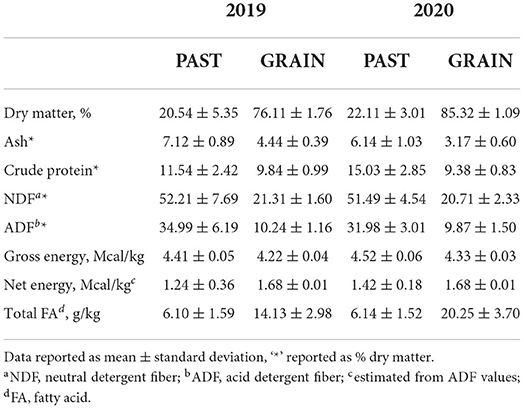
Table 1. Nutritive value of the diets.
Chlorophyll, carotenoid, and phenolic content of the diets
The phytochemical composition of the diets is depicted in Table 2. Significant differences of all antioxidant parameters assessed in this study demonstrated the rich antioxidant profile found in PAST compared to GRAIN. Chlorophyll A and chlorophyll B were found in higher concentrations in PAST samples compared to GRAIN samples in both years (P < 0.001). Chlorophyll B levels increased from 2019 to 2020 in PAST samples (28.30 vs. 111.10 μg/g, respectively). Total carotenoids were also higher in PAST samples compared to GRAIN samples in both years (P < 0.001). Total phenols were found in higher amounts in PAST samples in 2019 (4.44 vs. 2.91 mg GAE/g, P = 0.009) and in 2020 (7.73 vs. 3.07 mg GAE/g, P = 0.001) compared to GRAIN samples.
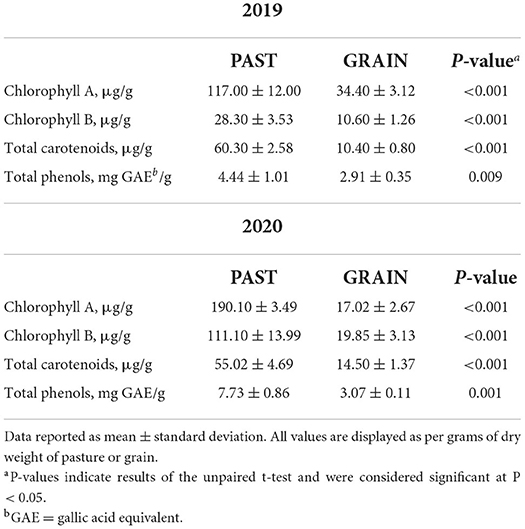
Table 2. Antioxidant profile of pasture and grain samples.
Fatty acid profiles of the diets
The FA profiles of the PAST and GRAIN diets are shown in Table 3. Total SFAs were higher in PAST compared to GRAIN in both years, but the difference was significant in 2020 (19.74 vs. 15.08 g/100g FA, P < 0.001). More specifically, C8:0 through C15:0 were all significantly higher in PAST compared to GRAIN in both years of the study. Palmitic acid (C16:0) was significantly higher in GRAIN in 2019 but was significantly higher in PAST in 2020. Stearic acid (C18:0) was significantly higher in PAST in 2020 (1.61 vs. 1.43 g/100g FA, P = 0.016). Longer chain SFAs (C20:0 – C24:0) were all found in higher concentrations in PAST in both years.
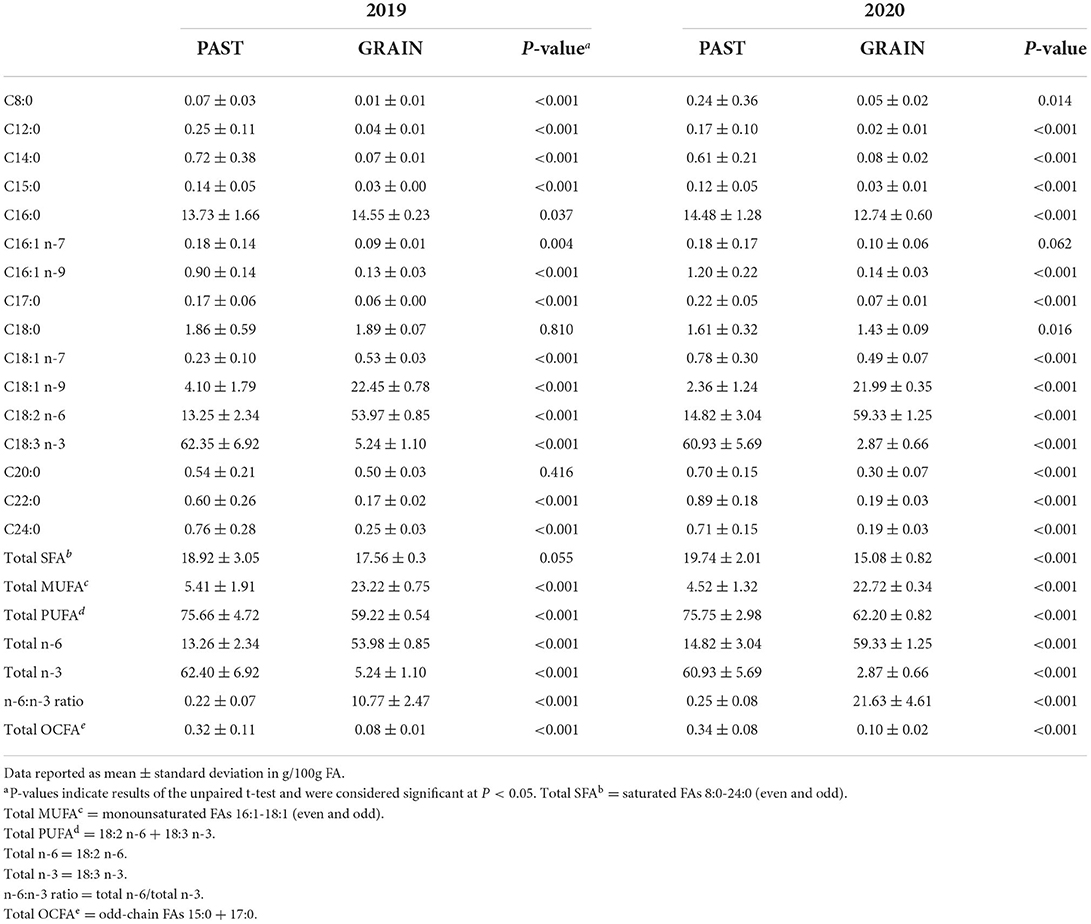
Table 3. Fatty acid profiles of the diets.
Total monounsaturated fatty acids (MUFAs) were significantly higher in GRAIN samples compared to PAST in both years (P < 0.001). More precisely, C16:1 n-7 was higher in PAST in 2019, but no significant difference was observed in 2020. Regarding C16:1 n-9, PAST contained higher levels in both years compared to GRAIN (P < 0.001). The higher total MUFA content in GRAIN is due to significantly higher levels of C18:1 n-9 observed compared to PAST in 2019 and in 2020 (P < 0.001).
When assessing total PUFAs found in the diets, PAST displayed significantly higher concentrations compared to GRAIN in 2019 (P < 0.001) and in 2020 (P < 0.001). Linoleic acid (C18:2 n-6) was found in significantly higher levels in GRAIN samples compared to PAST in 2019 (P < 0.001) and in 2020 (P < 0.001). On the other hand, α-linolenic acid (C18:3 n-3) was significantly higher in PAST in 2019 (P < 0.001) and in 2020 (P < 0.001). Finally, the n-6:n-3 ratio was almost 50 times higher in GRAIN in 2019 (10.77 vs. 0.22, P < 0.001) and 90 times higher in GRAIN in 2020 (21.63 vs. 0.25, P < 0.001) compared to PAST.
Variations in the fatty acid profile of pasture over time
We assessed the changes of the fatty acid profile of PAST by sampling date in 2019 and 2020. These results are displayed in Table 4. In 2019, total FA was significantly highest on June 10 (9.29 g/kg feed) before decreasing and remaining constant throughout the season. When examining SFAs in 2019, lauric acid (C12:0), myristic acid (C14:0), and stearic acid (C18:0) were all significantly higher on September 3 and significantly lower on June 10. They gradually increased from June 10 to September 3 before dropping again on September 18. Regarding MUFAs in 2019, C18:1 n-7 and C18:1 n-9 were both significantly higher on September 3 and lower on June 25. They also gradually increased from June 25 to September 3 before drastically dropping on September 18. Finally, we can observe that linoleic acid (C18:2 n-6) was higher on September 3 and lower in June and on September 18 while α-linolenic acid (C18:3 n-3) was significantly higher in June and on September 18 and was lower on September 3. These two PUFAs followed opposite trends.
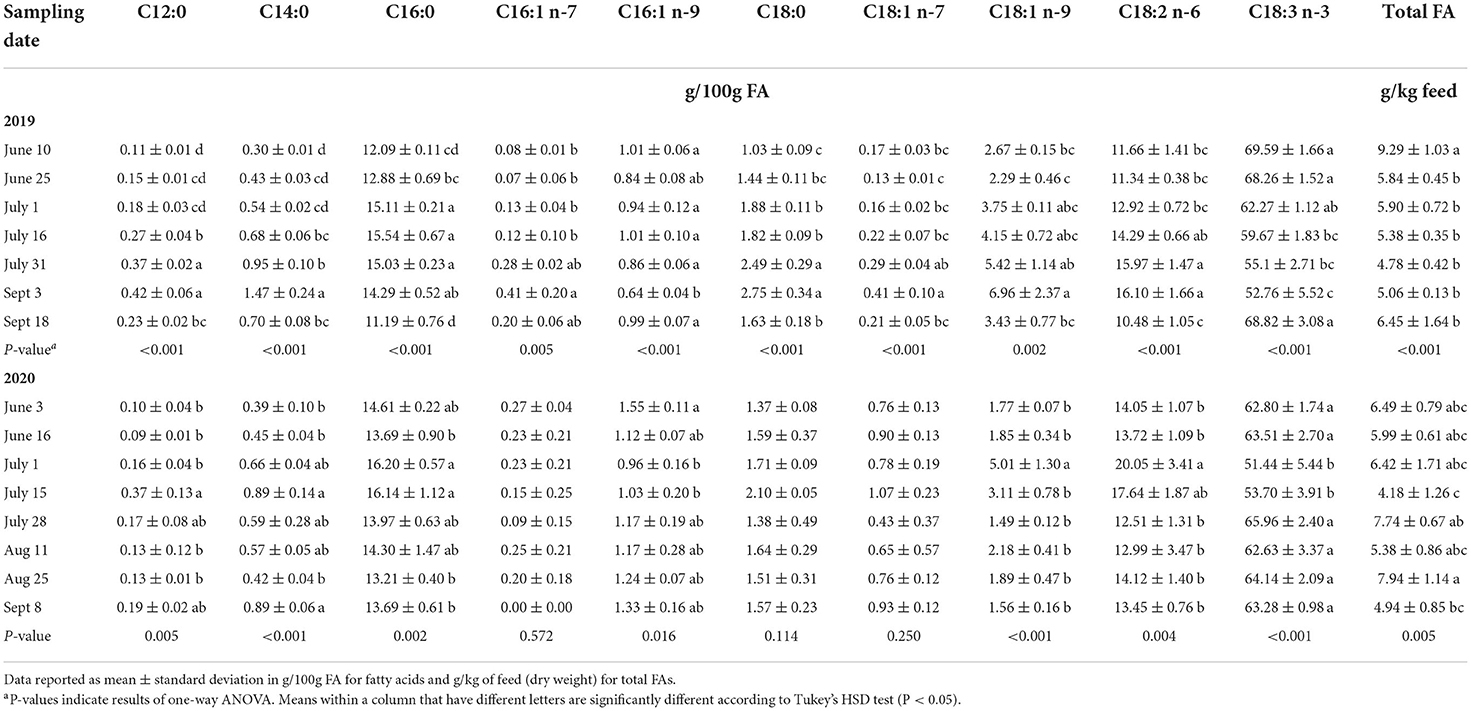
Table 4. Fatty acid profile of pasture by sampling date.
In 2020, total FA was significantly highest on August 25 (7.74 g/kg feed) and lowest on July 15 (4.18 g/kg feed). Saturated FAs in 2020 followed a different trend than in 2019. Lauric acid (C12:0), palmitic acid (C16:0), and stearic acid (C18:0) were all higher on July 15. Regarding MUFAs, C16:1 n-9 was significantly higher on June 3 (1.55 g/100g FA) before decreasing and going back up in July. The other MUFA, C18:1 n-9, was significantly higher on July 1 (5.01 g/100g FA) and remained constant throughout the other sampling dates. Linoleic acid (C18:2 n-6) was higher in July and remained lower during the other months. On the other hand, α-linolenic acid (C18:3 n-3) followed the opposite trend by being at the lowest concentrations in July while being higher and constant during the other months.
Correlations between individual plant species, weather, antioxidants, and fatty acids
Pearson correlations were calculated for individual plant species, weather, antioxidants, and selected FAs (Figure 3). Alfalfa was positively correlated with phenolics while timothy was positively correlated with temperature, GDD, linoleic acid (LA), the n-6:n-3 ratio, and palmitic acid. Meadow fescue was positively correlated with oleic acid but negatively correlated with chlorophyll B. Orchard grass was negatively correlated with meadow fescue and carotenoids while being positively correlated with chlorophyll B. Temperature was positively correlated with GDD and palmitic acid while GDD was positively correlated with the n-6:n-3 ratio and palmitic acid. Chlorophyll A was negatively correlated with stearic acid while chlorophyll B was negatively correlated with carotenoids and oleic acid. Linoleic acid was positively correlated with the n-6:n-3 ratio and palmitic acid, and the n-6:n-3 ratio was positively correlated with palmitic acid. Stearic acid was positively correlated with oleic acid. Alpha-linolenic acid was negatively correlated with LA, the n-6:n-3 ratio, and palmitic acid.
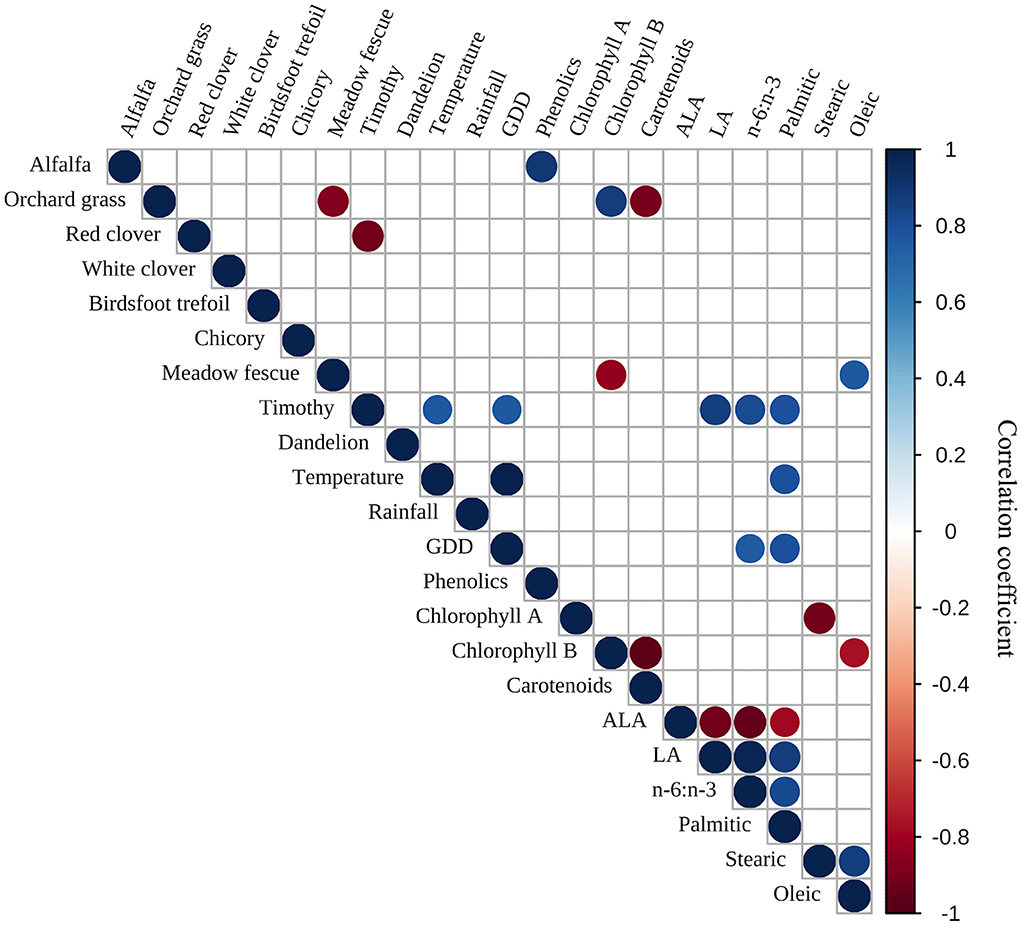
Figure 3. Pearson correlations between individual plant species, weather, and selected fatty acidsa. aPearson correlation matrix displays r correlation coefficients represented as circles. Blue shades denote positive r correlation coefficients, while red shades denote negative r correlation coefficients. Only results with P < 0.05 are displayed, thus, empty boxes were not significant. ALA, alpha-linolenic acid; GDD, growing degree days; LA, linoleic acid.
Discussion
Rich antioxidant profile of pasture
In the present study, all bioactive compounds assessed were higher in PAST compared to GRAIN for both years. The higher carotenoid content found in PAST is in accordance with what was reported by Daley et al. (2010) and Pickworth et al. (2012) stating that lush green forages are usually higher in carotenoids and give carcass fat a yellow color. The higher carotenoid levels observed in PAST compared to GRAIN can be attributed to the wide array of plant species found in the pasture (Daley et al., 2010). Carotenoid levels are highly variable due to the seasonal nature of plant growth (Daley et al., 2010). Pickworth et al. (2012) emphasized the need to provide more data for carotenoids in commonly used feedstuff; vitamin A equivalents from feed collected in different states varied largely probably due to growing conditions and plant maturity. In our study, carotenoid concentrations were higher in 2019 compared to 2020 in PAST but were higher in 2020 compared to 2019 for GRAIN, emphasizing the need to collect more time and feed specific data.
Large variations in chlorophyll content between 2019 and 2020 were observed in this study. For example, chlorophyll B in PAST raised from 28.30 to 111.10 μg/g between 2019 and 2020. These differences may be due to changes in temperature and precipitation. Islam et al. (2021) found that low and high temperatures reduce chlorophyll levels in wheat and barley grasses. Additionally, the authors hypothesize that chlorophyll concentrations might increase because of chemical changes during photosynthesis. Inversely, lower and higher temperatures can affect chloroplast enzymes and may lower the chlorophyll content of grasses (Islam et al., 2021). The assessment of chlorophyll concentrations in grasses is important since there is a strong positive relationship between chlorophyll A and B and α-linolenic acid (C18:3 n-3) or total FA content (Khan et al., 2012).
The large plant diversity found in complex pastures usually results in more biochemically rich feeds with varying amounts of bioactive compounds such as terpenoids, carotenoids, and phenolic compounds that may be reflected in ruminant products (Reynaud et al., 2010).
We also reported a higher total phenol content in PAST samples in this study. These findings are consistent with results reported in the literature comparing total phenolic content of grass and red sorghum (Tejerina et al., 2012; Xiong et al., 2020). Niroula et al. (2019) previously reported that the total phenolic content and the antioxidant activity are lower in seeds compared to sprouts and grasses. Assessing the phenolic content and the antioxidant activity of feedstuffs for ruminants is an important step since they have the potential to increase volatile FA production that can decrease rumen ammonia and methane production, reduce lipid oxidation, and increase anti-microbial action (Kalantar, 2018). Further, polyphenol intake impacts protein digestion by inhibiting protein degradation in the rumen and thereby increasing protein availability in the intestinal tract (Bonanno et al., 2011). One limitation of the present study is that we did not assess antioxidant activity directly, but rather measured bioactive compounds with antioxidant potential.
Fatty acid profiles of the diets
Our findings in the present study indicate a beneficial FA profile in PAST samples compared to GRAIN. On a g/100g FA basis, PAST displayed significantly higher levels of total SFAs compared to GRAIN in 2020. The difference was not statistically significant in 2019. The largest differences were seen in the short chain SFAs (C8:0–C15:0) and C24:0. These results are in agreement with similar results published by Glasser et al. (2013) and Rhee et al. (2000). Interestingly, the concentrations of palmitic acid (C16:0) were higher in GRAIN compared to PAST in 2019. This goes against data published in the literature (Rhee et al., 2000; Garcia et al., 2008; Glasser et al., 2013) and our 2020 results that found higher levels in grasses compared to grain feeds. These variations can be explained by differences in diet compositions and climatic conditions.
The higher total MUFA content in GRAIN compared to PAST in both years of the present study is supported by various studies (Garcia et al., 2008; Khan et al., 2012; Glasser et al., 2013). Regarding the difference in C18:1 n-9, Khan et al. (2012) suggest that this MUFA increases in grains due to the growth of ears and the accumulation of FA in these ears. This is also true for the accumulation of C18:2 n-6 in grain (Khan et al., 2012), leading to higher levels of linoleic acid as confirmed by our results. On the other hand, we found higher levels of C18:3 n-3 in PAST compared to GRAIN in both years. The content of α-linolenic acid in grasses is highly dependent on the leaf-to-stem ratio, with this PUFA accumulating in the leaf tissue of fresh pasture (Mir et al., 2006; Revello-Chion et al., 2011; Khan et al., 2012; Butler, 2014; Alothman et al., 2019).
The potential to modify the FA profile of animal products to favor human health requires the determination of the FA profile of feeds (Boufaïed et al., 2003; Mir et al., 2006). Great emphasis is put on reducing the n-6:n-3 ratio in grazing ruminant products to favor human health (Butler, 2014). To do so, higher n-3 PUFA concentrations are needed. In the current study, our results show that PAST concentrations of C18:3 n-3 were 12 times greater than GRAIN in 2019 and 20 times greater in 2020. Generally, forages contain high levels of this n-3 PUFA (50–75% of total FA) (Dewhurst et al., 2006). Consequently, we also reported a highly beneficial n-6:n-3 ratio in PAST compared to GRAIN in both years.
The beneficial FA profile of PAST reported in the current study could potentially be reflected in grazing ruminant products. Additional research is needed to determine to what extent the FA profile of the cattle diet coincides with the nutritional profile of resulting animal products. One limitation in our work is the lack of species-specific FA profile, which does not allow us to isolate which plant species contribute positively to a beneficial FA profile.
Fatty acid profile of pasture varies by time
Time-specific data about the nutritional value of feeds is critical for ranchers and producers to understand the complex variations occurring in these systems. Climatic changes have important implications for grasslands and the increase in dramatic seasonal variability add more challenges for farmers, scientists, and policy-makers (Hopkins and Del Prado, 2007). In the current study, we emphasize the trends of some FAs over time and how they differ year to year. In 2019, we found that total FA was higher in the early season before decreasing and remaining constant. This observation is in agreement with results reported by Revello-Chion et al. (2011) showing that total FA concentrations decreased during the growing season. The SFAs C12:0, C14:0, and C18:0, as well as the C18:1 MUFAs all gradually increased from the early all the way to the late season before drastically dropping between September 3 and September 18. These FAs followed a similar trend as reported by Garcia et al. (2016). Interestingly, linoleic acid and α-linolenic acid followed opposite trends in 2019, with linoleic acid gradually increasing from June to September before dropping on September 18 and α-linolenic acid gradually declining from June to September before spiking back up on September 18. (Boufaïed et al. 2003) noted that high proportions of C18:3 were observed during the vegetative growth before declining and recovering by the beginning of the fall. The authors hypothesized that this pattern could be explained by the changes in leaf proportion. Garcia et al. (2016) reported similar opposite trends between C18:3 n-3 and C18:2 n-6, citing the changes in leaf-to-stem ratio as a reason why α-linolenic acid decreases over time while linoleic acid increases. The sudden increase in C18:3 n-3 concentrations between September 3 and September 18 2019 can be explained by growth periods. Glasser et al. (2013) found an increase of C18:3 in September, corresponding to the regrowth vegetation cycle. Bauchart et al. (1984) found that C18:3 levels in alpine grass were higher during the primary growth period before strongly declining during the stemmy regrowth and increasing again during the last leafy regrowth. The authors also noted the opposite trend followed by C18:2. It appears that the different growth periods modify the leaf-to-stem ratio, and that chloroplast lipids (found in green, leafy plants) are high in α-linolenic acid (Elgersma et al., 2013). It is also interesting to note that late September experienced the most rainfall during the study period.
The second year of the experimental period (2020) did not follow the same patterns as 2019. This emphasizes the importance of having time- and region-specific data. For instance, total FA concentrations did not follow any statistically notable trend but were higher in late August and lower on July 15. We also observed that most SFAs, MUFAs, and C18:2 n-6 all had higher concentrations in early and mid-July. On the other hand, α-linolenic acid (C18:3 n-3) remained somewhat constant throughout the season but decreased dramatically on July 15. When comparing these trends to the weather trends for 2020, July experienced the most rainfall and the highest temperatures that year. Revello-Chion et al. (2011) reported that the high temperatures and water deficits can reduce forage nutritional quality by reducing the leaf-to-stem ratio. Water deficit can also directly affect FA concentrations by decreasing or even inhibiting the biosynthesis of many lipids and altering the phospholipid and galactolipid levels, resulting in a decrease in the membrane lipid contents (Gigon et al., 2004). It was reported that FA concentrations vary with rainfall and temperature, and that high rainfall promotes grass quality and productivity (Mir et al., 2006; Revello-Chion et al., 2011).
The current study was conducted under realistic grazing conditions. The action of cattle on the pasture plays a role in the variation of FAs. Meluchová et al. (2008) reported that C16:0, C18:2 n-6, and C18:3 n-3 concentrations in a pasture grazed by ewes followed similar trends compared to our study. Palmitic acid (C16:0) and linoleic acid (C18:2 n-6) increased from May to July before decreasing in September. On the other hand, α-linolenic acid (C18:3 n-3) followed the opposite trend by declining from May to July before going back up in September.
Our results showing the variations of major FAs in pastures throughout the season are important for grassland management and ruminant nutrition. The need for these specific data is increasing with high seasonal variations and severe climatic events. Oliveira et al. (2020) reported that management of pasture lands requires mapping spatial and temporal trends; there is a critical need for geospatial data with measurable management attributes and for pasture data to be better described and reported. Future research should focus on collecting data in grasslands for longer periods of time and on providing specific nutritional value data for each species found in pastures. More data will also be needed in events of dramatic climatic conditions such as droughts, typhoons, and floods as these unfortunate events will occur more frequently in the future (Hopkins and Del Prado, 2007; Escarcha et al., 2018).
Relationship between plant species, antioxidants, and fatty acids
Alpha-linolenic acid, LA, and palmitic acid usually contribute up to 93% of total FAs in most forage plants (Meluchová et al., 2008). Dewhurst et al. (2001) found little compositional differences between FAs found in fescue, but noted large variations in FA composition in chicory (which is higher in total FAs). Boufaïed et al. (2003) also noted that individual FAs vary widely between cultivars. Meanwhile, interests in investigating the FA composition of botanically diverse pastures recently emerged (Howes et al., 2015). Because diverse pastures are composed of multiple plant species, it is important to have a better understanding of the effects of each individual species on FAs. Surprisingly, we only noted a few significant correlations between individual plant species and selected FAs. We observed that meadow fescue was positively correlated with oleic acid. This finding is in accordance with what was reported by Arvidsson et al. (2013); fescue contained higher concentrations of oleic acid compared to timothy. Timothy was positively correlated with LA, the n-6:n-3 ratio, and palmitic acid. Timothy was found to have higher LA content and lower ALA content compared to fescue (Dewhurst et al., 2001; Arvidsson et al., 2013), but the positive correlation between timothy and palmitic acid is surprising. The positive correlation between alfalfa and phenolics was also unexpected. Kagan et al. (2015) reported that usually red clover is higher in soluble phenolic compounds than alfalfa. Most of the significant correlations were observed between individual FAs. As expected, ALA was negatively correlated with LA, the n-6:n-3 ratio, and palmitic acid. Simultaneously, LA and the n-6:n-3 ratio were positively correlated with palmitic acid. To our surprise, chlorophyll was not significantly correlated to ALA. Dierking et al. (2010) reported that chlorophyll was most closely correlated to ALA. The lack of correlation observed in our study could be due to different plant species found in the complex pasture mixture. These results highlight the importance of understanding the nutritional quality of botanically diverse pastures since individual plant species have varying effects on antioxidants and FAs.
Conclusion
In this study, we investigated the antioxidant and FA profiles of a total mixed ration diet and a complex Michigan pasture. We also investigated the variations in FA content of the pasture over time and we discussed possible explanations for these variations based on growth cycles, temperature, rainfall, and grazing conditions. Additionally, we correlated the pasture composition to weather, antioxidants, and FAs. To our knowledge, no other studies reported correlations between individual plant species found in diverse pastures and specific FAs. We observed that the pasture displayed a higher antioxidant content and a more beneficial FA profile compared to the grain diet. Furthermore, we identified trends in the FA profile of the pasture that will provide farmers, ranchers, and scientists with valuable data for grassland management and further modeling of pasture areas. With climatic events being more severe and more frequent, region- and time-specific data on the nutritional quality of forages is needed. In addition, the demand for grass-fed ruminant products keeps increasing. Therefore, a better understanding of the variations in nutritional quality of feedstuffs is critical to better understand how feeds affect the nutritional value of grass-fed meats. In conclusion, the results provided in the current study will provide guidance to farmers, ranchers, and researchers to better assess variations in feedstuffs and to develop optimal feeding methods for grass-fed ruminant products to favor human health.
Data availability statement
The original contributions presented in the study are included in the article/Supplementary material, further inquiries can be directed to the corresponding author.
Ethics statement
The animal study was reviewed and approved by Michigan State University Institutional Animal Care and Use Committee (IACUC #201800155).
Author contributions
JR, JF, IM, and LK provided substantial contributions to the conception and design of the work. JR and JF provided the funding, resources needed for this study, and approval for publication of the content. LK, SSe, TG, HA, SK, and VJ conducted the antioxidant and fatty acid analyses. IM collected the samples and conducted the proximate analysis. KC determined the botanical composition of the pasture. SSi and LK developed and performed the statistical analysis. IM-M provided equipment and methodology to perform the antioxidant analysis. LK, SSe, and JF were involved in drafting the work. LK, SSe, KC, IM, and JF were involved in revising this work critically for important intellectual content. JF agrees to be accountable for all aspects of the work in ensuring that questions related to the accuracy or integrity of any part of the work are appropriately investigated and resolved. All authors contributed to the article and approved the submitted version.
Funding
This work was supported by NCR-SARE (LNC18-413). NCR-SARE was not involved in the study design, collection, analysis, interpretation of data, the writing of this article, or the decision to submit it for publication.
Acknowledgments
The authors would like to thank the Michigan State University Upper Peninsula Research and Extension Center in Chatham, MI for allowing the field trial on their land and Michigan State University College of Agriculture and Natural Resources Statistical Consulting Center (CANR SCC) for their help with analyzing the data for this study. The authors also express their gratitude for the financial support provided by NCR-SARE (LNC18-413) that enabled them to complete this work.
Conflict of interest
Authors JF and JR report a grant from NCR-SARE for the enhancement of the healthfulness and demand of Upper Midwestern, locally produced beef. They have not accepted personal honoraria from any organization to prevent undue influence in the eye of the public.
The remaining authors declare that the research was conducted in the absence of any commercial or financial relationships that could be construed as a potential conflict of interest.
Publisher's note
All claims expressed in this article are solely those of the authors and do not necessarily represent those of their affiliated organizations, or those of the publisher, the editors and the reviewers. Any product that may be evaluated in this article, or claim that may be made by its manufacturer, is not guaranteed or endorsed by the publisher.
Supplementary material
The Supplementary Material for this article can be found online at: https://www.frontiersin.org/articles/10.3389/fsufs.2022.945080/full#supplementary-material
References
Alothman, M., Hogan, S.A., Hennessy, D., Dillon, P., Kilcawley, K.N., O'donovan, M., et al. (2019). The “grass-fed” milk story: understanding the impact of pasture feeding on the composition and quality of bovine milk. Foods 8, 350. doi: 10.3390/foods8080350
Anandhi, A. (2016). Growing degree days – ecosystem indicator for changing diurnal temperatures and their impact on corn growth stages in Kansas. Ecol. Indic. 61, 149–158. doi: 10.1016/j.ecolind.2015.08.023
Aoac. (2000). Official Methods of Analysis. 17th ed. Gaithersburg, MD: The Association of Official Analytical Chemists.
Arvidsson, K., Martinsson, K., and Gustavsson, A.-M. (2013). Fatty acid concentrations in timothy (Phleum pratenseL.) and meadow fescue (Festuca pratensisHuds.): effects of seasonal variations at different nitrogen fertilization levels. Acta Agric. Scand. B Soil Plant Sci. 63, 314–321. doi: 10.1080/09064710.2013.766256
Bauchart, D., Verite, R., and Remond, B. (1984). Long-chain fatty acid digestion in lactating cows fed fresh grass from Spring to Autumn. Can. J. Anim. Sci. 64, 330–331. doi: 10.4141/cjas84-285
Belyea, R.L., and Ricketts, R.E. (1993). Forages for Cattle: New Methods of Determining Energy Content and Evaluating Heat Damage. Columbia, MO: University of Missouri Extension.
Berauer, B.J., Wilfahrt, P.A., Reu, B., Schuchardt, M.A., Garcia-Franco, N., Zistl-Schlingmann, M., et al. (2020). Predicting forage quality of species-rich pasture grasslands using vis-NIRS to reveal effects of management intensity and climate change. Agric. Ecosyst. Environ. 296, 106929. doi: 10.1016/j.agee.2020.106929
Bonanno, A., Di Miceli, G., Di Grigoli, A., Frenda, A.S., Tornambe, G., Giambalvo, D., et al. (2011). Effects of feeding green forage of sulla (Hedysarum coronarium L.) on lamb growth and carcass and meat quality. Animal 5, 148–154. doi: 10.1017/S1751731110001576
Boufaïed, H., Chouinard, P.Y., Tremblay, G.F., Petit, H.V., Michaud, R., and Bélanger, G. (2003). Fatty acids in forages. I. Factors affecting concentrations. Can. J. Anim. Sci. 83, 501–511. doi: 10.4141/A02-098
Bronkema, S., Rowntree, J., Jain, R., Schweihofer, J., Bitler, C., and Fenton, J. (2019). A nutritional survey of commercially available grass-finished beef. Meat Muscle Biol. 97, 341–342. doi: 10.22175/mmb2018.10.0034
Butler, G. (2014). Manipulating dietary PUFA in animal feed: implications for human health. Proc. Nutr. Soc. 73, 87–95. doi: 10.1017/S0029665113003790
Daley, C.A., Abbott, A., Doyle, P.S., Nader, G.A., and Larson, S. (2010). A review of fatty acid profiles and antioxidant content in grass-fed and grain-fed beef. Nutr. J. 9, 1–12. doi: 10.1186/1475-2891-9-10
Dewhurst, R.J., Scollan, N.D., Youell, S.J., Tweed, J.K.S., and Humphreys, M.O. (2001). Influence of species, cutting date and cutting intervalon the fatty acid composition of grasses. Grass Forage Sci. 56, 68–74. doi: 10.1046/j.1365-2494.2001.00247.x
Dewhurst, R.J., Shingfield, K.J., Lee, M.R.F., and Scollan, N.D. (2006). Increasing the concentrations of beneficial polyunsaturated fatty acids in milk produced by dairy cows in high-forage systems. Anim. Feed Sci. Technol. 131, 168–206. doi: 10.1016/j.anifeedsci.2006.04.016
Dierking, R.M., Kallenbach, R.L., and Roberts, C.A. (2010). Fatty acid profiles of orchardgrass, tall fescue, perennial ryegrass, and alfalfa. Crop Sci. 50, 391–402. doi: 10.2135/cropsci2008.12.0741
Elgersma, A., Soegaard, K., and Jensen, S.K. (2013). Fatty acids, alpha-tocopherol, beta-carotene, and lutein contents in forage legumes, forbs, and a grass-clover mixture. J. Agric. Food Chem. 61, 11913–11920. doi: 10.1021/jf403195v
Escarcha, J., Lassa, J., and Zander, K. (2018). Livestock under climate change: a systematic review of impacts and adaptation. Climate 6, 1–17. doi: 10.3390/cli6030054
Garcia, P.T., Pensel, N.A., Sancho, A.M., Latimori, N.J., Kloster, A.M., Amigone, M.A., et al. (2008). Beef lipids in relation to animal breed and nutrition in Argentina. Meat Sci. 79, 500–508. doi: 10.1016/j.meatsci.2007.10.019
Garcia, P.T., Pordomingo, A., Perez, C.D., Rios, M.D., Sancho, A.M., Volpi Lagreca, G., et al. (2016). Influence of cultivar and cutting date on the fatty acid composition of forage crops for grazing beef production in Argentina. Grass Forage Sci. 71, 235–244. doi: 10.1111/gfs.12167
Gigon, A., Matos, A.R., Laffray, D., Zuily-Fodil, Y., and Pham-Thi, A.T. (2004). Effect of drought stress on lipid metabolism in the leaves of Arabidopsis thaliana (ecotype Columbia). Ann. Bot. 94, 345–351. doi: 10.1093/aob/mch150
Giridhar, K., and Samireddypalle, A. (2015). Impact of climate change on forage availability for livestock. In: Sejian, V., Gaughan, J., Baumgard, L., and Prasad C., editors. Climate Change Impact on Livestock: Adaptation and Mitigation. New York, NY: Springer. p. 97–112.
Glasser, F., Doreau, M., Maxin, G., and Baumont, R. (2013). Fat and fatty acid content and composition of forages: a meta-analysis. Anim. Feed Sci. Technol. 185, 19–34. doi: 10.1016/j.anifeedsci.2013.06.010
Gwin, L. (2009). Scaling-up sustainable livestock production: innovation and challenges for grass-fed beef in the U.S. J. Sustainable Agric. 33, 189–209. doi: 10.1080/10440040802660095
Hach, C. C., Bowden, B. K, Kopelove, A. B, and Brayton, S. V. (1987). More powerful peroxide Kjeldahl digestion method. J. Assoc. Off. Anal. Chem. 70, 783–787. doi: 10.1093/jaoac/70.5.783
Hatew, B., Bannink, A., Van Laar, H., De Jonge, L.H., and Dijkstra, J. (2016). Increasing harvest maturity of whole-plant corn silage reduces methane emission of lactating dairy cows. J. Dairy Sci. 99, 354–368. doi: 10.3168/jds.2015-10047
Hatfield, J.L., Boote, K.J., Kimball, B.A., Ziska, L.H., Izaurralde, R.C., Ort, D., et al. (2011). Climate impacts on agriculture: implications for crop production. Agron. J. 103, 351–370. doi: 10.2134/agronj2010.0303
Hopkins, A., and Del Prado, A. (2007). Implications of climate change for grassland in Europe: impacts, adaptations and mitigation options: a review. Grass Forage Sci. 62, 118–126. doi: 10.1111/j.1365-2494.2007.00575.x
Howes, N.L., Bekhit, A.E.A., Burritt, D.J., and Campbell, A.W. (2015). Opportunities and implications of pasture-based lamb fattening to enhance the long-chain fatty acid composition in meat. Compr. Rev. Food. Sci. Food. Saf. 14, 22–36. doi: 10.1111/1541-4337.12118
Islam, M.Z., Park, B.J., and Lee, Y.T. (2021). Influence of temperature conditions during growth on bioactive compounds and antioxidant potential of wheat and barley grasses. Foods 10, 2742. doi: 10.3390/foods10112742
Izaurralde, R.C., Thomson, A.M., Morgan, J.A., Fay, P.A., Polley, H.W., and Hatfield, J.L. (2011). Climate impacts on agriculture: implications for forage and rangeland production. Agron. J. 103, 371–381. doi: 10.2134/agronj2010.0304
Jain, R., Bronkema, S.M., Yakah, W., Rowntree, J.E., Bitler, C.A., and Fenton, J.I. (2020). Seasonal differences exist in the polyunsaturated fatty acid, mineral and antioxidant content of U.S. grass-finished beef. PLoS ONE 15, e0229340. doi: 10.1371/journal.pone.0229340
Jenkins, T.C. (2010). Technical note: common analytical errors yielding inaccurate results during analysis of fatty acids in feed and digesta samples. J. Dairy Sci. 93, 1170–1174. doi: 10.3168/jds.2009-2509
Kagan, I.A., Goff, B.M., and Flythe, M.D. (2015). Soluble phenolic compounds in different cultivars of red clover and alfalfa, and their implication for protection against proteolysis and ammonia production in ruminants. Nat. Prod. Commun. 10, 1263–1267. doi: 10.1177/1934578X1501000732
Kalantar, M. (2018). The importance of flavonoids in ruminant nutrition. Arch. Anim. Husb. Dairy Sci. 1, 504. doi: 10.33552/AAHDS.2018.01.000504
Khan, N.A., Cone, J.W., Fievez, V., and Hendriks, W.H. (2012). Causes of variation in fatty acid content and composition in grass and maize silages. Anim. Feed Sci. Technol. 174, 36–45. doi: 10.1016/j.anifeedsci.2012.02.006
Khan, N.A., Cone, J.W., and Hendriks, W.H. (2009). Stability of fatty acids in grass and maize silages after exposure to air during the feed out period. Anim. Feed Sci. Technol. 154, 183–192. doi: 10.1016/j.anifeedsci.2009.09.005
Kramer, J.K.G., Hernandez, M., Cruz-Hernandez, C., Kraft, J., and Dugan, M.E.R. (2008). Combining results of two GC separations partly achieves determination of all cis and trans 16:1, 18:1, 18:2 and 18:3 except CLA isomers of milk fat as demonstrated using Ag-ion SPE fractionation. Lipids 43, 259–273. doi: 10.1007/s11745-007-3143-4
Lichtenthaler, H.K., and Wellburn, A.R. (1983). Determinations of total carotenoids and chlorophylls a and b of leaf extracts in different solvents Biochem. Soc. Trans. 11, 591–592. doi: 10.1042/bst0110591
Maciel, I.C.F., Schweihofer, J.P., Fenton, J.I., Hodbod, J., Mckendree, M.G.S., Cassida, K., et al. (2021). Influence of beef genotypes on animal performance, carcass traits, meat quality, and sensory characteristics in grazing or feedlot-finished steers. Transl. Anim. Sci. 5, txab214. doi: 10.1093/tas/txab214
Meluchová, B., Blaško, J., Kubinec, R., Górová, R., Dubravská, J., Margetín, M., et al. (2008). Seasonal variations in fatty acid composition of pasture forage plants and CLA content in ewe milk fat. Small Ruminant Res. 78, 56–65. doi: 10.1016/j.smallrumres.2008.05.001
Mertens, D. (2002). Gravimetric determination of amylase-treated neutral detergent fiber in feeds with refluxing in beakers or crucibles: collaborative study. J. AOAC Int. 85, 1217–1240. doi: 10.1093/jaoac/85.6.1217
Mir, P.S., Bittman, S., Hunt, D., Entz, T., and Yip, B. (2006). Lipid content and fatty acid composition of grasses sampled on different dates through the early part of the growing season. Can. J. Anim. Sci. 86, 279–290. doi: 10.4141/A05-050
Nimalaratne, C., Lopes-Lutz, D., Schieber, A., and Wu, J. (2011). Free aromatic amino acids in egg yolk show antioxidant properties. Food Chem. 129, 155–161. doi: 10.1016/j.foodchem.2011.04.058
Niroula, A., Khatri, S., Khadka, D., and Timilsina, R. (2019). Total phenolic contents and antioxidant activity profile of selected cereal sprouts and grasses. Int. J. Food Prop. 22, 427–437. doi: 10.1080/10942912.2019.1588297
Oliveira, J., Campbell, E.E., Lamparelli, R. a.C, Figueiredo, G.K.D.A., Soares, J.R., et al. (2020). Choosing pasture maps: an assessment of pasture land classification definitions and a case study of Brazil. Int. J. Appl. Earth Obs. Geoinf. 93, 102205. doi: 10.1016/j.jag.2020.102205
Pickworth, C.L., Loerch, S.C., Kopec, R.E., Schwartz, S.J., and Fluharty, F.L. (2012). Concentration of pro-vitamin A carotenoids in common beef cattle feedstuffs. J. Anim. Sci. 90, 1553–1561. doi: 10.2527/jas.2011-4217
Provenza, F.D., Kronberg, S.L., and Gregorini, P. (2019). Is grassfed meat and dairy better for human and environmental Health? Front. Nutr. 6, 26. doi: 10.3389/fnut.2019.00026
Revello-Chion, A., Tabacco, E., Peiretti, P.G., and Borreani, G. (2011). Variation in the fatty acid composition of alpine grassland during spring and summer. Agron. J. 103, 1072–1080. doi: 10.2134/agronj2010.0509
Reynaud, A., Fraisse, D., Cornu, A., Farruggia, A., Pujos-Guillot, E., Besle, J.M., et al. (2010). Variation in content and composition of phenolic compounds in permanent pastures according to botanical variation. J. Agric. Food Chem. 58, 5485–5494. doi: 10.1021/jf1000293
Rhee, K.S., Waldron, D.F., Ziprin, Y.A., and Rhee, K.C. (2000). Fatty acid composition of goat diets vs intramuscular fat. Meat Sci. 54, 313–318. doi: 10.1016/S0309-1740(99)00094-7
Sergin, S., Goeden, T., Krusinski, L., Kesamneni, S., Ali, H., Bitler, C.A., et al. (2021). Fatty acid and antioxidant composition of conventional compared to pastured eggs: characterization of conjugated linoleic acid and branched chain fatty acid isomers in eggs. Food Sci. Technol. 1, 260–267. doi: 10.1021/acsfoodscitech.0c00093
Singleton, V.L., and Rossi, J.A. (1965). Colorimetry of total phenolics with phosphomolybdic-phosphotungstic acid reagents. Am. J. Enol. Vitic. 16, 144–158. doi: 10.1093/sq/16.2.144
Tejerina, D., Garcia-Torres, S., De Vaca, M.C., Vazquez, F.M., and Cava, R. (2012). Study of variability in antioxidant composition and fatty acids profile of Longissimus dorsi and Serratus ventralis muscles from Iberian pigs reared in two different Montanera seasons. Meat Sci. 90, 414–419. doi: 10.1016/j.meatsci.2011.08.010
Van Oijen, M., Bellocchi, G., and Höglind, M. (2018). Effects of climate change on grassland biodiversity and productivity: the need for a diversity of models. Agronomy 8, 14. doi: 10.3390/agronomy8020014
Keywords: forage, pasture, grazing, phytochemicals, fatty acids, climate
Citation: Krusinski L, Maciel ICdF, Sergin S, Goeden T, Ali H, Kesamneni S, Jambunathan V, Cassida KA, Singh S, Medina-Meza IG, Rowntree JE and Fenton JI (2022) Evaluation of fatty acid and antioxidant variation in a complex pasture system as compared to standard cattle feed in the Great Lakes region. Front. Sustain. Food Syst. 6:945080. doi: 10.3389/fsufs.2022.945080
Received: 16 May 2022; Accepted: 31 August 2022;
Published: 26 September 2022.
Edited by:
Laurent Dufossé, Université de la Réunion, FranceReviewed by:
Maria Cabrera, Universidad de la República, UruguayAntonino Di Grigoli, Università di Palermo, Italy
Copyright © 2022 Krusinski, Maciel, Sergin, Goeden, Ali, Kesamneni, Jambunathan, Cassida, Singh, Medina-Meza, Rowntree and Fenton. This is an open-access article distributed under the terms of the Creative Commons Attribution License (CC BY). The use, distribution or reproduction in other forums is permitted, provided the original author(s) and the copyright owner(s) are credited and that the original publication in this journal is cited, in accordance with accepted academic practice. No use, distribution or reproduction is permitted which does not comply with these terms.
*Correspondence: Jenifer I. Fenton, imigjeni@msu.edu