Impact of the Productive SafetyNet Program on the minimum acceptable diet in the rural community of South Gondar Zone, Northwest Ethiopia
 Melaku Tadege Engidaw1*
  Alemayehu Digssie Gebremariam1
  Belayneh Kefale2
  Desalegn Tesfa1
  Sofonyas Abebaw Tiruneh1
  Yalelet Fentaw Shiferaw3
- 1Department of Public Health, College of Health Sciences, Debre Tabor University, Debre Tabor, Ethiopia
- 2Department of Pharmacy, College of Medicine and Health Sciences, Bahar Dar University, Bahar Dar, Ethiopia
- 3Department of Nutritional Care and Counseling, University of Gondar Specialized Hospital, Gondar, Ethiopia
Background: Even though numerous factors contribute to undernutrition, it can happen immediately due to poor intake and illness. A minimum acceptable diet is one of the proxy measures for adequate consumption, which is an impact indicator for the Productive SafetyNet Program (PSNP). As a result, this study aimed to assess the impact of PSNP on the minimum acceptable diet among rural infants in the South Gondar Zone, Northwest Ethiopia.
Methods: A community-based cross-sectional study design was employed in the selected woredas (districts) of South Gondar Zone, Northwest Ethiopia, from 1 December 2017 to 30 January 2017. A total of 442 participants' data were collected during this time period through interviews with their mothers or caregivers. A multistage sampling technique was employed to select study subjects and interviewees using a structured questionnaire. Stata version 16 (MP) was employed to carry out a statistical analysis. A binary logistic regression model was employed to identify significant variables. The statistical significance was declared at a p-value of more than 0.05.
Results: The highest proportion of adequate diet diversity scores (261 [59.05%]) was from households who graduated (not part of it) from PSNPs. In this study, the magnitude of adequate dietary diversity, meal frequency, and minimum acceptable diet was 79.86, 82.58, and 66.52%, respectively. Marital status (AOR = 3.98, 95% CI: 1.39, 11.40), child age (AOR = 2.82, 95% CI: 1.78, 4.47), the educational status of the father (AOR = 0.56, 95% CI: 0.35, 0.89), the wealth index (AOR = 0.27, 95% CI: 0.12, 0.64), and the place of delivery (AOR = 3.14, 95% CI: 1.47, 6.73) were significant predictors for minimum acceptable diet uptake by children.
Conclusion: In this study, two-thirds of the infants had/received a minimum acceptable diet. Furthermore, infants from households with Productive SafetyNet users had a low minimum acceptable diet. Marital status, the educational status of the father, child age, the wealth index, and the place of delivery were associated factors with having an adequate intake of minimum acceptable diet by the children. Therefore, efforts to address sociodemographic and child-related factors during routine care are crucial.
Background
Even though Ethiopia has achieved success in various areas related to the millennium development goals (Horton and Lo, 2013), it currently faces significant challenges with regard to poverty and food insecurity due to high population growth (World Bank, 2015) and poor economic growth (Alderman, 2010; IFAD, 2016). Due to chronic food insecurity and low agricultural productivity, the Productive SafetyNet Program (PSNP) was implemented in Ethiopia in 2005 to tackle this problem. After 4 years, PSNP+ was introduced to include additional small income-generating activities among households to increase household income (Devereux et al., 2006; Gilligan et al., 2009; Berhane et al., 2012).
Despite the implementation of various interventions, food insecurity and hunger continue to be rampant and critical issues in Ethiopia, which have a significant impact on children's overall health [Devereux, 2000; CSA, 2011, 2014; Central Statistical Agency (Ethiopia) ICF International, 2016]. One of the main contributing factors to these issues is the inadequate intake of a variety of foods due to insufficient quantities and frequencies, particularly in the Amhara regional state [Central Statistical Agency (Ethiopia) ICF International, 2011, 2014]. Overall, food insecurity has an impact on educational attainment and attendance in Ethiopia (Belachew et al., 2011). The ultimate goal of PNSP is to ensure households build on-farm and off-farm activities to have a variety of procurement strategies for food and cash (Drinkwater and McEwan, 1992).
Livelihoods will be secured when households have secure ownership or access to resources and income-earning activities. It helps to reserve and build an asset, offset risks, ease shocks, and meet contingencies (Chambers, 1989; Frankenberger and McCaston, 1998) to mitigate the vulnerability risk of a household to income, food, health, and nutritional insecurity, which directly or indirectly affect the consumption behaviors of the families.
The Phase 4 PSNPs were launched in Ethiopia to achieve the goal of “enhancing resilience to shocks and livelihoods, improving food security and nutrition, for rural households vulnerable to food insecurity.” Thus, the PSNP's contribution to this goal was assessed through program impact assessments by using the percentage of infants aged 6 to 23 months who receive a minimum acceptable diet, household dietary diversity, the average value of asset holdings, and the number of different income sources. For this study, we intended to use the minimum acceptable diet among infants aged 6–23 months as an indicator of the impact assessment (MoALR, 2014).
In Ethiopia, the magnitude of the Minimum Acceptable Diet (MAD) is the lowest, which ranges from 4.2 to 13.3% (Abeshu et al., 2016; Gizaw and Tesfaye, 2019; Mulat et al., 2019; Tassew et al., 2019). The levels of the Minimum Dietary Diversity Score (MDDS) and Minimum Meal Frequency (MMF) are 45 and 33%, respectively, which are high as compared to the findings of the study in North Showa (Gizaw and Tesfaye, 2019). This might be due to household food insecurity, which mainly affects low-income populations, particularly in developing economies undergoing the demographic transition; hence, low socioeconomic status leads to poor diet, food insecurity, and ill health among infants (FAO, 2003; Popkin, 2004; Conforti NWCCNTP, 2014). In addition, demographic and other maternal and child-related predictors affect children's MAD through dietary diversity and meal frequency (Laraia et al., 2006). As mentioned above, even though there are studies on the general population and each independent indicator of MAD, there are none on PSNP beneficiaries on this topic. Thus, this study aimed to assess the impact of PSNP on a minimum acceptable diet of infants aged 6–23 months in the selected rural community of South Gondar Zone, Northwest Ethiopia.
Materials and methods
Study design, period, and setting
The data were collected through a community-based cross-sectional study design from 1 December 2017 to 30 January 2017. Then, we compared these data based on the household's Productive SafetyNet enrollment status.
If the number of woredas (districts) in South Gondar with PSNP was five (Libo Kemkem, Simada, Lay Gayint, Tach Gayint, and Ebnat), the data were collected at the rural kebeles of Libo Kemkem and Simada woredas in South Gondar Zone, Northwest Ethiopia. The topography of these woredas (districts) belongs to highlands with plain and mountainous features, and both woredas (districts) are found at 1,800 m above the sea level (SWEPLAUO, 2020; WEPLAUO, 2020).
If these people are chronically food insecure, agricultural cultivation includes maize, barley, and millet, which are the main food crops, while rice and chickpeas are the main cash crops. The total number of households with the Productive SafetyNet program in Libo Kemekem and Simada woredas was more than 9,000, participating either in public works or direct support. At the time of data collection, nearly 4,500 infants aged 6–23 months were found in these woredas.
Sample size determination
The first study included a total of 769 participants. Of these, data from 442 infants aged 6–23 months were retrieved for this study after removing incomplete data and data from infants under the age of 23 months.
Eligibility criteria
We included data of all children aged 6 to 23 months of complete dietary diversity and meal frequency variables; if either of them were incomplete, we excluded them from this study.
Patient and public involvement
During this study, no patients or members of the general public were involved in the development of the research question, data collection, or analysis.
Sampling procedure
During the primary data collection, a multistage sampling method was employed by allocating the calculated sample size to each designated Kebeles of selected woredas, and the data were collected at the household level. Then, the refined data were analyzed.
Data collection methods and tools
During the primary data collection phase, the pretested Amharic version questionnaire was employed after being translated from the English language, which consists of socioeconomic and consumption-related variables. The dietary intake and minimum meal frequency data were collected using seven food groups through a 24-h dietary recall. Ten BSc nurse enumerators collected the data.
Data quality
Prior to the original data collection, a pretest was conducted on 5% of the total sample size. The data collectors received 1 day of training with a pretest, and the questionnaire was administered in Amharic (the local language). During the primary data collection period, regular communication was maintained to discuss the progress and any issues that arose. The collected data were checked for completeness and consistency by the investigators and supervisors. All data collectors were recruited outside the study area to minimize bias.
Term definitions
➢ Households with PNSPs: These households are identified as chronically food insecure and are currently a part of cash transfer or asset-building programs.
➢ Households without PNSPs: These households are not identified as chronically food insecure because they graduated from PNSPs and are not currently part of cash transfer or asset-building programs.
➢ Kebele: It is the smallest administrative division or village in Ethiopia.
➢ Minimum dietary diversity: It is the proportion of infants aged 6–23 months who received ≥4 food groups from the seven through a 24-h dietary recall; it is categorized as inadequate if dietary diversity has ≤ 4 food groups and good if the individual dietary diversity has ≥5 food groups according to FAO.
➢ Minimum meal frequency: It is the proportion of breastfed and non-breastfed infants aged 6–23 months who received solid, semisolid, or soft foods (also including milk for non-breastfed infants). Minimum meal frequency was defined as at least two times for breastfed infants aged 6–8 months, at least three times for breastfed infants aged 9–23 months, and at least two feedings of milk products for non-breastfed infants during the previous 24 h.
➢ Minimum Acceptable diet: Proportion of infants aged 6–23 months who receive a minimum acceptable diet (both minimum dietary diversity and minimum meal frequency) during the previous 24 h.
Data processing and analysis
These secondary data were imported from SPSS into the Stata file version. The data were then cleaned, categorized, and tabulated using Stata 16.0/MP software for Windows. The wealth index data were gathered by utilizing household assets such as land, materials, and utilities (electricity and water sources). After checking the assumptions, the index was built using principal component analysis (PCA). The outcome was ranked into five categories: poorest, poorer, middle, richer, and richest.
Finally, both descriptive and analytical analyses of variables were employed. In addition, univariable and multivariable binary logistic analyses were used to evaluate the independent and multiple effects of each variable on the dependent variable. In the univariable binary logistic regression analysis, a p-value of ≤ 0.25 was employed to select candidate variables for multivariable analysis.
Furthermore, the co-linearity between variables was determined using variance inflation factors (VIF). A p-value of ≤ 0.05 was used to declare statistical significance during multivariable analysis. For each odd ratio (ORs; adjusted and crude), the 95% CI was computed. During the final analysis, the model's fitness was checked (p-value ≥0.05).
Results
Sociodemographic characteristics
The average age (±SD) of infants was 14.04 (±4.59) months. Moreover, nearly one-third of the children were found between the ages of 11 and 23 months. The mean age ± SD of the mother/caregiver was 29.40 ± 5.29 years. The majority of the mothers/caregivers (173 [39.14%]) were found between the ages of 25 and 29 years. All of them were Orthodox by religion. The mean ± SD of family size among participants was 4.54 ± 1.51. Here, nearly three-fourths (328 or 74.21%) of the households were not enrolled in the Productive SafetyNet Program during data collection (either because they graduated from the program or were not enrolled initially) (Table 1).
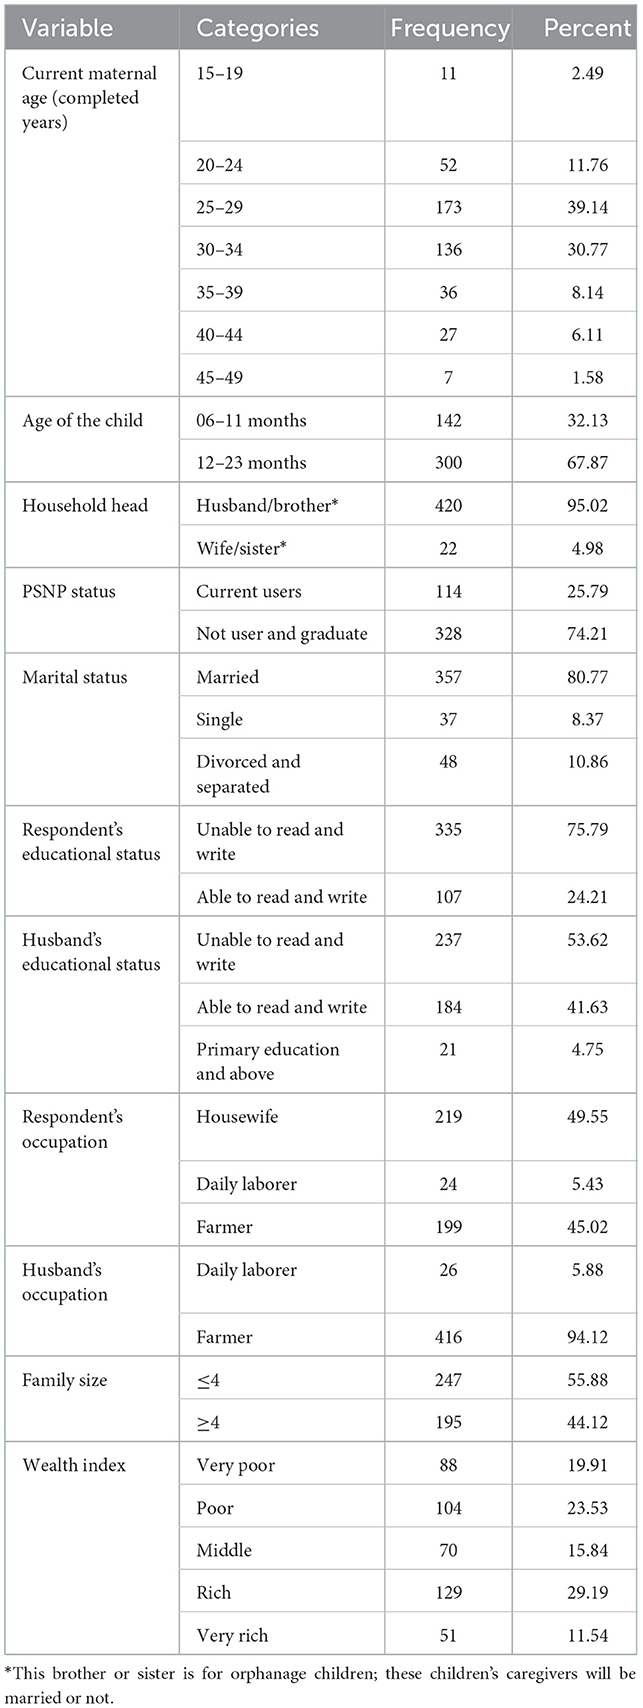
Table 1. Socioeconomic characteristics of the mother/caregiver of infants aged 6–23 months in South Gondar Zone, Northwest Ethiopia, 2017 (n = 442).
Index child-related characteristics
The average ± SD of the birth interval between the two-consecutive infants from the index was 3.33 ± 1.66 years. The majority of index infants have been breastfed (427 or 96.61%). In this study, three-fourths of the mothers/caregivers started complementary foods at the age of 6 months for their child. Still, the rate of institutional delivery is very low (68 [15.38%]). Approximately 6% (25) of the mother gives extra food/beverages after delivery instead of colostrum (Table 2).
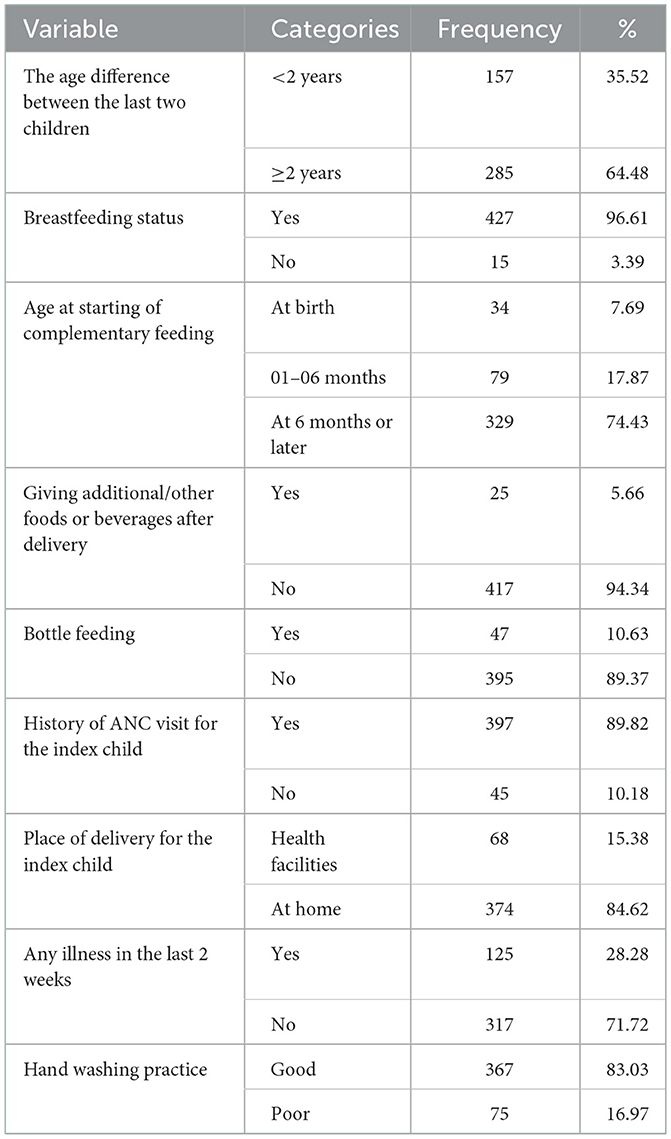
Table 2. Obstetrics-related characteristics of the mother for infants aged 6–23 months in South Gondar Zone, Northwest Ethiopia, 2017 (n = 442).
Level of a minimum acceptable diet among children
The mean (±SD) minimum dietary diversity score (MDDS) was 5.38 ± 1.04. The overall MDDS and minimum meal frequency (MMF) magnitudes were 79.86 (95% CI: 75.82, 83.50) and 82.58% (95% CI: 78.71, 86.00), respectively. The consumption of vitamin-A-rich fruits and vegetables was found to be zero, which could be due to a lack of awareness about these types of food, difficulty accessing them, or the belief that other fruits and vegetables provide sufficient quantity of vitamin A. The magnitude of the minimum acceptable diet (MAD) score was 66.52% (95% CI: 61.90, 70.90) (Table 3).
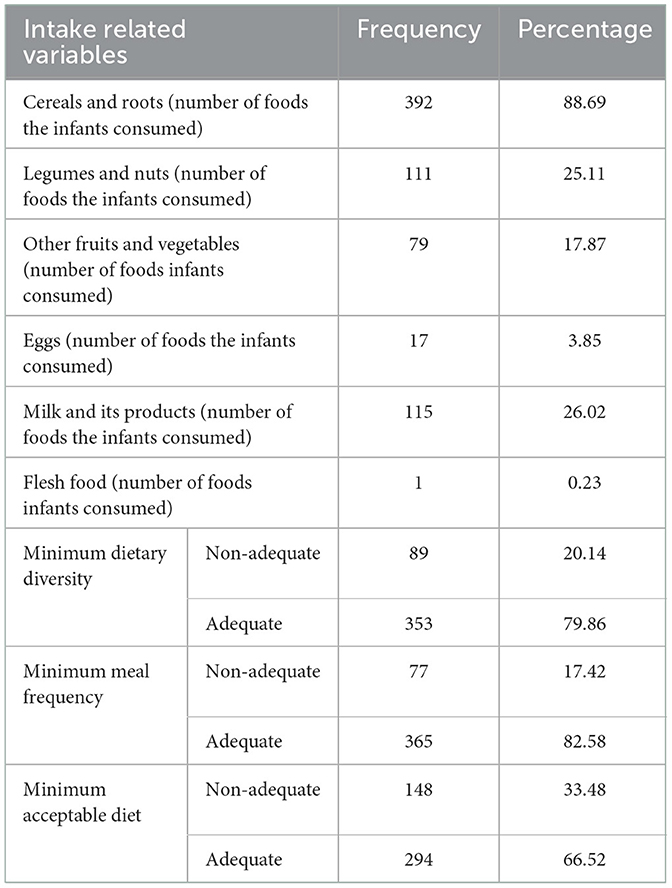
Table 3. Level of a minimum acceptable diet intake percentage by 6–23-month-old infants in South Gondar Zone, Northwest Ethiopia, 2017 (n = 442).
The highest proportion of adequate diet diversity scores (261 [59.05%]) was from households that either graduated from PSNP or that were not enrolled in this program. Besides, the level of an adequate minimum acceptable diet score among the current PSNP users was low (79 [26.87%]) among all adequate MAD scores (Table 4).

Table 4. Children's practice of the minimum acceptable dietary intake parameter with Productive SafetyNet enrolment status in the South Gondar Zone, Northwest Ethiopia, 2017 (n = 442).
Factors associated with a minimum acceptable diet among children
During the independent assessment, all other factors were assumed to be constant; being a part of a PSNP household was not associated with a minimum acceptable diet during factor assessment. In addition to this, we assessed the combined effect of the other variables, which were assessed by doing univariable and multivariable binary logistic regression models. In the univariable binary logistic regression analysis, caregiver/maternal, marital status, the age of the child, family size, the educational status of the father, the occupational status of the father, breastfeeding, extra food before 6 months, wealth index, and the place of delivery were the significant variables.
Finally, in multivariable binary logistic regression, marital status, the educational status of the father, child age, and places of delivery were the associated factors for the uptake of a minimum acceptable diet among infants aged 6–23 months (Table 5).
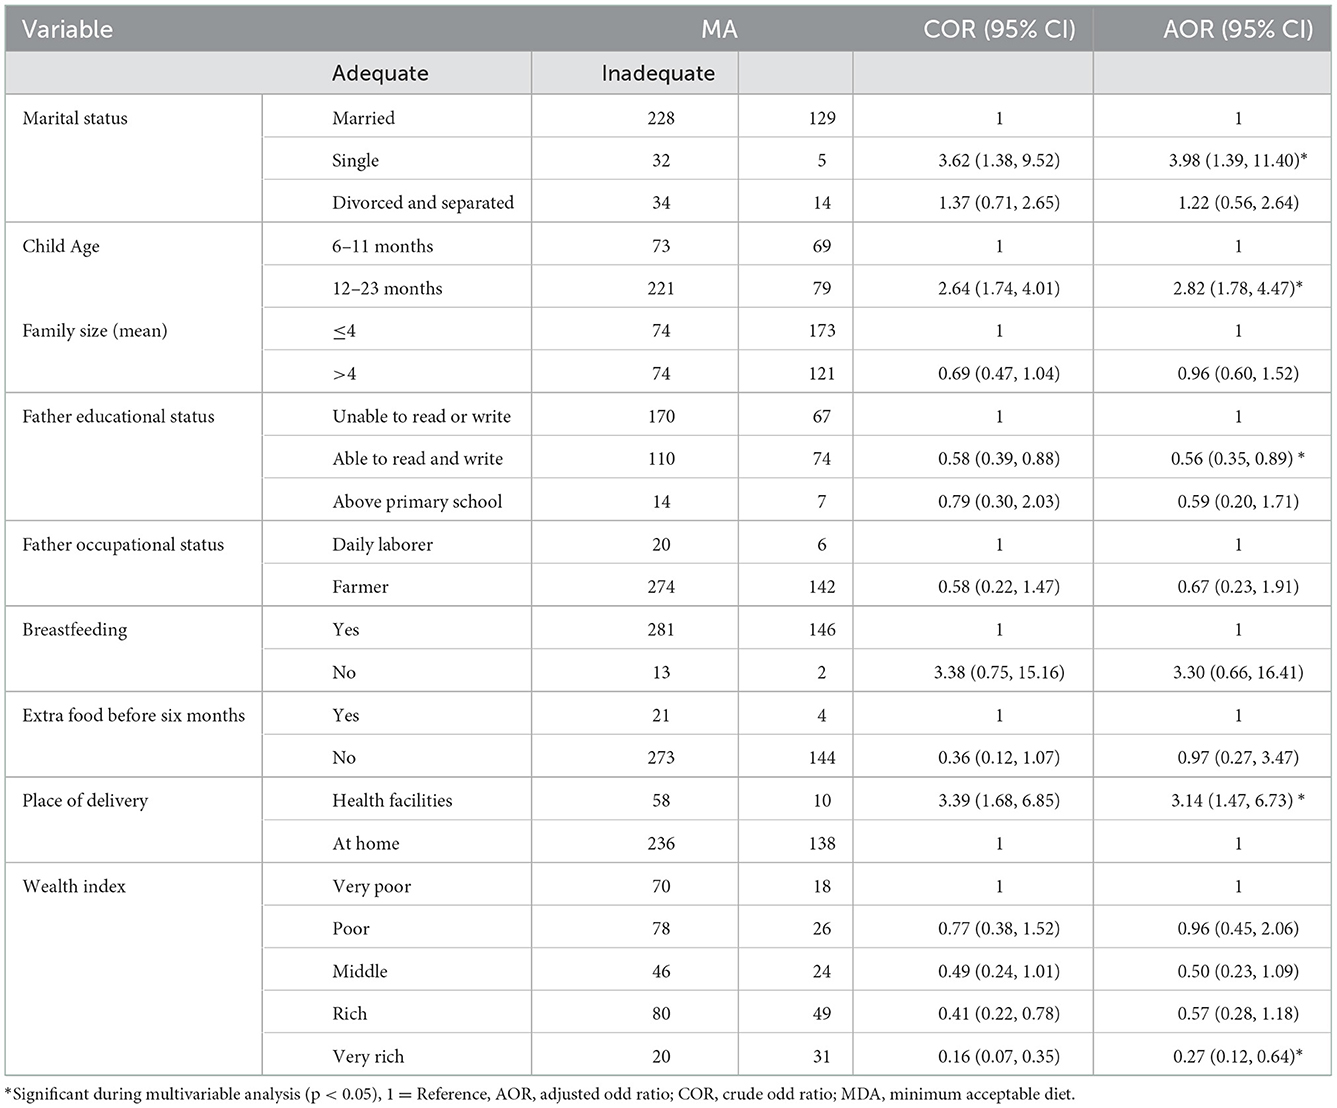
Table 5. Factors associated with MAD uptake among infants aged 6–23 months in South Gondar Zone, Northwest Ethiopia, 2017 (n = 442).
Here, infants of single women were 3.98 times (AOR = 3.98, 95% CI: 1.39, 11.40) more likely to have/receive MAD as compared to infants of married women. Infants aged 11–23 months were 2.82 times (AOR = 2.82, 95% CI: 1.78, 4.47) more likely to have/receive MAD. In addition, while we compared children's fathers who could not read and write, children's fathers who could read and write were 44% less likely (AOR = 0.56, 95% CI: 0.35, 0.89) to receive an inadequate minimum acceptable diet. In addition, infants born in health institutions were 3.14 times (AOR = 3.14, 95% CI: 1.47, 6.73) more likely to have MAD. Furthermore, infants from the wealthiest families are 73% (AOR = 0.27, 95% CI: 0.12, 0.64) less likely to have an insufficient MAD intake than their peers.
Discussion
Despite enormous intervention by stakeholders, in Ethiopia, chronic food insecurity and undernutrition remain significant public health problems that affect the nutritional status of infants (Central Statistical Agency (Ethiopia) ICF International, 2014; Haile et al., 2016). In Ethiopia, PSNP was implemented to prevent existing household asset reduction and increase consumption by poorer/poorest household members. Being a part of this program may help to avoid the risk of food self-insufficiency or acute shortage and to build assets. Socioeconomic status is a necessary factor for optimal health (Fotso and Kuate-Defo, 2005; Gwatkin et al., 2007), which is determined using the wealth status or possession score from selected household items (Houweling et al., 2003; Mohsena et al., 2010), which influences the proportion of a minimum dietary diversity, meal frequency, and minimum acceptable diet directly or indirectly.
The magnitudes of the overall minimum dietary diversity score, minimum meal frequency, and overall minimum acceptable diet were 79.86, 82.58, and 66.52%, respectively. In this study, the proportion of MAD is higher than that shown in the research conducted in Ethiopia, which ranges from 4.2 to 13.3% (Abeshu et al., 2016; Gizaw and Tesfaye, 2019; Mulat et al., 2019; Tassew et al., 2019). Similarly, the magnitude of MDDS and MMF is also high when we compared it with the study findings in North Showa, Ethiopia, which are 45 and 33%, respectively (Gizaw and Tesfaye, 2019). The possible reasons may be due to the difference in the data collection period and residential differences, household socioeconomic status, cultural differences, child feeding knowledge of the mother, existing interventions by stakeholders, and dietary habits.
Here, infants of single women were 3.98 times more likely to have/receive MAD when we compared them to infants of married women. This could be because single women might have a high decision-making capacity (Mulat et al., 2019), a small family size, and increased care.
Infants aged 11–23 months were 2.82 times more likely to have/receive MAD, which is consistent with EDHS data analysis findings (Tassew et al., 2019). The study findings are similar in Ghana and Uganda (Ng et al., 2012; Na et al., 2018). However, according to the study findings in Wolita Sodo, Ethiopia (Mekonnen et al., 2017), infants age and infants receiving MAD are inversely related. The possible cause might be the change in mothers'/caregivers' knowledge, behavior, and meal frequency due to the diminishing breast milk production. In addition, as infants grow and develop, their bodies may demand more nutrients, leading to an increase in food cravings.
When compared to infants whose fathers could not read or write, those whose fathers could read and write were 44% less likely to receive a minimum acceptable diet. The result of this study is invariant with the research done in Oromia, Ethiopia (Mulat et al., 2019), Enemay District, Northwest Ethiopia (Gessese et al., 2014) and is consistent with EDHS data analysis findings (Tassew et al., 2019). Additionally, it is a strong predictor similarly in South Asia, Bangladesh, and Nepal (Kabir et al., 2012; Senarath and Dibley, 2012; Khanal et al., 2013). The possible reason might be the link between educational status, income, exposure to mass media, and knowledge about healthy dietary habits.
Furthermore, infants born in hospitals were 3.14 times more likely to have MAD than those born at home. The study finding is similar to the study conducted in Oromia, Ethiopia (Mulat et al., 2019). This might be due to appropriate counseling by healthcare providers on proper IYCF practices, their importance, and their effect on optimal health.
Furthermore, infants from the wealthiest families are 73% less likely to have insufficient MAD than their peers. This finding is consistent with other studies that showed that infants in high-income households consume a more diverse diet than those in low-income households (Gessese et al., 2014; Solomon et al., 2017). This could be due to household purchasing power for a variety of foods. Similarly, a high income may be associated with a higher level of education, which may increase knowledge about proper child feeding.
Limitations of the study
One of the limitations of this study is that it could not link MAD to specific causes; it was difficult to establish a possible causality, and it was unable to include knowledge, attitude, and practice of caregivers/mothers related to infant and young child feeding (IYCF) due to the nature of the data (secondary data), and recall-related problems. Finally, the IYCF program indicators were not a part of this study.
Conclusions
Nearly two-thirds of the infants had/received a minimum acceptable diet. Moreover, households' Productive SafetyNet status has no statistical impact, and the proportion of the minimum acceptable diet was low in the study area. There were program phases or stages implemented in the past before phase 4 (productive SafetyNet program) was launched. So, this is the comparison of phase 4 (the current) with the past (phase 3 and before it). Here, marital status, the educational status of the father, the child's age, and the place of delivery were the associated factors for the uptake of a minimum acceptable diet among infants aged 6–23 months.
Based on this, stakeholders should have to strengthen the PSNPs through the integration of current nutrition and other health-related strategies/programs to increase MAD uptake. Moreover, health professionals shall have to provide health and nutrition education and counseling based on the child's age, the father's educational status, the marital status of the woman or caregiver, and the place of delivery through other child and reproductive healthcare services.
Data availability statement
The raw data supporting the conclusions of this article will be made available by the authors, without undue reservation.
Ethics statement
The studies involving human participants were reviewed and approved by Ethical Review Committee of Debre Tabor University. The patients/participants provided their written informed consent to participate in this study.
Author contributions
ME and AG made the draft of the proposal for data collection. ME, AG, BK, DT, ST, and YS contributed to the acquisition and analysis of data and to the interpretation or discussion, the results of the manuscript, the analysis, interpretation, discussion and results, and revised the manuscript. All the authors read and approved the final manuscript.
Conflict of interest
The authors declare that the research was conducted in the absence of any commercial or financial relationships that could be construed as a potential conflict of interest.
Publisher's note
All claims expressed in this article are solely those of the authors and do not necessarily represent those of their affiliated organizations, or those of the publisher, the editors and the reviewers. Any product that may be evaluated in this article, or claim that may be made by its manufacturer, is not guaranteed or endorsed by the publisher.
Abbreviations
AOR, adjusted odds ratio; COR, crude odds ratio; HEWs, health extension workers; MAD, minimum acceptable diet; MDDS, minimum dietary diversity score; MMF, minimum meal frequency; PSNP, Productive SafetyNet program; SD, standard deviation; WEPLAUO: Libo Kemekem Word Environmental Protection, Land Administration; SWEPLAUO: Simada Worda Environmental Protection, Land Administration and Use Office; WHO, World Health Organization.
References
Abeshu, M. A., Lelisa, A., and Geleta, B. (2016). Complementary feeding: review of recommendations, feeding practices, and adequacy of homemade complementary food preparations in developing countries—lessons from Ethiopia. Front. Nutr. 3, 41. doi: 10.3389/fnut.2016.00041
Alderman, H. (2010). Safety nets can help address the risks to nutrition from increasing climate variability. J. Nutr. 140, 148S−52S. doi: 10.3945/jn.109.110825
Belachew, T., Hadley, C., Lindstrom, D., Gebremariam, A., Lachat, C., Kolsteren, P., et al. (2011). Food insecurity, school absenteeism and educational attainment of adolescents in Jimma Zone Southwest Ethiopia: a longitudinal study. Nutr. J. 10, 29. doi: 10.1186/1475-2891-10-29
Berhane, G., Hoddinott, J. F., and Kumar, N. (2012). The Impact of Ethiopia'sProductive SafetyNets and Household Asset Building Programme: 2006–2010. Washington, DC: International Food Policy Research Institute.
Central Statistical Agency (Ethiopia) and ICF International. (2011). Ethiopia Min Demographic and Health Survey 2011. Addis Ababa, and Calverton, MA: Central Statistical Agency and ORC Macro.
Central Statistical Agency (Ethiopia) and ICF International. (2014). Ethiopia Min Demographic and Health Survey 2014. Addis Ababa, and Calverton, MA: Central Statistical Agency and ORC Macro.
Central Statistical Agency (Ethiopia) and ICF International. (2016). Ethiopia Demographic and Health Survey 2016. Addis Ababa, and Calverton, MA: Central Statistical Agency and ORC Macro.
Chambers, R. (1989). Editorial Introduction: Vulnerability, Coping and Policy. IDS Bulletin. 20:1–7. doi: 10.1111/j.1759-5436.1989.mp20002001.x
Conforti NWCCNTP. (2014). Refinements to the FAO Methodology for Estimating the Prevalence of Undernourishment Indicator. Rome: FAO, 1–35.
CSA (2011). Ethiopia Demographic and Health Survey: Addis Ababa. Calverton, MA: Central Statistics Agency and ORC Macro.
Devereux, S. (2000). Food Insecurity in Ethiopia: A Discussion Paper for DFID. Brighton: Institute for Development Studies, University of Sussex.
Devereux, S., Sabates-Wheeler, R., Tefera, M., and Taye, H. (2006). Ethiopia's Productive SafetyNet Program: Trends in PSNP Transfers Within Targeted Households. Brighton: Institute of Development Studies.
Drinkwater, M., and McEwan, M. eds. (1992). “Household food security and environmental sustainability in farming systems research: developing sustainable livelihoods,” in Adaptive Planning Research Team Bi-annual Review Meeting (Mangu).
Fotso, J.-C., and Kuate-Defo, B. (2005). Measuring socioeconomic status in health research in developing countries: should we be focusing on households, communities or both? Soc. Indicat. Res. 72, 189–237. doi: 10.1007/s11205-004-5579-8
Frankenberger, T. R., and McCaston, M. K. (1998). The household livelihood security concept. Food Nutr. Agric. 14, 30–35.
Gessese, D., Bolka, H., Alemu Abajobir, A., and Tegabu, D. (2014). The practice of complementary feeding and associated factors among mothers of infants 6–23 months of age in Enemay district, Northwest Ethiopia. Nutr. Food Sci. 44, 230–240. doi: 10.1108/NFS-07-2013-0079
Gilligan, D. O., Hoddinott, J., and Taffesse, A. S. (2009). The impact of Ethiopia's Productive SafetyNet Programme and its linkages. J. Dev. Stud. 45, 1684–1706. doi: 10.1080/00220380902935907
Gizaw, G., and Tesfaye, G. (2019). Minimum acceptable diet and factor associated with it among infant and young infants age 6–23 months in North Shoa, Oromia Region, Ethiopia. Int. J. Homeopathy Natl. Med. 5, 1. doi: 10.11648/j.ijhnm.20190501.11
Gwatkin, D. R., Rutstein, S., Johnson, K., Suliman, E., Wagstaff, A., Amouzou, A., et al. (2007). Socio-Economic Differences in Health, Nutrition, and Population Within Developing Countries. Washington, DC: World Bank, 287.
Haile, D., Azage, M., Mola, T., and Rainey, R. (2016). Exploring spatial variations and factors associated with childhood stunting in Ethiopia: a spatial and multilevel analysis. BMC Paediat. 16, 49. doi: 10.1186/s12887-016-0587-9
Horton, R., and Lo, S. (2013). Nutrition: a quintessential sustainable development goal. Lancet. 382, 371–372. doi: 10.1016/S0140-6736(13)61100-9
Houweling, T. A., Kunst, A. E., and Mackenbach, J. P. (2003). Measuring health inequality among infants in developing countries: does the choice of the indicator of economic status matter? Int. J. Equity Health. 2, 8. doi: 10.1186/1475-9276-2-8
IFAD (2016). Rural Poverty in Ethiopia. Rome: IFAD. Available online at: http://www.ruralpovertyportal.org/country/home/tags/ethiopia (accessed April 19, 2016).
Kabir, I., Khanam, M., Agho, K. E., Mihrshahi, S., Dibley, M. J., Roy, S. K., et al. (2012). Determinants of inappropriate complementary feeding practices in infant and young infants in Bangladesh: secondary data analysis of Demographic Health Survey 2007. Maternal Child Nutr. 8, 11–27. doi: 10.1111/j.1740-8709.2011.00379.x
Khanal, V., Sauer, K., and Zhao, Y. (2013). Determinants of complementary feeding practices among Nepalese infants aged 6–23 months: findings from demographic and health survey 2011. BMC Pediat. 13, 131. doi: 10.1186/1471-2431-13-131
Laraia, B. A., Siega-Riz, A. M., Gundersen, C., and Dole, N. (2006). Psychosocial factors and socioeconomic indicators are associated with household food insecurity among pregnant women. J. Nutr. 136, 177–182. doi: 10.1093/jn/136.1.177
Mekonnen, T. C., Workie, S. B., Yimer, T. M., and Mersha, W. F. (2017). Meal frequency and dietary diversity feeding practices among infants 6–23 months of age in Wolaita Sodo town, Southern Ethiopia. J. Health Popul. Nutr. 36, 18. doi: 10.1186/s41043-017-0097-x
MoALR (2014). Productive SafetyNet Programme Phase IV: Programme Implementation Manual, Ministry of Agriculture (Ethiopia). New Delhi: MoA, 2–3.
Mohsena, M., Mascie-Taylor, C. G., and Goto, R. (2010). Association between socioeconomic status and childhood undernutrition in Bangladesh; a comparison of possession score and poverty index. Public Health Nutr. 13, 1498–1504. doi: 10.1017/S1368980010001758
Mulat, E., Alem, G., Woyraw, W., and Temesgen, H. (2019). Uptake of minimum acceptable diet among infants aged 6–23 months in orthodox religion followers during fasting season in a rural area, DEMBECHA, north West Ethiopia. BMC Nutr. 5, 18. doi: 10.1186/s40795-019-0274-y
Na, M., Aguayo, V. M., Arimond, M., Dahal, P., Lamichhane, B., Pokharel, R., et al. (2018). Trends and predictors of appropriate complementary feeding practices in Nepal: an analysis of national household survey data collected between 2001 and 2014. Maternal Child Nutr. 14, e12564. doi: 10.1111/mcn.12564
Ng, C. S., Dibley, M. J., and Agho, K. E. (2012). Complementary feeding indicators and determinants of poor feeding practices in Indonesia: a secondary analysis of 2007 Demographic and Health Survey data. Public Health Nutr. 15, 827–839. doi: 10.1017/S1368980011002485
Popkin, B. M. (2004). The nutrition transition: worldwide obesity dynamics and their determinants. Int. J. Obes. 28, 52–59. doi: 10.1038/sj.ijo.0802804
Senarath, U., and Dibley, M. J. (2012). Complementary feeding practices in South Asia: analyses of recent national survey data by the South Asia Infant Feeding Research Network. Matern Child Nutr. 8, 5–10. doi: 10.1111/j.1740-8709.2011.00371.x
Solomon, D., Aderaw, Z., and Tegegne, T. K. (2017). Minimum dietary diversity and associated factors among infants aged 6–23 months in Addis Ababa, Ethiopia. Int. J. Equity Health. 16, 181. doi: 10.1186/s12939-017-0680-1
SWEPLAUO (2020). Simada Worda Environmental Protection, Land Administration and Use Office Annual Report 2012.
Tassew, A. A., Tekle, D. Y., Belachew, A. B., and Adhena, B. M. (2019). Factors affecting feeding 6–23 months age infants according to minimum acceptable diet in Ethiopia: a multilevel analysis of the Ethiopian Demographic Health Survey. PLoS ONE. 14, e0203098. doi: 10.1371/journal.pone.0203098
WEPLAUO (2020). Libo Kemekem Word Environmental Protection, Land Administration and Use Office Annual Report 2012. Kyiv: WEPLAUO.
Keywords: impact, Productive SafetyNet program, minimum acceptable diet, children, Ethiopia
Citation: Engidaw MT, Gebremariam AD, Kefale B, Tesfa D, Tiruneh SA and Shiferaw YF (2023) Impact of the Productive SafetyNet Program on the minimum acceptable diet in the rural community of South Gondar Zone, Northwest Ethiopia. Front. Sustain. Food Syst. 6:977727. doi: 10.3389/fsufs.2022.977727
Received: 28 June 2022; Accepted: 25 November 2022;
Published: 12 January 2023.
Edited by:
Arun Jyoti Nath, Assam University, IndiaReviewed by:
Mohammad Chhiddikur Rahman, Bangladesh Rice Research Institute, BangladeshGetnet Mihretie, Debre Tabor University, Ethiopia
Mulu Tiruneh, Debre Tabor University, Ethiopia
Shuvasish Choudhury, Assam University, India
Copyright © 2023 Engidaw, Gebremariam, Kefale, Tesfa, Tiruneh and Shiferaw. This is an open-access article distributed under the terms of the Creative Commons Attribution License (CC BY). The use, distribution or reproduction in other forums is permitted, provided the original author(s) and the copyright owner(s) are credited and that the original publication in this journal is cited, in accordance with accepted academic practice. No use, distribution or reproduction is permitted which does not comply with these terms.
*Correspondence: Melaku Tadege Engidaw,  meltad24@gmail.com