Insights into land size and productivity in Ethiopia: What do data and heterogenous analysis reveal?
 Ashok K. Mishra
 Kamel Louhichi
 Giampiero Genovese3
 - 1Kemper and Ethel Marley Foundation Chair, Arizona State University, Tempe, AZ, United States
- 2Université Paris-Saclay, INRAE, AgroParisTech, Paris Saclay Applied Economics, Palaiseau, France
- 3European Commission, Joint Research Centre, Seville, Spain
This study investigates whether the historical inverse relationship (IR) between land (farm and plot) size and productivity holds for Ethiopia farms. The study uses plot-level and household-level data from the three waves of the Ethiopia Socioeconomic Survey. The main finding, which confirms previous studies, is that the plot-size IR holds when productivity measurement is based on self-reported yields. However, the effects were reversed when we used crop-cut yields. Including labor inputs significantly reduces the magnitude of the coefficients on land size but not the sign. Finally, the quantile regression reveals interesting findings. These are: (1) a strong positive effect of farm (and plot) size on productivity; (2) the magnitude of the effect decreases monotonically with quantile; (3) farm size displays a robust negative impact on gross revenue and the magnitude of the effect increases (in absolute terms) monotonically with quantiles; (4) the effect of farm (and plot) size on productivity decreases in magnitude when we control for labor input; (5) the IR between farm (and plot) size and total and family labor was negative and significant and the effect increases (in absolute terms) monotonically with quantiles.
Introduction
Sub-Saharan Africa (SSA) is home to 40 percent of the world's poorest people (Ferreira et al., 2016), and a significant majority of them rely on agriculture as a source of livelihood and income-generating activity (Livingston et al., 2011). With most people deriving their livelihood from agricultural work, understanding the level and the role of agricultural productivity in reducing poverty and increasing economic development is essential. For instance, Irz et al. (2001) show that a 10 percent increase in land productivity leads to a 7 percent decrease in Africa's poor people. Byerlee et al. (2009) reveal that the countries with the highest agricultural growth per worker experienced the most significant rural poverty reduction rate. Several other studies (e.g., Mellor, 1999; Thirtle et al., 2001; Ravallion and Chen, 2007; Schneider and Gugerty, 2011) confirm a positive relationship between agricultural productivity growth and poverty alleviation. Thus, there are multiple pathways through which increases in agricultural productivity can reduce poverty, including income changes, employment generation, rural non-farm multiplier effects, and a decline in food prices (Bresciani and Valdés, 2007; Schneider and Gugerty, 2011). Beyond poverty reduction, agricultural growth has been identified as enormously beneficial to other crucial aspects of development, namely nutrition: a 10% increase in agricultural GDP per capita reduces child stunting by 9.6% (as opposed to 8.4% for non-agricultural; Mary et al., 2017).
In recognizing the potential role of agricultural productivity, especially land productivity, in overcoming poverty and spurring economic development, the question is whether smallholdings1 are the fundamental units. In other words, to what extent the smallholdings maybe focus on economic growth when the policymakers in developing economies want to make economic progress? If the smallholdings are the focal point, then to what extent does the historical inverse relationship (IR) between land size (i.e., farm size or plot-size) and land productivity still hold, particularly in SSA? For decades, it has been widely accepted that there is an inverse relationship between farm size and productivity in many developing economies (often referred to as farm-size IR) (Chayanov, 1926; Sen, 1962; Binswanger et al., 1995; Vollrath, 2007; Carletto et al., 2013; Larson et al., 2013; Kagin et al., 2015; Julien et al., 2019; Wassie et al., 2019). Such IR implies that smaller farms (plots) are more productive than larger ones. Therefore, breaking small farms into smaller units (land fragmentation) may further enhance productivity. This empirical finding has received considerable attention from policymakers in developing countries because it could motivate land redistribution from medium-large landowners to more productive small peasants. It constitutes an opportunity to achieve both equity and efficiency. In fact, through the same land reform instrument that promotes smallholders, it would be possible to support the welfare of (relatively) poor households and stimulate aggregate productivity (Cornia, 1985).
However, the IR hypothesis has increasingly been questioned, and several studies have found evidence to the contrary (Newell et al., 1997; Fan and Chan-Kang, 2005; Otsuka et al., 2016). Other studies have shown a U-shaped relationship between farm-size and productivity (Kimhi, 2006; Foster and Rosenzweig, 2017; Jayne et al., 2019; Muyanga and Jayne, 2019). Although most of these studies focus on South and Southeast Asia, their policy implications were worldwide, particularly in Africa. Indeed, many African governments have used the inverse relationship between size and productivity findings to re-evaluate their agrarian policy. Other governments have gone one step further by promoting a land consolidation policy (instead of land fragmentation) and supporting the development of medium and large-scale farms to improve agricultural productivity and transform countries' agricultural sectors.
Among these countries, one could quickly mention Ethiopia, which seems to have been subject to land grabs in an attempt to transform the effectiveness of agricultural production (Tura, 2018). Recall that the Derg regime in 1975 nationalized all rural land, giving land use rights to the smallholders. In the 1990s, the government of Zenawi argued that state land ownership protected smallholders from the landholding class, provided social security, and reduced urban migration (Lavers, 2018). However, increased urbanization and rapid population growth have led to diminishing landholdings. Additionally, land insecurity reduced land investment, and as a result, agricultural productivity has suffered (Deininger and Jin, 2005). Accordingly, this study's main objective is to test the inverse relationship between productivity and land size at both plot and farm (holding) levels for small-medium farm households in Ethiopia. The study uses two measures of productivity, namely yield and gross revenue. We use yield when we analyse plot-size and productivity relationships. However, we use gross revenue when investigating the relationship between farm size and productivity. We also use two yield measurements, self-reported and crop-cut,2 to tease out any biases in reporting and mismeasurement.
The paper is organized as follows. The following section reviews the main strands of literature related to the land-size (particularly farm-size) and productivity relationship. Section Empirical framework describes the econometric models and the data. Section Results and discussion presents and discusses the results. The final section summarizes the contributions of the analysis to the literature and discusses the findings' policy implications.
Literature review
The controversy about an inverse relationship (IR) between land-size and productivity has been one of the enduring debates in the development and agricultural economics literature. Although the inverse plot-size and farm-size relationships are closely related, more attention has been given by researchers and policymakers to farm-size IR because of its controversial implications for land reform. For instance, Chayanov (1926) first discovered farm-size productivity inverse relationships among Russian farms. In India, Sen (1962) found that smaller farms employed more labor per hectare, and farm productivity decreased with farm size. In India's case, Eswaran and Kotwal (1986) show that small farms have a higher output per hectare than large farms because of the increasing marginal cost of supervision. Small farms mostly rely on family labor and hence have advantages in labor supervision. A study by Larson et al. (2013) using farm household survey data from four countries (Malawi, Tanzania, Kenya, and Uganda) concludes a negative relationship between farm size and output. The farm-size IR has been observed in many developing countries, including countries in Africa (see Barrett, 1996; Kimhi, 2006; Carletto et al., 2013; Larson et al., 2013; Kilic et al., 2017; Khataza et al., 2019), South Asia (see Heltberg, 1998; Benjamin and Brandt, 2002; Gautam and Ahmed, 2019), and Latin America (see Kagin et al., 2015).
On the contrary, several other studies have revealed a positive relationship between land size and productivity. For instance, Obasi (2007) found that farm size is positively related to agricultural productivity in Nigeria. The author argues that a positive relationship could be due to low-quality inputs used by smallholders. Kimhi (2006) examined the relationship between farm size and maize output in Zambia. Treating plot size as exogenous, the author found a positive and significant relationship between maize yield and plot size. Additionally, the author found the economies of scale as dominant throughout the plot-size distribution. However, the author found an inverse relationship between plot size and maize yield when treating plot size as an endogenous variable (farmer's self-selection into maize production). Similarly, Chen et al. (2011) found that the inverse relationship disappeared once they controlled for unobserved land quality. The authors found that farm output was proportional to farm size.
Other authors propose a U-shaped relationship between farm-size and productivity. For instance, Muyanga and Jayne (2019), using a representative sample of farms in Kenya's high-potential zones, found that the relationship between farm size and productivity is: (i) negative on farms between zero and 3 hectares, (ii) relatively at on farms between 3 and 5 hectares, and (iii) strongly positive on farms between 5 and 70 hectares. Other studies have shown that the relationship between land size and productivity depends on the country and region of smallholders and the crop/livestock activities. The choice of the output variables (net returns, gross revenue, yield, total factor productivity, etc.) is used in the analysis (Garzon Delvaux et al., 2020). For instance, Rada and Fuglie (2019) have found, based on a set of case studies, that the size-productivity relationship evolves with the level of economic development of the country. In particular, small farms in low-income or developing countries face relative productivity advantages (an inverse farm size-productivity relationship). In contrast, large farms in developed countries tend to be more productive than small farms. The above literature reveals that there is still no consensus on the relationship between land size (plot size/farm size) and productivity, at least in developing countries.
Recently, there has been growing interest in finding the reasons for land-size IR. Recent research by Otsuka et al. (2016) concludes that owing to technology, IR may disappear in Asian countries. The authors argue that due to the rapid economic growth and wage increases in Asia, labor-saving and machine-using production methods have increased farming efficiency. Large-scale mechanized farms have become more efficient, which tends to weaken the farm-size IR relationship. This is consistent with Deolalikar (1981) work, which found, using cross-sectional regional data from India, that the introduction of technology on traditional farms diminished the IR and reversed so that large farms had higher productivity compared to small farms. However, this reversal of the inverse relationship was explained by the increased importance of credit-intensive cash inputs such as fertilizer and improved seeds that were not necessarily accessible to small farms. The author concluded that the relaxation of credit constraints on small farms could result in the adoption of new technologies, and the IR would disappear or cease to exist. Similarly, Gautam and Ahmed (2019) have found, using total factor productivity (TFP), that the inverse farm size-productivity relationship has diminished over time in Bangladesh due to the development of modern technologies and wage growth. In addition to technology access, several other explanations offered so far in the literature support the IR hypothesis. These include market imperfections, measurement errors, land quality, and farmers' education and skills. Below we discuss the literature in detail.
Market imperfections and IR
In the 20th century, attempts to explain the IR primarily relied on market imperfections that prevented efficient land allocation, including missing land, credit, labor, or insurance markets. Missing land is referred to as land the operator did not realize belonged to him. In a study, Sen (1966) investigated peasant agriculture in India, and his “dual market theory” was the first to show the labor market imperfection. The author found a substantial gap between (the highest) wage rates outside the peasant economy and the (lowest) real wages/cost of labor on the farms. Sen argues that the labor market in the farming sector is characterized by surplus labor and the wage gap,3 yet small farms will be more productive than large farms in the long run. Using national plot-level data, Ali and Deininger (2015) found that the inverse relationship between farm size and output per hectare existed because of labor market imperfections. Specifically, the authors found that the inverse relationship exists if profits with family labor valued at shadow wages4 are used but disappear if family labor is valued at the village-level market wage rates. Kagin et al. (2015), using panel data from Mexico found that agricultural wage rates, in particular, tend to be higher on large farms than on small farms. In a comprehensive study, Feder (1985) pointed out that IR relates to the coexistence of imperfections in the land, labor, and capital markets. Also, Barrett (1996) argued that the absence of the insurance market suffices to explain farm-size IR if some small farmers are price-risk averse. Missing markets have been found to explain farm productivity discrepancies between households (see Feder, 1985; Carter and Wiebe, 1990; Kimhi, 2006). Other studies in the literature focus on the supervision cost of hired labor on farms as the IR's likely explanation (see Binswanger et al., 1995; Heltberg, 1998; Deininger et al., 2018). In the early 2000s, Assunção and Ghatak (2003) theoretically showed that farm-size productivity IR results from imperfections in the credits markets and heterogeneity in farmer skills, even after controlling for diminishing returns to any input.
However, imperfect market theories are rejected by Assunção and Braido (2007), who test them using plot-level data from India. They found that smaller plots are more productive than larger ones, even within a farm household. The IR relationship is related to the plot's unobserved characteristics rather than the household. In other words, missing markets cannot explain differences in the productivity of parcels held by the same family. The data shows that the inverse relationship still holds even after controlling for family-fixed effects and household-period fixed effects. With a doubling of plot size, output decreased from 30 to 16% after controlling for observed plot attributes (plot distance to dwelling, plot slope, potential wetness index, and plot title ownership). In conclusion, the characteristics of the farm or the plot influenced the inverse relationship more than the household's characteristics.
Soil quality and IR
Evidence arguing that the IR is a spurious result caused by the omission of soil quality in regression is diverse. For example, Bhalla and Roy (1988) found that soil factors are important determinants of farms' productivity, and the inclusion of soil quality in production functions could weaken the IR. However, Heltberg (1998) argues that the results obtained by Bhalla and Roy are only valid district-level aggregate data rather than household-level data. Other studies (see Benjamin, 1995; Benjamin and Brandt, 2002; Chen et al., 2011; Larson et al., 2013) have shown that farm-size-productivity IR can be explained by soil fertility (or soil quality)—small farms have more fertile soil than large farms. Lamb (2003) argues that land quality's inclusion largely explains the IR between farm size and profits. In a study of farms in India, Assunção and Braido (2007) found that the IR is related to land value and other plot attributes (namely, soil type and presence of irrigation) rather than the household. In contrast, using Madagascar's data, Barrett et al. (2010) estimated production and yield functions incorporating detailed soil quality measurements. The authors argue that IR can only marginally be attributed to variations in soil quality. A drawback of most of the above studies in developing countries is that they lack precise data on farm-specific soil quality (e.g., soil nutrients).
Measurement errors and IR
Several studies have investigated if IR arises due to statistical and econometric modeling issues stemming from missing data or measurement errors (see Benjamin, 1995; Binswanger et al., 1995; Desiere and Jolliffe, 2018; Abay et al., 2019; Gourlay et al., 2019). Measurement error for land size may explain part of the IR. For instance, in the early 2000s, Lamb (2003) empirically tested the robustness of IR and found that the IR is much stronger in fixed effects than in random-effects estimates. Lamb (2003) finding is consistent with the well-known tendency of fixed effects to exacerbate measurement errors. Similarly, Barrett et al. (2010) estimated production and yield functions that included household-level fixed impacts. They found that only a small portion of the IR is explained by market imperfections, while the possibility of measurement error causes most of the IR. With the application of GPS devices, Kelly et al. (1995) identified that using the GPS method contributes to making land area measurement less costly and time-consuming. In contrast, Carletto et al. (2013) rejected the hypothesis that IR may be a statistical artifact linked to land measurement errors. They found that the IR hypothesis's empirical validity is strengthened by applying better measures of land size—collected using GPS devices in Uganda. Finally, in India, using profits as a measure of output has either weakened the relationship (see Rosenzweig and Binswanger, 1993) or made it disappear completely, as indicated by Carter (1984) and Lamb (2003).
Similarly, Desiere and Jolliffe (2018) consider the measurement error in self-reported production using a new explanation for the relationship between plot size and productivity. They found no IR between plot size and productivity when crop cuts are used to measure output. In contrast, when self-reports of production are used, there is a strong IR. Their findings reveal that when farmers report production, it is over-reported on small plots and underreported on larger parcels and measurement error drives the inverse relationship. The authors conclude that IR is an artifact of systematic over-reporting production on small plots and under-reporting on larger plots. Similar results are obtained by Dillon et al. (2019), who indicate that using three land measurement methods (farmer estimated, GPS, and compass-and-rope), self-reported measurement bias leads to overreporting for small plots and underreporting for large plots. On the contrary, Bevis and Barrett (2020) claim that the edge effect,5 not the measurement error in self-reports, is the driving explanation for the plot-size IR. They show that the IR for maize in Uganda disappears when controlling for plot perimeter relative to plot size.
Farmer education, skills, and IR
The literature on farmer education and farm efficiency indicates that better-educated and skilled farmers are more productive, and farming skills are developed through farming experience (see Lockheed et al., 1980). Carter (1984) found that if farming skills could be enhanced by credit, it would have a differentiation effect absent an equal distribution. In 2003, Assunção and Ghatak (2003) proved that heterogeneity concerning farming skills could provide another reason for the IR even without diminishing returns. The authors argue that there is a range in which small farms are profitable for skilled peasants and non-profitable for unskilled peasants, leading to an IR between farm size and productivity. High-skilled peasants end up farming small farms because smallholders have higher opportunity costs to becoming wage workers.6
However, Assunção and Braido (2007) empirically tested the IR using farm-level data and household fixed-effects from India. The authors found that cross-household heterogeneity (including household size, number of adults, etc.) is insufficient to explain the IR between farm size and productivity. Similarly, Lipton (2010) used differential in farmers' skills as an explanatory variable of farms' productivity, but the evidence does not support that skills could explain the farm-size IR. In a recent study, Henderson (2014) found that household heads with higher education levels tend to be significantly more allocative inefficient; the explanation is beyond the current study's scope. Our review reveals conflicting evidence regarding the relationship among farmers' education, skills, and IR, indicating a theoretical ambiguity.
In summary, from this literature survey, it appears, on the one hand, that there is no clear consensus on the IR hypothesis and, on the other hand, that most of the empirical evidence comes from studies in South and Southeast Asian countries. Pieces of evidence from African case studies remain relatively scarce. Hence, this study aims to contribute to this literature by revisiting the IR hypothesis in Ethiopia, an SSA country, using plot-level and household-level data from the three waves of the Ethiopia Socioeconomic Survey.
Empirical framework
Specification of the models and variables
We use a simple model to test the relation between farm (plot) size and measure of productivity:
where i denotes the farm (plot); Y is the measure of productivity. L denotes farm (plot) size; μ is i.i.d. error term. β1 is the parameter of interest for our discussion on inverse relationship, while the β0 is a vector of intercepts. As explained above, we use two measures of productivity (Y) depending on the scale of analysis (plot vs. farm-level). We use yield—self-reported and crop-cut, similar to other studies (Desiere and Jolliffe, 2018; Gourlay et al., 2019)—when we analyze plot size and productivity relationships. However, when we investigate the relationship between farm-size and productivity, we use the value of sales or gross revenue (birr per hectare).7
Taking the double-log (natural log) formulation in Equation (1) results in the following specification: ln Yi = β0 + β1ln Li + εi where ln Y is the natural log of Y, β1 is the elasticity of productivity with respect to land, and ε is i.i.d. error term. Note that this specification will exclude any observation where Y is not positive. However, the farm (plot) distribution remains more or less the same, and our subsequent analysis will be carried out by extending the double-log formulation.
Recall that Equations (1) is ungenerous specifications involving only one independent variable (regressor) and enable us to test the correlation between returns to cultivation and landholding by testing for rejection of the null hypothesis of no relationship, as against the alternative hypothesis of a negative or a positive relationship. However, our estimates are likely to suffer from the problem of omitted variables bias. We estimate less restrictive models by controlling for some theoretically motivated regressors, which are available in our dataset to address this. These fuller specifications can be presented as:
where the parameter ϕ3 explains the association between productivity and a vector of plot and household-specific controls XC, while ξ is an i.i.d. error term. Some of the farm and farmer-related characteristics, which could have a bearing on the agricultural outcomes that we control, are the extent of irrigation, employment of family labor in cultivation, household assets, number of plots, and age of household head. We can also control for land quality (or plot quality). We use the Ordinary Least Square regression approach to estimate Equation (2). However, OLS only factors in the conditional mean effects of the response variables. Unlike OLS, the quantile regression (QR) approach estimates for the potential scale shift and allows the analyst to drop the assumption that variables operate the same at the upper and lower tails of the distribution as at the conditional mean. QR provides much more information about the conditional distribution of a response variable. Therefore, this study will use the QR approach to understand the IR between farm size and productivity.
A quantile methodology: Measuring heterogeneous effects
Quantile regression is an econometric framework that can allow for different relationships between the dependent variable of interest (regressand) and independent variables (or regressors) to varying points of the regressand's conditional distribution. Explicitly, according to Koenker and Bassett (1978), quantile regression generalized the sample quantiles of conditional quantiles expressed in linear functions of explanatory variables. By allowing conditional functions to be specified at any point across the selected quantiles, quantile regression helps describe the whole conditional distribution of the responsive variables with given regressors. Another attribute of quantile regression is its ability to characterize the entire conditional distribution when there is a heteroskedasticity error in the data. According to Variyam et al. (2002), when there is homoskedasticity in the data, the set of slope parameters of conditional quantile functions in the selected quantiles of the responsive variable's distribution is the same as each quantile and with the slope parameters of the conditional mean function. Therefore, the quantile regression across the selected quantiles of the responsive variable's distribution reproduces the OLS slope coefficients with differences in the intercepts.
Quantile regression (Koenker and Bassett, 1978; Buchinsky, 1998, 2001; Koenker and Hallock, 2001) involves the minimization of
where q is the specified quantile, and n is the sample size. In other words, quantile regression involves the minimization of the residuals' weighted absolute values and uses the maximum information available. In short, the quantile regression method allows an investigator to differentiate the contribution of regressors and the distribution of the dependent variable. Quantile regression has become a core research topic in econometrics due to its advantages over the OLS regression model. There are several advantages to using a quantile regression approach. First, it provides a more detailed conditional distribution of a dependent variable, given a bundle of independent variables. Different quantile coefficients can demonstrate status-dependent impacts, given the current data on inputs, socioeconomic attributes, and soil characteristics. Second, the estimated coefficients from quantile regression are more robust to outliers, as equation (3) intends to minimize the weighted sum of absolute deviations. The truncation problem is also avoided since quantile regression uses the entire sample, eliminating biased estimates when OLS is applied to sub-samples (Heckman, 1979). This study also uses a quantile regression model to measure the various impacts of inputs (fertilizer family, hired, and exchange labor), soil attributes, operator, family, household characteristics, and the actual yield and gross revenue distribution for farms in Ethiopia.
Data and descriptive statistics
We use data from the three waves of the Ethiopia Socioeconomic Survey (ESS), which is nationally representative of farm-households in Ethiopia but is obviously lacking information on large-scale farms.8 The survey, an ongoing project, collected information on both household wellbeing and agricultural activities in Ethiopia. The survey is a joint project between the Central Statistical Agency of Ethiopia (CSAE) and the World Bank's Living Standards Measurement Survey (LSMS)-Integrated Survey on Agriculture. The World Bank has a tradition of collecting household survey data in many other developing and emerging economies. In the case of Ethiopia, the first wave of the survey was administered in 2011–2012 that included 3,969 rural households, the second wave in 2013–2014 included 5,262 households, and the third wave, 2015–16 included 3,271 households. In this study, we only include households interviewed in all three waves, which are all rural.9 The survey gathered information on household characteristics, consumption, living conditions, and health. The survey focused on agriculture to collect detailed and accurate agricultural data at the plot level. Households were visited three times during the agricultural year. The first visit, in September–October, collected data on planting activities. Additionally, during this visit, the area of most plots was measured with GPS. The second visit, in November, implemented the livestock module. The final visit, between January and April, collected data on agricultural production and household information. Finally, it should be noted that the first and last visits included detailed information on labor inputs at the plot level, which we also use in our analysis.
Table 1 describes the variables and summary statistics of variables at the plot level used in this study. Columns 2 and 3 of Table 1 report yield and attributes of plots selected for crop cutting and those self-reported by farmers, while column 4 indicates statistical differences across columns 2 and 3. Table 1 reveals that self-reported yield10 estimates are significantly higher than those based on crop cuts. On the other hand, Table 1 shows that farmers under-report plot size. Additionally, given that crop cuts were conducted on a limited number of randomly selected plots, the number of plots reported by farmers is higher than those selected for crop cutting. Moreover, farmers have varying plot attributes, and differences appear when explaining plot attributes. This is particularly true of the plot elevations where Table 1 indicates a significant difference between the farmer and crop cutting's plot elevation.

Table 1. Summary statistics, self-reported vs. crop cuts, all waves.
Regarding input application, Table 1 shows that a small percentage of fields are irrigated (only 2–4%), a higher share of plots is mono-cropped (i.e., less diversified), and only 10% of the farms applied compost. Still, a higher share of plots used manure. Farmers systematically overestimated the application of commercial fertilizer. Finally, Table 1 shows significant differences in labor usage on the plots. Interestingly, farmers tend to overestimate the family labor usage and underestimate the utilization of hired labor and exchange labor for planting and harvesting seasons (see columns 2 and 3 of Table 1).
Table 2 describes the variables and summary statistics of variables used at the household level in the case where productivity is measured by gross revenue. Unlike Table 1, where the yield can be estimated by crop cutting, in this case, we only report gross revenue as reported by the farmer. Note that all variables related to farm size, plot attributes, and inputs usage are reported as the average of all plot/fields owned/operated by the farming household.
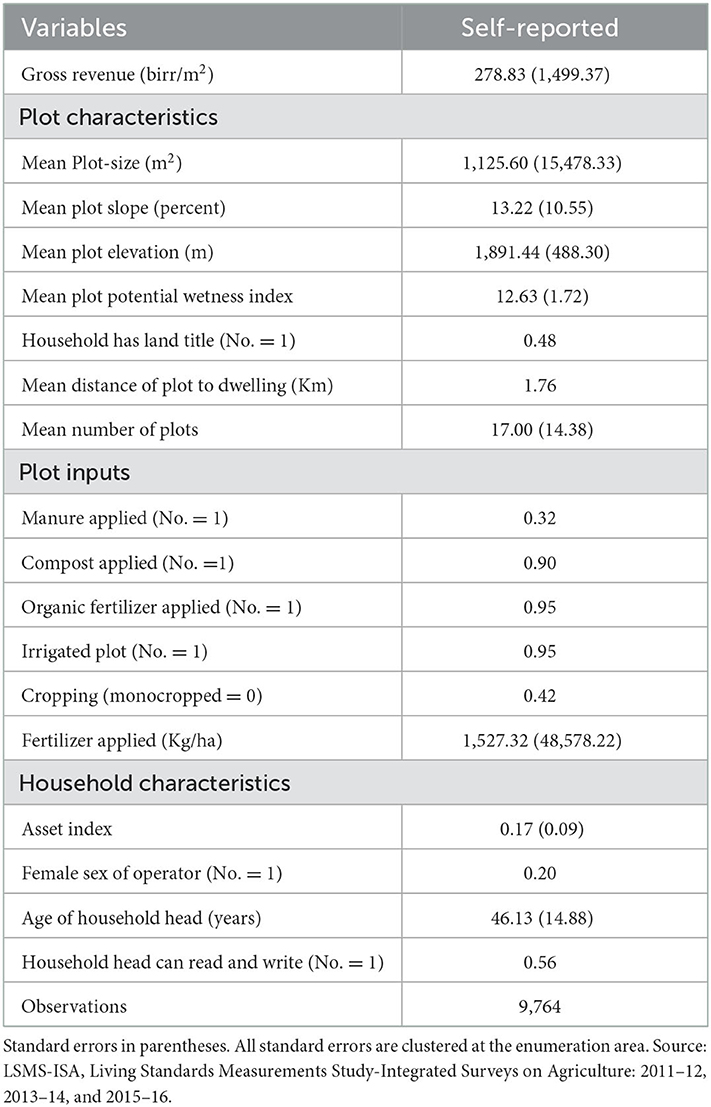
Table 2. Farm-houshold attributes, self-reported, all waves.
Results and discussion
Whole sample regression results
We explore the IR between productivity and land size at plot and farm (holding) levels. First, we present our plots-level results for both self-reported by the farmer and crop cut, with and without the inclusion of labor inputs (family, hired, and exchange labor). Table 3 reports the estimate of the relationship between plot size and both self-reported and crop-cut yields. In the case of self-reported yield without labor inclusion, yield decreases with an increase in plot size (or field size).11 Estimates suggest that doubling plot-size decreases yields by about 35%. This finding is consistent with the literature on a negative relationship between plot size and productivity for several SSA countries.

Table 3. Whole sample regression summary results.
In the case of crop cut yield without the inclusion of labor use, our finding contrasts with many other studies, including the one by Desiere and Jolliffe (2018). The first row of column 6 in Table 3 indicates a positive and significant relationship between plot size and yields. Results show that doubling plot-size increases yield by 12%. These results are consistent with Alexander and Kokic (2005), Kokic et al. (2006), Sheng et al. (2015), and Sheng and Chancellor (2019), who found a positive plot-size productivity relationship. In the panel estimation presented above, we use fixed effects by including the enumeration area. Note that estimates in Table 3 controls for wave (base wave (2011–12), plot attributes (plot slope, elevation, wetness, distance to dwelling, and land title ownership), plot inputs (mono-cropped or diversified, application of fertilizer, manure compost, and irrigation status) and household attributes (age of the operator, female-headed households (HH), assets, and education of HH).
Table 3 also reports parameter estimates when productivity is measured at the farm level using the farmer's self-reported gross revenue (GR). We also control plot attributes, inputs, and household attributes, including the enumeration area and fixed effects. The third row of column 5 in Table 3 reveals that doubling farm size decreases gross revenue by 71%. These estimates are twice as large as those obtained in the previous measure of productivity (yields—see the first row of column 5 in Table 3). Our results are consistent with Carletto et al. (2013), who found IR between GPS-measured farm size and net revenue per acre among rural Uganda households.
The estimates presented till this point exclude labor inputs (family, hired, and exchange labor). Recall that one of the weaknesses of previous studies was the lack of labor data at the plot or field level. To overcome the above criticism, we included labor inputs in our model. We also further delineate the labor usage for planting and harvesting seasons when the demand for labor is high. Estimates reveal that the inclusion of labor use changes the magnitude of the plot size and yield relationship's coefficients but not the sign. The plot-size IR still holds in the self-reported yield, but the estimates are significantly lower than those without labor controls. As shown in Table 3, with the inclusion of labor inputs (see Table 3, second row of column 5), doubling plot-size decreases yield by 23%, while the decline was by 35% without labor inputs. Part of the reduction in the magnitude of the estimates could be explained by the inclusion of labor (family, hired, and exchange) used in the planting and harvesting seasons.
On the other hand, the estimates obtained in the crop cut yield regression are slightly higher than those obtained from regressions that exclude labor usage. As shown in Table 3, in the second row of column 6, doubling the plot-size increases yield by 18%. Findings here underscore the notion that estimates are sensitive to the inclusion of labor inputs. Our estimate is slightly lower (about 3% lower) than those obtained by Desiere and Jolliffe (2018). Let us turn our attention to the estimates of IR between farm size and gross revenue per hectare, self-reported by the operator when labor usage is included. In this case, results show a negative and statistically significant relationship between farm size and productivity. The coefficients reported in the fourth row of column 5 in Table 3 show that doubling farm-size decreases gross revenues per hectare by about 87%. Again, these findings underscore the importance of including labor usage (family, hired, and exchange labor) when assessing farm size and productivity relationships.
We further analyzed the impact of farm size on labor input. In particular, we examined the effect of farm size on total labor input (family and hired labor and individually for family and hired labor input. Appendix Table A5 reports regression by labor inputs (total, family, and hired) by planting and harvesting season. Estimates show a strong inverse relationship between farm size and total labor for planting and harvesting seasons. For example, doubling farm size decreases total labor days by about 31% in the planting season and by 18% in the harvesting season. On the other hand, family labor is negatively affected by farm size for both planting and harvesting seasons. Findings reveal that increased farm size could reduce the demand for family labor. Perhaps, any increase in farm size increases the opportunity cost of family labor. Our finding is consistent with Larson et al. (2013), Ali and Deininger (2015), and Desiere and Jolliffe (2018).
Quantile regression results
Table 4 reports the plot size and productivity relationship findings by selected quantiles12 for both self-reported by the farmer and crop-cut. Parameter estimates reveal an increasing (in absolute terms) effect of plot size on yields in the case of self-reported yield. The magnitude of the coefficient increases (in absolute terms) monotonically with the quantile (see Table 4). For instance, doubling plot-size decreases yields by 29, 36, 42, and 44% for farms in the 20th, 50th, 80th, and 90th quantiles, respectively. Although the relationships between plot size and productivity are negative for all farms, results imply that increasing farm size will have a lower impact on farms' productivity (below the 50th quantile). Interestingly, the 50th quantile (median) estimates are about the same as those obtained in the whole sample regression (see Table 3, the first row of column 5). From the above results, one can conclude that small farms are more efficient regarding the farm-size productivity debate. We observe significant heterogeneity in the farm size and productivity debate.
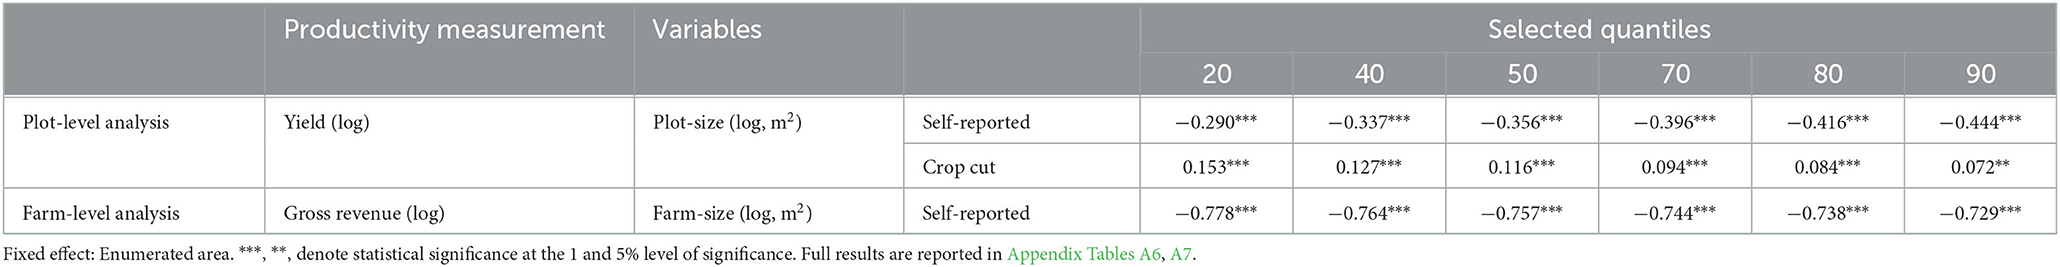
Table 4. Quantile regression summary results.
Table 4 also reports estimates of the model based on crop cut yield. Table 4 indicates a positive and significant effect of plot size on yields. The parameters are statistically significant at the 1% level of significance for all selected quantiles. However, the magnitude of the IR declines with farm size. The magnitude of the coefficient decreases monotonically with quantiles. Estimates show that doubling plot-size increases yields by 15% for farms in the 20th quantile but only 7% for a farm in the 90th quantile. However, the relationship between plot size and yields is insignificant for farms in the 90th quantile. Finally, the 50th (median) quantile estimates are about the same as those obtained from the whole sample regression (see Table 3, the first row of column 6). The above findings show that an additional plot unit (or acreage) would impact farms' productivity at the lower quantiles. Farms in the 70th and higher quantiles have smaller gains from farm expansion and farms in the 90th quantile may not observe any significant benefits from growth.
Table 4 also reports the estimate of farm size and productivity (measured by gross revenue) by selected quantiles. The median quantile (50th) estimate is similar to the estimates obtained for the whole sample regression (see Table 3, the third row of column 5). The magnitude of coefficients decreases (in absolute terms) monotonically with quantile. However, we find a significant variation in the estimates by quantiles. The estimates tend to decline (in absolute terms) with increasing quantiles. For example, doubling farm size decreases gross revenues by 78% for farms in the 20th quantile and 73% for farms in the 90th quantile.
Appendix Table A8 reports the findings of plot size and productivity (self-reported yield) relationship with the inclusion of labor usage (family, hired, and exchange) for planting and harvesting seasons. Appendix Table A8 shows two general trends. First, the estimates of plot size on yields are smaller than the estimates obtained from the regression model that excluded labor usage. Second, the parameter estimates increase (in absolute terms) with increasing quantiles. For instance, doubling plot-size decreases yields by about 19, 29, and 34% for farms in the 20th, 70th, and 90th quantiles. However, the median impact (50th quantile) of doubling plot size on yields is smaller (a decrease of 25%) compared to estimates from a regression model that excluded labor usage controls (a reduction of 35%).
The crop cut yields (Appendix Table A9), reveal a similar pattern, as reported earlier in this section. Results show that the estimates of plot size on yields decrease monotonically with increasing quantiles. For example, doubling plot-size increases yields by 19, 15, and 11% for farms in the 20th, 50th, and 80th quantile. The above findings reinforce the importance of additional acreage or plot size for farms in the lower than upper quantiles. Specifically, an additional one-square meter of the plot would have a higher impact (14% or more) on yields of farms in the 50th (median) or lower quantiles but only 9% for farms in the 90th and upper quantiles. The median quantile (50th) estimate is similar to the estimates derived from the whole sample regression without labor control variables.
Appendix Table A10 reveals the quantile estimates of regression with the inclusion of labor usage when gross revenues were used to measure productivity. Recall that total revenue farming, our variable of interest, is reported by the farmer. The estimates in Appendix Table A10 show that: (1) The magnitude of coefficients decreases (in absolute terms) monotonically with increasing quantile; (2) the estimates are slightly lower (in absolute terms) compared to the estimates obtained from a regression that excluded labor usage controls. Results in Appendix Table A10 show that doubling farm size decreases gross revenues by about 77 and 75% for farms in the 20th and 90th quantiles.
Tables 5, 6 report the effects of farm size on labor input by selected quantiles. Table 5 shows labor usage in planting seasons. Like previous analysis, we investigate the impact of farm size on the total, family, and hired labor. The result shows that the median (50th quantile) estimates are close to the whole sample estimates. For instance, doubling farm size decreases total labor days by about 30%. Interestingly, we do not find any significant effect of farm size on family and hired labor in all quantiles. However, in the 80th quantile, the farm-size coefficient is negative and statistically significant at the 5% level.
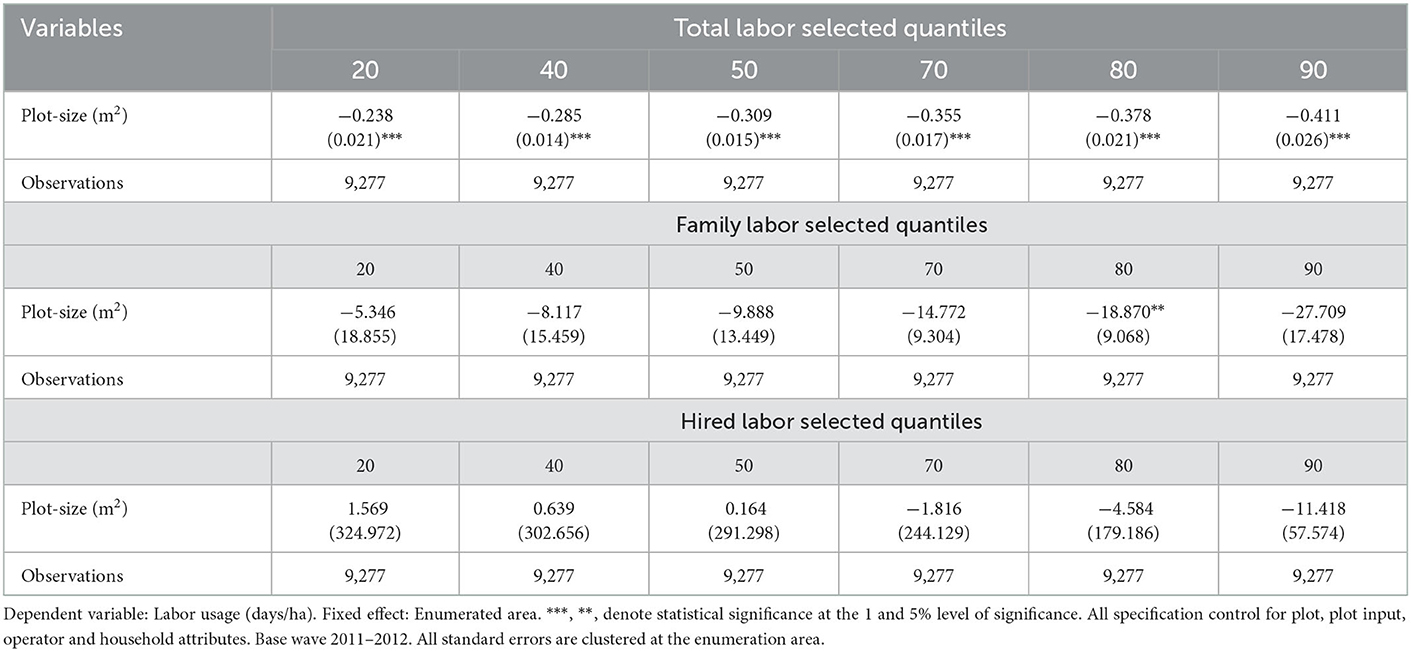
Table 5. Labor usage, planting season and labor category, all waves.
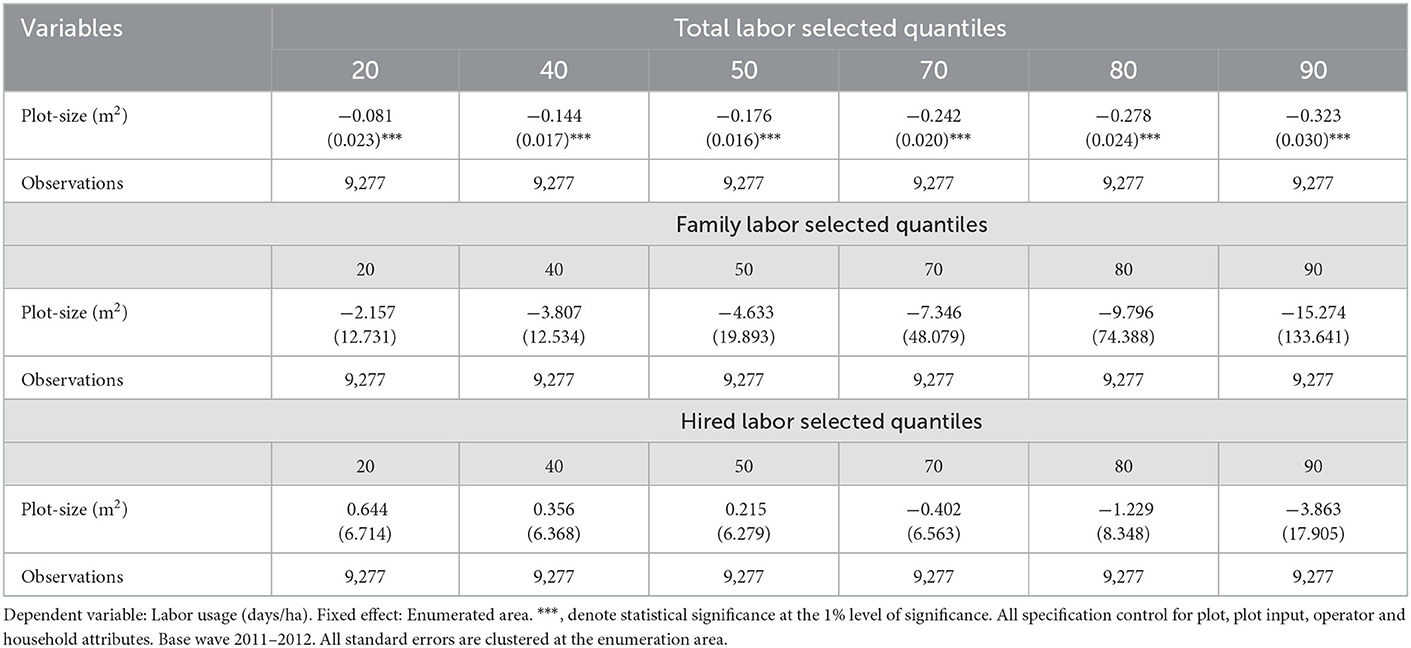
Table 6. Labor usage, harvesting season and labor category, all waves.
Lastly, Table 6 shows labor usage in harvesting seasons. Results in Table 6 show that only total labor days are significantly affected by plot size Additionally, the magnitude of the coefficient increases (in absolute terms) monotonically with increasing quantiles. In particular, doubling plot-size decreases total labor days by 8% for farms in the 20th quantile and by 32% for farms in the upper quantile (90th). Findings here enforce the view that with increased farm size (plot size in our case), small farms are likely to replace family labor at a lower rate than larger farms (farms in the higher quantile). It also seems that small farms (a farm in the lower quantiles) hire fewer workers compared to large farms (farms in the upper quantiles).
Conclusion and policy implications
The type of farm-household that best fosters economic and social development is a question that specialists and policymakers have debated intensely, at least since the beginning of the 21st Century. Notably, smaller farms mainly use family labor vs. larger ones that use primarily hired workers. The inverse relationship (IR) between farm size and productivity in developing countries has recently garnered considerable attention from applied economists. Much of the empirical evidence for the IR hypothesis comes from South and Southeast Asian studies. However, the IR debate is still somewhat unsettled in Africa, especially in countries in the SSA. Ethiopia, an SSA country, has been facing several complicated issues, including the dominance of small farms, low levels of efficiency, food insecurity, low incomes, and land insecurity through several land policy reforms. Policymakers are interested in designing policies to consolidate small and large farms to increase farmers' productivity, efficiency, and income. Hence, the objective of this study was to examine the IR hypothesis and investigate whether (or not) land consolidation is a suitable policy to increase agricultural productivity in Ethiopia. The study used plot-level and household-level data from farming households' data and panel analysis.
We used three waves of LSMS data (2010–11, 2012–13, and 2015–16) from the World Bank and the Central Statistical Agency of Ethiopia. This dataset is nationally representative of farm-households in Ethiopia but lacks information on large-scale commercial farms. However, this is not a major drawback given the low contribution of commercial farms on Ethiopia's overall agricultural land use and production and their modest economic spillover effects on neighboring smallholders in terms of job creation, technology and access to inputs (Ali et al., 2017).
To the best of our knowledge, the present study is unique for several reasons. First, we investigated the relationship between productivity and land size at both plot and farm (holding) levels (previous studies focused on one level, either plot or farm size, not both) using two different productivity measures: yield and gross revenue. Secondly, we used self-reported (farm operator) and crop-cut yields to tease any biases in reporting and mismeasurement. Third, we systematically included control variables (plot attributes, plot inputs, household and operator attributes, and labor inputs). Finally, we repeat the above exercise using the quantile regressions (QR) approach. The QR approach helped us to assess heterogeneity in the IR hypothesis. Yet, the QR approach enabled us to determine the IR hypothesis for small farms (those at the lower quantiles) and large farms (those at the higher quantiles).
Findings from this study reveal several interesting patterns. First, consistent with previous literature, farmers tend to over-report their yield and gross revenues. Results strengthen the mismeasurement argument (by farmers for both yield and revenues). We find a negative and significant relationship between plot size, self-reported yield, and gross revenue. However, the impact on gross revenue is larger than those obtained in yields. Recall exact gross revenues could be affected by measurement problems and rounding error problems. Second, in the case of crop cut yields, we find a positive and statistically significant effect of plot size on productivity. Third, when we include labor inputs in the model, we found that plot size's impact on productivity is significantly reduced in self-reported yields and gross revenue. In the crop cut yield, we discovered that the plot-size coefficient's magnitude increases but is still positive and significant. The above findings strengthen the argument of misspecified models. Fourth, we found that total labor input decreases with increased farm size. This is true for total labor inputs, regardless of planting or harvesting seasons. A possible explanation may include that farmers may use more machines which would have implications for large farms. Increasing farm sizes significantly reduces family labor input. This finding suggests that with an increase in farm size, family labor is better suited elsewhere. Perhaps hired labor is more efficient and educated to undertake production on larger farms.
Findings from the quantile regression underscore the importance of heterogeneity in the IR hypothesis. In the case of self-reported yield, we find a strong IR relationship between farm size and productivity; the magnitude of the effect increases (in absolute terms) monotonically with quantile. In the case of crop cut yields, estimates reveal a strong positive effect of farm size on productivity and the magnitude of the IR effect decreases monotonically with quantile. In the case of gross revenue, we found that farm-size displays a robust negative effect on gross revenue, and the magnitude of the effect increases (in absolute terms) monotonically with quantile. The other findings were: (i) the effect of farm size on productivity decreases in magnitude when we control for labor input; (ii) the IR between farm size and total and family labor was significantly negative and the effect increases (in absolute terms) monotonically with increasing quantiles. This finding has implications for total and family labor. Family labor is more important to small farms in both seasons but more so in the planting season. Perhaps the opportunity cost of family labor is higher in the non-farm sector.
Findings from this study contribute to a larger body of literature questioning the IR between farm size and productivity. The present study underscores the problems of errors in self-reporting or refusal in survey data and may be contributing to the IR. The study also confirms previous studies conducted in Ethiopia and elsewhere, showing that IR is driven by measurement errors caused by self-reporting or/and misperceptions. Lamb (2003) was the first to suggest, using data collected on rural households in three distinct agro-climatic regions of India, that measurement error in the self-reported land area could explain the inverse farm and plot-size relationship. More recently, Gourlay et al. (2019) found, based on a two-round household panel in a district of Eastern Uganda, that IR holds when using conventional, farmer-recalled crop yield measures. Still, the relationship disappears when yields are measured via crop cutting. Similar results are obtained by Desiere and Jolliffe (2018) and Abay et al. (2019) in the context of Ethiopia when comparing farmer-recalled yield and yields derived from crop cuts. Finally, Gollin and Udry (2021) found, using rich panel data from farms in Tanzania and Uganda, measurement error and heterogeneity together account for a significant fraction of the dispersion in measured productivity.
However, it is essential to recall that although the crop cut method is considered the gold standard for yield estimation, it is not free from errors. For example, because the crop cut estimates yields are obtained from a sampling of small subplots within cultivated plots, there is a greater risk of sampling error if yields within the plot are heterogeneous (Desiere and Jolliffe, 2018). Another example is the crop-cut method measures the biological yield, which does not necessarily consider harvest losses and therefore does not reflect the economic yield that is of use to the farmer or planner (FAO, 2017). Given that all sources of upward bias reported for crop cuts can be eliminated when the entire field is harvested, whole plot yield reporting (also called whole plot harvesting) could be a better alternative to crop-cut and self-reporting methods. Nevertheless, the method is also costly, time-consuming and unsuitable for large sample sizes or multiple crop studies (see Fermont and Benson, 2011; FAO, 2017 for a review of different methods for crop yield estimation).
From a policy perspective, this study highlights the role that policymakers might play in slowing down (or refocusing) the debate on IR by (i) removing, or at least reducing, measurement error in both yields, which affect both crop-cut and self-reported yield, (ii) standardizing measurement units and tools for land, and (iii) reducing imperfections in the land, labor and credit markets. The government should also consider undertaking an extensive collection of farm and household-level data to understand better the influence of plot and farm-household characteristics on IR. For instance, surveys need to collect information on cropping practices, soil conditions, the value of self-consumed products, labor inputs (family, hired, and exchange labor), operator and household attributes, seasonal demand, and labor supply across and within the farming household.
Secondly, this study reveals that land consolidation is not always beneficial and may lead to unfavorable effects, mainly for less efficient/productive farms. Policymakers may gain from being cognizant of heterogeneity in farms and that one policy may not fit all farms. A signal strand of policy can address the issue of increased food security and livelihood by farm consolidation. A concentrated effort to implement land consolidation should, therefore, preferably be combined with other instruments to increase its impact. Finally, policymakers need to provide greater support to small farms or facilitate their access to off-farm job opportunities.
Data availability statement
The datasets presented in this study can be found in online repositories. The names of the repository/repositories and accession number(s) can be found below: https://www.worldbank.org/en/programs/lsms.
Author contributions
Conceptualization and writing—original draft preparation: AM. Statistical data analysis methodology and investigation: AM and KL. Writing—review and editing, supervision, and project administration: GG, SGP, and KL. All authors contributed to the article and approved the submitted version.
Acknowledgments
The authors are grateful to the Central Statistical Agency of Ethiopia (CSAE) and the World Bank for making the data used in this paper publicly available.
Conflict of interest
The authors declare that the research was conducted in the absence of any commercial or financial relationships that could be construed as a potential conflict of interest.
Publisher's note
All claims expressed in this article are solely those of the authors and do not necessarily represent those of their affiliated organizations, or those of the publisher, the editors and the reviewers. Any product that may be evaluated in this article, or claim that may be made by its manufacturer, is not guaranteed or endorsed by the publisher.
Author disclaimer
The authors are solely responsible for the content of the paper. The views expressed are purely those of the authors and may not in any circumstances be regarded as stating an official position of the European Commission.
Supplementary material
The Supplementary Material for this article can be found online at: https://www.frontiersin.org/articles/10.3389/fsufs.2023.1057674/full#supplementary-material
Footnotes
1. ^Smallholdings are subsistence or semi subsistence farms with limited or no market participation (i.e., they produce only for household consumption or they have limited engagement with markets).
2. ^Crop cut is a technique for estimating crop yield on the basis of the sampling of small subplots within cultivated fields. The method involves the random demarcation of a plot of a specified size and shape, harvesting the produce from the plot, and threshing, winnowing and drying the produce to determine its dry weight. The harvest of that subplot is used as the plot's yield, and it is assumed that any error is independent of the total plot-size. For an in-depth description of crop-cut, readers are directed to Gourlay et al. (2019) study.
3. ^Wage gap can exist because of seasonality in production agriculture and institutionally determined minimum wage rate. In harvesting time wage rate is higher than wages in slack time (transplanting of rice). Sen (1966) argues that wage gap in the case of India suffers from market distortions and peasant farming has some distinct advantages (monitoring costs, hiring time, etc.) in the allocation of labor.
4. ^In this study both hired labor wages rates and opportunity cost of labor in off-farm labor markets were used.
5. ^The edge effect refers to the observation that yields at the outer bounds could be higher than yields in the interior of a plot due to the fact that crops along the edges might face less competition for nutrients, water, space and sunlight than crops in the plot's interior.
6. ^In other words, farmer self-selection into farming could generate IR.
7. ^Gross revenue is the total revenue from agricultural activities, including sales and self-consumption. The LSMS survey does not collect data on the value of consumed production (i.e., farmers cannot recall the value of self-consumed products). They are calculated using self-consumed quantities and local prices inferred from quantities and values of sales. When using gross revenue as a measure of productivity, we replace plot-size by farm size in the regression function.
8. ^All data and relevant documentation are available at: go.worldbank.org/HWKE6FXHJ0. This includes a manual detailing the crop-cutting procedures the enumerators followed.
9. ^The number of households with self-reported measure by waves includes: 1,496 from 2011–12; 2,961 form 2013–14; 2,882 from 2015–16. The number of households where the crop cutting information was collected includes: 1,285 from 2011–12; 1,680 form 2013–14; 1,803 from 2015–16.
10. ^For aggregation purpose, yields (production per hectare) are converted to monetary values using local prices.
11. ^Here we use plot and field interchangeably.
12. ^Due to space and brevity we only report selected quantiles. Full results for all quantiles is available from authors upon request.
References
Abay, K., Abate, G., Barrett, C., and Bernard, T. (2019). Correlated non-classical measurement errors, ‘Second best' policy inference, and the inverse size-productivity relationship in agriculture. J. Dev. Econ. 139, 171–184. doi: 10.1016/j.jdeveco.2019.03.008
Alexander, F., and Kokic, P. (2005). Productivity in the Australian grains industry. ABARE eReport 05.3. February 2005.
Ali, D. A., and Deininger, K. (2015). Is there a farm size-productivity relationship in African agriculture? evidence from Rwanda. Land Econ. 91, 317–343. doi: 10.3368/le.91.2.317
Ali, D. A., Deininger, K., and Harris, A. (2017). Does large farm establishment create benefits for neighboring smallholders? Evidence from Ethiopia. Land Econ. 95, 71–90. doi: 10.3368/le.95.1.71
Assunção, J., and Braido, L. (2007). Testing household-specific explanations for the inverse productivity relationship. Am. J. Agric. Econ. 89, 980–990. doi: 10.1111/j.1467-8276.2007.01032.x
Assunção, J., and Ghatak, M. (2003). Can unobserved heterogeneity in farmer ability explain the inverse relationship between farm-size and productivity. Econ. Lett. 80, 189–194. doi: 10.1016/S0165-1765(03)00091-0
Barrett, C. (1996). On price risk and the inverse farm-size–productivity relationship. J. Dev. Econ. 51, 193–215. doi: 10.1016/S0304-3878(96)00412-9
Barrett, C., Bellemare, M., and Hou, J. (2010). Reconsidering conventional explanations of the inverse productivity–size relationship. World Dev. 38, 88–97. doi: 10.1016/j.worlddev.2009.06.002
Benjamin, D. (1995). Can unobserved land quality explain the inverse productivity relationship? J. Dev. Econ. 46, 51–85. doi: 10.1016/0304-3878(94)00048-H
Benjamin, D., and Brandt, L. (2002). Property rights, labour markets, and efficiency in a transition economy: The case of rural China. Can. J. Econ. 35, 689–716. doi: 10.1111/1540-5982.00150
Bevis, L. E., and Barrett, C. B. (2020). Close to the edge: High productivity at plot peripheries and the inverse size-productivity relationship. J. Dev. Econ. 143, 102377. doi: 10.1016/j.jdeveco.2019.102377
Bhalla, S. S., and Roy, P. (1988). Mis-specification in farm productivity analysis: The role of land quality. Oxf. Econ. Pap. 40, 55–73. doi: 10.1093/oxfordjournals.oep.a041846
Binswanger, H. P., Deininger, K., and Feder, G. (1995). “Power, distortions, revolt and reform in agricultural land relations,” in Handbook of Development Economics, ed. J., Behrman, T. N., Srinivasan (Amsterdam: Elsevier) 2659–2772. doi: 10.1016/S1573-4471(95)30019-8
Bresciani, F., and Valdés, A. (2007). Beyond Food Production: The Role of Agriculture in Poverty Reduction. Rome: FAO. doi: 10.4337/9781781009796
Buchinsky, M. (1998). Recent advances in quantile regression models: a practical guideline for empirical research. J. Hum. Resour. 33, 88–126. doi: 10.2307/146316
Buchinsky, M. (2001). Quantile regression with sample selection: estimating women's return to education in the USS. Empir. Econ. 26, 87–113. doi: 10.1007/s001810000061
Byerlee, D., Diao, X., and Jackson, C. (2009). Agriculture, Rural Development, and Pro-Poor Growth: Country Experiences in the Post- Reform Era. Washington DC: Agriculture and Rural Development, The World Bank
Carletto, C., Savastano, S., and Zezza, A. (2013). Fact or artifact: the impact of measurement errors on the farm-size–productivity relationship. J. Dev. Econ. 103, 254–261. doi: 10.1016/j.jdeveco.2013.03.004
Carter, M. R. (1984). Identification of the inverse relationship between farm-size and productivity: an empirical analysis of peasant agricultural production. Oxf. Econ. Pap. 36, 131–145. doi: 10.1093/oxfordjournals.oep.a041621
Carter, M. R., and Wiebe, K. D. (1990). Access to capital and its impact on agrarian structure and productivity in Kenya. Am. J. Agric. Econ. 72, 1146–1150. doi: 10.2307/1242523
Chen, Z., Huffman, W. E., and Rozelle, S. (2011). Inverse relationship between productivity and farm-size: the case of China. Contemp. Econ. Policy 29, 580–592. doi: 10.1111/j.1465-7287.2010.00236.x
Cornia, G. A. (1985). Farm-size, land yields, and the agricultural production function: an analysis for fifteen developing countries. World Dev. 13, 513–534. doi: 10.1016/0305-750X(85)90054-3
Deininger, K., and Jin, S. (2005). The potential ofland rental markets in the process of economic development: evidence from China. J. Dev. Econ. 78, 241–227. doi: 10.1016/j.jdeveco.2004.08.002
Deininger, K., Jin, S., Liu, Y., and Singh, S. K. (2018). Can labour-market imperfections explain changes in the inverse farm-size productivity relationship? Longitudinal evidence from rural India. Land Econ. 94, 239–258. doi: 10.3368/le.94.2.239
Deolalikar, A. B. (1981). The inverse relationship between productivity and farm-size: a test using regional data from India. Am. J. Agric. Econ. 63, 275–279. doi: 10.2307/1239565
Desiere, S., and Jolliffe, D. (2018). Land productivity and farm-size: Is measurement error driving the inverse relationship? J. Dev. Econ. 130, 84–98. doi: 10.1016/j.jdeveco.2017.10.002
Dillon, A., Gourlay, S., McGee, K., and Oseni, G. (2019). Land measurement bias and its empirical implications: evidence from a validation exercise. Econ. Dev. Cult. Change. 67, 595–624. doi: 10.1086/698309
Eswaran, M., and Kotwal, A. (1986). Access to capital and agrarian production organization. Econ. J. 96, 482–498. doi: 10.2307/2233128
Fan, S., and Chan-Kang, C. (2005). Is small beautiful? Farm-size, productivity, and poverty in Asian agriculture. Agric. Econ. 32, 135–146. doi: 10.1111/j.0169-5150.2004.00019.x
FAO (2017). Food and Agriculture Organization of the United Nations. Methodology for estimation of crop area and crop yield under mixed and continuous cropping. improving agricultural and rural statistics global strategy Technical Report No. GO-21-2017. The World Bank, FAO, and United Nations: Rome.
Feder, G. (1985). The relation between farm-size and farm productivity: The role of family labour, supervision, and credit constraints. J. Dev. Econ. 18, 297–313. doi: 10.1016/0304-3878(85)90059-8
Fermont, A., and Benson, T. (2011). Estimating Yield of Food Crops Grown by Smallholder Farmers: A Review in the Uganda Context. IFPRI Discussion Papers No. 1097. Washington, DC: International Food Policy Research Institute (IFPRI).
Ferreira, F. H., Chen, S., Dabalen, A., Dikhanov, Y., Hamadeh, N., Jolliffe, D., et al. (2016). A global count of the extreme poor in 2012: data issues, methodology, and initial results. J. Econ. Inequal. 14, 141–172. doi: 10.1007/s10888-016-9326-6
Foster, A. D., and Rosenzweig, M. R. (2017). Are there too many farms in the world? Labour- market transaction costs, machine capacities and optimal farm-size. NBER Working Paper No. 23909. doi: 10.3386/w23909
Garzon Delvaux, P. A., Riesgo, L., and Gomez y Paloma, S. (2020). Are small farms more performant than larger ones in developing countries? Sci. Adv. 6, 1–11. doi: 10.1126/sciadv.abb8235
Gautam, M., and Ahmed, M. (2019). Too small to be beautiful? The farm-size and productivity relationship in Bangladesh. Food Policy 84, 165–175. doi: 10.1016/j.foodpol.2018.03.013
Gollin, D., and Udry, C. (2021). Heterogeneity, measurement error, and misallocation: evidence from African agriculture. J. Political Econ. 129, 1–80. doi: 10.1086/711369
Gourlay, S., Kilic, T., and Lobell, D. B. (2019). A new spin on an old debate: errors in farmer-reported production and their implications for inverse scale-productivity relationship in Uganda. J. Dev. Econ. 141, 102376. doi: 10.1016/j.jdeveco.2019.102376
Heckman, J. J. (1979). Sample selection bias as a specification error. Econometrica 47, 153–161. doi: 10.2307/1912352
Heltberg, R. (1998). Rural market imperfections and the farm-size–productivity relationship: Evidence from Pakistan. World Dev. 26, 1807–1826. doi: 10.1016/S0305-750X(98)00084-9
Henderson, H. (2014). Considering technical and allocative efficiency in the inverse farm-size production relationship. J. Agric. Econ. 66, 442–469. doi: 10.1111/1477-9552.12086
Irz, X., Lin, L., Thirtle, C., and Wiggins, S. (2001). Agricultural productivity growth and poverty alleviation. Dev. Policy Rev. 19, 449–466. doi: 10.1111/1467-7679.00144
Jayne, T. S., Muyanga, M., Wineman, A., Ghebru, H., Stevens, C., Stickler, M., et al. (2019). Are medium-scale farms driving agricultural transformation in sub-Saharan Africa? Agric. Econ 50, 75–95. doi: 10.1111/agec.12535
Julien, J. C., Bravo-Ureta, B. E., and Rada, N. E. (2019). Assessing farm performance by size in Malawi, Tanzania, and Uganda. Food Policy 84, 153–164. doi: 10.1016/j.foodpol.2018.03.016
Kagin, J., Taylor, E., and Yunez-Naude, A. (2015). Inverse productivity or inverse efficiency? Evidence from Mexico. J. Dev. Stud. 52, 396–411. doi: 10.1080/00220388.2015.1041515
Kelly, V., Diagana, B., Reardon, T., Gaye, M., and Crawford, E. (1995). Cash Crop and Foodgrain Productivity in Senegal: Historical View, New Survey Evidence, and Policy Implications. MSU Staff Paper No. 95-05. Michigan State University, East Lansing.
Khataza, R. R., Hailu, A., Doole, G. J., Kragt, M. E., and Alene, A. D. (2019). Examining the relationship between farm size and productive efficiency: a Bayesian directional distance function approach. Agric. Econ 50, 237–246. doi: 10.1111/agec.12480
Kilic, T., Zezza, A., Carletto, C., and Savastano, S. (2017). Missing(ness) in action: selectivity bias in GPS-based land area measurements. World Dev. 92, 143–157. doi: 10.1016/j.worlddev.2016.11.018
Kimhi, A. (2006). Farm-size and maize productivity in Zambia: The inverse relationship re-examined. Agric. Econ 35, 1–9. doi: 10.1111/j.1574-0862.2006.00133.x
Koenker, R., and Bassett, G. (1978). Regression quantiles. Econometrica 46, 33–50. doi: 10.2307/1913643
Koenker, R., and Hallock, K. F. (2001). Quantile regression. J. Econ. Perspect. 15, 143–156. doi: 10.1257/jep.15.4.143
Kokic, P., Davidson, A., and Rodriguez, V. B. (2006). Australia's grains industry – factors influencing productivity growth. ABARE research report 06.22. November 2006.
Lamb, R. L. (2003). Inverse productivity: Land quality, labour markets, and measurement error. J. Dev. Econ. 71, 71–95. doi: 10.1016/S0304-3878(02)00134-7
Larson, D., Otsuka, K., Matsumoto, T., and Kilic, T. (2013). Should African rural development strategies depend on smallholder farms? An exploration of the inverse productivity hypothesis. Agric. Econ 45, 1–13. doi: 10.1111/agec.12070
Lavers, T. (2018). Responding to land-based conflict in Ethiopia: the land rights of ethnic minorities under federalism. African Affairs 117/468, 462–484. doi: 10.1093/afraf/ady010
Lipton, M. (2010). From policy aims and small-farm characteristics to farm science needs. World Dev. 38, 1399–1412. doi: 10.1016/j.worlddev.2009.06.010
Livingston, G., Schonberger, S., and Delaney, S. (2011). Sub-Saharan Africa: the State of Smallholders in Agriculture. International Fund for Agricultural Development, Rome. Available online at: https://docs.igihe.com/IMG/pdf/untitled-3.pdf
Lockheed, M. E., Jamison, D. T., and Lau, L. J. (1980). Farmer education and farm efficiency: a survey. Econ. Dev. Cult. Change 29, 37–76.
Mary, S., Shaw, K., and Gomez y Paloma, S. (2017). Does the sectoral composition of growth affect child stunting reductions? Dev. Policy Rev. 37, 225–244. doi: 10.1111/dpr.12349
Mellor, J. (1999). Faster, More Equitable Growth – The Relation Between Growth in Agriculture and Poverty Reduction Agricultural Policy Development Project (Research Report No. 4). Washington, DC: United States Agency for International Development.
Muyanga, M., and Jayne, T. S. (2019). Revisiting the farm-size-productivity relationship based on a relatively wide range of farm-sizes: Evidence from Kenya. Am. J. Agric. Econ. 101, 1140–1163. doi: 10.1093/ajae/aaz003
Newell, A., Pandya, K., and Symons, J. (1997). Farm-size and the intensity of land use in Gujarat. Oxf. Econ. Pap. 49, 307–315. doi: 10.1093/oxfordjournals.oep.a028610
Obasi, P. C. (2007). Farm-size-productivity relationship among arable crops in ImoState, Nigeria. Int. J. Agric. Rural Dev. 9, 97–105. doi: 10.4314/ijard.v9i1.2673
Otsuka, K., Liu, Y., and Yamauchi, F. (2016). Growing advantage of large farms in Asia and its implications for global food security. Glob. Food Sec. 11, 5–10. doi: 10.1016/j.gfs.2016.03.001
Rada, N., and Fuglie, K. (2019). New perspectives on farm size and productivity. Food Policy 84, 147–152. doi: 10.1016/j.foodpol.2018.03.015
Ravallion, M., and Chen, S. (2007). China's (Uneven) progress against poverty. J. Dev. Econ. 82, 1–42. doi: 10.1016/j.jdeveco.2005.07.003
Rosenzweig, M. R., and Binswanger, H. P. (1993). Wealth, weather risk and the composition and profitability of agricultural investments. Econ. J. 103, 56–78. doi: 10.2307/2234337
Schneider, K., and Gugerty, M. K. (2011). Agricultural productivity and poverty reduction: linkages and pathways. Evans Sch. Rev. 1, 56–74. doi: 10.7152/esr.v1i1.12249
Sen, A. K. (1966). Peasants and dualism with or without surplus labour. J. Political Econ. 74, 425–450. doi: 10.1086/259198
Sheng, Y., and Chancellor, W. (2019). Exploring the relationship between farm-size and productivity: Evidence from the Australian grains industry. Food Policy 84, 196–204. doi: 10.1016/j.foodpol.2018.03.012
Sheng, Y., Zhao, S., Nossal, K., and Zhang, D. (2015). Productivity and farm-size in Australian agriculture: reinvestigating the returns to scale. Aust. J. Agric. Resour. 59, 16–38. doi: 10.1111/1467-8489.12063
Thirtle, C., Irz, X., Lin, L., Mckenzie-hill, V., and Wiggins, S. (2001). Relationship between changes in agricultural productivity and the incidence of poverty in developing countries. Report No. 7946, London: Department for International Development.
Tura, H. U. (2018). Land rights and land grabbing in Oromia, Ethiopia. Land Use 70, 247–255. doi: 10.1016/j.landusepol.2017.10.024
Variyam, J. N., Blaylock, J., and Smallwood, D. (2002). Characterizing the distribution of macronutrient intake among US adults: a quantile regression approach. Am. J. Agric. Econ. 84, 454–466. doi: 10.1111/1467-8276.00310
Vollrath, D. (2007). Land Distribution and International Agricultural Productivity. Am. J. Agric. Econ. 89, 202–216. doi: 10.1111/j.1467-8276.2007.00973.x
Keywords: agricultural productivity, land-size, farm-size, inverse relationship, quantile regression, Ethiopia, Sub-Saharan Africa
Citation: Mishra AK, Louhichi K, Genovese G and Gomez y Paloma S (2023) Insights into land size and productivity in Ethiopia: What do data and heterogenous analysis reveal? Front. Sustain. Food Syst. 7:1057674. doi: 10.3389/fsufs.2023.1057674
Received: 29 September 2022; Accepted: 10 January 2023;
Published: 30 January 2023.
Edited by:
Francisco Areal, Newcastle University, United KingdomReviewed by:
Marilena Furno, University of Naples Federico II, ItalyDong Sub Kim, Kongju National University, Republic of Korea
Copyright © 2023 Mishra, Louhichi, Genovese and Gomez y Paloma. This is an open-access article distributed under the terms of the Creative Commons Attribution License (CC BY). The use, distribution or reproduction in other forums is permitted, provided the original author(s) and the copyright owner(s) are credited and that the original publication in this journal is cited, in accordance with accepted academic practice. No use, distribution or reproduction is permitted which does not comply with these terms.
*Correspondence: Kamel Louhichi,  Kamel.elouhichi@inrae.fr