A resilience analysis of the contraction of the accommodation and food service sector on the Scottish food industry
 Cesar Revoredo-Giha1*
  Wisdom Dogbe2
- 1Rural Economy, Environment and Society Department, Scotland's Rural College (SRUC), King's Buildings Campus, Edinburgh, United Kingdom
- 2School of Medicine, Medical Sciences and Nutrition, Rowett Institute, University of Aberdeen, Aberdeen, United Kingdom
The Scottish economy, such as the United Kingdom (UK) economy, has been exposed to several adverse shocks over the past 5 years. Examples of these are the effect of the United Kingdom exiting the European Union (Brexit), the effects of the COVID-19 pandemic, and more recently Russia–Ukraine war, which can result in adverse direct and indirect economic losses across various sectors of the economy. These shocks disrupted the food and drink supply chains. The purpose of this article is 3-fold: (1) to explore the degree of resilience of the Scottish food and drink sector, (2) to estimate the effects on interconnected sectors of the economy, and (3) to estimate the economic losses, which is the financial value associated with the reduction in output. This article focuses on the impact that the sudden contraction that the “accommodation and food service activities”, resulting from the pandemic, had on the food and drink sectors. For this analysis, the study relied on the dynamic inoperability input–output model (DIIM), which takes into account the relationships across the different sectors of the Scottish economy over time. The results indicate that the accommodation and food service sector was the most affected by the COVID-19 pandemic lockdown contracting by approximately 60%. The DIIM shows that the disruption to this sector had a cascading effect on the remaining 17 sectors of the economy. The processed and preserved fish, fruits, and vegetable sector is the least resilient, while preserved meat and meat product sector is the most resilient to the final demand disruption in the accommodation and food service sector. The least economically affected sector was the other food product sector, while the other service sector had the highest economic loss. Although the soft drink sector had a slow recovery rate, economic losses were lower compared to the agricultural, fishery, and forestry sectors. From the policy perspective, stakeholders in the accommodation and food service sector should re-examine the sector and develop capacity against future pandemics. In addition, it is important for economic sectors to collaborate either vertically or horizontally by sharing information and risk to reduce the burden of future disruptions. Finally, the most vulnerable sectors of the economy, i.e., other service sectors should form a major part of government policy decision-making when planning against future pandemics.
1. Introduction
The food and drink industry is a major contributor to Scotland's economy, with a turnover of approximately £14,748.2 million (representing 9% of total GDP) in 2020 and accounting for one in five manufacturing jobs. Scotland has approximately 17,450 food and drink businesses, which employed approximately 129,000 (4.9% of total employment in Scotland) people in 2021.
The Scottish economy suffered greatly in 2020 due to the global COVID-19 pandemic. This was reflected in high absenteeism from work due to fear of infections, lockdowns preventing people from assessing their place of work, or sickness due to infections. Estimates of the monthly gross domestic product (GDP) indicated that it fell by approximately 22% using 2016 as the baseline. In addition, there was also a contraction of several final demand components. For instance, a recent estimate shows that exports between April and June 2020 were 31.1% lower than that recorded in the same period in 2019 (Scottish Government, 2022a).
The economic impact of disruptions such as COVID-191 on the economy manifested on two fronts: the labor market and the final demand (i.e., consumption of households, exports, and government expenditure). A labor shortage in a productive sector can render it inoperable and since different sectors are mutually dependent, they become indirectly affected because of their linkages. Similarly, the contraction of the final demand of a sector or several of them generates a contraction in the output of sectors not only directly affected but also the interrelated sectors.
The impact of the pandemic has been disproportionate, with some sectors being heavily affected while others were mildly or not affected. For instance, the food retail sector performed well throughout 2020 but the accommodation and food services showed the worse performance with the greatest drop in 2020 (Scottish Government, 2022b).
The accommodation and food service sector or hospitality sector provides approximately 5 billion pounds in gross value added to the Scottish economy. In addition, it is the largest employing sector of the economy employing approximately 200,000 jobs before the COVID-19 pandemic. The COVID-19 pandemic had a significant impact on both employment/jobs and total output from the sector; a loss of 85% of output between February and May 2020, and a 23% loss in the number of jobs between March and December 2020. It is expected that this will have implications for associated sectors such as the food and drink sector, tourism sector, and event businesses.
Haimes and Santos (2014) used a dynamic inoperability input–output model (DIIM) to analyze the impacts of an influenza pandemic on the workforce and associated economic sectors. The present study follows their approach to examine the impact of the contraction of the final demand of the “accommodation and food service activities” sector due to COVID-19 on interrelated sectors of the Scottish economy. The choice of the sector was due to its close relationship with the agricultural and food processing sectors. Two metrics were used to assess the impact of the COVID-19 pandemic on the economic sectors: inoperability, which measures the percentage difference between as-planned and actual output, and economic loss, which is the monetary value of the output loss. In addition, this article estimates the coefficient of resilience and recovery pathways, which indicate how fast the interrelated sector recovers from the disruption.
The structure of the research article is as follows. It starts with a brief literature review. Next, it summarizes the empirical approach used in the research, namely the methodology and the data used for the estimation. It is followed by a presentation and discussion of the results. The final section presents the research conclusion.
2. Literature review
The purpose of this section is 2-fold: first to provide an overview of the Scottish economy during the COVID-19 pandemic period, and second to briefly review the literature about the aggregated measurement of resilience.
2.1. The Scottish economy during the COVID-19 pandemic period
The Scottish economy has been exposed to several adverse shocks over the past 5 years. Examples of these are the effect of the United Kingdom exiting the European Union (Brexit), the effects of the COVID-19 pandemic, and more recently Russia–Ukraine war. For this study, we concentrate on the impact of COVID-19. The impacts are 2-fold: (1) employment and (2) gross value added.
The imposition of lockdown during the crucial periods of the pandemic affected labor flows both within Scotland and from elsewhere in Scotland. The accommodation and food service sector is considered the industry with the proportion of non-UK nationals in the workforce (~19%). The COVID-19 lockdown restricted the inflows of migrant labor especially those from Eastern Europe (Scottish Government, 2022b). Statistics show that 42% of businesses in the accommodation and food service sector reported that they were experiencing a shortage of workers in the period between 15 and 28 November 2021, compared with 38% for the economy overall (Scottish Government, 2022c).
Figure 1, which presents the evolution of the monthly onshore gross domestic product (GDP) for Scotland from 2018 to 2022, shows that COVID-19 was a massive shock to the economy. In April 2020, the monthly GDP decreased by ~21% with respect to the average of January to March 2020 levels.
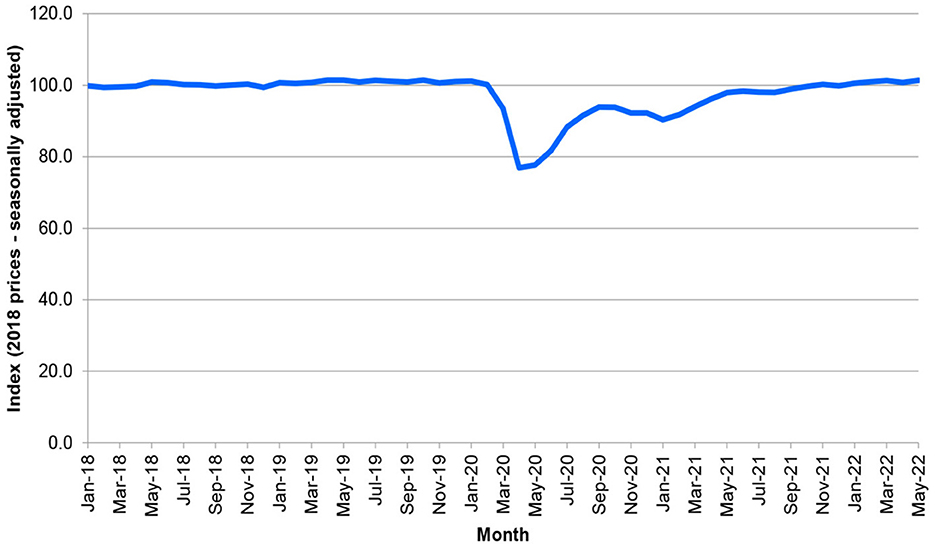
Figure 1. Scotland—monthly evolution of the gross domestic product. Source: Scottish Government.
The pattern shown in the aggregated GDP can also be viewed in the panels as presented in Figure 2, which shows the evolution of 18 production sectors, all of them, in different measures though, showing the impact of the COVID-19 shock. From all the sectors, the most important impact of COVID-19 was on the accommodation and food service sectors. In April 2020, this sector contracted by approximately 78% with respect to the average of January and February 2020.
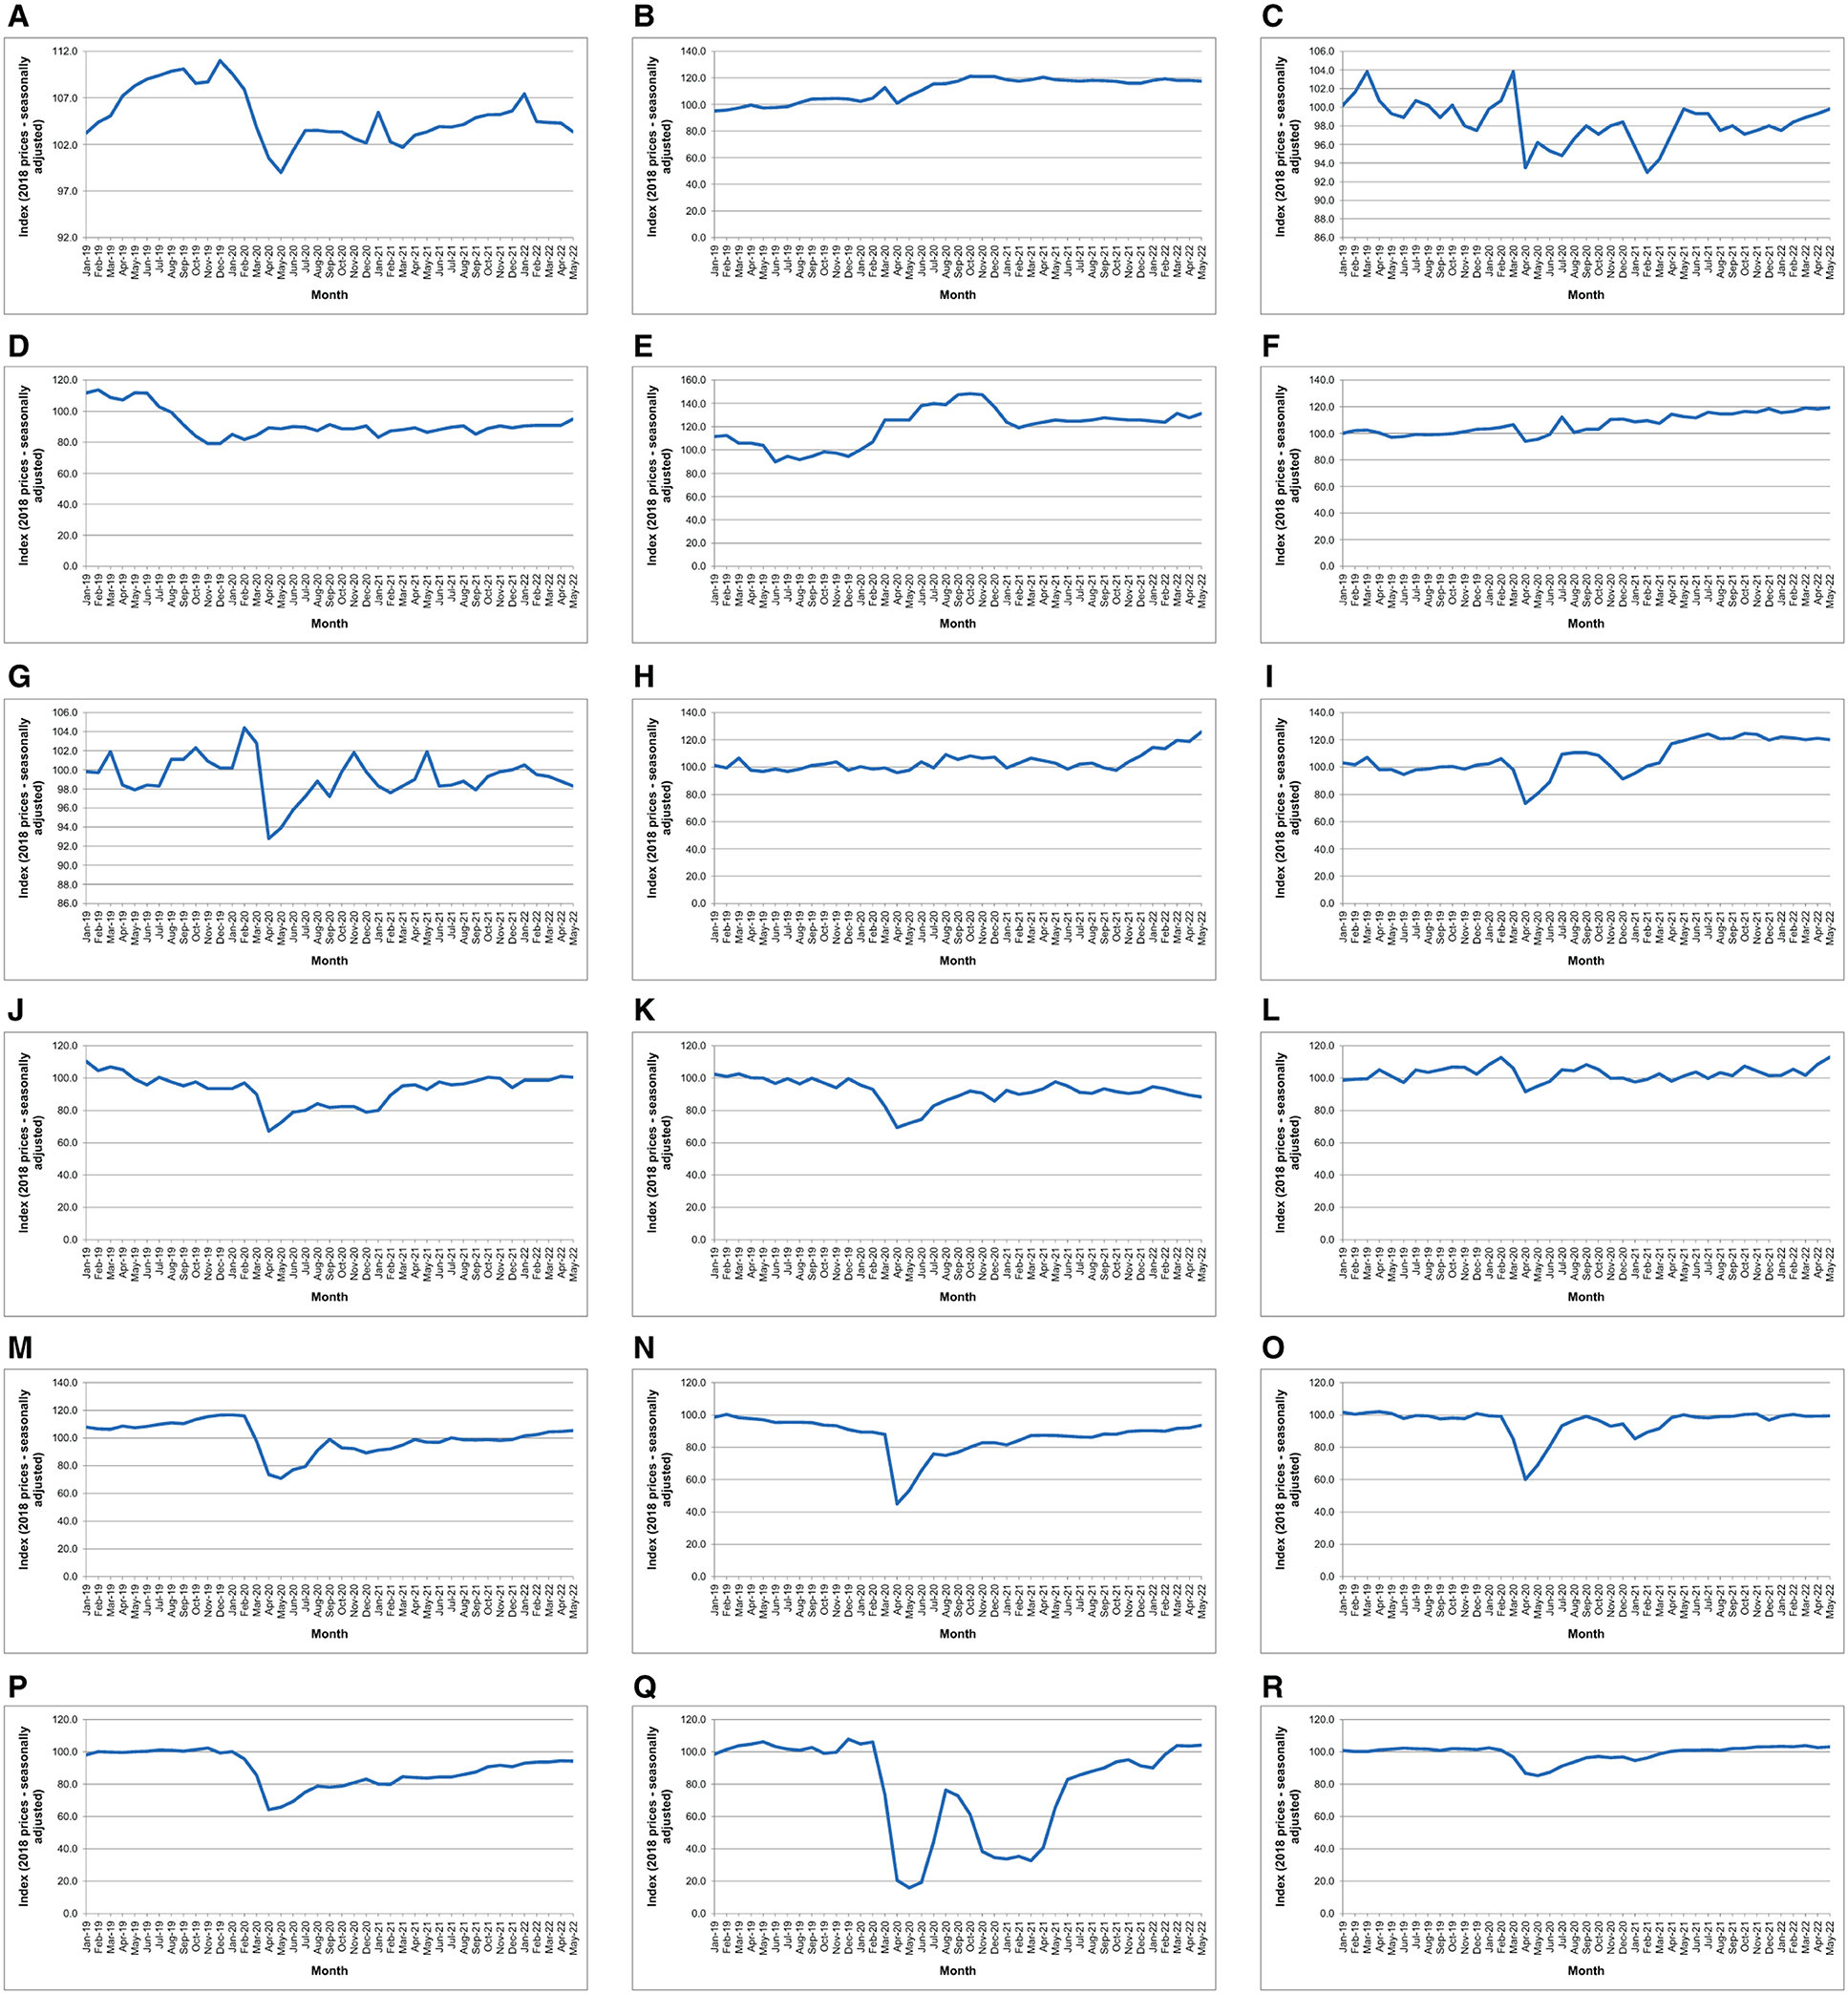
Figure 2. Evolution of the gross domestic product by production sector. (A) Gross domestic product - Agriculture, fisheries and forestry. (B) Gross domestic product - Preserved meat and meat products. (C) Gross domestic product - Processed and preserved fish, fruit and vegetables. (D) Gross domestic product - Manufacture of dairy, vegetable and animal oils and fats. (E) Gross domestic product - Grain mill products, starches and starch products. (F) Gross domestic product - Bakery and farinaceous products. (G) Gross domestic product - Other food products. (H) Gross domestic product - Prepared animal feeds. (I) Gross domestic product - Alcoholic beverages and tobacco products. (J) Gross domestic product - Soft drinks. (K) Gross domestic product - Other manufacturing. (L) Gross domestic product - Energy supply, water and waste. (M) Gross domestic product - Mining and quarrying. (N) Gross domestic product - Construction. (O) Gross domestic product - Wholesale and retail trade and repairs. (P) Gross domestic product - Transport and storage. (Q) Gross domestic product - Accommodation and food service activities. (R) Gross domestic product - Other services.
Under the coronavirus job retention scheme, commonly known as the “furlough scheme”, companies were allowed to place staff on leave during a determined period set by the Government while ensuring that those affected still have a source of income. As part of the scheme, employers had to notify staff members in writing before their period of furlough begins. Once on leave, the company had to pay affected employees no <80% of their regular monthly income, up to a cap of £2,500. These funds could later be claimed back through the job retention scheme. While furloughed, individuals remained formally employed by the company, meaning that they were entitled to their usual protection from unfair dismissal, and redundancy pay should the company cease trading.
2.2. Accommodation and food service sector
The accommodation and food service sector is made up of establishments providing customers with lodging and/or preparing meals, snacks, and beverages for immediate consumption. Between the fourth quarter (Q4) of 2019 and the second quarter (Q2) of 2020, the gross value added (GVA) by the accommodation and food service sector reduced by 80.1% compared to the 22% drop for the whole of Scotland's economy over the same period (Watts, 2022). This sector alone generated approximately 5 billion pounds (representing 3.4% of the Scottish onshore economy) in GVA in Scotland in 2019. Despite the small contribution to the overall GVA, it is the largest employing sector with approximately 200,000 jobs before the COVID-19 pandemic.
Figure 3 shows the evolution of the GVA for the accommodation and food service sector. The contribution of the sector has been growing from January 2010 to February 2020 when it experienced a shape decline. The lowest-ever GVA for the sector was recorded in April and May 2020. Workforce data from the Office of National Statistics (ONS) shows that the number of jobs in this sector fell by approximately 50,000 (approximately 23%) between March 2020 and December 2020.
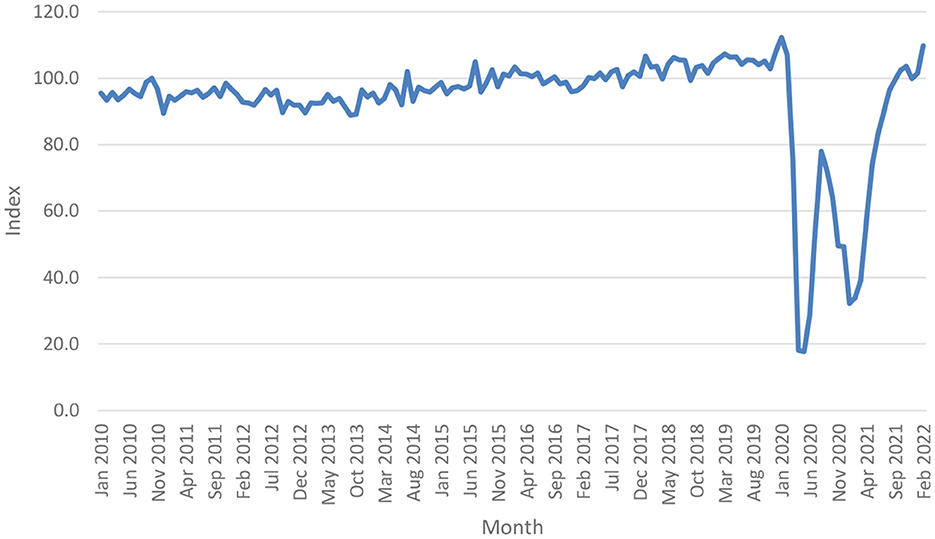
Figure 3. Evolution of the Gross Value Added for Accommodation and food service sector in Scotland. Source: Office for National Statistics (2020).
Figure 4 shows the impact of COVID-19 on the accommodation and food service sector's workforce. The total number of workforce jobs fell from 216,000 in March 2020 to 169,000 in December 2020.
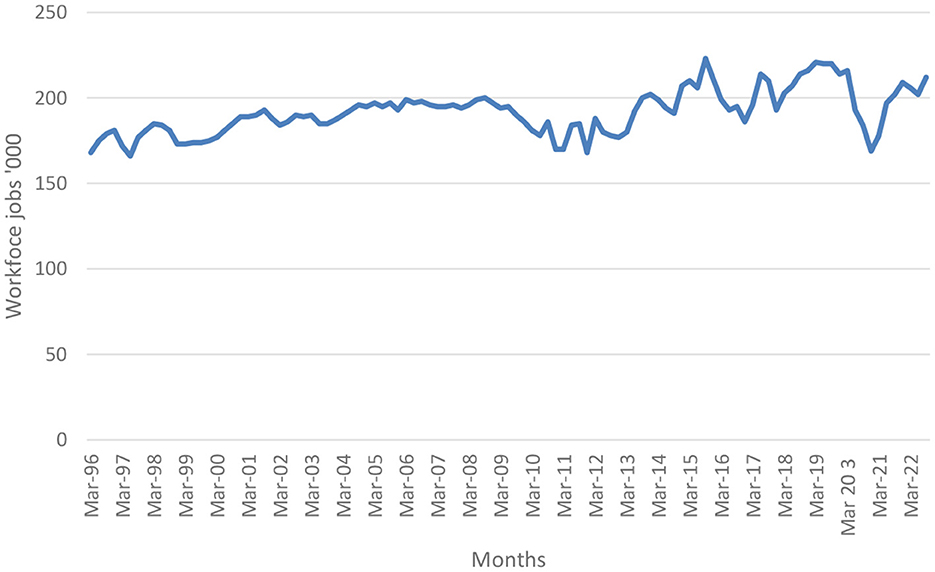
Figure 4. Evolution of workforce jobs in the Accommodation and food service sector. Source: Office for National Statistics (2020).
According to the Labor Force Survey in 2019, the average hourly is the lowest in Scotland when compared to the remaining industry sectors. As a result, the poverty rate among workers in this sector is estimated to be higher than the Scottish average.
It is expected that workers in this sector would therefore be greatly affected by COVID-19 disruption. Moreover, the interdependency between this sector and other industrial sectors of the economy would escalate the impact. As such, the goal of the current study is to show how interdependent sectors are affected by disruptions to one sector of the economy.
2.3. Measuring sector resilience and interdependence
This section focuses on aggregated models that measure the resilience of sectors. Specifically, it refers to models that use the input–output tables to track the effects of a shock (on supply or demand). According to Zhang et al. (2022), the use of input–output models has many advantages including the ability to identify system vulnerabilities and provide scientific insight for the development of industry management strategies.
As pointed out by Leontief (1987), the “input–output analysis is a practical extension of the classical theory of general interdependence which views the whole economy of a region, a country, or even the entire world as a single system and sets out to describe and to interpret its operation in terms of directly observable basic structural relations”. The model presents a framework capable of describing the extent of interconnectedness among different sectors of the economy (Haimes et al., 2005). This feature is key to understanding the network type of relationships that are observed among supply chains.
Haimes and Jiang (2001) extended the Leontief model by focusing on the spread of operability into a networked system—input–output inoperability model (IIM). While the Leontief model was used to explain the level of interdependencies among sectors in the economy, the inoperability model can assess how catastrophic disasters in one sector affect other sectors of the economy (Lian and Haimes, 2006). In addition, the model offers insights into the sensitivity of economic systems to various classes of disruptions guiding policymaking activities (Santos, 2006). Finally, results from the inoperability input–output model allows for the ranking of the disrupted and interconnected sectors according to their degree of vulnerability to perturbations, which can serve as an important input to risk management (Lian and Haimes, 2006).
Setola and De Porcellinis (2007) cited examples of how a disruption in one sector of the economy cascade to other sectors. First, in 1998 in the United States, the failure of the telecommunication satellite Galaxy IV caused more than 40 million pagers to be out of service. In addition, 20 United Airlines flights were without the required data about high-altitude weather conditions, resulting in take-off delays. Second, in 2004 in Italy, a failure of the Telecom Italia node in Rome disrupted the operations of both fixed and mobile TLC systems, approximately 5,000 bank branches and 3,000 post offices, and air transport check-in operations were disrupted.
Setola and De Porcellinis (2007) defined inoperability as the inability of a given system to perform its intended functions. Mathematically, it is estimated as the percentage loss of a system's function relative to its ideal output. It has a value between 0 and 1, where 0 corresponds to a flawless operation while 1 is a complete failure (Santos and Haimes, 2004; Santos, 2006).
The IIM is capable of “(1) estimating the impact of initial disruptions to a sector (or group of sectors) to other ‘external' sectors; (2) assessing the cascading impacts of disruptive events for various regions; and (3) presenting various perspectives of impact, including inoperability and economic loss, which can provide insights for risk management” (Santos, 2006).
The IIM has been used in economic literature to study the impact of disruptions such as terrorism, power outages, and pandemics. For instance, Santos and Haimes (2004) used the IIM to study the impact of a 10% reduction in demand for air transport as a result of terrorism on interconnected economic systems. Similarly, Lian and Haimes (2006) assessed the risk of terrorism to interdependent infrastructure systems in the United States using the dynamic input–output inoperability model. Jung et al. (2009) used international trade (IT)-IIM to investigate the international trade inoperability for all industry sectors resulting from disruptions to a major port of entry.
In the IT sector, Hyatt and Santos (2022) used the inoperability input–output model to determine the inoperability and economic impact of IT on interdependent industries in the United States. The authors found that the IT sector is susceptible to various forms of malicious attacks.
For the energy sector, Guo and Hou (2019) used the IIM to analyze the vulnerability and recoverability of the energy sector in China in the presence of demand and supply perturbation.
It is important to note that the interdependence among various sectors of the economy may take the form of flows of information, shared security, and physical flows of commodities (Haimes et al., 2005). The growing dependence of one sector of the economy on other sectors makes the whole economy vulnerable to unexpected side effects, making it complex and prone to disruptions (Setola and De Porcellinis, 2007). The socio-economic effects of disruptions can be considerably larger when the cascading effects and interdependencies among sectors are taken into account (Kjølle et al., 2012).
Despite the potential benefits of using the IIM, it does not allow researchers to perform intertemporal analysis because IIM is a static model. The dynamic inoperability input–output model (DIIM) was, therefore, proposed to account for the limitations of the IIM.
According to Lian and Haimes (2006), the DIIM addresses the following pertinent questions that are overlooked in the static model as follows: (1) How does the disrupted sector(s) recover over time?; (2) What are the associated economic losses during the recovery period?; and (3) What can be carried out to minimize the losses during the recovery period after the disruption?
The DIIM uses the industry interdependence index to measure the degree to which sectors are dependent on each other in an interconnected economy. This is a function of hardening, prevention, and redundancy—resilience factors. In addition, the DIIM uses an estimated industry resilience coefficient to determine the speed with which industries recover after a disruption. The model also allows researchers to represent the dynamic behavior of disrupted and interdependent sectors in the recovery duration.
For the energy sector, Guo and Hou (2019) used the DIIM (in addition to the IIM) to analyze the recovery dynamics of the energy sector in China due to demand and supply perturbations. Zhang et al. (2022) also used the DIIM to assess industrial water network vulnerability in China.
Santos et al. (2009) assessed the economic losses due to the 2009 H1N1 pandemic for the Commonwealth of Virginia. Results show that even a moderate 15% attack rate scenario could lead to a $5.5 billion loss. Yaseen et al. (2020) assessed sector inoperability and the economic impact of workforce absenteeism due to flooding. They concluded that the impact of flooding through workforce absenteeism can render the whole economy inoperable.
In what follows, this study uses the DIIM to study how disruption due to the demand faced by the accommodation and food service due to the COVID-19 pandemic could affect the economic performance of the food and drink sector and other interdependent sectors.
3. Empirical approach
This section starts by presenting a brief version of the dynamic inoperability input–output model (DIIM), which will be used for the empirical work, and it is followed by introducing the data used.
3.1. Method
The starting point of the DIIM is the dynamic version of the Leontief input–output, which is written as in equation (1):
where x(t) is the output vector, A is the matrix of technical coefficients, c(t) is the final demand vector (i.e., households, government, exports, and investment), and ẋ(t) is the change in the vector of output. The dimension of the vectors is (nx1), where n is the number of sectors in the economy and A is an nxn matrix. Matrix B can be described as the willingness of the economy to invest in capital resources. Haimes et al. (2005), citing Ramos Carvajal and Blanc Díaz (2002), argued that the economic system would only be stable when the elements of the B matrix are either zero or negative. B = −I, where I is the identity matrix and, in that case, the economy quickly adjusts its production levels following information about mismatches in supply and demand yielding as follows:
To model the industry sectors' dynamic recovery behaviors and dynamic interactions caused by demand reduction or labor disruptions in industry sectors, we start with a diagonal matrix of the capital coefficient matrix B as follows:
Let a matrix K be equal to
Relating diagonal matrices K and B yields
Merging equations (5) and (1) give
Or in discrete form,
Transforming equation (7) into the normalized inoperability form results in the following equation (8) (Haimes et al., 2005) as follows:
Matrix A* is the normalized interdependency matrix, c*(t) is the normalized final demand vector at time t; q(t) is the inoperability vector at time t, and K is the industry resilience coefficient that measures the resilience of sector i in the presence of disruption in demand and supply. From Equation (8), the greater the value of the resilience coefficients (i.e., diagonal values of the matrix K), the higher the recovery speed of the sector. An intuitive view of this can be obtained from the fact that the term A*q(t) + c*(t) − q(t) represents the difference between supply and demand (in inoperability terms), thus, the greater the resilience coefficients, the smaller will be the difference between q(t + 1) − q(t), indicating that the system is reaching a steady state.
The inoperability vector at time t after a disruption is defined as the vector of normalized economic losses and be derived as follows:
where x is the as-planned level of output and is the degraded level of output and its elements have values between 0 and 1. The interdependency matrix, A*, is defined as the additional inoperability that sectors contribute to each other due to their interaction. It is defined in equation (10) as follows:
The initial demand perturbation vector c*, which is the normalized demand vector is derived as follows:
where c is the as-planned level of final demand and is the degraded level of final demand resulting from the exogenous system disruption.
The sectoral resilience coefficient ki can be derived as shown in equation (12) (Lian and Haimes, 2006)
where qi(0) is the initial operability, qi(T) is the inoperability after the T period from the shock, and is the sector's coefficient in the interdependency matrix.
The recovery pathway can be used to derive the economic loss during recovery from each sector. The cumulative economic loss for each industry i is given by Qi(t)
where x is the as-planned output rate of industry i; qi(t) is the inoperability of industry i by time t. In discrete terms, equation (13) can be expressed as in equation (14),
3.2. Data
The present study is based on input–output data obtained from the Scottish supply, use, and input–output tables from 1998 to 2019 (Scottish Government, 2022c). The table provides a complete picture of the flows of goods and services in Scotland's onshore economy each year.
The original 98 economic sectors of the Scottish input–output tables were aggregated (to simplify the calculations) into 18 industries. The 2019 input–output table for Scotland is presented in Table 1. To account for the dynamic behavior of the sectors across the years, the simulation is based on averages of the interdependency matrix from 1998 to 2019 input–output tables.
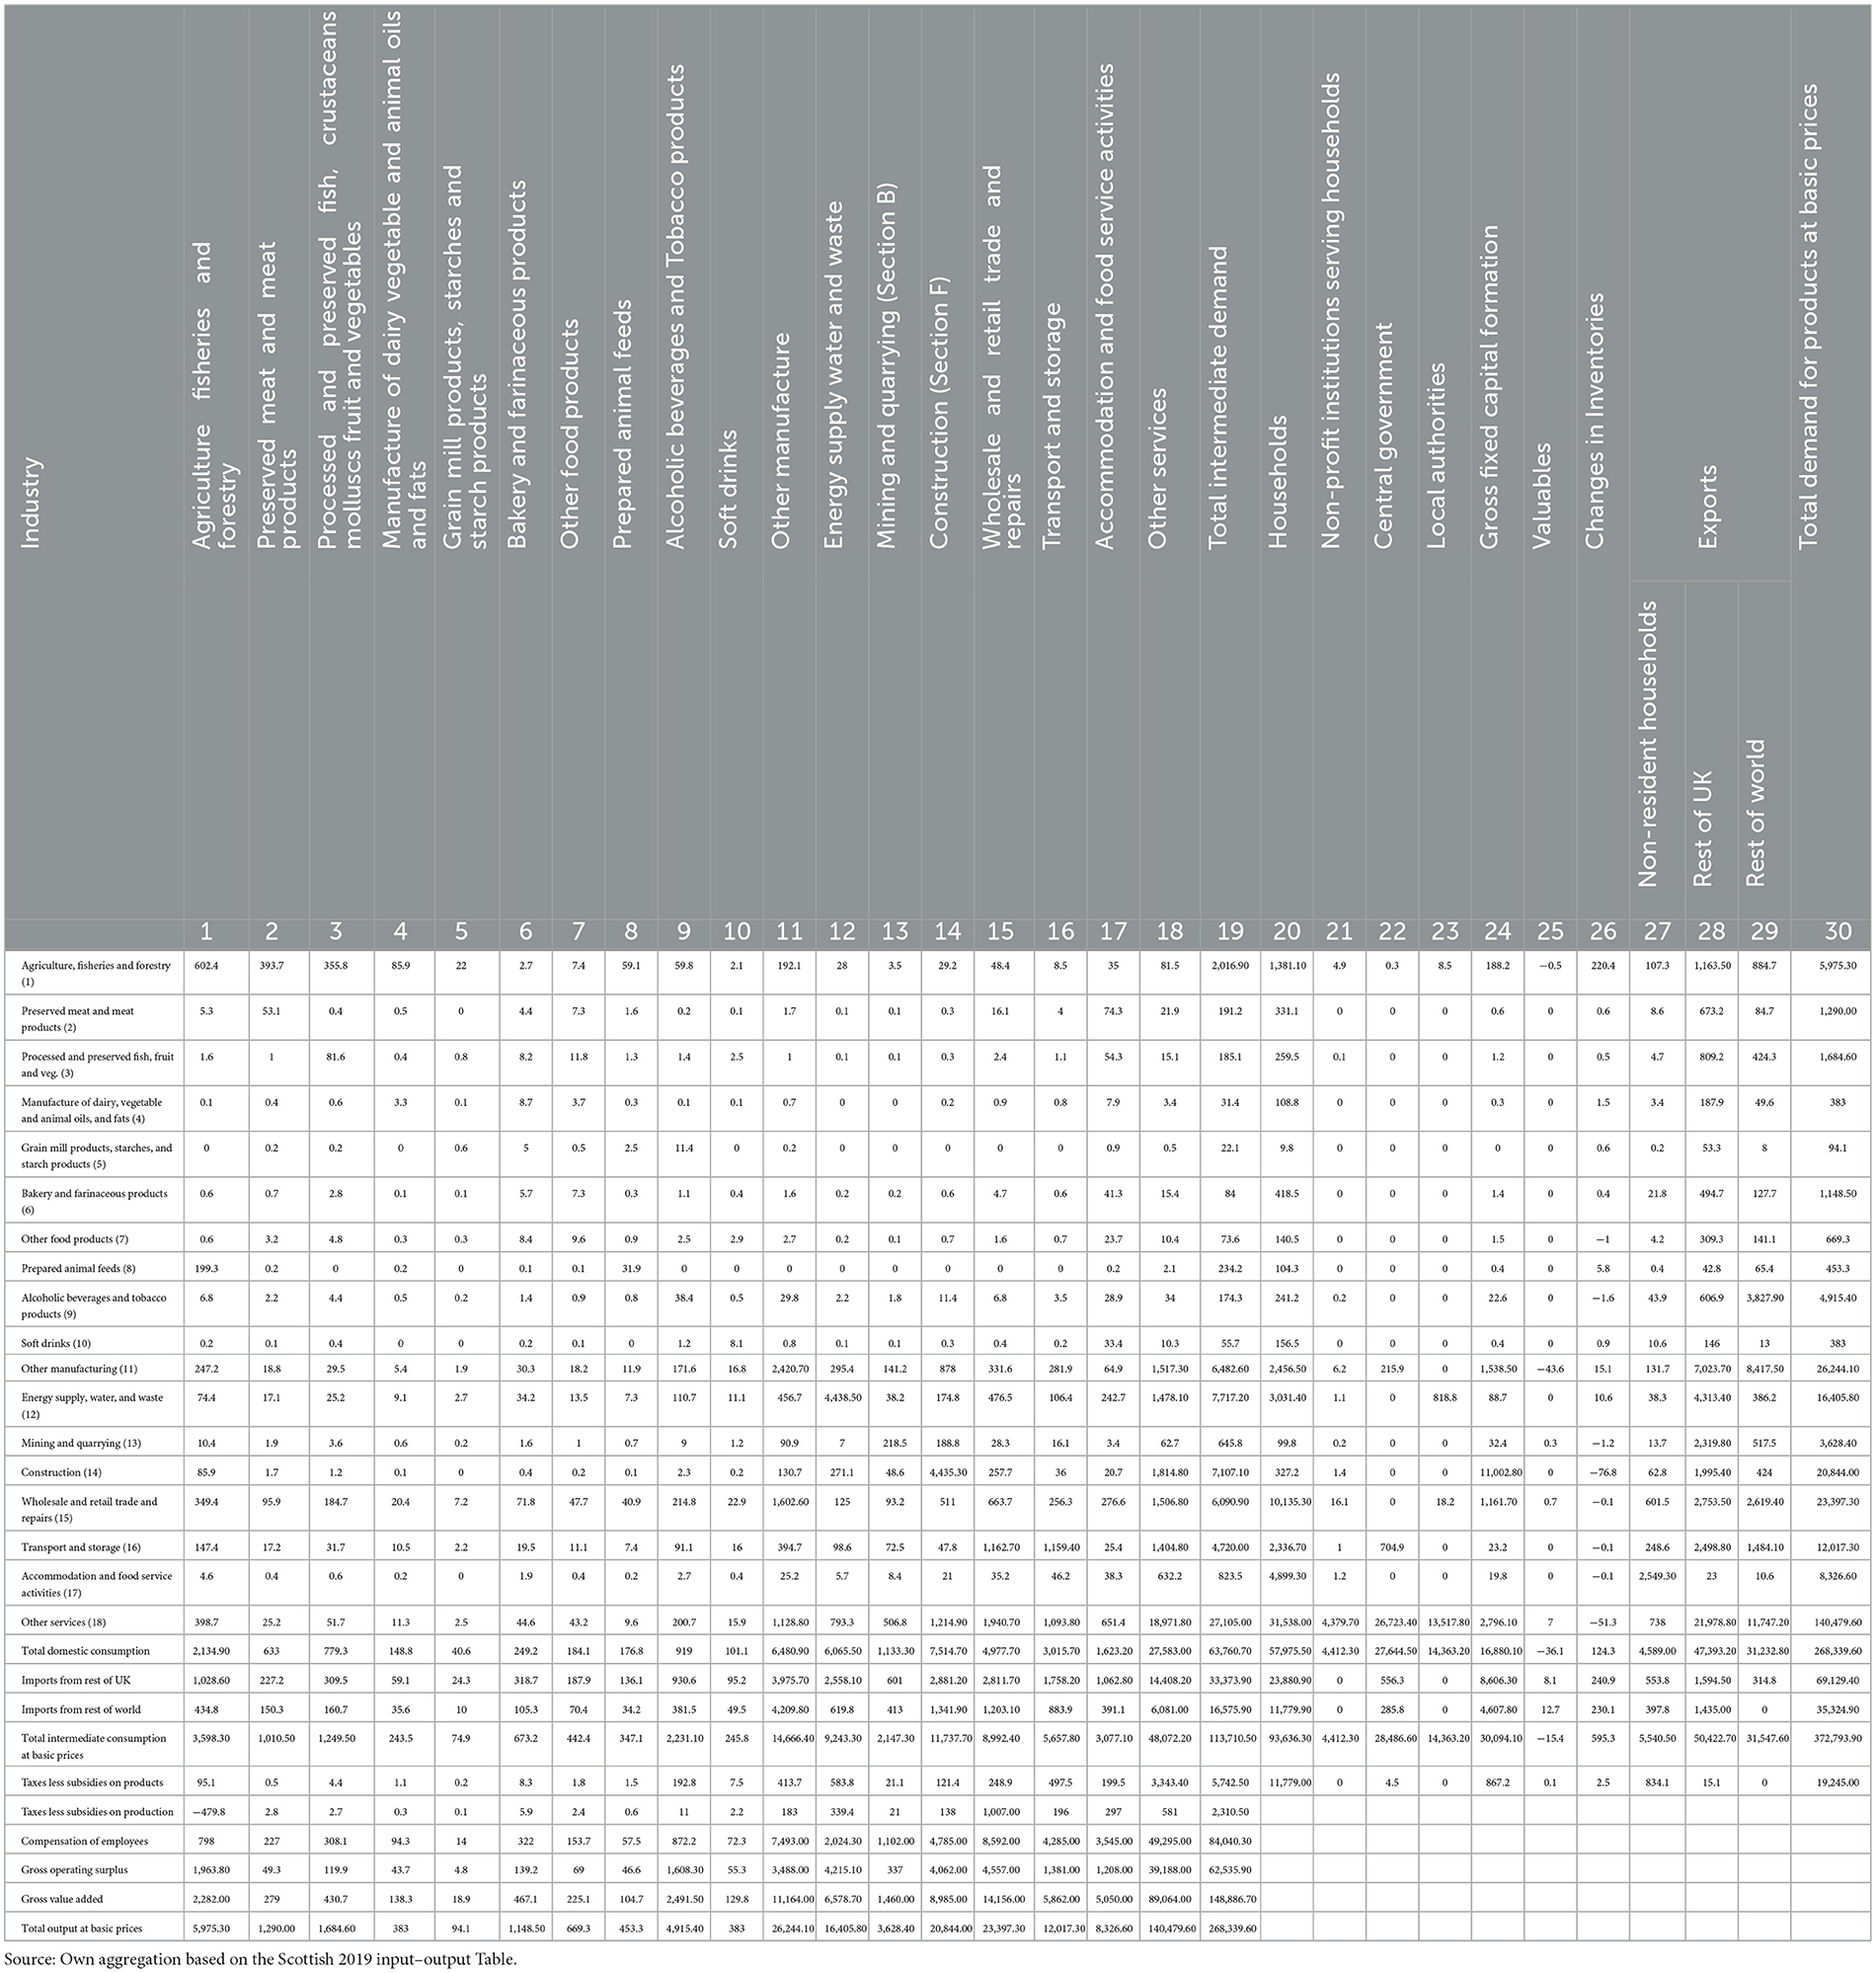
Table 1. Aggregated version of the Scottish input–output table–2019.
The aggregated sectors were as follows: agriculture, fisheries, and forestry; preserved meat and meat products; processed and preserved fish, fruits, and vegetables; manufacture of dairy, vegetables, and animal oils and fats; grain mill products, starches, and starch products; bakery and farinaceous products; other food products2; prepared animal feeds; alcoholic beverages and tobacco products; soft drinks; other manufacturing; energy supply, water, and waste; mining and quarrying construction; wholesale and retail trade and repairs; transport and storage; accommodation and food service activities; and other services.3
It should be mentioned that due to data confidentiality, the Scottish Government aggregates some of the food sectors and it is not possible to break them down into more meaningful sectors. Examples of this are the groups of “preserved meat and meat products”; “processed and preserved fish, fruits, and vegetables”; “manufacture of dairy, vegetables, and animal oils and fats”.
To analyze the evolution of the food and drink sector, in this study, the estimated monthly GDP by sector was used (the series were presented in Figure 2). The GDP is not the total sectoral output (this is only estimated annually and the latest figures are for 2019), it is only the value-added part; however, it has a close relationship with the total output, see Arrow (1974). Moreover, it is possible to compute changes in the value added using a multiplier (see the Ghosh model in Miller and Blair, 2009).
4. Results
The starting point of the analysis is to estimate how resilient the accommodation and food service sector is following approximately 60% contractions in final demand due to COVID-19. This had not only impacted its own sector but also its connections with other sectors to the rest of the economy.
Annex Table A1 in the Annex presents the information used for the estimation of the resilient coefficients for all sectors. It should be mentioned that to isolate the impact of Ukraine–Russia conflict, the ending period was fixed after 10 months of period 0, set in most of the cases in April 2020. Going beyond January 2021 would have also implied considering the effects of the conflict.
The resilient coefficients for the accommodation and food service sector and interconnected sectors are shown in Figure 5, “processing of meat and meat products” and “agriculture, fisheries, and forestry” were the sectors with the highest resilience coefficient, i.e., the ones to reach faster the steady state. However, the other food processing industries and the soft drink industry showed small resilient coefficients, all of them (except the bakery sector) less than 0.1.
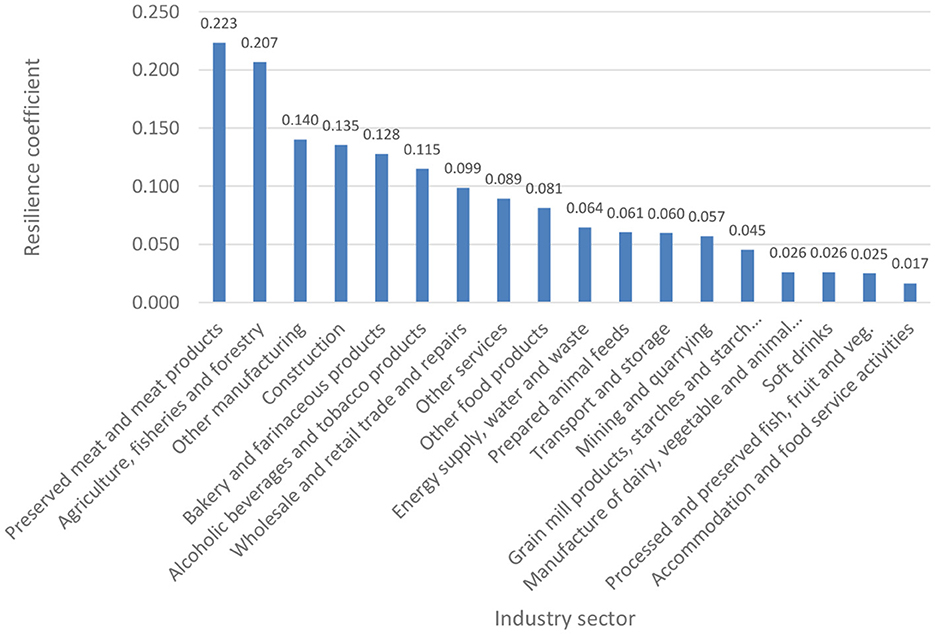
Figure 5. Estimated resilience coefficient by sector following a contraction of the accommodation and food service sector. Source: Own computation based on the Scottish input–output tables from 1998 to 2019.
The processed fish, fruits, vegetables, dairy, vegetable oils, and soft drink industry appear as particularly in a sensitive position given their relationship with the accommodation and food sector. The result from the analysis is very relevant because it reveals the speed at which the remaining sectors respond to shocks in the accommodation and food service sector. The low degree of resilience for grain mill products, starches, and starch products; mining and quarrying; transport and storage; and prepared animal feed sector reveals that supply chain shocks have lasting impacts and recover slowly, especially for these sectors.
Figure 6 presents the results for the recovery analysis—how long it takes for each sector to return to its initial output level before the shock. For this analysis, the estimated interdependence matrix (presented in the Annex Table A2) is crucial because it represents the interrelation between the different sectors. The evolution of the sectors is given by the difference equation as represented in equation (8).
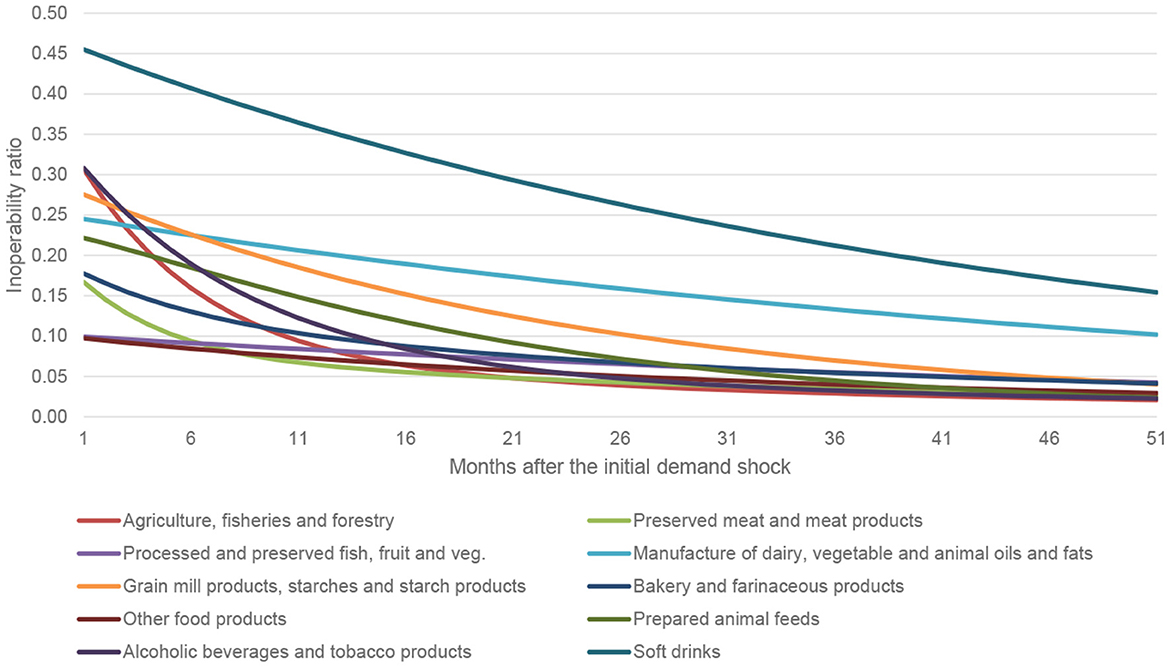
Figure 6. Inoperability dynamic recovery path for agrifood sectors of the Scottish economy. Source: Own computation based on the Scottish input–output tables from 1998 to 2019.
As shown in the figures and anticipated from the analysis of the resilience coefficients, the soft drink, and the dairy and vegetable oil sector are the ones with the slowest recovery paths. As shown, agriculture and processed meat are less affected. An interesting aspect of all these sectors is that all the sectors follow a convergent path to the steady state, this is slow in all the cases, indicating that the shocks are persistent in the sector.
Figure 7 shows how fast the agrifood and related sectors converge. As shown in the figure, agriculture, preserve meats, and alcoholic beverages' inoperability is reduced by more than half after 10 months. For instance, the soft drink sector's inoperability was reduced by approximately 25% compared to approximately 200% for the agricultural, fisheries, and forestry sectors. This disparity suggests that shocks are persistent in certain sectors, especially for the processed meat and preserved fruit and vegetable sector, and the other food product sectors.
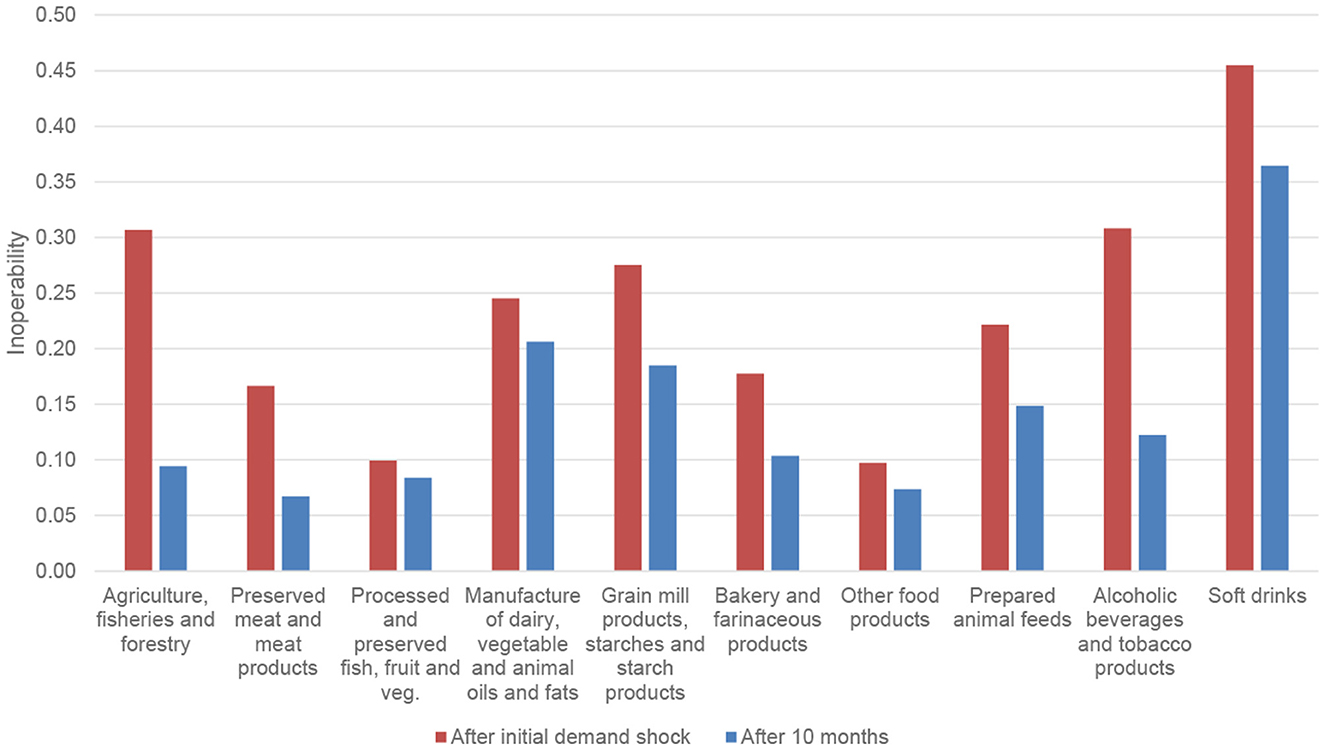
Figure 7. Initial and after 10 months of inoperability for agrifood and related sectors. Source: Own computation based on the Scottish input–output tables from 1998 to 2019.
The last part of the calculation is the estimation of economic losses, which follows equation (14) and is presented in Table 2.
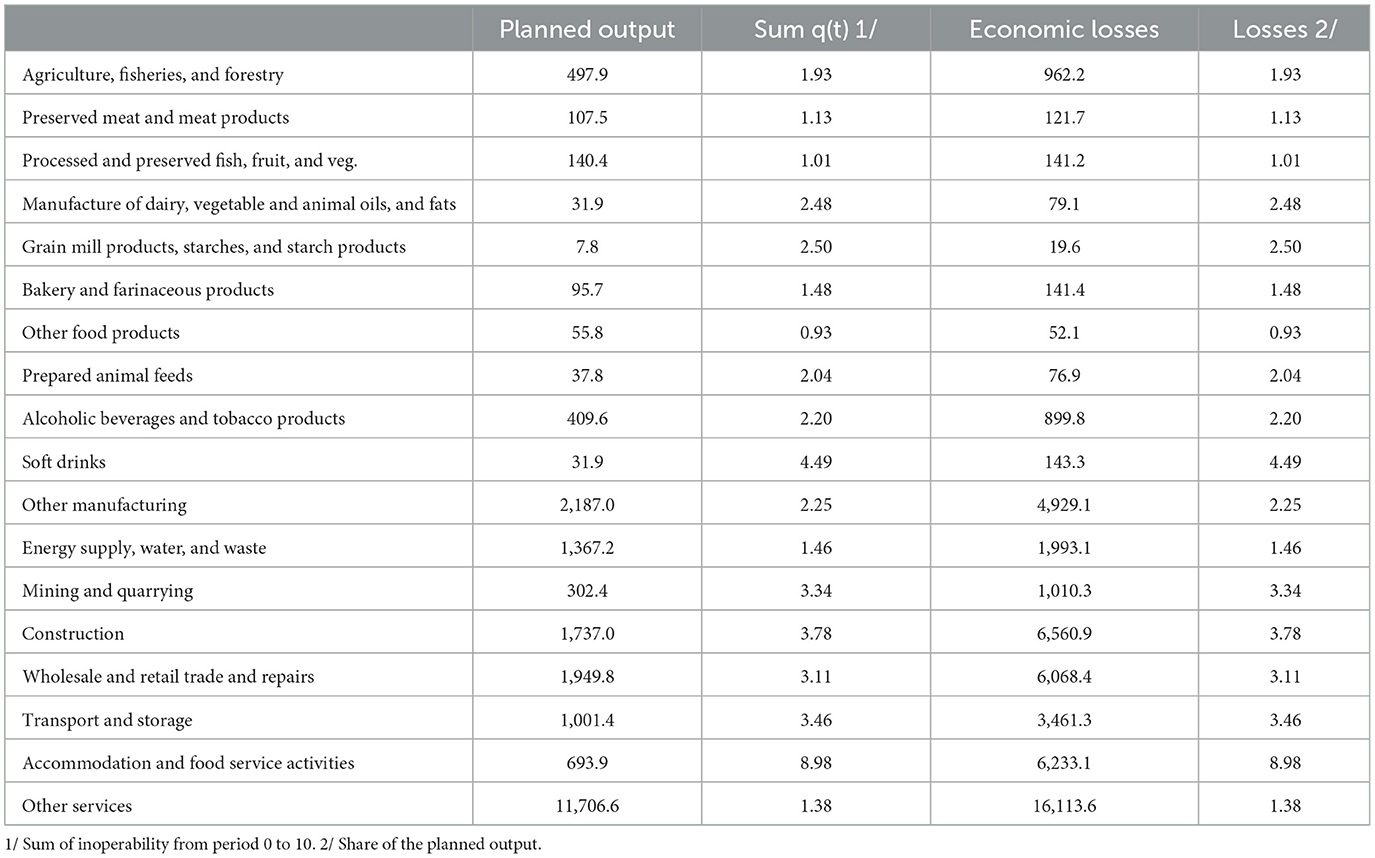
Table 2. Estimated economic losses for the first 10 months (£ million).
Table 2 shows the losses in monetary terms and also in relative terms (as a share of the planned output of the sector). In monetary terms, the food and drink sector; agriculture, fisheries and forestry, and alcoholic beverage and tobacco product sectors showed the greater losses (£962.2 and £899.8, respectively). However, the losses as a share of total sector output (column 5) provide an easier way to compare the magnitude of the losses across economic sectors. For instance, while the accommodation and food service sector has losses that are similar to wholesale and retail trade and repairs, in relative terms, the former is above two times the latter. Moreover, the soft drink sector shows a ratio of planned output to economic losses above 4 indicating the importance of the losses for the sector.
5. Discussion
The present study presents three important results as follows: (1) the extent of the resilience of sectors of the Scottish economy when one sector is adversely disrupted; (2) the duration or time required for disrupted sectors to bounce back their initial level of production; and (3) the economic losses due to the disruption. The relevance of the current results is that it exposes the most vulnerable sectors as well as the extent to which industries or companies are closely connected across the globe or countries (Shahidi, 2020).
Sector rankings provide insights into which sectors are required to develop stronger capabilities to deal with future disruptions. For instance, the ranking of resilience coefficients in Figure 4 shows that the top three sectors resilient to the shock are as follows: preserved meat and meat products; agriculture, fisheries, and forestry; and other manufacturing are the sectors with well-developed capabilities to bounce back quicker in the presence of disruption. These sectors have the highest capacity to bounce back quicker in the event of a disruption.
Another plausible explanation for the high resilience coefficient of the two agricultural sectors—preserved meat and meat products, and agriculture, fisheries, and forestry—is that the closure of the accommodation and food service sector pushed demand toward household demand and restaurant/local deliveries which offset the impact of the drop in final demand. For instance, Butu et al. (2020) showed that local deliveries of fruits and vegetables in Romania increased significantly during and after the COVID-19 lockdowns. Moreover, the agricultural and food sectors developed rapid response measures to prevent the spread of the virus quicker than most sectors (Aday and Aday, 2020).
However, sectors like the manufacture of dairy, vegetable and animal oils, and fats; soft drinks; and processed and preserved fish, fruits, and vegetable sectors are required to develop stronger capabilities to deal with future pandemics. There is a need to build and reconfigure both internal and external competencies to deal with future disruptions such as COVID-19. According to Hendry et al. (2018), these competencies could be built through proactive strategies such as building security, supplier development, and increasing visibility and through reactive strategies such as redundancy, logistics re-routing, and flexibility.
The recovery pathways show that the recovery times differ for different food and drink sectors. One possible reason for the slow recovery of the soft drink sector could be due to the shift from unhealthy eating behavior toward healthy eating (Grunert et al., 2021). There was a lot of media information on how the consumption of fruits and vegetables could boost immune systems and reduce susceptibility to diseases (Aman and Masood, 2020). These media messages could have affected the demand and the recovery of the soft drink sector. In addition, the soft drinks industry levy had come into effect further reducing the demand for the sector's output. Similarly, the slow recovery of the manufacture of dairy, vegetables, animal oils, and the fat sector could be attributed to the stringent measures imposed by governments on the dairy subsector (Bhattacharya and Jyothi, 2021).
The other service sectors, the construction sector, and the accommodation and food service activities contributed more than 60% of the total Scottish GDP in 2019. Losses in the industry's revenue translate into losses in gross domestic revenue. The economic loss estimates show the cost of the pandemic to both industry players and the government as a result stakeholders must take steps to improve the resilience of the most economically vulnerable sectors. According to O'Connor (2021), the impact of COVID-19 on tourism-related output was driven by the decline in rural tourism in Scotland. However, this is expected to change as the demand for staycation continues to rise.
6. Conclusion
The COVID-19 pandemic had a significant impact on the accommodation and food service sector. There was a massive loss in output and employment during the early days of the pandemic. The impact of the pandemic on this sector is expected to propagate across interdependent sectors of the economy. The goal of the present study was to examine how the COVID-19 disruptions to final demand in the accommodation and food service sector affected interrelated sectors focusing on the agricultural and food sectors using input–output tables from 1998 to 2019. The impact of the pandemic was measured in terms of operability and economic losses. In addition, we estimated resilient coefficients (how quickly sectors return to their initial production level) and recovery pathways for the agricultural and food sectors.
The accommodation and food service sector was the most affected by the COVID-19 pandemic lockdown contracting by approximately 60%. This is because the sector relies heavily on the movement of human and human resources as its primary input. Workforce absenteeism and lockdown restricting the movement of persons had a significant impact on turnover during the early period of the pandemic. According to the results, sectors that are related to the accommodation and food service sector are the most impacted in terms of inoperability. In addition, sectors with the largest economic loss are those that have a significant total output.
The resilience coefficient shows the speed with which disrupted sectors return to full operation. For the agricultural and food sectors, the processed and preserved fish, fruits, and vegetable sector is the least resilient while preserved meat and meat product sector is the most resilient to final demand disruption in the accommodation and food service sector. Less resilient sectors need to develop capabilities to overcome future pandemics. One area that could potentially reduce the impact of future pandemics is reducing the reliance on human resources. Moreover, these sectors need to develop collaboration with buyers outside of Scotland to ensure supply continuity when there are localized disruptions.
The dynamic recovery curve shows that recovery is quicker for the agricultural, fishery, and forestry sectors after 10 months compared to the remaining sectors, especially the soft drink sector. This suggests that the impact of the disruption is persistent in vulnerable sectors and takes a long time for these sectors to recover.
The least economically affected sector was the other food product sectors while the other service sectors had the highest economic loss. Even though the soft drink sector had a slow recovery rate, economic losses were lower compared to the agricultural, fishery, and forestry sectors.
From the policy perspective, we have shown that the most disrupted sector by the COVID-19 pandemic is the accommodation and food service sector. Stakeholders in the accommodation and food service sector should re-examine the sector and develop capacity against future pandemics. In addition, since the disruption to one sector affects the other, it is relevant for sectors to work closely together (either vertically or horizontally) by sharing the risk or cost of future pandemics. For instance, the accommodation and food service sector rely on the agricultural and fishery sector for raw materials. A future contract between these two that does not accommodate the potential impact of disruptions to demand could make only one sector bear the full cost of the disruption. However, the impact will be minimal if costs are shared. Industries should be interested in what goes on in other sectors of the economy. Managers should effectively perform network planning, transparency of inventory levels, capacity, and flexibility that can give a lens into bottleneck issues. The most vulnerable sectors of the economy, i.e., other service sectors should form a major part of government policy decision-making when planning against future pandemics.
The present study faced some limitations. First, the input–output table used is from 1998 to 2019, which is before the pandemic. It is, therefore, not possible to perform a difference-in-difference analysis that compares the performance of economic sectors before, during, and after the pandemic. To be able to complete our simulation analysis, we have assumed that supply and demand as well as structural relationships remained constant during and after the pandemic. Second, there may be other factors that may have contributed to the significant drop in the demand for the accommodation and food service sector's output, which are not addressed in the present manuscript. Finally, future research could examine and compare the isolated and combined effects of Brexit, COVID-19, and Russia–Ukraine war on the Scottish economy. In addition, an analysis of the structural changes that the economic sector might have occurred as a result of the pandemic is necessary.
Data availability statement
Publicly available datasets were analyzed in this study. This data can be found here: https://www.gov.scot/publications/input-output-latest/ and https://www.gov.scot/publications/about-gdp/.
Author contributions
CR-G: conceptualization, data preparation, investigation, visualization, formal analysis, writing—original draft, and writing—review and editing. WD: conceptualization, investigation, and writing—review and editing. All authors contributed to the article and approved the submitted version.
Funding
This paper derives from work under Topics B4 (Food supply and security) and B5 (Food and Drink Improvement), which are part of the Scottish Government—Rural and Environment Science and Analytical Services Division (RESAS) as part of their Strategic Research Programme 2022-27.
Conflict of interest
The authors declare that the research was conducted in the absence of any commercial or financial relationships that could be construed as a potential conflict of interest.
Publisher's note
All claims expressed in this article are solely those of the authors and do not necessarily represent those of their affiliated organizations, or those of the publisher, the editors and the reviewers. Any product that may be evaluated in this article, or claim that may be made by its manufacturer, is not guaranteed or endorsed by the publisher.
Supplementary material
The Supplementary Material for this article can be found online at: https://www.frontiersin.org/articles/10.3389/fsufs.2023.1095153/full#supplementary-material
Footnotes
1. ^The impact of Brexit was isolated from our analysis because according to Trades Union Congress (2020), in most cases, it is likely that that the regions and sectors most affected by the economic impact of COVID-19 are not the same as the regions and sectors likely to be the most exposed to Brexit (though there are some exceptions). They argued that the manufacture of automotive, transport equipment, chemicals and chemical products and textiles, and services such as finance and communications are the most exposed sectors to Brexit. Hospitality, tourism, transport, and arts and entertainment are the most exposed sectors in relation to economic impact of COVID-19.
2. ^This comprises of manufacture of sugar; manufacture of cocoa, chocolate, and sugar confectionery; processing of tea and coffee; manufacture of condiments and seasonings; manufacture of prepared meals and dishes; manufacture of homogenized food preparations and dietetic food; and manufacture of other food products.
3. ^This comprises of services furnished by membership organizations; repair services of computers and personal and household goods; and other personal services.
References
Aday, S., and Aday, M. S. (2020). Impact of COVID-19 on the food supply chain. Food Qual. Saf. 4, 167–180. doi: 10.1093/fqsafe/fyaa024
Aman, F., and Masood, S. (2020). How nutrition can help to fight against COVID-19 Pandemic. Pakistan J. Med. Sci. 36, S121–S123.
Arrow, K. J. (1974). “The measurement of real value added,” in Nations and households in economic growth (Academic Press) 3–19. doi: 10.1016/B978-0-12-205050-3.50006-3
Bhattacharya, B., and Jyothi. (2021). Impact of COVID-19 in food industries and potential innovations in food packaging to combat the pandemic-A review. Scientia Agropecuaria. 12, 133–140. doi: 10.17268/sci.agropecu.2021.015
Butu, A., Brumua, I. S., Tanasua, L., Rodino, C., Dinu Vasiliu, C., Dobos, S., et al. (2020). The impact of COVID-19 crisis upon the consumer buying behavior of fresh vegetables directly from local producers. Case study: The quarantined area of Suceava County, Romania'. Int. J. Environ. Res. Public Health. 17, 5485. doi: 10.3390/ijerph17155485
Grunert, K. G., De Bauw, M., Dean, M., Lähteenmäki, L., Maison, D., Pennanen, K., et al. (2021). No lockdown in the kitchen: How the COVID-19 pandemic has affected food-related behaviours. Food Res. Int. 150, 110752. doi: 10.1016/j.foodres.2021.110752
Guo, W., and Hou, G. (2019). “Analysis of vulnerability and recoverability of the energy system in China based on inoperability input-output model and a dynamic extension,” in IOP Conference Series: Earth and Environmental Science 32205. doi: 10.1088/1755-1315/252/3/032205
Haimes, Y. Y., Horowitz, B. M., Lambert, J. H., Santos, J. R., Lian, C., and Crowther, K. G. (2005). Inoperability input-output model for interdependent infrastructure sectors I: Theory and methodology. J. Infrastr. Syst. 11, 67–79. doi: 10.1061/(ASCE)1076-0342(2005)11:2(67)
Haimes, Y. Y., and Jiang, P. (2001). Leontief-based model of risk in complex interconnected infrastructures. J. Infrastr. Syst. 7, 1–12. doi: 10.1061/(ASCE)1076-0342(2001)7:1(1)
Haimes, Y. Y., and Santos, J. R. (2014). Modeling uncertainties in workforce disruptions from influenza pandemics using dynamic input-output analysis. Risk Analy. 34, 401–415. doi: 10.1111/risa.12113
Hendry, L. C., Stevenson, M., MacBryde, J., Ball, P., Sayed, M., and Liu, L. (2018). Local food supply chain resilience to constitutional change: the Brexit effect. Int. J. Operat. Prod. Manag. 39, 429–453. doi: 10.1108/IJOPM-03-2018-0184
Hyatt, D., and Santos, J. (2022). “An input-output model to determine the operability and economic impacts of IT on interdependent industries,” in 2022 Systems and Information Engineering Design Symposium (SIEDS) 37–42. doi: 10.1109/SIEDS55548.2022.9799348
Jung, J., Santos, J. R., and Haimes, Y. Y. (2009). International Trade Inoperability Input-Output Model (IT-IIM): Theory and Application. Risk Analy.. 29, 137–154. doi: 10.1111/j.1539-6924.2008.01126.x
Kjølle, G. H., Utne, I. B., and Gjerde, O. (2012). Risk analysis of critical infrastructures emphasizing electricity supply and interdependencies. Reliab. Eng. Syst. Safety 105, 80–89. doi: 10.1016/j.ress.2012.02.006
Leontief, W. (1987). Input-output analysis. The New Palgrave. A Diction. Econ. 2, 860–864. doi: 10.1057/978-1-349-95121-5_1072-1
Lian, C., and Haimes, Y. Y. (2006). Managing the risk of terrorism to interdependent Infrastruct System through the dynamic inoperability input–output model. Syst. Eng. 9, 241–258. doi: 10.1002/sys.20051
Miller, R. E., and Blair, P. D. (2009). Input-Output Analysis: Foundations and Extensions. Cambridge: Cambridge University Press. doi: 10.1017/CBO9780511626982
O'Connor, A. (2021). Scottish Tourism and COVID-19. Edinburgh. Available online at: https://sp-bpr-en-prod-cdnep.azureedge.net/published/2021/3/8/2700b49a-ae5d-4973-a149-88b7b5144d70/SB_21-17.pdf
Office for National Statistics. (2020). Coronavirus the effects on UK GDP. London: Office for National Statistics.
Ramos Carvajal, M. D. C., and Blanc Díaz, M. (2002). The foundations of dynamic input-output revisited: Does dynamic input-output belong to growth theory? Documentos de trabajo (Universidad de Oviedo. Facultad de Ciencias Económicas).
Santos, J. R. (2006). Inoperability input-output modeling of disruptions to interdependent economic systems. Syst. Eng. 9, 20–34. doi: 10.1002/sys.20040
Santos, J. R., and Haimes, Y. Y. (2004). Modeling the demand reduction input-output (I-O) inoperability due to terrorism of interconnected infrastructures. Risk Analy. 24, 1437–1451. doi: 10.1111/j.0272-4332.2004.00540.x
Santos, J. R., Orsi, M. J., and Bond, E. J. (2009). Pandemic recovery analysis using the dynamic inoperability input-output model. Risk Anal. Int. J. 29, 1743–1758. doi: 10.1111/j.1539-6924.2009.01328.x
Scottish Government (2022a). Scotland's Wellbeing: The Impact of COVID-19 - Chapter 3: Economy, Fair Work and Business, Culture | National Performance Framework. Scottish Government. Available online at: https://nationalperformance.gov.scot/scotlands-wellbeing-impact-COVID-19-chapter-3-economy-fair-work-business-culture (accessed October 01, 2022).
Scottish Government (2022b). Scotland's Wellbeing: The Impact of COVID-19 - Chapter 3: Economy, Fair Work and Business, Culture | National Performance Framework. Scottish Government.
Scottish Government (2022c). Supply, Use and Input-Output Tables: 1998-2019. Available online at: https://www.gov.scot/publications/input-output-latest/ (accessed October 26, 2022).
Setola, R., and De Porcellinis, S. (2007). “A methodology to estimate input-output inoperability model parameters,” in International Workshop on Critical Information Infrastructures Security 149–160. doi: 10.1007/978-3-540-89173-4_13
Shahidi, F. (2020). Does COVID-19 affect food safety and security? J. Food Bioact. 9, 1–3. doi: 10.31665/JFB.2020.9212
Watts, R. (2022). Intense pressures remain as Scottish hospitality returns to the global stage. The Herald.
Yaseen, Q. M., Akhtar, R., Khalil, M. K. U., and Jan, Q. M. U. (2020). Dynamic inoperability input-output modeling for economic losses estimation in industries during flooding. Socio-Econ. Plann. Sci. 72, 100876. doi: 10.1016/j.seps.2020.100876
Keywords: COVID-19, Scotland food and drink industry, dynamic interoperative input–output model, dynamic recovery, input–output analysis
Citation: Revoredo-Giha C and Dogbe W (2023) A resilience analysis of the contraction of the accommodation and food service sector on the Scottish food industry. Front. Sustain. Food Syst. 7:1095153. doi: 10.3389/fsufs.2023.1095153
Received: 10 November 2022; Accepted: 02 March 2023;
Published: 31 March 2023.
Edited by:
Samuele Trestini, University of Padova, ItalyReviewed by:
Gaetano Chinnici, University of Catania, ItalyGiulia Gastaldello, Free University of Bozen-Bolzano, Italy
Copyright © 2023 Revoredo-Giha and Dogbe. This is an open-access article distributed under the terms of the Creative Commons Attribution License (CC BY). The use, distribution or reproduction in other forums is permitted, provided the original author(s) and the copyright owner(s) are credited and that the original publication in this journal is cited, in accordance with accepted academic practice. No use, distribution or reproduction is permitted which does not comply with these terms.
*Correspondence: Cesar Revoredo-Giha, cesar.revoredo@sruc.ac.uk