Integration of lipidomics and metabolomics approaches for the discrimination of harvest time of green tea in spring season by using UPLC-Triple-TOF/MS coupled with chemometrics
 Hui-Na Cui1
  Hui-Wen Gu2
  Zhi-Quan Li1 Weiqing Sun1 Baomiao Ding1 Zhenshun Li1 Ying Chen2 Wanjun Long3
  Xiao-Li Yin1*
  Haiyan Fu3*
- 1College of Life Sciences, Institute of Food Science and Technology, Yangtze University, Jingzhou, China
- 2College of Chemistry and Environmental Engineering, Yangtze University, Jingzhou, China
- 3The Modernization Engineering Technology Research Center of Ethnic Minority Medicine of Hubei Province, School of Pharmaceutical Sciences, South-Central Minzu University, Wuhan, China
The production season is one of the judgment standards of the green tea quality and spring tea is generally considered of higher quality. Moreover, early spring tea is usually more precious and sells for a higher price. Therefore, a multifaceted strategy that integrates lipidomics and metabolomics, based on UPLC-Triple-TOF/MS coupled with chemometrics, was developed to discriminate early spring green tea (ET) and late spring green tea (LT). Twenty-six lipids and forty-five metabolites were identified as characteristic components. As for characteristic lipids, most of glycerophospholipids and acylglycerolipids have higher contents in ET. By contrast, glycoglycerolipids, sphingolipids and hydroxypheophytin a were shown higher levels in LT samples. Most of the differential metabolites identified were more abundant in ET samples. LT samples have much higher catechin, procyanidin B2, and 3',8-dimethoxyapigenin 7-glucoside contents. Based on the integration of differential lipids and metabolites, the reconstructed orthogonal partial least squares discriminant analysis (OPLS-DA) model displayed 100% correct classification rates for harvest time discrimination of green tea samples. These results demonstrated that the integration of lipidomics and metabolomics approaches is a promising method for the discrimination of tea quality.
1. Introduction
Tea is considered as the most widely consumed beverage except water in the world. Green tea is the most prevalent, particularly in East Asian countries, due to its exclusive satisfactory sensory qualities and health benefits (Ratnani and Malik, 2022). The price of green tea is related to its quality, good quality usually corresponds to a high price (Li et al., 2021b). Some profit-seeking merchants label low-quality tea as high-quality tea, which is harmful to consumer protection and the development of the tea market. Therefore, tea quality evaluation methods are urgently needed.
The quality of tea is influenced by many factors, including variety, climate, soil, harvest season, manufacturing process, and storage (Yin et al., 2022; Zhao et al., 2022). In many cases, the production season is the most important judgment standard of the green tea quality, which has become a decisive factor in ascertaining its price. It was reported that spring tea usually contains higher levels of free amino acids and moderate levels of catechins, which contribute to umami and mellow flavor of tea (Xu et al., 2012; Liu et al., 2015). On the contrary, higher levels of procyanidin B2 and gallotannins enhance the bitterness and astringency of teas (Jiang et al., 2022). Therefore, it's meaningful to understand the variation of chemical constituents of green tea related to season harvest period for the development of tea quality evaluation methods.
Several studies have investigated the differences in chemical constituents of tea harvested in different seasons. These studies suggest that chemical components such as amino acids and catechins exhibited sharp seasonal fluctuations (Dai et al., 2015; Ma et al., 2022). The contents of amino acids decreased whereas carbohydrates, flavonoids and their glycosides, tricarboxylic acid cycle and photorespiration pathways were strongly reinforced in the late spring season (Liu et al., 2016; Ma et al., 2022). In our previous study, we also found that there are higher contents of gallocatechin and procyanidin B1 in summer tea (Peng et al., 2021). However, most of these studies were focused on the measurements of hydrosoluble metabolites, and there are few studies on hydrophobic compounds. In fact, some hydrophobic compounds also have an important influence on the flavor quality of tea. For example, lipid-soluble chlorophylls are major pigments in fresh tea leaves that constitute an essential basis of the unique color of green tea (Yu et al., 2019). Furthermore, the oxidation and degradation products of unsaturated fatty acids produce a number of fragrant volatiles, which are responsible for the fresh odor of tea as well (Ho et al., 2015). Herein, it is meaningful to study hydrosoluble and hydrophobic compounds simultaneously so as to gain a comprehensive understanding of the differences in metabolites of green tea with different qualities.
Lipidomics and metabolomics are powerful tools that enable comprehensive investigation of the lipids and metabolites possible in tea samples. Li et al. (2017, 2021a) reveals dynamic changes in tea lipids and their metabolic pathways during the manufacturing process of black tea and green tea using LC-MS combined with chemometric methods. However, the ability of single lipidomics or metabolomics to discover crucial compounds responsible for the quality evaluation and authenticity identification is limited. Metabolomics mainly focuses on polar metabolites. Lipidomics strives to comprehensively identify and quantify all kinds of lipid molecular species (Wenk, 2010). Lipids need to be treated and analyzed separately (i.e., requiring different solvent systems) from small-molecule metabolites due to their hydrophobic nature. Therefore, the integration of lipidomics and metabolomics can greatly expand the scope of composition analysis (Liu and Xu, 2018; Chen et al., 2021; Jia et al., 2021), which was a powerful strategy covering both polar and non-polar compounds. The current study aims to roundly expound the differentiation of chemical compositions between the early spring green tea (ET) and late spring green tea (LT) in combination with UPLC-Triple-TOF/MS-based lipidomics and metabolomics. Through the integration of lipidomics and metabolomics, more differential compounds between ET and LT may be screened based on multivariate statistical analysis methods, so as to be used for the picking time discrimination of spring tea.
2. Materials and methods
2.1. Reagents and materials
HPLC-grade methanol (MeOH) was supplied by J. T. Baker (Danville, PA), and HPLC-grade methyl tert-butyl ether (MTBE) was purchased from Aladdin Biochemical Technology Co., Ltd (Shanghai, China). MS-grade of Acetonitrile (ACN) and HPLC-grade isopropanol (IPA) was obtained from Thermo Fisher Scientific Co., Ltd (Shanghai, China). MS-grade of Formic acid (FA) and ammonium acetate were available from ACS chemistry Company (Shanghai, China). Distilled water was obtained from Watsons (Hong Kong, China). Procyanidin B2, Myricitrin, Diosmetin-7-O-β-D-glucopyranoside and 4-OH-coumarin were purchased from Shanghai Yuanye Bio-Technology Co., Ltd (Shanghai, China). Theanine was obtained from Shanghai Anpu Experimental Technology Co., Ltd (Shanghai, China). The purity of all standards was >98%. Accurately weigh 1 mg of each standard and dissolve to 10 mL of methanol. A series of standard stock solutions at a concentration of 0.1 mg/mL were obtained. Then, a mixed standard solution was prepared by mixing 100 μL of each stock solution. All the solutions were stored in a brown volumetric flask at 4°C before analysis.
2.2. Green tea samples and preparation
A total of 20 Laoshan green tea samples were collected from Qingdao Laoshan Wanggezhuang Tea Factory (Shandong Province, China). Laoshan green tea is the northernmost green tea in China, which is usually picked from mid-to-late April to late September. Among them, spring tea is picked from April to June. In this work, Grain Rain, the Chinese solar term, is the time point for dividing early spring tea and late spring tea. Ten early spring green tea (ET) were picked on April 16th, and the late spring green teas (LT) were picked on May 24th (LT) in 2020. These tea samples are taking one bud with two leaves and belong to the same cultivars. The fresh leaves were processed into tea products through spreading out, deenzyming, rolling and drying in accordance with flat tea process technology. Samples were ground into powder using a grinding miller and passed through a 60-mesh sieve and then stored at −18°C. Each sample was in triplicate. The lipids and metabolites of tea were extracted on the basis of the previously reported procedure with minor modifications (Li et al., 2017; Peng et al., 2021). Briefly, 20 mg tea powder was accurately weighed in a 1 mL centrifuge tube. 300 μL of MeOH and 1 mL of MTBE were added to the tube. After continuous vortex mixing for 1 h, 300 μL distilled water was added to form a two-phase system. After standing for 1 min at room temperature, the two-phase system was separated by centrifugation for 10 min at 12,000 rmp. The supernatants were lipid metabolites. Then, 200 μL of the upper phase was transferred to a clean centrifuge tube, dried naturally at room temperature and stored at −80°C until analyzed. Each dried sample was dissolved in 200 μL of ACN/IPA/H2O (65:30:5, v/v/v) and filtered through 0.22 μm PTME hydrophobic membrane. Finally, they were transferred into sample vials for analysis. Quality control (QC) samples were prepared by mixing 50 μL of lipid extracts of tea samples to evaluate the lipidomics analysis process.
For the extraction of characteristic metabolites of tea samples, 20 mg of tea powder was accurately weighed into a centrifuge tube. Then, 1 mL of 70% methanol was added. The mixtures were extracted with ultrasonic for 10 min at 60°C and centrifuged at 12,000 rpm for 10 min. After cooling to room temperature, the supernatants were diluted 5-fold with distilled water and filtered through a 0.22 μm PTME hydrophilic membrane. All stock solutions were stored at 4°C prior to UPLC-Triple-TOF/MS analysis. QC samples were prepared in the same way as in lipidomics analysis. The QC samples were inserted at every ten tea samples during analysis, and one QC was inserted before and after injection, respectively.
2.3. UPLC-triple-TOF/MS analysis
The analysis of tea samples was carried out on an ultra-performance liquid chromatography (UPLC)-Triple-time-of-flight mass spectrometer system (Triple TOF™ 5600+, AB SCIEX, USA) in both positive and negative modes. The LC separation was performed on an ExionLC™ system consisting of a binary high pressure mixing gradient pump with degasser, a thermostated auto-sampler, a controller, a photodiode array (PDA) detector, a reservoir tray, and a column oven. The Triple TOF™ 5600+ mass spectrometer was equipped with a DuoSpray TM source.
For lipidomics analysis, a Kinetex XB-C18 column (2.6 μm, 100 × 2.1 mm, Phenomenex, USA) was used for chromatographic separations with a column temperature of 50°C. Gradient elution was carried out using mobile phase A ACN/H2O (60:40, v/v) and B IPA/ACN (90:10, v/v), both containing 5 mM ammonium acetate, at a flow rate of 0.26 mL/min. The optimal gradient elution program was set as follows: 0–2 min, 32% B; 2–4 min, 32–60% B; 4–13 min, 60–97% B; 13–17 min. 97% B; 17–17.1 min, 97–32% B; 17.1–20 min, 32% B, a total elapsed time was 20 min. The samples were kept at 4°C in the auto-sampler and 5 μL was injected for analysis. Full scan (TOF-MS) and data-independent acquisition (DIA) modes were used simultaneously to acquire MS and MS/MS spectra. The TOF-MS and MS/MS analysis were acquired in positive mode with the scan ranges of 200–1,200 and 100–1,200 Da for the precursor ions and product ions, respectively. MS acquisition parameters were set as follows: ionization source temperature, 500°C; ionspray voltage floating, 5.5 kV; gas 1 pressure, 55 psi, and gas 2 pressure, 55 psi; curtain gas pressure, 35 psi; declustering potential, 70 V; collision energy was of 45 V with the spread of ±15 V. An automatic calibration was performed every 10 samples by the calibration delivery system (CDS, APCI calibration solution) to ensure mass accuracy during the measurement.
For metabolomics analysis, chromatographic separations were performed on a Kinetex F5 column (2.6 μm, 100 × 2.1 mm, Phenomenex, USA) with a column temperature of 30°C. Gradient elution was carried out using mobile phase (A) water with 0.1% (v/v) formic acid and (B) ACN at a flow rate of 0.3 mL/min. The gradient elution program was operated as follows: 0–0.5 min, 5% B; 0.5–3 min, 5–40% B; 3–9 min, 40–90% B; 9–12 min, 95% B; 12–12.1 min, 95–5% B; 12.1–15 min, 5% B. The injection volume of the sample was set at 5 μL. The temperature of the auto-sampler was kept at 10°C. Full scan (TOF-MS) and data-independent acquisition (DIA) modes were used simultaneously to acquire MS and MS/MS spectra. The TOF-MS and MS/MS analysis were acquired in both positive and negative ionization modes with the scan ranges of 100–1,000 and 50–1,000 Da for the precursor ions and product ions, respectively. The MS parameters in positive and negative ionization modes were set as follows: ionization source temperature, 550°C; capillary voltage, +5.5 kV (ESI+) and −4.5 kV (ESI–); gas 1 pressure, 55 psi, and gas 2 pressure, 55 psi; curtain gas pressure, 25 psi; declustering potential, 70 V; collision energy was of 35 V with the spread of ±15 V. As in lipid analysis, automatic calibration was also performed every 10 samples to ensure mass accuracy during the measurement.
2.4. Data processing and chemometric analysis
The raw LC-MS data were analyzed by the MarkerViewTM 1.3 software (AB Sciex LLC., Framingham, MA, USA). The process parameters were shown in Support Information. The retention time range for peak finding in lipidomics analysis and metabolomics analysis were 0.5 and 17, 0.5 and 13 min, respectively. The subtraction multiple factor was set to 1.5 and the noise threshold was set to 100. The retention time tolerance and mass tolerance were set to be 0.5 min and 10 ppm for peak alignment, respectively. Two conditions were used to filter the extraction peaks: one is to remove peaks in <30 samples and the other is to set the maximum number of peaks to be 5,000 and 4,000 for lipidomics and metabolomics analysis, respectively. The data was processed using total area sum normalization before exporting.
A table of peak values was exported for principal component analysis (PCA) and orthogonal partial least squares discriminant analysis (OPLS-DA) by using SIMCA-P software (MKS Umetrics AB, Umeå, Sweden). The quality of models was defined by the parameters of R2Xcum, R2Ycum, and , in which R2Xcum and R2Ycum represent the fraction of the variance of the X matrix and Y matrix, respectively, while indicates the predictive accuracy of the model (Szeto et al., 2010). The model is considered reliable when three indicators (R2Xcum, R2Ycum, and ) higher than 0.5 and close to 1 indicate an excellent model. A permutation test with 200 permutations was conducted to assess the validity of the model (Mahadevan et al., 2008). HCA heatmap analysis was performed with R program (version 3.6.2) using Manhattan distance measurement method for differential lipids and Euclidean distance measurement method for differential metabolites, respectively.
2.5. Identification of lipids and metabolites
Powerful informatics tools and databases were simultaneously used for the identification of characteristic compounds. MS-DIAL (http://prime.psc.riken.jp/compms/msdial/main.html) and MS-FINDER (http://prime.psc.riken.jp/compms/msfinder/main.html) were applied to preliminary identify the metabolites. PeakView (AB Sciex LLC., Framingham, MA, USA) was used for the calculation of elemental formulas of the unknown compounds, assessment of monoisotopic profiles of the MS data, as well as evaluation of the MS/MS fragmentation pattern. The identified characteristic compounds were further confirmed using authentic standards, free databases including LipidMaps (https://www.lipidmaps.org/), PubChem (https://pubchem.ncbi.nlm.nih.gov/), MassBank (https://massbank.eu/MassBank/), HMDB (https://hmdb.ca/), MassBank of North America (https://massbank.us/), ChemSpider (https://www.chemspider.com/) and published literatures. Heatmap visualization and boxplot were conducted by using MATLAB software to illustrate the content differences of characteristic compounds in different groups of green tea.
3. Results and discussion
3.1. Lipidomics and metabolomics analysis based on UPLC-triple-TOF/MS
As shown in Figure 1, the TICs of lipids and metabolites of green tea picked in April and May were very similar. Further statistical analysis is necessary. After data preprocessing, a total of 1,329 ions were extracted in lipidomics analysis. In metabolomics analysis, a total of 2,737 and 2,658 ions were acquired in positive and negative modes, respectively. With the combination of lipidomics and metabolomics, plenty of chemical information was obtained for further statistical analysis.
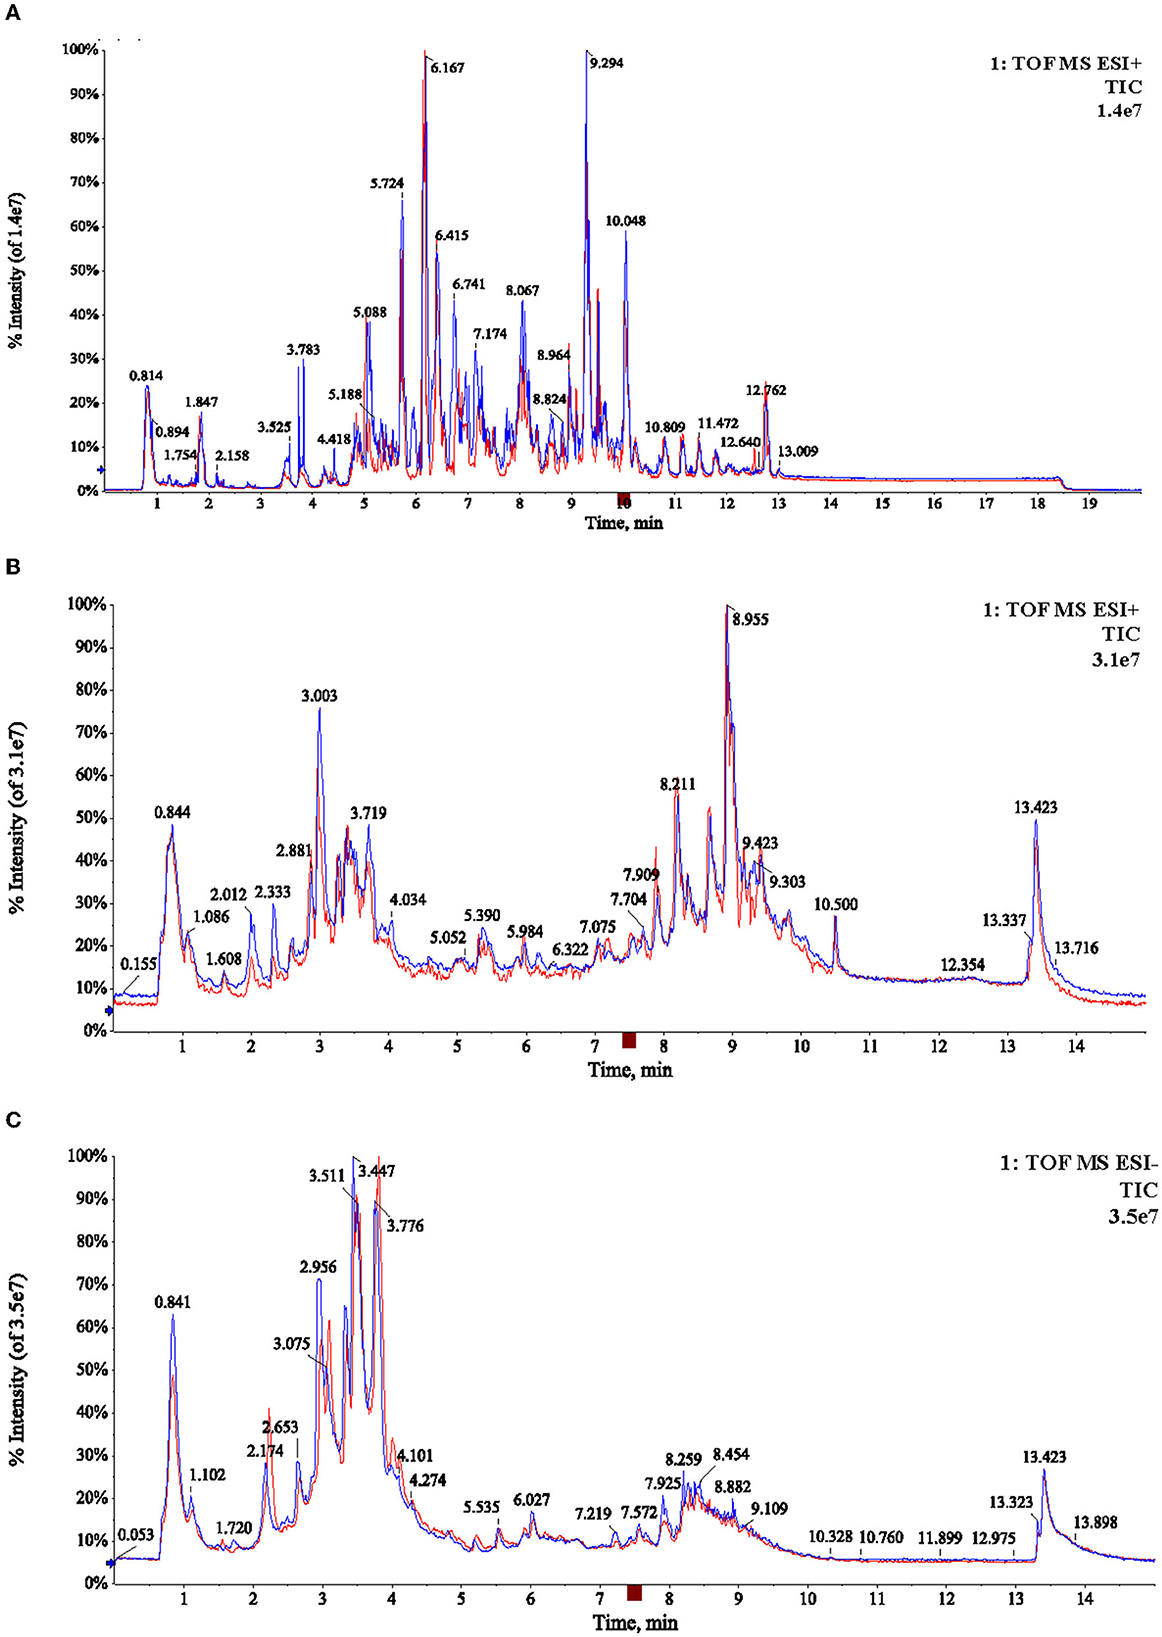
Figure 1. Typical TICs chromatogram of the two samples (A06, M06) in lipidomic analysis with positive mode (A), and metabolomic analysis with positive and negative ion mode (B, C), respectively.
3.2. Lipidomics character of early and late spring Laoshan tea
As displayed in the PCA score plot (Figure 2A), the QC samples were gathered tightly, indicating the good stability and precision of the lipid profile acquisition method. ET and LT samples can be separated in view of the lipid profiles, demonstrating the lipids differences between ET and LT. Subsequently, a supervised method OPLS-DA was applied to study the lipidomics data. As shown in Figure 2B, excellent classification result was achieved for ET and LT samples. The R2Xcum, R2Ycum, and of the OPLS-DA model based on lipidomics data were 0.595, 0.977, and 0.912 (Table 1), respectively, indicating the wonderful predictive ability of the model. The results of 200 times permutation test (Figure 3A) also exhibited that the model is reliable and not over-fitted (Q2 < 0.05, R2 values < original values). Based on the OPLS-DA model and univariate analysis (p-value and fold change), lipids with VIP > 1, p-values < 0.05 and fold change >2 or < 0.5 were regarded as differential lipids. As a result, 26 lipid ions were screened out.
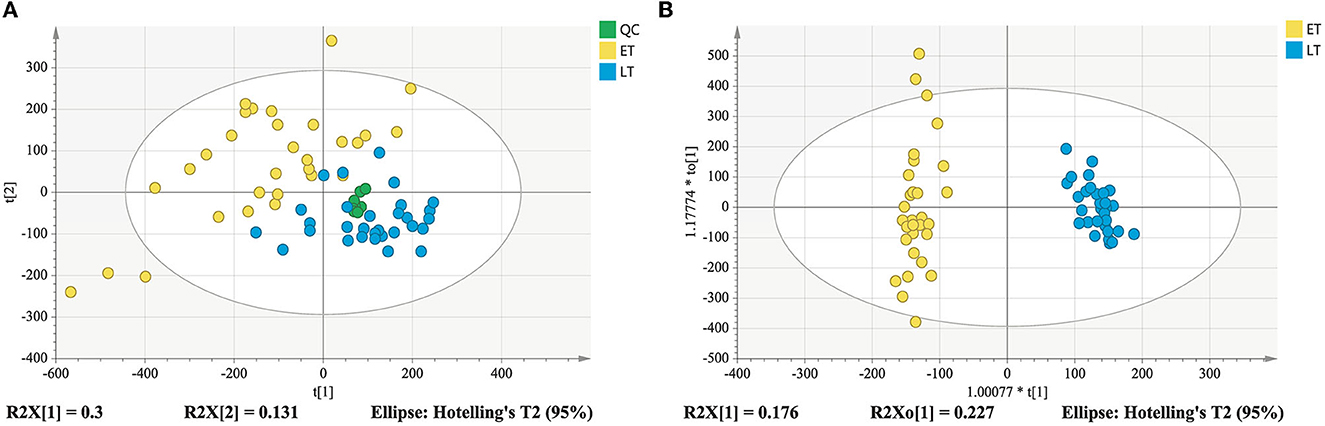
Figure 2. PCA score plot derived from lipidomics analysis (A); OPLS-DA score plot of lipidomics analysis (B).
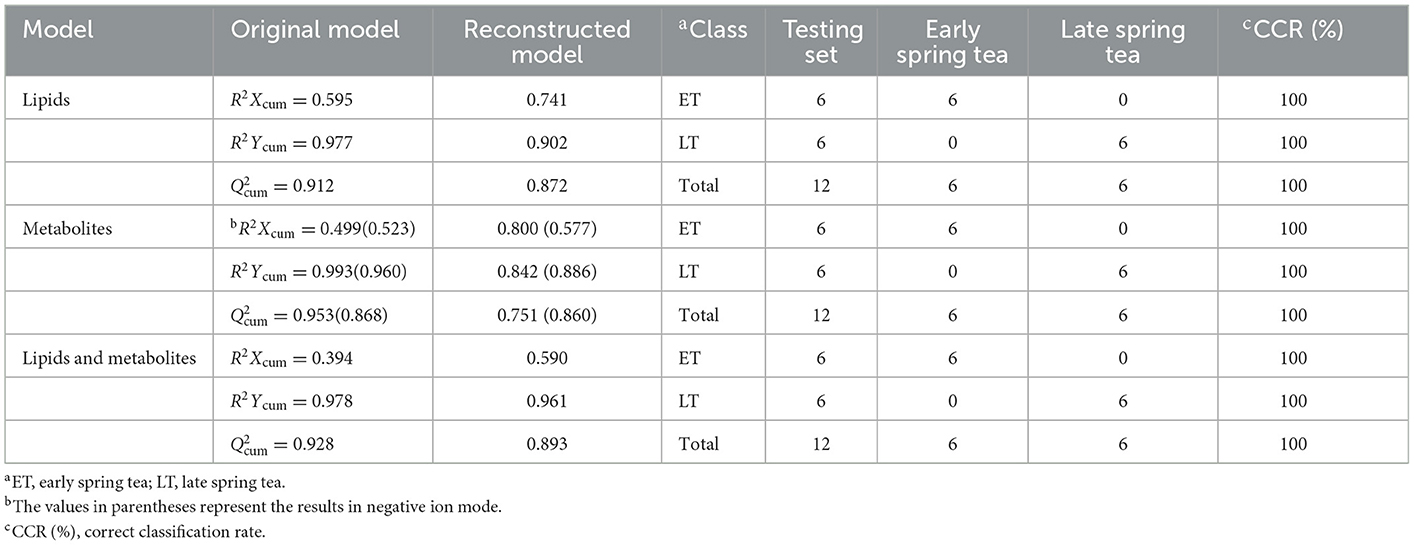
Table 1. Model parameters and external validation results of reconstructed OPLS-DA model.
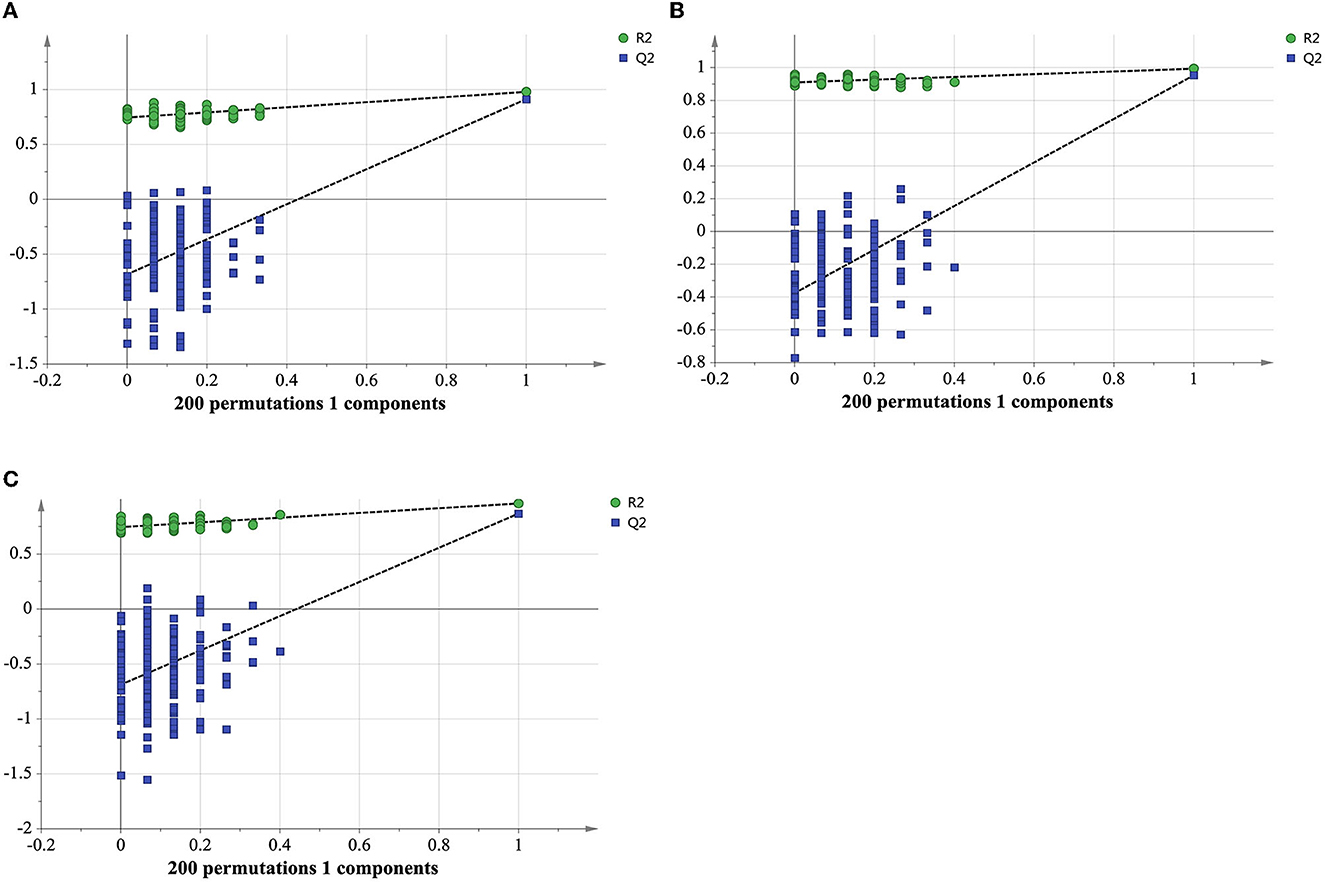
Figure 3. Cross-validation plot of the OPLS-DA model with 200 permutation tests from lipidomics analysis in positive ionization mode (A), metabolomics analysis in positive (B) and negative ionization mode (C).
The 26 lipid ions were identified as follows: these lipids were preliminarily discriminated by MS-DIAL and MS-FINDER software based on MS and MS2 information. The potential name of the compound was predicted by MS-DIAL software, and MS-FINDER provides the formula of the compound. Then, the chemical structure of the compound was searched in databases such as LipidMaps, PubChem, MassBank, HMDB, MassBank of North America and ChemSpider and downloaded as a mol format file. The file was used to generate theoretical simulated MS/MS fragments by using the PeakView software. The theoretical fragments are then matched with the fragment pane of the corresponding experimental MS/MS fragments. Match scores >70 are acceptable. At last, 25 lipid molecules were identified and divided into 5 lipid species consisting of 1 chlorophyll derivative, 7 glycoglycerolipids, 1 sphingolipid, 12 glycerophospholipids, 4 acylglycerolipids. Table 2 summarized the detailed information of these identified chemical components.
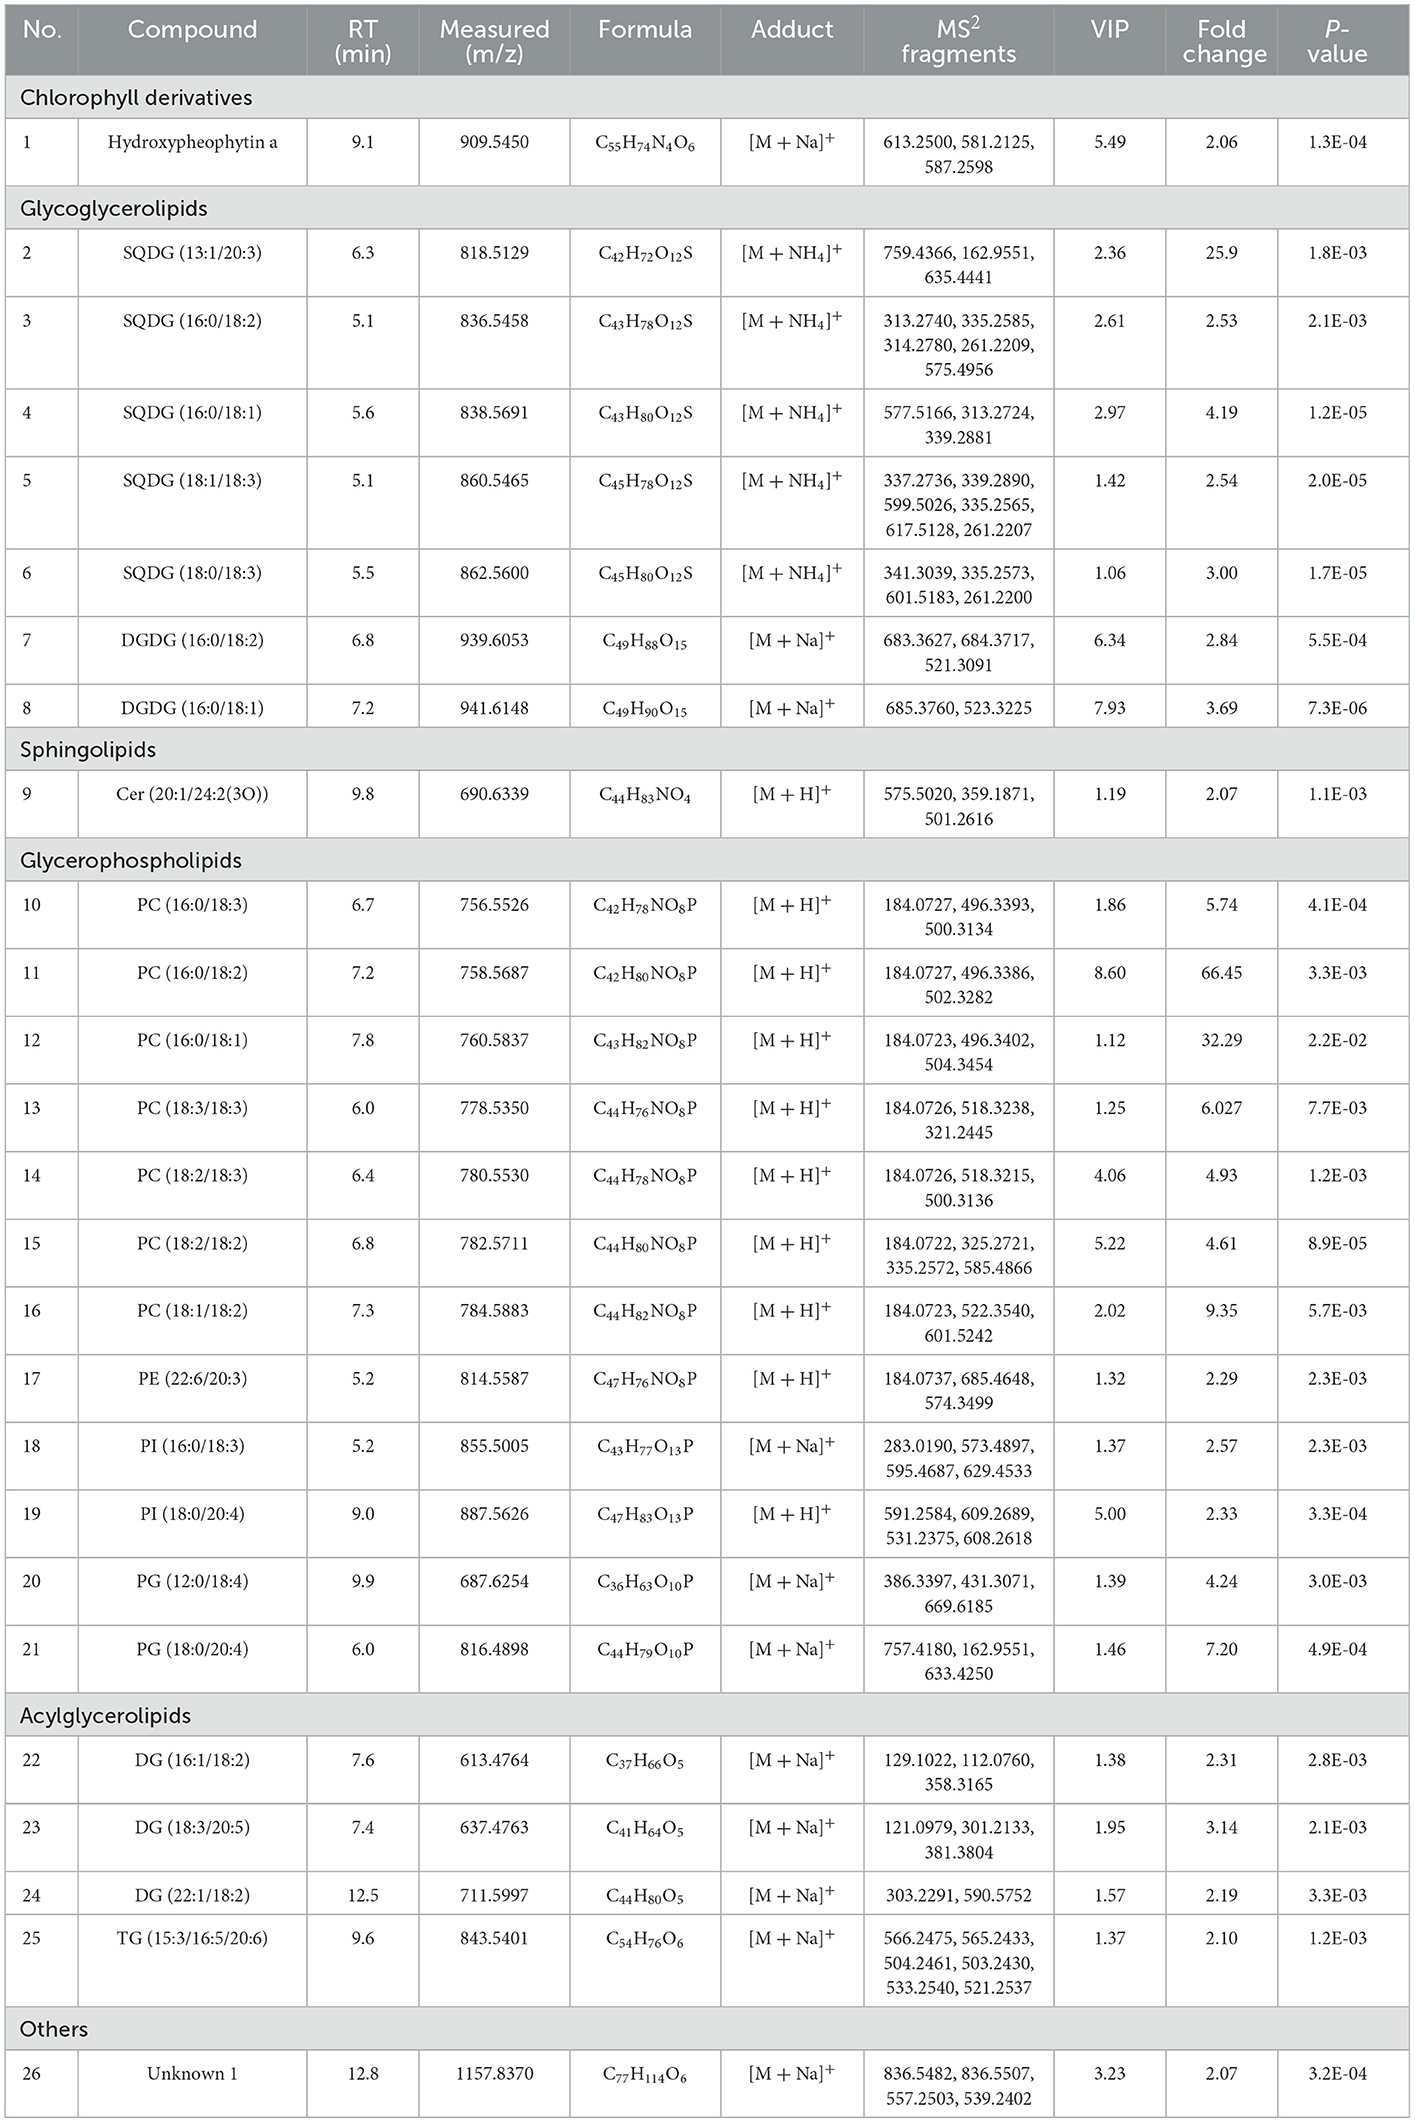
Table 2. List of 26 significantly differential lipids in early and late spring green tea.
3.3. Metabolomics character of early and late spring Laoshan tea
Good aggregation of QC samples in the PCA score plot (Figures 4A, B) indicated that the metabolomics acquisition method was feasible. Although a certain degree of separation of ET and LT samples can be reflected, the overlap between partial samples makes the PCA models difficult to use for satisfactory classification. The supervised method was further used for classification and discrimination. The OPLS-DA score plots showed a clear separation of the two groups of tea samples in both positive and negative ionization modes (Figures 4C, D). The Q2 values (Table 1) of the OPLS-DA model based on the two modes were close to 1, reflecting excellent predictive ability. 200 times permutation tests (Figures 3B, C) with Q2 intercept of −0.407 and −0.703 also presented that the OPLS-DA models have good reliability without overfitting. Based on the OPLS-DA models, secondary metabolites with VIP > 2, p-values < 0.05 and fold change >2 or <0.5 were selected as differential compounds. As a result, 144 positive ions and 99 negative ions were screened out.
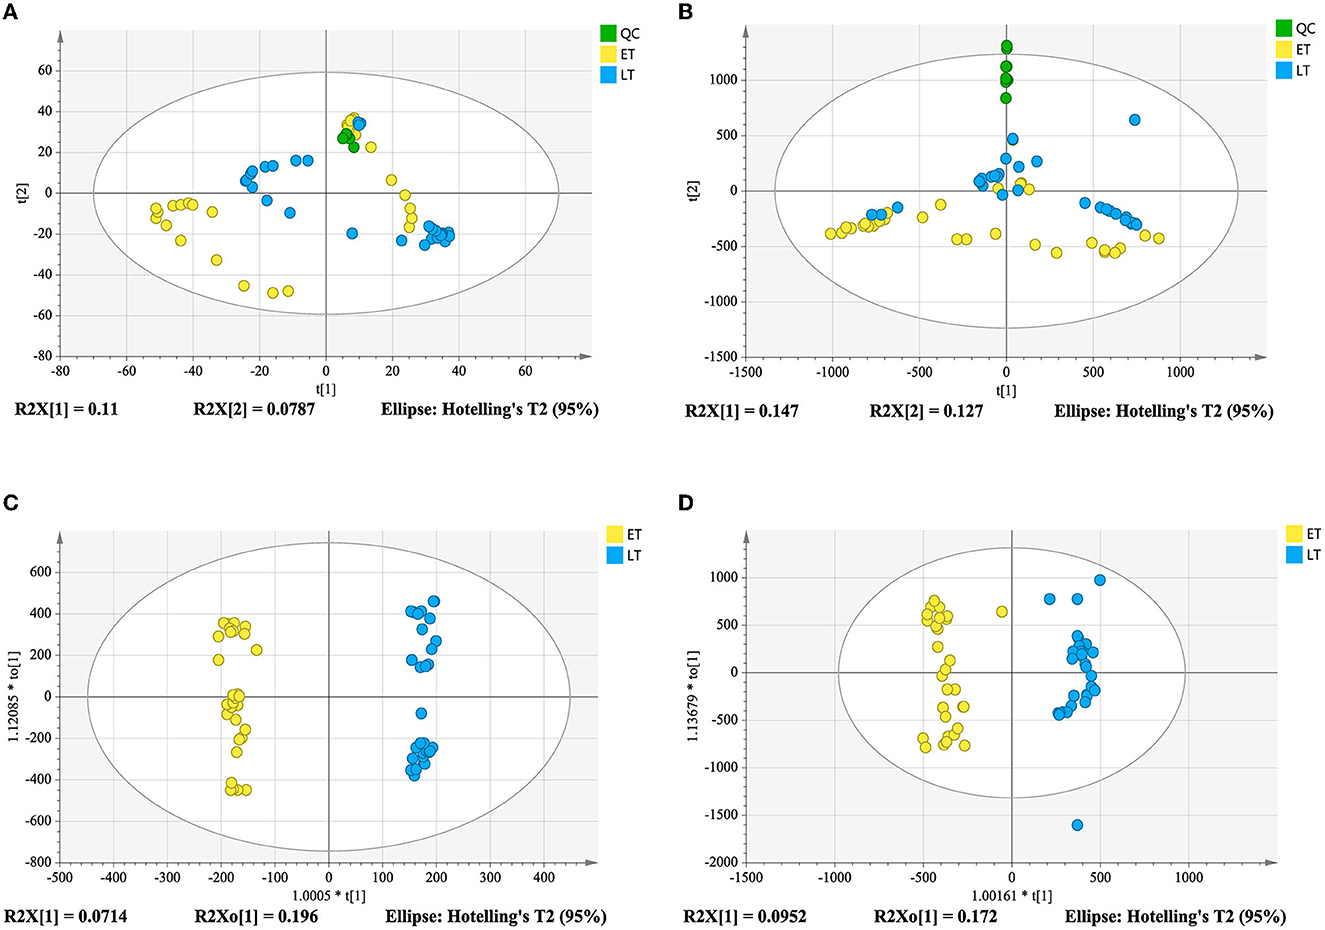
Figure 4. Score plots derived from metabolomics analysis in positive and negative ionization modes. PCA score plot in positive ionization mode (A); PCA score plot in negative ionization mode (B); metabolomics analysis in positive ionization mode (C); metabolomics analysis in negative ionization mode (D).
Ultimately, a total of 45 differential metabolites including 19 and 26 metabolites from positive and negative ionization modes were determined based on retention time, accurate mass and MS/MS fragmentation. Forty-five metabolites, including 11 catechins and relatives, 15 flavonoids and flavonol/flavone glycosides, 4 amino acids, 3 phenolic acids and their derivatives, 2 terpenoids, 2 nucleosides, 1 chlorophyll derivative, 3 lipids, 1 organic acid, 2 phenylpropanoids and polyketides, and 1 aldehyde metabolites were tentatively identified (Table 3). Among them, 9 metabolites were validated according to authentic standards, 35 differential metabolites were in accordance with literature (Koshiishi et al., 2001; Tan et al., 2016; Xin et al., 2018; Yang et al., 2018; Yue et al., 2019; Cheng et al., 2020; Fan et al., 2021; Wang et al., 2021), and the remaining 1 metabolite was validated by databases.
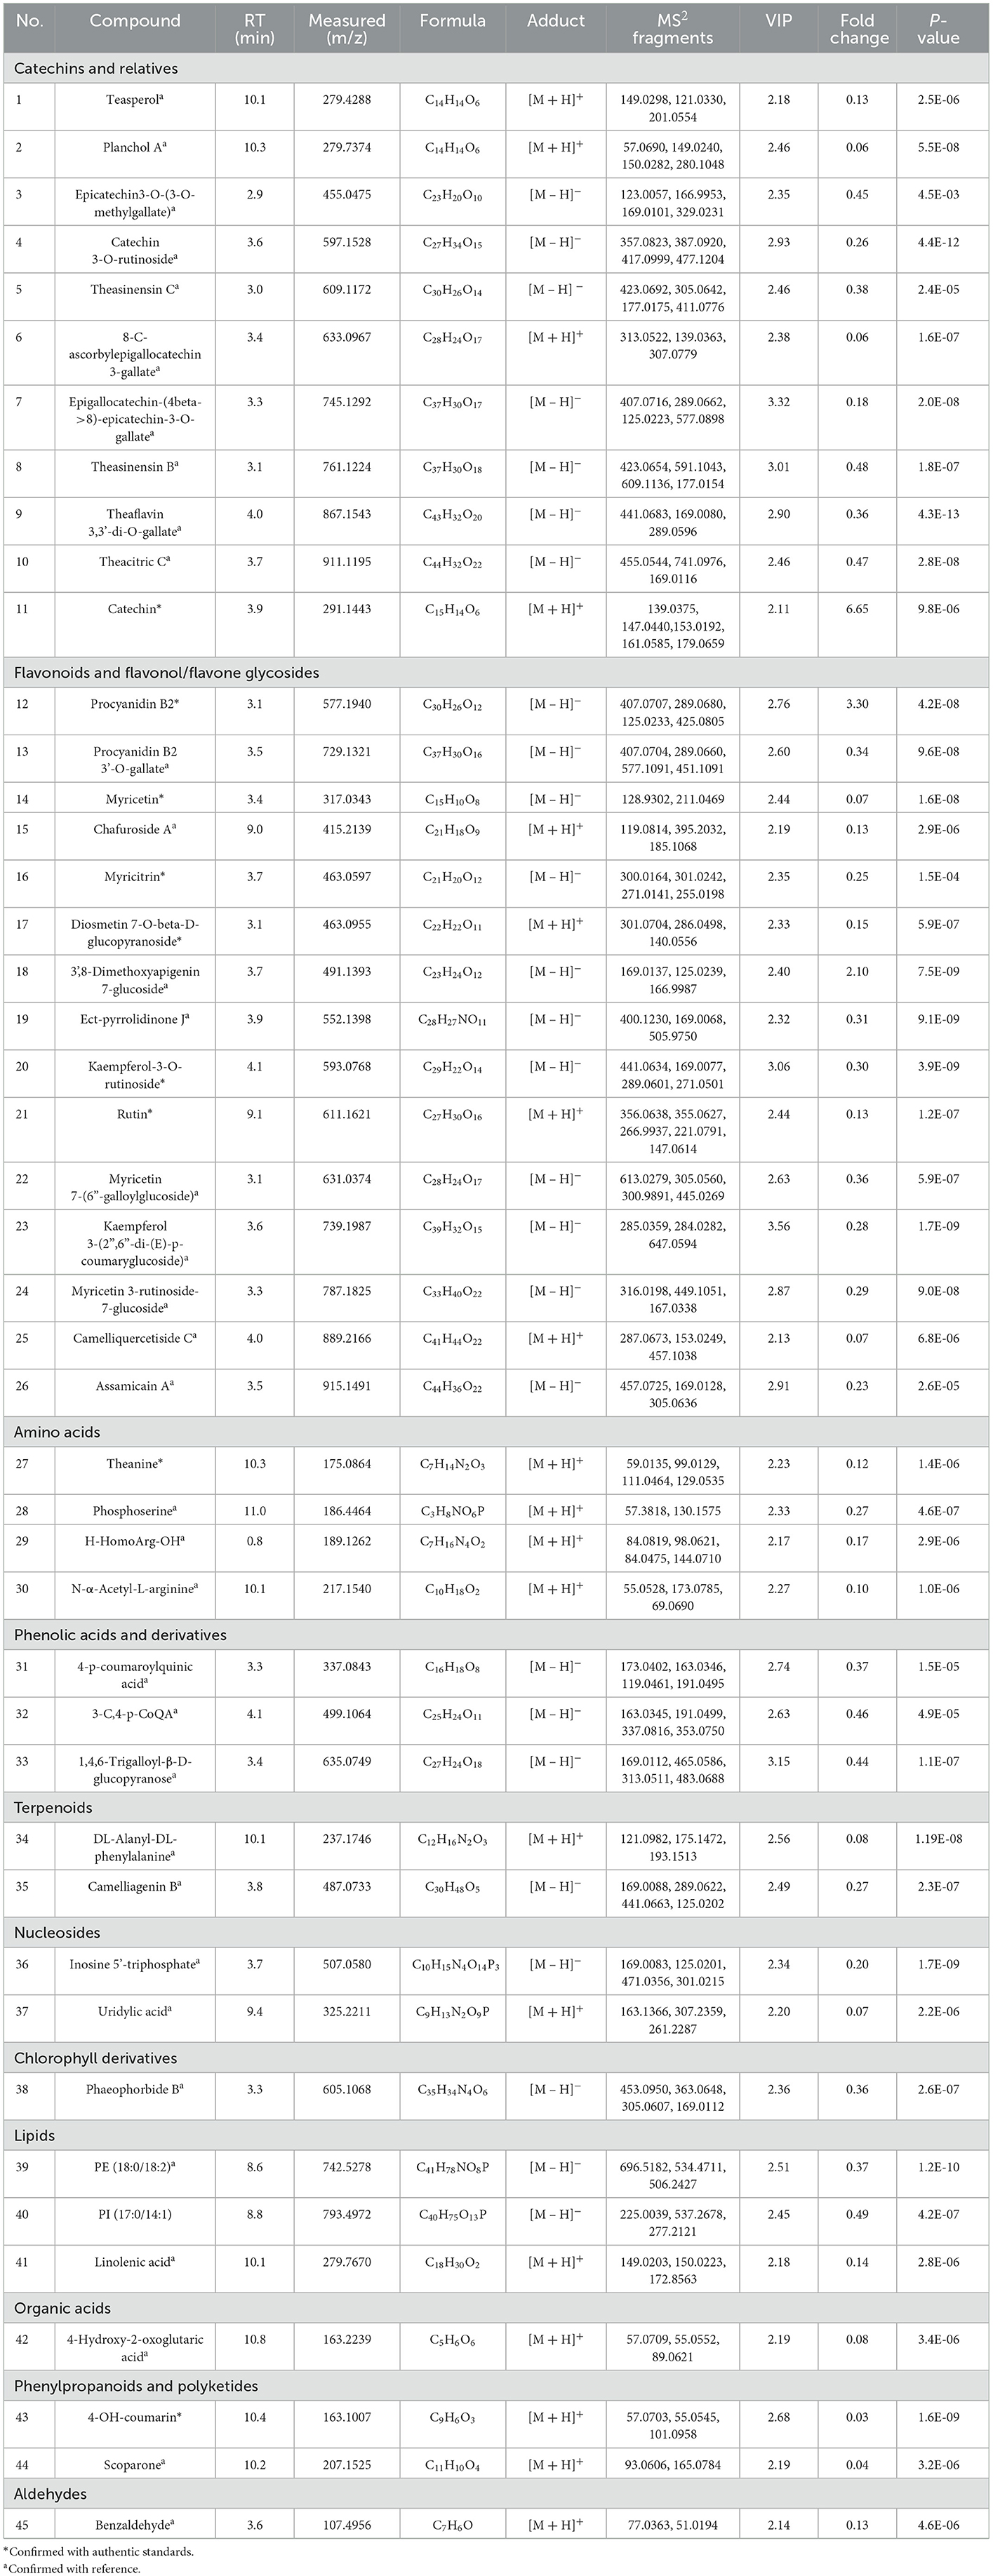
Table 3. List of 45 differential metabolites in early and late spring green tea.
3.4. Integrated lipidomics and metabolomics for green tea samples analysis
In order to determine whether the identified characteristic compounds are representative to distinguish harvest periods of green teas, three reconstructed OPLS-DA models were generated based on the 26 differential lipids (Figure 5A), 19 differential markers in positive ion mode (Figure 5B) and 26 differential markers in negative ion mode (Figure 5C), respectively. The values of R2Xcum, R2Ycum, and in the reconstructed OPLS-DA models were listed in Table 1. Compared to the original models, the reconstructed models have higher R2Xcum values, which mean the removal of redundant information. The values of the reconstructed OPLS-DA models were close to that of the original models, demonstrating the usefulness of these screened differential components. Compared with the differential lipids or metabolites alone based model, the integrated model has better differentiation for the two groups of samples (Figure 5D) with R2Xcum 0.590, R2Ycum 0.961, and 0.893. Permutation tests further indicated that these OPLS-DA models were reliable (Figure 6).
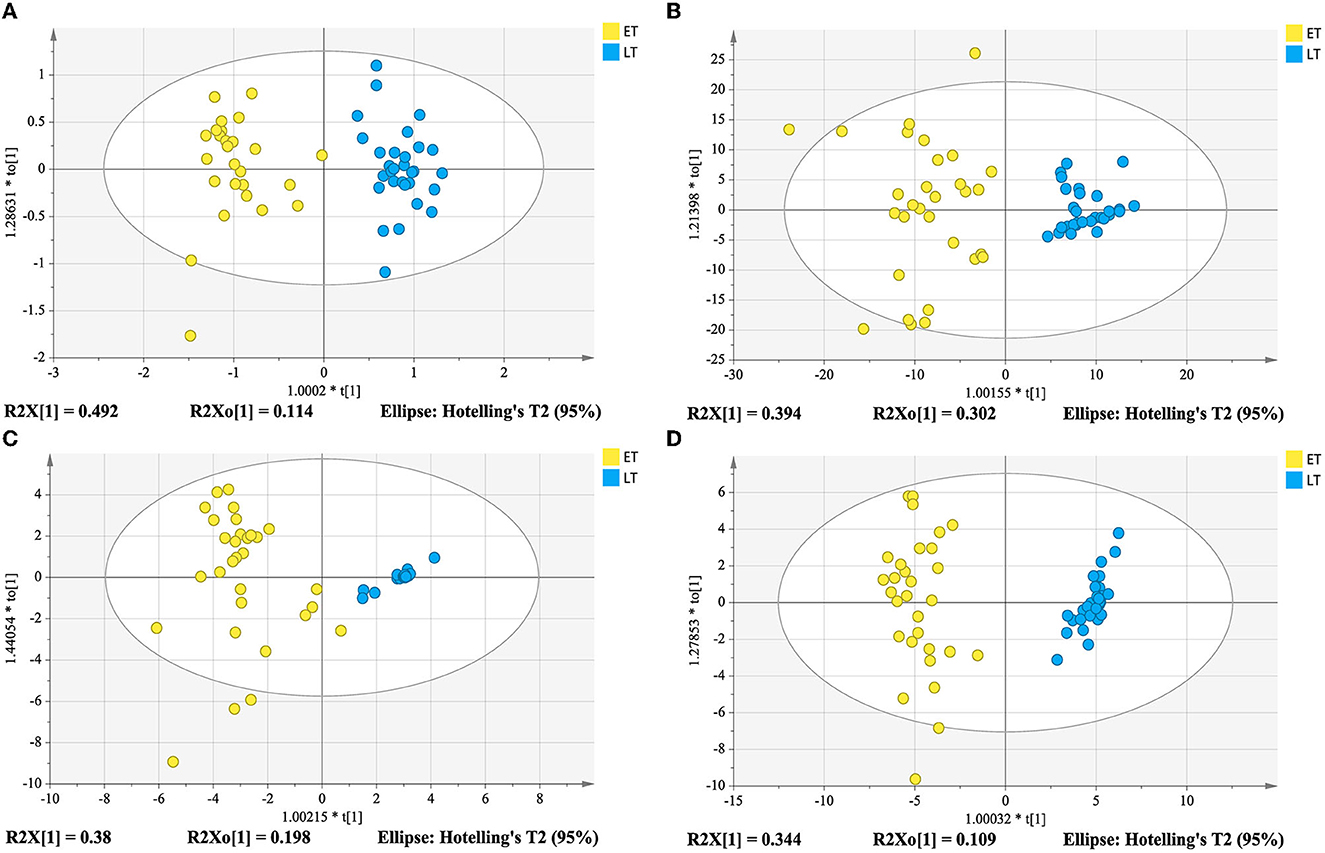
Figure 5. Reconstructed OPLS-DA models based on differential compounds from lipidomics analysis (A), and metabolomics analysis in positive ion mode (B) and in negative ion mode (C), and integration of lipidomics and metabolomics analysis (D).
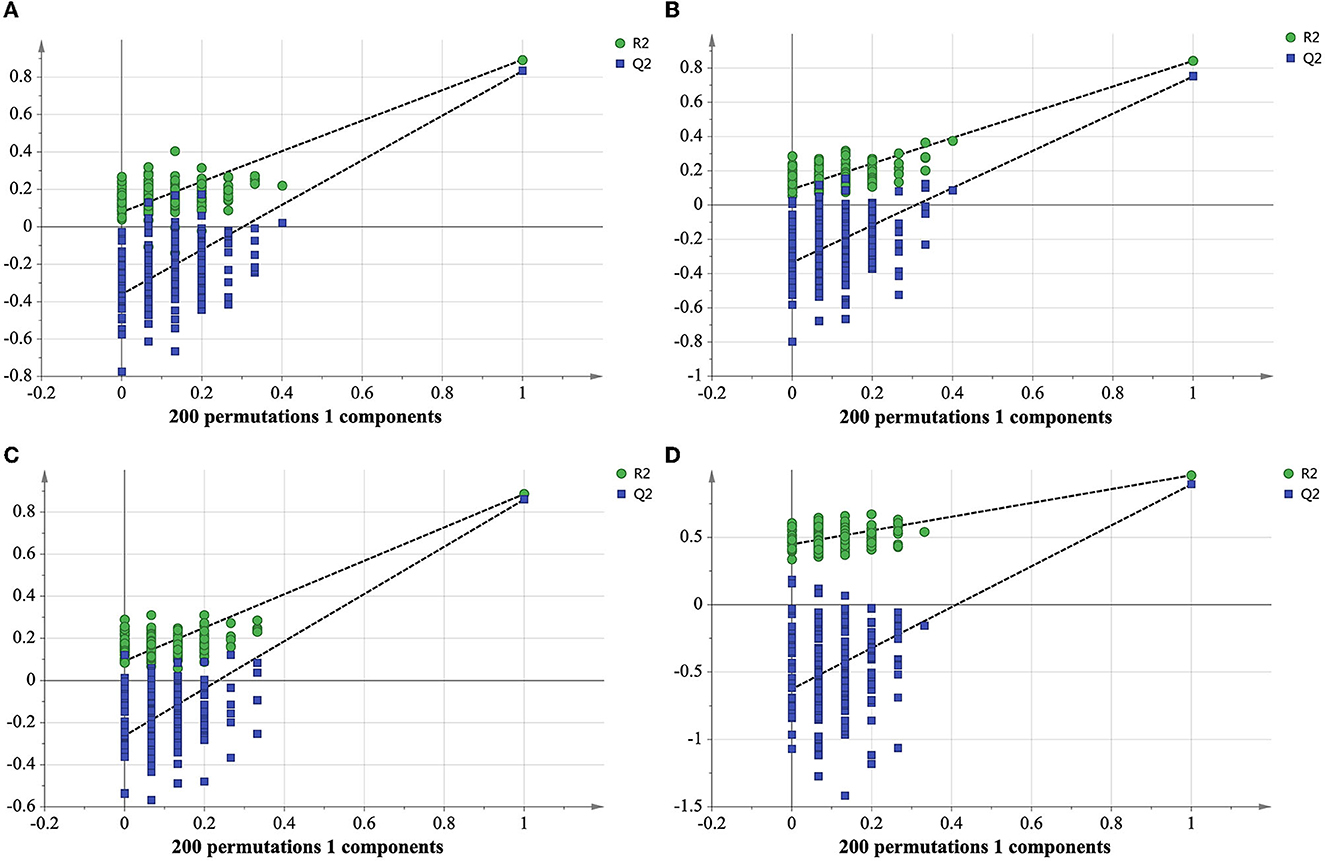
Figure 6. Cross-validation plot of reconstructed OPLS-DA models with 200 permutation tests of differential lipids (A), differential metabolites in positive ion mode (B), differential metabolites in negative ion mode (C), integrated differential lipids and metabolites (D).
External validation was performed using 20% of the total samples as a testing set. The correct classification rates of the three reconstructed models for the two groups of tea samples were 100% (Table 1). The corresponding Ypred values were listed in Table 4. As shown in Table 4, the classification of M2 is ambiguous in the reconstructed OPLS-DA model based on differential lipids, while larger YPred (May) values (Table 4) were obtained by the integrated model, indicating the improvement of the robustness of the model. The above results imply that the selected differential lipids and metabolites are very reliable. What's more, the integration of differential compounds is effective for the discrimination of green tea harvested at different times in spring.
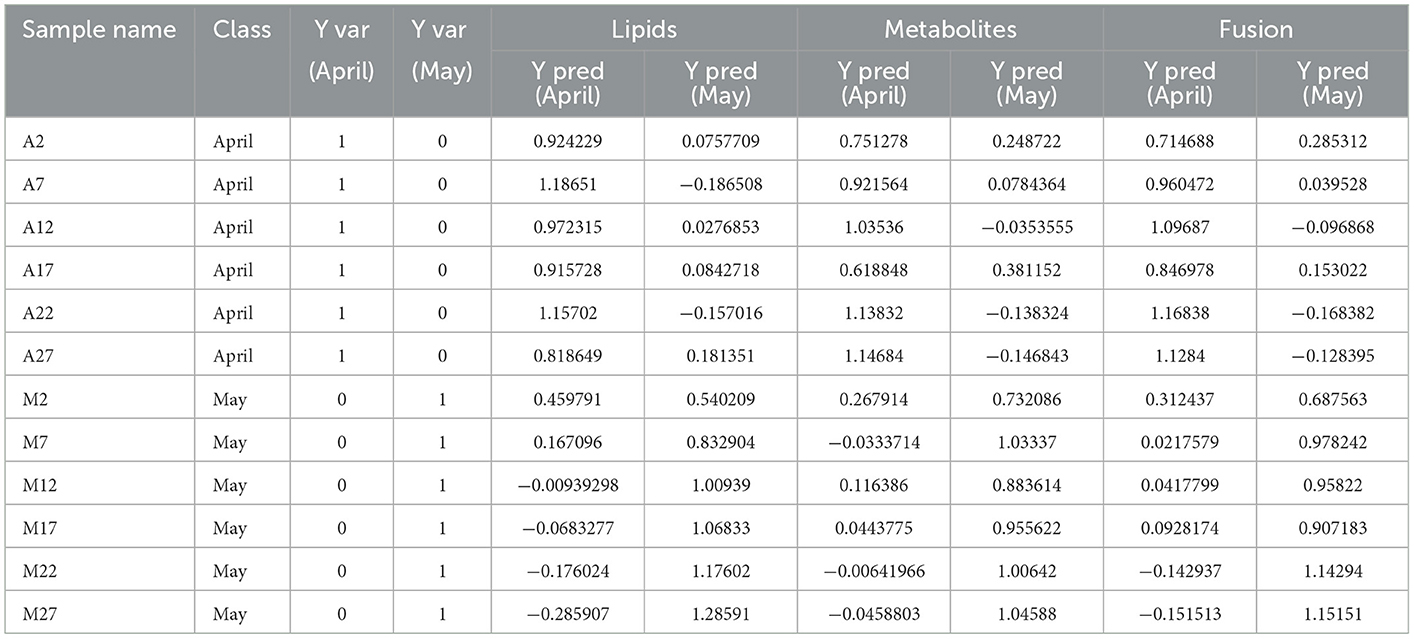
Table 4. OPLS-DA classification result list based on differential lipids, metabolites and fusion of the two.
3.5. Changes of differential lipids in green tea with harvest time
The variation of differential lipids with harvest periods was visualized by using a heatmap (Figure 7A). Each row represents a differential lipid, and each column represents a tea sample. The color grading from green to red indicates the relative intensity of differential lipids changes from low to high levels. The tea samples were divided into two groups correspondingly except for two samples (Figure 7A-a). In ET samples, the concentrations of most glycerophospholipids and several acylglycerolipids were higher, while glycoglycerolipids and several acylglycerolipids, sphingolipids, chlorophylls and derivatives are richer in LT. These characteristic components were divided into two groups according to the content change trend (Group I and II). Group I compounds mainly making up of SQDG (16:0/18:2), DGDG (16:0/18:2), SQDG (16:0/18:1), DGDG (16:0/18:1), SQDG (18:0/18:3), SQDG (18:1/18:3), PI (18:0/20:4), Hydroxypheophytin a, TG (15:3/16:5/20:6), DG (22:1/18:2), Cer (20:1/24:2(3O)), and PC (16:0/18:1) that were found have a high level in late spring teas, while group II including DG (16:1/18:2), PI (16:0/18:3), PE (22:6/20:3), PC (16:0/18:2), PC (18:3/18:3), PC (18:2/18:3), PC (18:1/18:2), DG (18:3/20:5), PG (18:0/20:4), SQDG (13:1/20:3), PG (12:0/18:4), PC (16:0/18:2), and PC (18:2/18:2), which were expressed higher content in early spring teas.
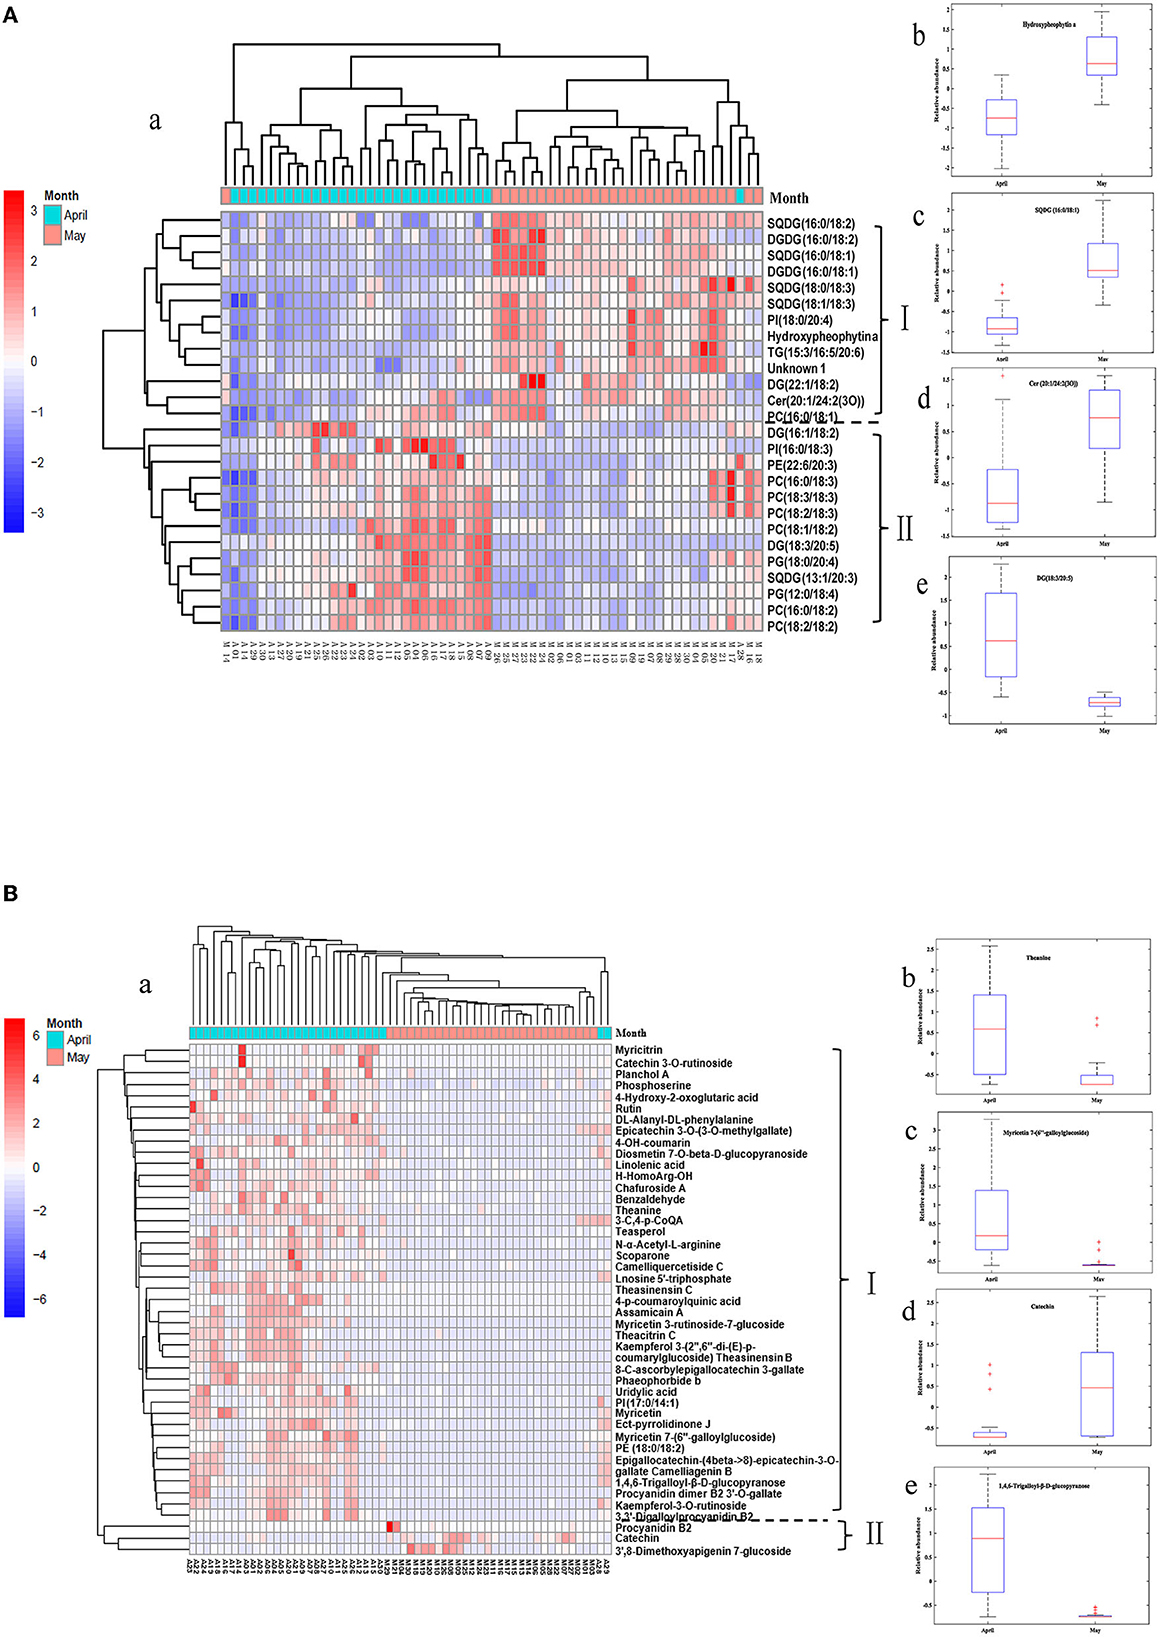
Figure 7. HCA heatmap of differential lipids (A) and differential metabolites (B) between ET and LT samples.
The concentration of Hydroxypheophytin (HydPhe) a exhibited a much higher level in LT (Figure 7A-b), which might be due to that chlorophyll is unstable in high temperature conditions. A relatively low temperature environment was more conducive to chlorophyll preserving and greenness retaining (Yu et al., 2019), while the high temperatures of picking tea in late spring periods may result in a degradation reaction of chlorophyll and further lead to the formation of more HydPhe a (Wei et al., 2011). Of note, chlorophylls generally exhibited bright green color, while the HydPhe displayed an undesirable dark and olive-brown color, resulting in LT color quality inferior to ET in view of the sensory quality.
SQDG is one of the predominant membrane lipids in thylakoids that existed on the photosynthetic membrane of higher plants (Chang et al., 2014), which is the only lipid on the photosynthetic membrane that is negatively charged under physiological conditions (Benning, 1998). In this study, 4 species of SQDGs exhibited a higher level in LT samples (Figure 7A-c). The increase of SQDGs is probably associated with the increase of photosynthesis in May because of more sunshine and higher temperatures, which is in accordance with the previous study that reported high temperature action caused an SQDG accumulation in wheat leaves (Taran et al., 2000).
Glycerophospholipids, as major components of the plasma membrane, exhibited a higher content in ET. A previous study showed that most of PCs and PEs performed negatively correlated with the temperature and sunshine exposure (Li et al., 2015). The lower contents of glycerophospholipids (PCs, PEs, PIs) in LT could be attributed to lipids degradation caused by the high-temperature action and long-sunshine exposure. In addition, other extraplastidial membrane lipids also performed significant differences between the two groups of tea samples. Ceramide [Cer 20:1/24:2(3O)], a major plant sphingolipid, showed a lower level in ET samples in Figure 7A-d. Acylglycerolipids included TGs and DGs were primarily efficient storage form of energy (Hu et al., 2008). Among them, DG (16:1/18:2) and DG (18:3/20:5) in group II exhibited a higher content in ET compared to that in LT, TG (15:3/16:5/20:6) and DG (22:1/18:2) showed opposite variation trend (Figure 7A–e).
3.6. Changes of differential metabolites in green tea with harvest time
The tea samples were divided into two categories clearly in the heatmap (Figure 7B-a) based on differential metabolites. As for the identified 45 metabolites, 42 of them exhibited higher contents in ET; only 3 metabolites have higher levels in LT. Free amino acids are closely related to the aroma and taste of tea and existed positively correlated with the quality of tea (Lee et al., 2013). Theanine was confirmed as the most abundant free amino acid in tea (Deng and Ashihara, 2015). In Figure 7B-b, higher levels of theanine and uridylic acid were contained in ET. This result corresponded to the report of Liu et al. (2016), in which it reported that within the relatively short duration of the spring tea season, the levels of theanine showed obviously decreased during late spring harvest periods.
Flavonoids and flavonol/flavone glycosides were widespread secondary metabolites in plants with many significant biological functions. These compounds mainly existed in tea based on glycoside forms of kaempferol, myricetin and quercetin accounting for 2–3% (Lee et al., 2008). It was reported that flavonoids and their glucosides confer extremely low taste of mouth-dry and astringency (Scharbert et al., 2004; Scharbert and Hofmann, 2005). In the current study, the contents of flavonoids and flavonol/flavone glycosides were notably changed with respect to the harvest period of tea in the spring season. The contents of several flavone glycosides, such as myricetin 3-rutinoside-7-glucoside, myricetin 7-(6″-galloylglucoside), kaempferol-3-O-rutinoside, kaempferol 3-(2″, 6″-di-(E)-p-coumaryglucoside) in ET samples were higher than those in LT samples (Figure 7B-c). In addition, myricetin, myricitrin, rutin, and other flavonoids in early spring tea samples were higher than those in late spring tea samples. However, 3',8-dimethoxyapigenin 7-glucoside and procyanidin B2 present significant increase in LT, which were believed to be the contributor of the astringent taste of tea (Dai et al., 2015). A possible reason is that higher temperatures and sun exposure in the late spring season enhanced the activity of some enzymes and the expression of structural genes encoding of flavonoids, and therefore result in the contents increase of some flavonoids (Sharma et al., 2010; Cheynier et al., 2013). In a word, flavonoids and flavonol/flavone glycosides exhibited diversity and concentration variations in green tea with respect to different harvesting times. The results were in consistent with that reported in the reference (Zeng et al., 2020).
Catechins are the main components in green tea that account for 60–80% of all polyphenols and contribute to the bitter and astringency taste of tea. In this study, catechin exhibited a higher level in LT (Figure 7B-d), this result was consistent with the findings among the teas from different periods of spring (Liu et al., 2016). Phenolic acids and derivatives are a kind of aromatic compounds containing carboxyl and hydroxyl groups that play an important role in tea taste. Yang et al. (2018) found that the content of trigalloyl-glucose has a strong positive correlation with the grade of white tea. In the present study, 1,4,6-trigalloyl-β-D-glucopyranose was showed a higher level in ET compared to that in LT, shown in Figure 7B-e, which was in accordance with the previous reports (Tan et al., 2017). It was reported that the white tea harvest in early spring contained more levels of trigalloyl-glucose than that harvest in the late spring season.
4. Conclusions
In this study, UPLC-Triple-TOF/MS-based non-targeted lipidomics and metabolomics methods were used to explore the difference of lipids and metabolites between ET and LT. With the aid of chemometric tools, characteristic compounds between the two groups of tea samples were revealed, and the results demonstrated that the differential components can distinguish ET and LT. A total of 70 characteristic components including 25 lipids and 45 secondary metabolites were identified. The correct classification rates of the reconstructed model based on the combination of differential lipids and metabolites for the two groups of tea samples was 100%. These results indicated that lipidomics and metabolomics coupled with chemometrics is a useful strategy to reveal the differences between ET and LT, and has the potential to be used for the quality evaluation of tea.
Data availability statement
The original contributions presented in the study are included in the article/supplementary material, further inquiries can be directed to the corresponding authors.
Author contributions
H-NC: conceptualization, investigation, software, visualization, and writing—original draft. H-WG: funding acquisition, resources, supervision, software, validation, and review and editing. Z-QL: data curation and formal analysis. WS: supervision and writing—review and editing. BD, ZL, YC, and WL: writing—review and editing. X-LY: funding acquisition, methodology, project administration, and writing—review and editing. HF: conceptualization, supervision, funding acquisition, and validation. All authors contributed to the article and approved the submitted version.
Funding
The authors would like to acknowledge the financial supports from the National Natural Science Foundation of China (Grant Nos. 32272409, 32122068, and 32001790).
Conflict of interest
The authors declare that the research was conducted in the absence of any commercial or financial relationships that could be construed as a potential conflict of interest.
Publisher's note
All claims expressed in this article are solely those of the authors and do not necessarily represent those of their affiliated organizations, or those of the publisher, the editors and the reviewers. Any product that may be evaluated in this article, or claim that may be made by its manufacturer, is not guaranteed or endorsed by the publisher.
References
Benning, C. (1998). Biosynthesis and function of the sulfolipid sulfoquinovosyl diacylglycerol. Annu. Rev. Plant Biol. 49, 53–75.
Chang, Y., Zhang, L., Lu, X., Zhao, C., Zhu, Z., Wang, F., et al. (2014). A simultaneous extraction method for metabolome and lipidome and its application in cry1Ac and sck-transgenic rice leaf treated with insecticide based on LC-MS analysis. Metabolomics. 10, 1197–1209. doi: 10.1007/s11306-014-0658-6
Chen, J.-N., Huang, X.-H., Zheng, J., Sun, Y.-H., Dong, X.-P., Zhou, D.-Y., et al. (2021). Comprehensive metabolomic and lipidomic profiling of the seasonal variation of blue mussels (Mytilus edulis L.): free amino acids, 5′-nucleotides, and lipids. LWT Food Sci. Technol. 149, 111835. doi: 10.1016/j.lwt.2021.111835
Cheng, L., Yang, Q., Chen, Z., Zhang, J., Chen, Q., Wang, Y., et al. (2020). Distinct changes of metabolic profile and sensory quality during qingzhuan tea processing revealed by LC-MS-based metabolomics. J. Agr. Food Chem. 68, 4955–4965. doi: 10.1021/acs.jafc.0c00581
Cheynier, V., Comte, G., Davies, K. M., Lattanzio, V., and Martens, S. (2013). Plant phenolics: recent advances on their biosynthesis, genetics, and ecophysiology. Plant Physiol. Biochem. 72, 1–20. doi: 10.1016/j.plaphy.2013.05.009
Dai, W., Qi, D., Yang, T., Lv, H., Guo, L., Zhang, Y., et al. (2015). Nontargeted analysis using ultraperformance liquid chromatography-quadrupole time-of-flight mass spectrometry uncovers the effects of harvest season on the metabolites and taste quality of tea (Camellia sinensis L.). J. Agr. Food Chem. 63, 9869–9878. doi: 10.1021/acs.jafc.5b03967
Deng, W. W., and Ashihara, H. (2015). Occurrence and de novo biosynthesis of caffeine and theanine in seedlings of tea (C. sinensis). Nat. Prod. Commun. 10, 1934578X1501000502. doi: 10.1177/1934578X1501000502
Fan, F. Y., Huang, C. S., Tong, Y. L., Guo, H. W., Zhou, S. J., Ye, J. H., et al. (2021). Widely targeted metabolomics analysis of white peony teas with different storage time and association with sensory attributes. Food Chem. 362, 130257. doi: 10.1016/j.foodchem.2021.130257
Ho, C.-T., Zheng, X., and Li, S. (2015). Tea aroma formation. Food Sci. Hum. Well 4, 9–27. doi: 10.1016/j.fshw.2015.04.001
Hu, Q., Sommerfeld, M., Jarvis, E., Ghirardi, M., Posewitz, M., Seibert, M., et al. (2008). Microalgal triacylglycerols as feedstocks for biofuel production: perspectives and advances. Plant J. 54, 621–639. doi: 10.1111/j.1365-313X.2008.03492.x
Jia, W., Liu, Y., and Shi, L. (2021). Integrated metabolomics and lipidomics profiling reveals beneficial changes in sensory quality of brown fermented goat milk. Food Chem. 364, 130378. doi: 10.1016/j.foodchem.2021.130378
Jiang, Z., Han, Z., Wen, M., Ho, C.-T., Wu, Y., Wang, Y., et al. (2022). Comprehensive comparison on the chemical metabolites and taste evaluation of tea after roasting using untargeted and pseudotargeted metabolomics. Food Sci. Hum. Well 11, 606–617. doi: 10.1016/j.fshw.2021.12.017
Koshiishi, C., Crozier, A., and Ashihara, H. (2001). Profiles of purine and pyrimidine nucleotides in fresh and manufactured tea leaves. J. Agr. Food Chem. 49, 4378–4382. doi: 10.1021/jf0104679
Lee, L. S., Choi, J. H., Son, N., Kim, S. H., Park, J. D., Jang, D. J., et al. (2013). Metabolomic analysis of the effect of shade treatment on the nutritional and sensory qualities of green tea. J. Agr. Food Chem. 61, 332–338. doi: 10.1021/jf304161y
Lee, V. S., Dou, J., Chen, R. J., Lin, R. S., Lee, M. R., and Tzen, J. T. (2008). Massive accumulation of gallic acid and unique occurrence of myricetin, quercetin, and kaempferol in preparing old Oolong tea. J. Agr. Food Chem. 56, 7950–7956. doi: 10.1021/jf801688b
Li, J., Hua, J., Yuan, H., Deng, Y., Zhou, Q., Yang, Y., et al. (2021a). Investigation on green tea lipids and their metabolic variations during manufacturing by nontargeted lipidomics. Food Chem. 339, 128114. doi: 10.1016/j.foodchem.2020.128114
Li, J., Hua, J., Zhou, Q., Dong, C., Wang, J., Deng, Y., et al. (2017). Comprehensive lipidome-wide profiling reveals dynamic changes of tea lipids during manufacturing process of black tea. J. Agric. Food Chem. 65, 10131–10140. doi: 10.1021/acs.jafc.7b03875
Li, L., Lu, X., Zhao, J., Zhang, J., Zhao, Y., Zhao, C., et al. (2015). Lipidome and metabolome analysis of fresh tobacco leaves in different geographical regions using liquid chromatography-mass spectrometry. Anal. Bioanal. Chem. 407, 5009–5020. doi: 10.1007/s00216-015-8522-8
Li, M., Pan, T., and Chen, Q. (2021b). Estimation of tea quality grade using statistical identification of key variables. Food Control 119, 107485. doi: 10.1016/j.foodcont.2020.107485
Liu, J., Zhang, Q., Liu, M., Ma, L., Shi, Y., and Ruan, J. (2016). Metabolomic analyses reveal distinct change of metabolites and quality of green tea during the short duration of a single spring season. J. Food Sci. Technol. 64, 3302–3309. doi: 10.1021/acs.jafc.6b00404
Liu, M., Tian, H. L., Wu, J. H., Cang, R. R., Wang, R. X., Qi, X. H., et al. (2015). Relationship between gene expression and the accumulation of catechin during spring and autumn in tea plants (C. sinensis L.). Horticult. Res. 2, 15011. doi: 10.1038/hortres.2015.11
Liu, X., and Xu, G. (2018). Recent advances in using mass spectrometry for mitochondrial metabolomics and lipidomics-a review. Anal. Chim. Acta 1037, 3–12. doi: 10.1016/j.aca.2017.11.080
Ma, B., Wang, J., Zhou, B., Wang, Z., Huang, Y., Ma, C., et al. (2022). Impact of harvest season on bioactive compounds, amino acids and in vitro antioxidant capacity of white tea through multivariate statistical analysis. LWT Food Sci. Technol. 164, 113655. doi: 10.1016/j.lwt.2022.113655
Mahadevan, S., Shah, S. L., Marrie, T. J., and Slupsky, C. M. (2008). Analysis of metabolomic data using support vector machines. Anal. Chem. 80, 7562–7570. doi: 10.1021/ac800954c
Peng, T. Q., Yin, X. L., Gu, H. W., Sun, W., Ding, B., and Hu, X. C. (2021). HPLC-DAD fingerprints combined with chemometric techniques for the authentication of plucking seasons of Laoshan green tea. Food Chem. 347, 128959. doi: 10.1016/j.foodchem.2020.128959
Ratnani, S., and Malik, S. (2022). Therapeutic properties of green tea: a review. J. Multidiscip. Appl. Nat. Sci. 2, 90–102. doi: 10.47352/jmans.2774-3047.117
Scharbert, S., and Hofmann, T. (2005). Molecular definition of black tea taste by means of quantitative studies, taste reconstitution, and omission experiments. J. Agr. Food Chem. 53, 5377–5384. doi: 10.1021/jf050294d
Scharbert, S., Holzmann, N., and Hofmann, T. (2004). Identification of the astringent taste compounds in Black Tea infusions by combining instrumental analysis and human bioresponse. J. Agr. Food Chem. 52, 3498–3508. doi: 10.1021/jf049802u
Sharma, V., Joshi, R., and Gulati, A. (2010). Seasonal clonal variations and effects of stresses on quality chemicals and prephenate dehydratase enzyme activity in tea (C. sinensis). Eur. Food Res. Technol. 232, 307–317. doi: 10.1007/s00217-010-1379-3
Szeto, S. S., Reinke, S. N., Sykes, B. D., and Lemire, B. D. (2010). Mutations in the Saccharomyces cerevisiae succinate dehydrogenase result in distinct metabolic phenotypes revealed through1H NMR-based metabolic footprinting. J. Proteome Res. 9, 6729–6739. doi: 10.1021/pr100880y
Tan, J., Dai, W., Lu, M., Lv, H., Guo, L., Zhang, Y., et al. (2016). Study of the dynamic changes in the non-volatile chemical constituents of black tea during fermentation processing by a non-targeted metabolomics approach. Food Res. Int. 79, 106–113. doi: 10.1016/j.foodres.2015.11.018
Tan, J., Engelhardt, U. H., Lin, Z., Kaiser, N., and Maiwald, B. (2017). Flavonoids, phenolic acids, alkaloids and theanine in different types of authentic Chinese white tea samples. J. Food Compos. Anal. 57, 8–15. doi: 10.1016/j.jfca.2016.12.011
Taran, N., Okanenko, A., and Musienko, N. (2000). Sulpholipid reflects plant resistance to stress-factor action. Biochem. Soc. Trans. 28, 922–924. doi: 10.1042/bst0280922
Wang, H., Cao, X., Yuan, Z., and Guo, G. (2021). Untargeted metabolomics coupled with chemometrics approach for Xinyang Maojian green tea with cultivar, elevation and processing variations. Food Chem. 352, 129359. doi: 10.1016/j.foodchem.2021.129359
Wei, K., Wang, L., Zhou, J., He, W., Zeng, J., Jiang, Y., et al. (2011). Catechin contents in tea (C. sinensis) as affected by cultivar and environment and their relation to chlorophyll contents. Food Chem. 125, 44–48. doi: 10.1016/j.foodchem.2010.08.029
Wenk, M. R. (2010). Lipidomics: new tools and applications. Cell 143, 888–895. doi: 10.1016/j.cell.2010.11.033
Xin, Z., Ma, S., Ren, D., Liu, W., Han, B., Zhang, Y., et al. (2018). UPLC-Orbitrap-MS/MS combined with chemometrics establishes variations in chemical components in green tea from Yunnan and Hunan origins. Food Chem. 266, 534–544. doi: 10.1016/j.foodchem.2018.06.056
Xu, W., Song, Q., Li, D., and Wan, X. (2012). Discrimination of the production season of Chinese green tea by chemical analysis in combination with supervised pattern recognition. J. Agr. Food Chem. 60, 7064–7070. doi: 10.1021/jf301340z
Yang, K., Duley, M. L., and Zhu, J. (2018). Metabolomics study reveals enhanced inhibition and metabolic dysregulation in escherichia coli induced by lactobacillus acidophilus-fermented black tea extract. J. Agr. Food Chem. 66, 1386–1393. doi: 10.1021/acs.jafc.7b04752
Yin, X.-L., Fu, W.-J., Chen, Y., Zhou, R.-F., Sun, W., Ding, B., et al. (2022). GC-MS-based untargeted metabolomics reveals the key volatile organic compounds for discriminating grades of Yichang big-leaf green tea. LWT Food Sci. Technol. 171, 114148. doi: 10.1016/j.lwt.2022.114148
Yu, X., Hu, S., He, C., Zhou, J., Qu, F., Ai, Z., et al. (2019). Chlorophyll metabolism in postharvest tea (C. sinensis L.) leaves: Variations in color values, chlorophyll derivatives, and gene expression levels under different withering treatments. J. Agr. Food Chem. 67, 10624–10636. doi: 10.1021/acs.jafc.9b03477
Yue, W., Sun, W., Rao, R. S. P., Ye, N., Yang, Z., and Chen, M. (2019). Non-targeted metabolomics reveals distinct chemical compositions among different grades of Bai Mudan white tea. Food Chem. 277, 289–297. doi: 10.1016/j.foodchem.2018.10.113
Zeng, C., Lin, H., Liu, Z., and Liu, Z. (2020). Metabolomics analysis of C. sinensis with respect to harvesting time. Food Res. Int. 128, 108814. doi: 10.1016/j.foodres.2019.108814
Keywords: multi-omics, quality evaluation, harvest time, chemometrics, green tea
Citation: Cui H-N, Gu H-W, Li Z-Q, Sun W, Ding B, Li Z, Chen Y, Long W, Yin X-L and Fu H (2023) Integration of lipidomics and metabolomics approaches for the discrimination of harvest time of green tea in spring season by using UPLC-Triple-TOF/MS coupled with chemometrics. Front. Sustain. Food Syst. 7:1119314. doi: 10.3389/fsufs.2023.1119314
Received: 08 December 2022; Accepted: 30 January 2023;
Published: 16 February 2023.
Edited by:
Xiao-Hua Zhang, Xuchang University, ChinaReviewed by:
Lujun Wang, Southwest Medical University, ChinaJinfang Nie, Guilin University of Technology, China
Ali R. Jalalvand, Kermanshah University of Medical Sciences, Iran
Copyright © 2023 Cui, Gu, Li, Sun, Ding, Li, Chen, Long, Yin and Fu. This is an open-access article distributed under the terms of the Creative Commons Attribution License (CC BY). The use, distribution or reproduction in other forums is permitted, provided the original author(s) and the copyright owner(s) are credited and that the original publication in this journal is cited, in accordance with accepted academic practice. No use, distribution or reproduction is permitted which does not comply with these terms.
*Correspondence: Xiao-Li Yin,  yinxiaoli@yangtzeu.edu.cn; Haiyan Fu, fuhaiyan@mail.scuec.edu.cn