Development of a novel nutritional assessment model based on strontium and other compositional factors in apples across seven regions in China
 Tiannuo Hong1†
  Zhenyu Zhao2† Wenbo Bian3,4 Wenqi Zhu5 Ziqi Li1 Guohui Shen1 Yanting Gu1
  Lu Chen1* Yanzhi Guo6*
- 1Institute of Food and Nutrition Development, Ministry of Agriculture and Rural Affairs, Beijing, China
- 2LanZhou Research Institute of Industry, Lanzhou, China
- 3Zibo Agricultural Science Research Institute, Zibo, China
- 4Zibo Institute for Digital Agriculture and Rural Research, Zibo, China
- 5Agricultural information institute of CAAS, Beijing, China
- 6Department of Research Management, Chinese Academy of Agricultural Sciences, Beijing, China
In the aftermath of the Green Revolution’s remarkable enhancement of global crop yields, particularly in rice and wheat, the focus on hunger has shifted from mere caloric sufficiency to addressing deficiencies in essential micronutrients. This transition highlights the concept of hidden hunger, where inadequate intake of vital nutrients persists despite access to an adequate number of calories. Among these crucial elements, strontium (Sr), an alkaline earth metal, plays a pivotal role in human physiology, notably in bone health and disease. Despite its significance, variations in Sr. content across different regions, combined with diverse dietary habits, result in insufficient intake levels, particularly within China. This study aims to bridge this gap by integrating traditional sensory attributes and various nutritional parameters including Sr. content for a comprehensive assessment of apples from major Chinese apple-producing regions. Through meticulous analysis and the establishment of characteristic indices, a novel apple quality evaluation system was developed that exemplifies a broader framework for evaluating agricultural products within China. This innovative approach not only enhances our understanding of agricultural product quality but also provides a practical solution to hidden hunger by ensuring informed consumer choices and improving nutritional intake. Furthermore, it serves as a valuable foundation for addressing deficiencies in essential micronutrients and advancing global efforts against hidden hunger.
1. Introduction
Since the implementation of the Green Revolution in the 1960s, there has been a substantial increase in crop yields, particularly for rice and wheat. This development has significantly enhanced the calorie supply for a considerable portion of the global population, effectively mitigating hunger (Wu et al., 2020). Consequently, the discourse on hunger has shifted from addressing acute food shortages to ensuring a nutritionally balanced diet that fulfills daily requirements of essential micronutrients and vitamins (Siddique et al., 2021). This transition reflects the current emphasis on tackling hidden hunger, which refers to inadequate intake of vital nutrients despite access to adequate calories. Due to the predominant supply of calories from grains and other staple foods, the distribution of trace elements in these foods is uneven, leading to a potential deficiency in essential trace elements (Gashu et al., 2021). While calcium, iron, zinc, selenium, and other elements have been extensively discussed, is crucial to also pay special attention to other indispensable trace elements for human health such as strontium (Pilmane et al., 2017; Giller and Zingore, 2021; Wang et al., 2023).
Strontium (Sr), belonging to the alkaline earth metals in Group 2 of the periodic table, exhibits widespread distribution across human tissues and serves as an essential trace element for physiological functions (Curtis et al., 2021). The initial attention toward Sr. arose from its distinctive mechanism of action, encompassing the stimulation of pre-osteoblast proliferation, facilitation of osteoblast differentiation, promotion of type I collagen synthesis, and facilitation of bone matrix mineralization. Furthermore, it effectively inhibits the differentiation and activation process of osteoclasts, thereby safeguarding bone health and reducing the likelihood of developing osteoporosis (Braux et al., 2011; Offermanns et al., 2016; Pilmane et al., 2017). In addition, an increasing number of studies have demonstrated the beneficial role of Sr. in the treatment of various diseases, with its potential to potentially delay or even cure these conditions. A decade ago, it was discovered that Sr. possesses the ability to reverse oxidative stress, decelerate spermatogenic cell apoptosis, and stabilize Ca2+ levels for cellular protection. Consequently, this leads to enhanced sperm concentration and preservation of male fertility (Xu et al., 2010). Furthermore, research has indicated that Sr. can impede osteoclastogenesis by obstructing RANKL-induced activation of the NF-κB pathway while also regulating bone marrow pro-inflammatory cytokine expression levels and modulating bone microecology (Zhu et al., 2016). Recently, a study has demonstrated that Sr. exhibits the potential to impede apoptosis, alleviate endoplasmic reticulum stress, and ameliorate hippocampal damage in mouse models of non-alcoholic liver cirrhosis (Wang et al., 2023). Considering the aforementioned effects of Sr., the recommended daily dietary intake is 2 mg/d. However, variations in element distribution across different geographical regions may result in uneven levels of Sr. content in food. Moreover, diverse dietary preferences among individuals residing in different regions further contribute to potential insufficiency in Sr. intake. Particularly for Chinese residents, the average daily intake stands at a mere 0.83 mg/d, significantly lower than the recommended level. In order to achieve nutritional balance, address Sr. supplementation, and alleviate hidden hunger in China, it is imperative to enhance the nutritional evaluation system, ensure the availability of high-quality food options, and facilitate informed consumer choices. However, a significant dearth of standards persists in this domain, particularly concerning certain fruit varieties such as apples.
Apples are rich in vitamins and minerals, and there is a great deal of research indicating that the nutrients of apples can help decrease blood pressure and lipids (Hanke and Flachowsky, 2017). Moreover, China stands as one of the primary apple-producing nations with a vast consumer and production market, presenting itself as a potential source for dietary supplementation of Sr. (Zhang, 2021). To enhance the quality assurance of apples, provide consumers with premium products, and ensure essential nutrients for human health, a comprehensive set of standards for apple quality evaluation has been established. However, the current standards for apples, such as GB. T10651-2008 Fresh Apples, NY. T1793-2009 Apple Grade Specifications, and NY. T2316-2013 Apple Quality Index Evaluation Specifications only make preliminary judgments on the appearance quality indicators for apples and cannot accurately reflect the quality of apples in other dimensions such as taste and nutrient content (Jia, 2022). Consequently, some apple-producing areas have developed additional standards based on the above general standards in order to measure the quality of apples in local regions more comprehensively, such as DB65. T3503-2020 Geographical Indication Products Aksu Apples. Nonetheless, these regional standards also have inherent limitations that may lead to incomplete coverage of apple quality indicators, particularly the Sr. level in apples. Therefore, it is crucial to develop a comprehensive apple nutritional health assessment system.
This study integrated traditional sensory attributes (taste, aroma, color, fruit shape), nutritional composition, physical and chemical parameters (soluble sugar, titratable acid, dietary fiber content, soluble solid concentration, vitamin C level, sugar-acid ratio, hard acid ratio), and introduced Sr. as a novel nutritional indicator to assess the nutritional value of apples from seven major apple-producing regions in China. The nutritional components of these apples were analyzed and characteristic indices were determined through a screening process to establish an apple quality evaluation methodology. Ultimately, a new framework for evaluating the nutritional quality of agricultural products was constructed using strontium-rich apples as an exemplar case study. This framework provides theoretical guidance for the evaluation and classification of agricultural products and nutritionally enhanced agricultural products in China while better addressing’ diverse needs. Additionally, this study provides a potential empirical and theoretical foundation for mitigating micronutrient deficiencies and addressing hidden hunger.
2. Materials and methods
2.1. Reagents
We purchased the following analytically pure chemicals from Biotech Bioengineering Co. Ltd. (Shanghai, China). to use as reagents for our experiments: metaphosphoric acid, trisodium phosphate, potassium dihydrogen phosphate, phosphoric acid, sodium hydroxide, zinc acetate, potassium ferricyanide, hydrochloric acid, methanol, anhydrous ethanol, 95% ethanol, acetone, potassium dichromate, trimethylolaminomethane, 2-(N-morpholine-substituted) ethanesulfonic acid, glacial acetic acid, and sulfuric. Trihydroxymethylaminomethane, 2- (N-morpholine) ethane sulfonic acid, and glacial acetic acid were purchased from Yuanye Biotechnology Co. Ltd. (Shanghai, China); chromatographically pure cetyltrimethylammonium bromide, methanol, perchloric acid, and acetonitrile were purchased from Titan Technology Co. Ltd. (Shanghai, China) and perchloric acid was procured from Sinopharm Group Chemical Reagent Co. Ltd. (Beijing, China). Fructose standards, glucose standards, sucrose standards, and malic acid standards were prepared by Solaibao Technology Co. Ltd. (Beijing, China), and heat-stable α-amylase solution and starch glucosidase solution were purchased from Huilong Changsheng Laboratory Instrument Sales Center, Nankai District (Tianjin, China), Protease solution was acquired from Taimei Technology Co. Ltd. (Changchun, China), and our strontium-standard solution was prepared by Steel Yanak Detection Technology Co. Ltd.
2.2. Plant material and sample preparation
China is a major apple-growing nation, producing a variety of apples, including red Fuji. Therefore, in this study, we chose red Fuji from seven regions as samples for the establishment of the nutritional evaluation model. All samples were randomly selected by hand and met the special standard in NY/T 1793–2009, “Apple Quality Grade Standard.” (NYT 1793-2009. Standard for grades of apples, 2009). The “Yiyuan Red” apples grown in Shandong Province were picked locally. The other six regions in this study (Aksu from Xinjiang, Luochuan from Shanxi, Yantai from Shandong, Baishui from Shanxi, Lingbao from Henan, and Jingning from Gansu) were purchased from respective local markets. Each sample collection was about 5 kg per regional variety.
All apples were randomly numbered according to their different origins, covered with plastic wrap, and refrigerated at 0–5°C before prior to our indicator determination. Any impurities attached to the epidermis were washed with distilled water and rinsed three times with deionized water. The apples were then drained, and the samples were prepared for trace element detection. We used a four-equal diagonal sampling method to detect physicochemical indicators, and the samples were then crushed, pulped and stored at −18°C.
2.3. Determination of characteristic nutritional indicators
2.3.1. Vitamin C detection
The content of Vitamin C (VC) in the samples was detected by fluorospectro photometer referring to the fluorescence method of the second method in GB 5009.86–2016 (GB 5009.86-2016. National standard for food safety—Determination of ascorbic acid in food, 2016). The specific procedure is as follows: 100 g of the sample was mixed with 100 g of a metaphosphoric-acetic acid solution (3% concentration), and the pH was adjusted to 1.2. Then, a 50 mL aliquot of the filtrate was diluted to 200 mL using an ascorbic acid standard working solution for oxidation of ascorbic acid in the sample, followed by decolorization and filtration using activated carbon. Subsequently, a portion of the resulting filtrate (20 mL) was divided into two equal parts. To one part, 5 mL of sodium acetate solution (500 g/L concentration) was added as the test solution, while to the other part, 5 mL of borate-sodium acetate solution (3% boric acid concentration) was added as the blank solution. Both solutions were then brought up to a final volume of 100 mL. Finally, after absorbing 2 mL of liquid from each sample, they were mixed with o-phenylenediamine (OPDA) solution (concentration: 200 mg/L), thoroughly shaken and allowed to react at room temperature for 35 min before measuring fluorescence intensity at excitation wavelength:338 nm and emission wavelength:420 nm. content was calculated according to the following formula:
where X1 denotes the total amount of vitamin C in the sample (mg/100 g), c denotes the mass concentration of vitamin C in the injection solution obtained from the standard curve or calculated by the regression equation (μg/mL), V denotes the volume of the specimen used for the fluorescence reaction (mL), m denotes the actual test specimen mass (g), F denotes the dilution of the specimen solution, and both 100 and 1,000 are scaling factors.
2.3.2. Soluble solid detection
A 250 g sample was weighed and pounded in a Waring blender, and the soluble solid content (SSC) in the sample was determined referring to the refractometer method in NY/T 2637-2014 (NY/T 2637-2014. Refractometric method for determination of total soluble solids in fruits and vegetables, 2014). The soluble solids were calculated using the following formula:
where X2 denotes the content of soluble solids in the sample (%), P denotes the content of soluble solids in the sample liquid (%), denotes the mass of the sample (g), and denotes the mass of distilled water added to the sample (g). The mass of distilled water is calculated as 1 g/mL at room temperature.
2.3.3. Titratable acid detection
The titratable acid (TA) is actually the total acid in an apple. To determine ts amount, we took an autopotentiometric titrato to determine the titratable acid content (TAC) referring to the automatic potentiometric titration in the third method of GB/T 12456-2021 (GB 12456-2021. National standard for Food safety-Determination of total acids in food, 2021). The soluble solids were calculated by the following formula:
where X3 denotes the content of total acid in the sample(g/kg, g/L), c denotes the concentration of the sodium hydroxide standard titrant(mol/L), denotes the volume of the sodium hydroxide standard solution consumed during titration(mL), denotes the volume of the sodium hydroxide standard solution consumed during the uniform trial(mL), k denotes scaling factor, F denotes dilution multiple, m denotes the mass of the sample (g, volume of sample fluid absorbed, mL), and 1,000 is a scaling factor.
2.3.4. Soluble sugar detection
We took the edible parts of the apples and crushed them with a grinder, sealing after sieving. The total soluble sugar (TSS) in the samples was analyzed by High Performance Liquid Chromatography, referring to GB 5009.8-2016 (GB 5009.86-2016. National standard for food safety—Determination of ascorbic acid in food, 2016). High Performance Liquid Chromatography (HPLC) is an important branch of chromatography, in which liquid is used as the mobile phase, and a high pressure infusion system is used to pump mobile phases such as single solvents with different limits or mixed solvents with different ratios, buffers and other mobile phases into a column equipped with a stationary phase. In this study, 5 g mixed sample was dissolved in 50 mL of ultrapure water. Subsequently, 5 mL each of potassium ferricyanide solution and zinc acetate solution were added slowly. The resulting mixture was then subjected to ultrasonic extraction for 30 min. The supernatant obtained from the subsequent filtration underwent double filtration through a microporous membrane with a pore size of 0.45 m, and finally, 20 L of the filtrate were used for analysis. The mobile phase consisted of acetonitrile (70%) at a flow rate of 1.0 mL/min, while the column temperature was maintained at 40°C.
The soluble solids were calculated by the following formula:
where X4 denotes the content of sugars (fructose, glucose, sucrose, maltose, and lactose) in the sample (g/100 g), denotes the concentration of sugar in the sample liquid (mg/mL), denotes the concentration of sugar in the blank control (mg/mL), V denotes the constant volume of sample liquid (mL), n denotes dilution multiple, m denotes the mass of the sample (g, mL), and both 100 and 1,000 are scaling factors.
2.3.5. Moisture detection
We referred to direct drying in the first method of GB 5009.3-2016 (GB 5009.3-2016. National Standard for Food safety-Determination of moisture in food, 2016) when measuring the sample’s moisture content (MC). The mass difference between the two times needed for this method did not exceed 2 mg, which can be considered as constant weight. The soluble solids were then calculated by the following formula:
where X5 denotes the amount of moisture in the sample (g/100 g), denotes the mass of the weighing bottle and the sample (g), denotes the mass of the weighing bottle and the sample after drying (g), denotes the mass of the weighing bottle (g), and 100 is a scaling factor.
2.3.6. Malic acid detection
We determined the content of malic acid (MA) by referring to the HPLC method in GB 5009.157-2016 (GB 5009.157-2016. National Standard for Food safety -Determination of organic acids in food, 2016). Weigh 10 g of the sample and put it into a 50 mL polypropylene centrifuge tube. Add 20 mL ultrapure water and centrifuge it at 15000 rpm for 2 min, then 5 min at 4000 rpm. Take the upper extraction solution to the volumetric bottle, and repeat the residual extraction with ultra-pure water. The extract was filtered by 0.45 μm aqueous membrane and analyzed by HPLC. The mobile phase was composed of methanol and a 0.1% phosphoric acid solution in an isometric elution ratio of 97.5:2.5 (v/v). Then the methanol phase was allowed to reach 100% with a short time gradient and equilibrated for 5 min. The mobile phase was then returned to its initial ratio and allowed to equilibrate for 5 min. The column temperature was 40°C and the detection wavelength was 210 nm. The soluble solids were calculated as:
where X6 denotes the content of malic acid in the sample (g/kg), c denotes the concentration of malic acid in the sample solution obtained from the standard curve (μg/mL), V denotes the constant volume of sample liquid (mL), m denotes the mass of the sample represented by the final sample liquid (g), and 1,000 is again a scaling factor.
2.3.7. Dietary fiber detection
The determination of dietary fiber content (DFC) was divided into total dietary fiber (TDF), insoluble dietary fiber (IDF), and soluble dietary fiber (SDF), and an enzymatic gravimetric method recommended by GB 5009.88–2014 (GB 5009.88-2014. National Standard for Food safety-determination of dietary fiber in food, 2015; Dong et al., 2017) was used to detect each of the three indicators above. Two blanks were prepared for simultaneous operation with the test solution to correct the influence of reagents on the determination. The soluble solids were then calculated using the following formulae:
where denotes the reagent blank mass (g), denotes the mean mass of blank residue of double reagent (g), denotes the protein mass in the blank control residue (g), denotes the mass of ash in the blank control residue (g), denotes the mass of the sample residue (g), denotes crucible mass and residue mass after treatment (g), denotes the mass of the crucible after treatment (g), X7 denotes the content of dietary fiber in the sample (g/100 g), denotes the mean residue mass of double sample (g), denotes the protein mass in the sample residue (g), denotes the ash mass in the sample residue (g), denotes the reagent blank mass (g), denotes the mean sampling mass of two samples (g), f denotes the correction factor for mass changes caused by drying and desaccharification during sample preparation, 100 is a scaling factor, denotes the mass of the sample before preparation (g), and denotes the mass of the sample after preparation (g).
2.3.8. Strontium detection
In order to determine the strontium content (SC) in the samples, we referred to the inductively coupled plasma emission spectrometry (ICP-OES) method in the second method of GB 5009.268-2016 (GB 5009.268-2016. National Standard for Food safety -Determination of multi-elements in food, 2016). The soluble solids were calculated by the following formula:
where X8 denotes the content of Sr. in the sample (mg/kg), denotes the mass concentration of Sr. in the sample solution (mg/L), indicates the mass concentration of Sr. in the blank sample (mg/L), V denotes the constant volume of sample digestion solution (mL), f denotes scaling factor, and m denotes the mass or volume of the sample (g).
2.4. Statistical analysis
SPSS 22.0 (IBM, Inc. Chicago, United States), SPSSAU were used for descriptive analysis of the data, as well as one-way ANOVA, gray correlation analysis. GraphPad Prism 9.0.0 was used as a data visualization tool, and Kruskal-Wallis test was used to analyze the differences in the values of nutritional indicators in samples from seven regions.
3. Results
3.1. Characteristics of the nutritional quality in samples from seven different regions
The overall design idea of this paper is shown in Figure 1B. In order to enhance the nutritional evaluation system for apples, this study initially conducted an analysis of the nutritional components present in Fuji apples sourced from seven major apple-producing regions across China (Figure 1A). These components encompassed vitamin C, soluble sugars, titratable acidity, dietary fiber, and strontium content, among others. A comparative analysis was performed as depicted in Figure 2. Detailed descriptions of specific values are provided in subsequent sections.
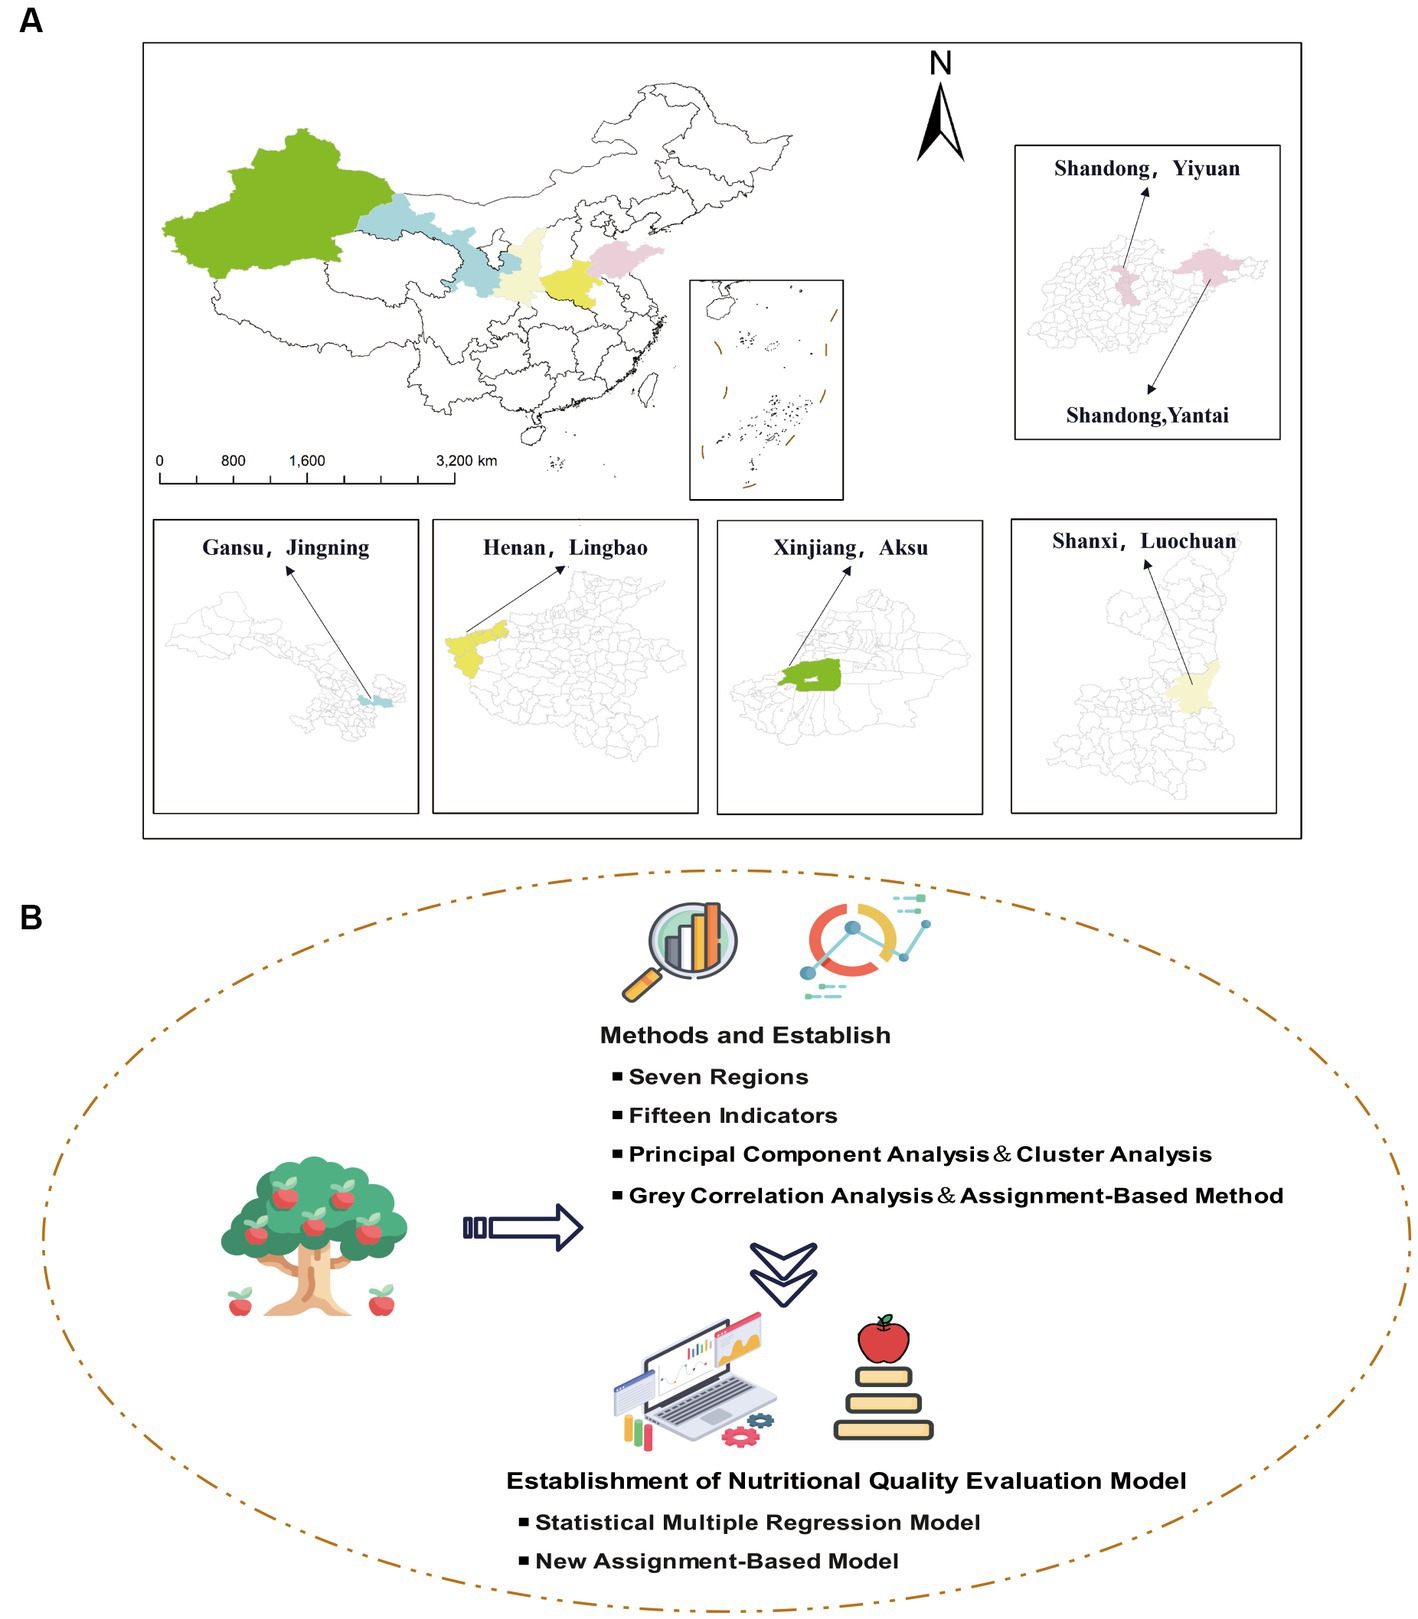
Figure 1. (A) Regional distribution of sample collection; (B) Diagram of the overall design idea of the experiment.
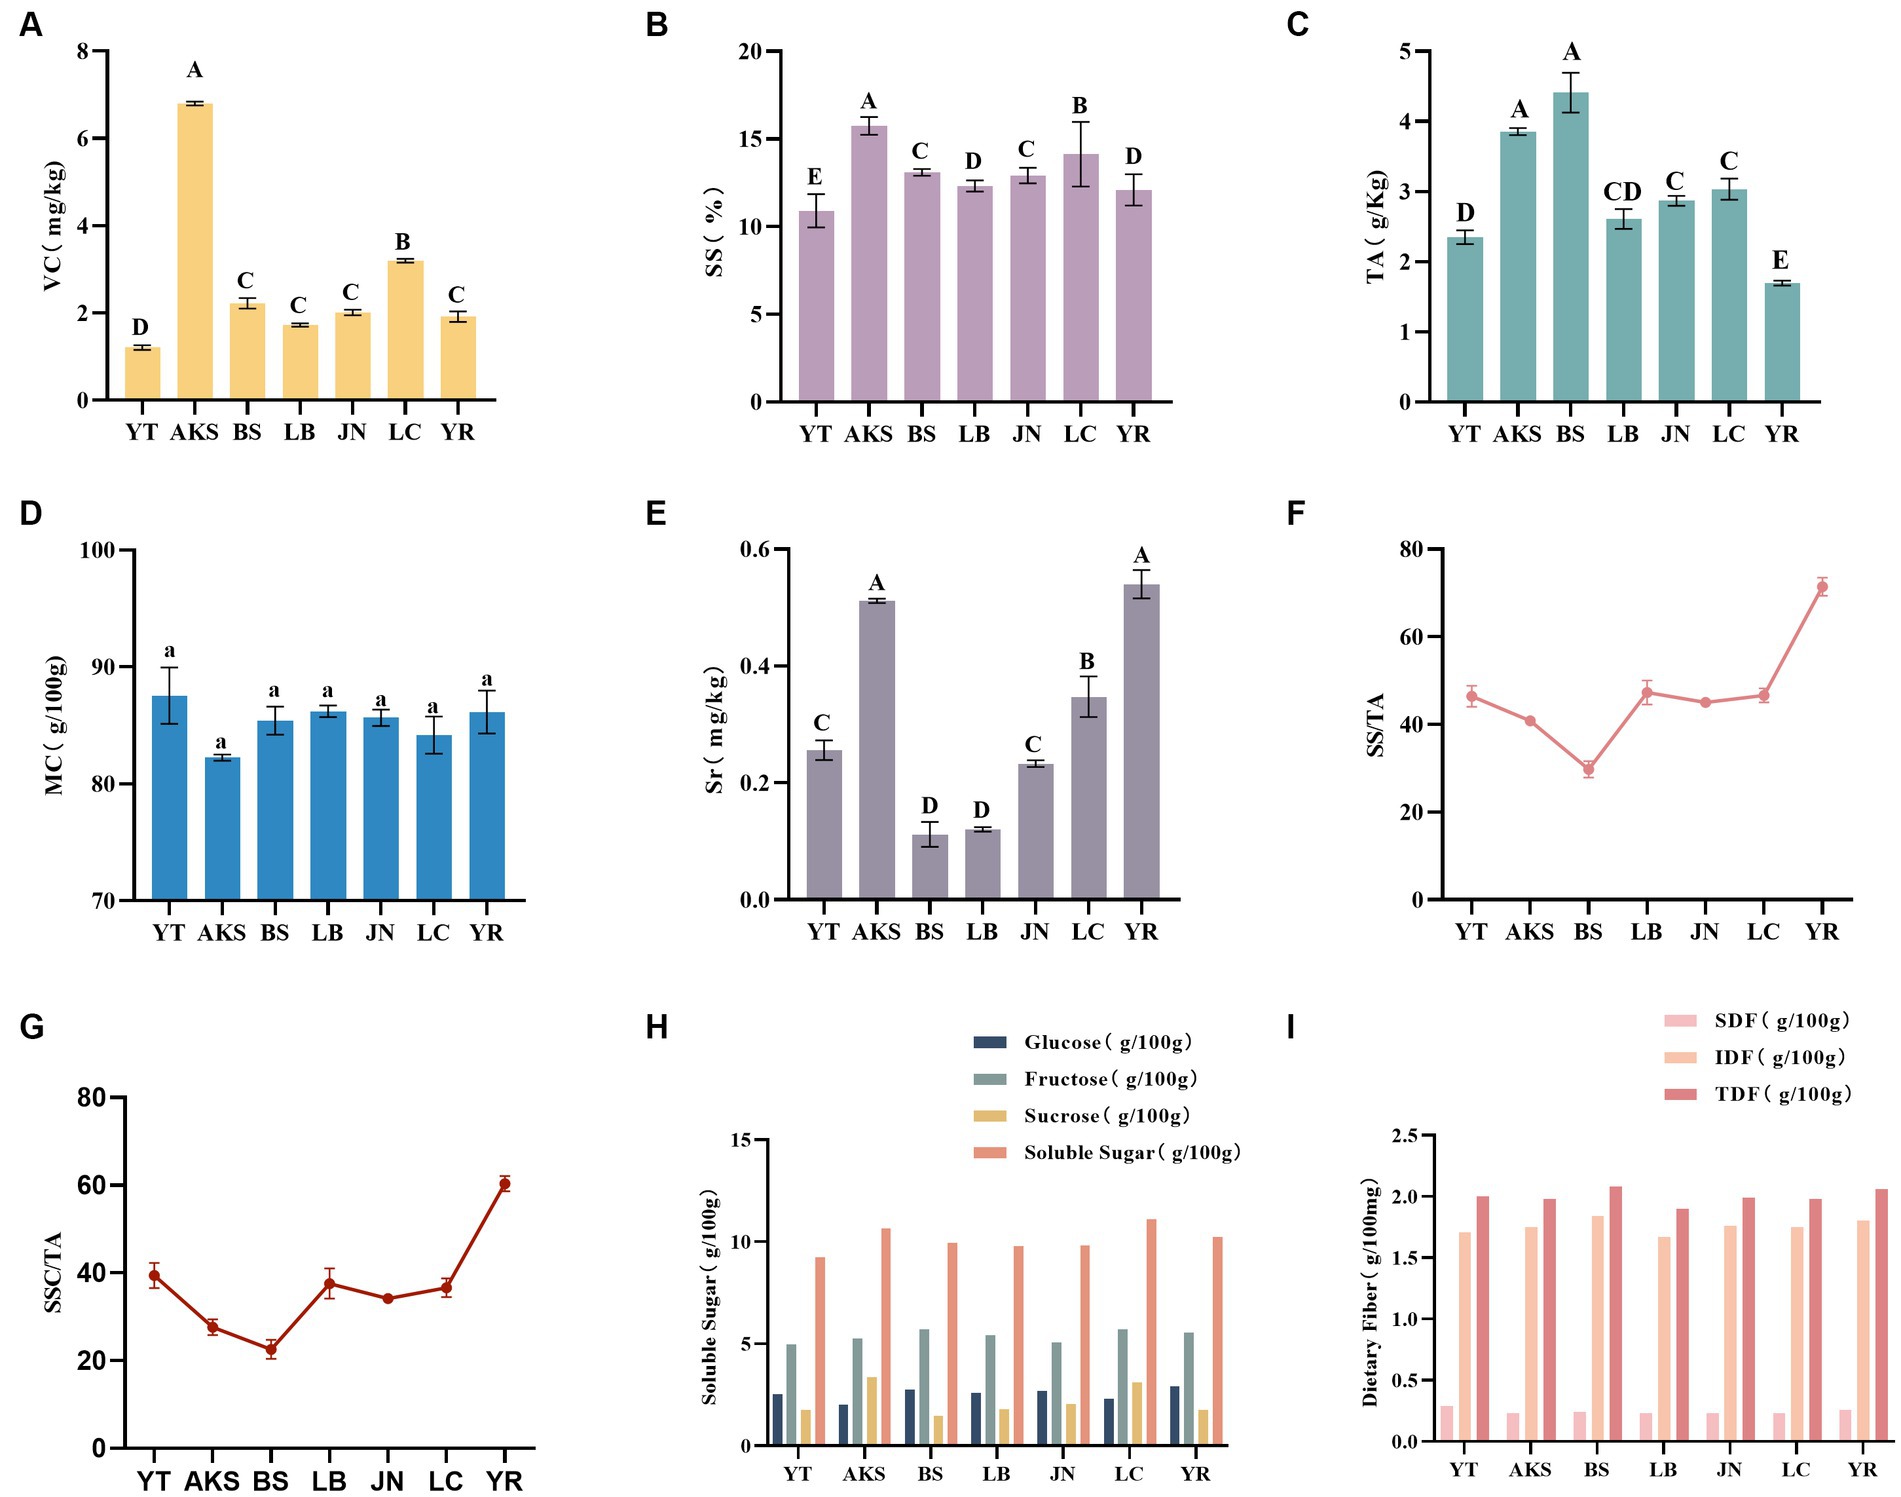
Figure 2. Comparison of nutrient contents of apple samples from seven regions. A: VC content of apples from seven regions, mg/Kg; B: SS content of apples from seven regions, %; C: TA content of apples from seven regions, g/Kg; D: MC content of apples from seven regions, g/100 g; E: Sr. content of apples from seven regions, mg/Kg; F: Solid-acid ratio of apples from seven regions; G: Sugar-acid ratio of apples from seven regions; H: Soluble sugar content (glucose, fructose, sucrose, soluble sugar) of apples from seven regions, g/100 g; I: Dietary fiber content of apples from seven regions, g/100 mg.
3.1.1. Vitamin C
The vitamin C (VC) content is a crucial parameter for assessing the nutritional quality of apples and exhibits the highest variability in coefficient of variation (CV%) among the 15 indicators. As depicted in Supplementary Table S1, Aksu apple exhibited the highest VC content (6.80 ± 0.04 mg/100 g), while Yantai apple had the lowest VC content (1.21 ± 0.06 mg/100 g). Statistically significant differences were observed in VC levels between apples from different regions, except for Jingning (2.02 ± 0.06 mg/100 g) and Yiyuan Red (1.92 ± 0.12 mg/100 g; Supplementary Table S1; Figure 2A).
3.1.2. Soluble solid
The term “soluble solids (SS)” encompasses all compounds that are capable of dissolving in water, including sugars, acids, and certain mineral components. These constituents have a positive impact on both the nutritional and sensory evaluation of apples. Analysis of the 15 indicators for the apples investigated in this study, as presented in Supplementary Table S2, revealed minimal variation in SS content. Among the different regions studied, Aksu exhibited the highest SS content (15.75 ± 0.06%), followed by Luochuan (14.14 ± 0.21%), while Yantai displayed the lowest content (10.91 ± 0.11%; Supplementary Table S2; Figure 2B).
3.1.3. Total acidity
The acid content level has a significant impact on the edibility and flavor of apples, with Malic acid (MA) being a crucial organic acid present in them. Among the 15 indicators, there was considerable variation in the coefficient of variation (CV%) for total acidity (TA), whereas MA exhibited relatively stable fluctuations (Supplementary Table S3; Figure 2C). The highest total acidity (TA) content was observed in the Baishui sample (4.41 ± 0.28 g/kg), which exhibited a significant difference compared to the other samples (p < 0.05). Conversely, the Yiyuan Red sample displayed the lowest TA content (1.70 ± 0.04 g/kg). However, no statistical differences were found between Luochuan (3.04 ± 0.15 g/kg) and Jingning (2.87 ± 0.07 g/kg), or between Lingbao (2.61 ± 0.14 g/kg) and Yantai (2.35 ± 0.10 g/kg). Among all samples, Luochuan contained the highest malic acid (MA) concentration at 4.79 ± 0.09 g /kg, which significantly differed from other samples as well (p < 0 0.05). On the contrary, Lingbao exhibited the lowest MA content at 3 0.25 ± 0.10 g /kg.
3.1.4. Soluble sugar
The soluble sugars detected in this study included glucose, sucrose, and fructose. Among these indicators, the largest fluctuation in coefficient of variation (CV%) was observed for sucrose, which was nearly as high as that of VC and Sr. (Supplementary Table S4; Figure 2D). Conversely, fructose showed the smallest fluctuation. Yiyuan Red had the highest glucose content among the seven regions (2.93 ± 0.20 g/100 g), with no significant difference compared to Baishui (2.75 ± 0.18 g/100 g) or Jingning (2.70 ± 0.10 g/100 g). Although the highest fructose concentration was found in Luochuan (5.70 ± 0.12 g/100 mg), this level was not statistically different from Baishui (5.70 ± 0.04 g/100 g), Lingbao (5.41 ± 0.24 g/100 g), or Yiyuan Red (5.54 ± 0.04 g/100 g). The lowest fructose content was found in Yantai (4.96 ± 0.09 g/100 g). For sucrose content, Aksu (3.37 ± 0.22 g/100 g) had the highest content, and it was statistically different from the other six groups. The lowest content was Baishui (1.48 ± 0.09 g/100 g). There was no statistical difference in sucrose indicators between Yantai (1.77 ± 0.07 g/100 g), Lingbao (1.78 ± 0.09 g/100 g), or Yiyuan Red (1.76 ± 0.07 g/100 g). Finally, we calculated the soluble sugar indicator as the sum of the glucose, sucrose, and fructose indicators. The highest soluble sugar indicator was found in Luochuan (11.10 ± 0.10 g/100 g), but the difference between it and Aksu (10.64 ± 0.56 g/100 g) was not statistically different from 0. Yantai (9.25 ± 0.28 g/100 g) had the lowest amount of total soluble sugars.
3.1.5. Moisture content
The MC of each sample is shown in Supplementary Table S5, and the CV% of MC fluctuated the least among the 15 indicators (Supplementary Table S5; Figure 2E). The largest MC was found in Yantai (87.56 ± 0.27 g/100 g), which was statistically different from the rest, and the smallest was found in Aksu (82.25 ± 0.03 g/100 g). The differences in MC between Lingbao (86.21 ± 0.06 g/100 g) and Yiyuan Red (86.16 ± 0.21 g/100 g), and Baishui (85.42 ± 0.13 g/100 g) and Jingning (85.67 ± 0.08 g/100 g) were not statistically different from 0. Interestingly, there was no significant difference in the MC of apples from the seven regions, but difference in the VC values, which were significantly higher in Aksu. Although there was no significant difference in the MC of the samples, Aksu was the lowest. In this regard, we hypothesized that this could be due to differences in geographic location. Xinjiang is located in northwestern China and has a temperate continental climate characterized by a large diurnal temperature difference and abundant light. The special temperature, light, and other differences in climatic conditions may lead to significant differences in VC content.
3.1.6. Dietary fiber content
The CV% values of the three indicators of DF showed small fluctuations among the 15 indicators, and SDF was the one with the largest fluctuations among the seven groups (Supplementary Table S6; Figure 2F). As described in Supplementary Table S6, Yantai had the most SDF (0.29 ± 0 g/100 g), and Aksu had the least (0.23 ± 0.01 g/100 g). However, there was no statistically significant difference between Aksu and Baishui (0.24 ± 0 g/100 g), or Lingbao (0.23 ± 0 g/100 g), Jingning (0.23 ± 0 g/100 g), and Luochuan (0.23 ± 0.01 g/100 g). The highest content of IDF was found in Baishui (1.71 ± 0.04 g/100 g), but this was not statistically different from Jingning (1.76 ± 0.04 g/100 g), Luochuan (1.75 ± 0.06 g/100 g), or Yiyuan Red (1.80 ± 0.01 g/100 g). The lowest IDF was measured in Lingbao (1.67 ± 0.08 g/100 g). Our TDF measure was derived from the sum of SDF and IDF above. As the Supplementary Table S6 shows, the highest TDF was Baishui (2.08 ± 0.06 g/100 g), although this level was not statistically different from those of Yantai (2.00 ± 0.05 g/100 g), Aksu (1.98 ± 0.04 g/100 g), Jingning (1.99 ± 0.04 g/100 g), Luochuan (1.98 ± 0.06 g/100 g), or Yiyuan Red (2.06 ± 0 g/100 g). The lowest TDF was in Lingbao (1.90 ± 0.07 g/100 g), and this level was not statistically different from that of Yantai, Aksu, Jingning, or Luochuan.
3.1.7. Solidity-acid ratio
Solidity-acid ratio, the ratio of SS to TA, is an important indicator for apples during ripening. In the growing stage, the solidity-acid ratio gradually increases, which greatly improves the flavor of an apple. Supplementary Table S7 shows that the CV% of the solidity-acid ratio, was relatively large among the 15 indicators (ranking fifth; Supplementary Table S7; Figure 2G). The highest solidity-acid ratio was found in Yiyuan Red (71.41 ± 2.07), which was statistically significantly different from all the others. The smallest such ratio was found in Baishui (29.78 ± 1.86), and it was likewise different from all the rest. There was no statistical difference between Yantai (46.45 ± 2.41), Lingbao (47.30 ± 2.7), or Luochuan (46.61 ± 1.6). In addition, there was no statistical difference between Aksu (40.86 ± 0.67) and Jingning (45.01 ± 0.94).
3.1.8. Sugar-acid ratio
In all the indicators tested, the ratio of soluble sugar to titratable acid content contributed the most to apple’s sweet and sour taste and flavor. We can see from Supplementary Table S8 that the CV% of the sugar-acid ratio fluctuated greatly. Among all the samples, Yiyuan Red (60.37 ± 1.76) ranked first and was statistically significantly different from the others. Baishui (22.58 ± 2.17) ranked last, and the difference between it and Aksu (27.60 ± 1.80) was not statistically significant. There was no statistical difference between Yantai (39.42 ± 2.86), Lingbao (37.58 ± 3.42), Jingning (34.18 ± 0.10), or Luochuan (36.63 ± 2.12; Supplementary Table S8; Figure 2H).
3.1.9. Strontium
Functional agriculture, as a novel catalyst for the advancement of the agricultural industry, has yielded an array of nutrient-rich agricultural products, such as those abundant in selenium and zinc. The market for functional foods and dietary supplements targeting trace elements is expanding due to ongoing research on their health impacts. With a focus on developing specialized agricultural products that consider the nutritional significance to human health, we selected Sr. as a distinctive nutritional indicator for this study. From Supplementary Table S9, it can be observed that Sr. exhibited the second highest coefficient of variation (CV%) among all indicators (Supplementary Table S9; Figure 2I).
3.2. Factor analysis
The correlation coefficient matrix of each indicator is shown in Supplementary Table S14. The contents of VC, SS, and sucrose had extremely significant positive correlations (p < 0.01), and were also positively correlated with malic acid, Sr., and total sugar (p < 0.05) and negatively correlated with glucose and moisture (p < 0.01). SSC showed extremely significant positive correlations with malic acid, sucrose, and total sugar (p < 0.01) as well and had a significant correlation with titratable acid (p < 0.05), but extremely significant negative correlations with glucose, moisture, and dietary fiber (p < 0.01). Malic acid had a significantly positive correlation with titratable acid (p < 0.05). However, moisture was significantly negatively correlated (p < 0.05), and the ratio of sugar-to-acid and solid-to-acid were extremely significantly negatively correlated with it (p < 0.01). Malic acid showed a highly significant positive correlation with total sugars (p < 0.01), and a significant positive correlation with sucrose (p < 0.05). Furthermore, moisture showed a highly significant negative correlation with malic acid (p < 0.01), and soluble dietary fiber had a significant negative correlation with malic acid (p < 0.05). Glucose showed an extremely significant positive correlation with moisture (p < 0.01) but was negatively correlated with sucrose (p < 0.01). Neither soluble dietary fiber nor total dietary fiber had any significant positive (negative) correlation with other nutritional indicators. However, insoluble dietary fiber showed a highly significant positive correlation with total dietary fiber (p < 0.01), and moisture showed a significant positive correlation with soluble fiber (p < 0.01). Sucrose showed a significant positive correlation with Sr. (p < 0.05) and a highly significant positive correlation with total sugar (p < 0.01). By contrast, however, sucrose showed a highly significant negative correlation with moisture (p < 0.01). The solidity-acid ratio was positively correlated with Sr. (p < 0.05) and was extremely positively correlated with the sugar-acid ratio (p < 0.01).
Combining previous studies with these above results (Lu et al., 2008; Jiang et al., 2019; Yi et al., 2020; Zhang et al., 2020; Li et al., 2021), we chose principal component analysis (PCA) as the factor analysis method in this study. PCA is currently the most widely used technique for multidimensional data analysis (Giuliani, 2017). When evaluating the quality of apples, in particular, we referred to the method of evaluating the quality characteristics of white-fleshed peach fruit by Lyu et al. (2017) and used PCA to reduce the dimensionality of the standardized (Z-score) data, supporting cluster analysis results with the principal component factors. Based on Kaiser’s rule, only eigenvalues ≥1 were viewed as the main principal components (Shin et al., 2010; Bi et al., 2015). According to the inflection points of the scree plot in Figure 3, the first 4 factors can reflect most of the information of apple nutritional quality. Combining the results of PCA with Supplementary Table S10 shows that all the nutritional indicators could be grouped into four factors. Soluble solids, Vitamin C, and sucrose were the indicators that contributed positively to Factor 1. The indicators that contributed positively to Factor 2 were solidity-acid ratio, Sr., and sugar-acid ratio. Insoluble dietary fiber and total dietary fiber were the highest contributors to Factor 3, and the indicator that contributed positively to Factor 4 was soluble dietary fiber.
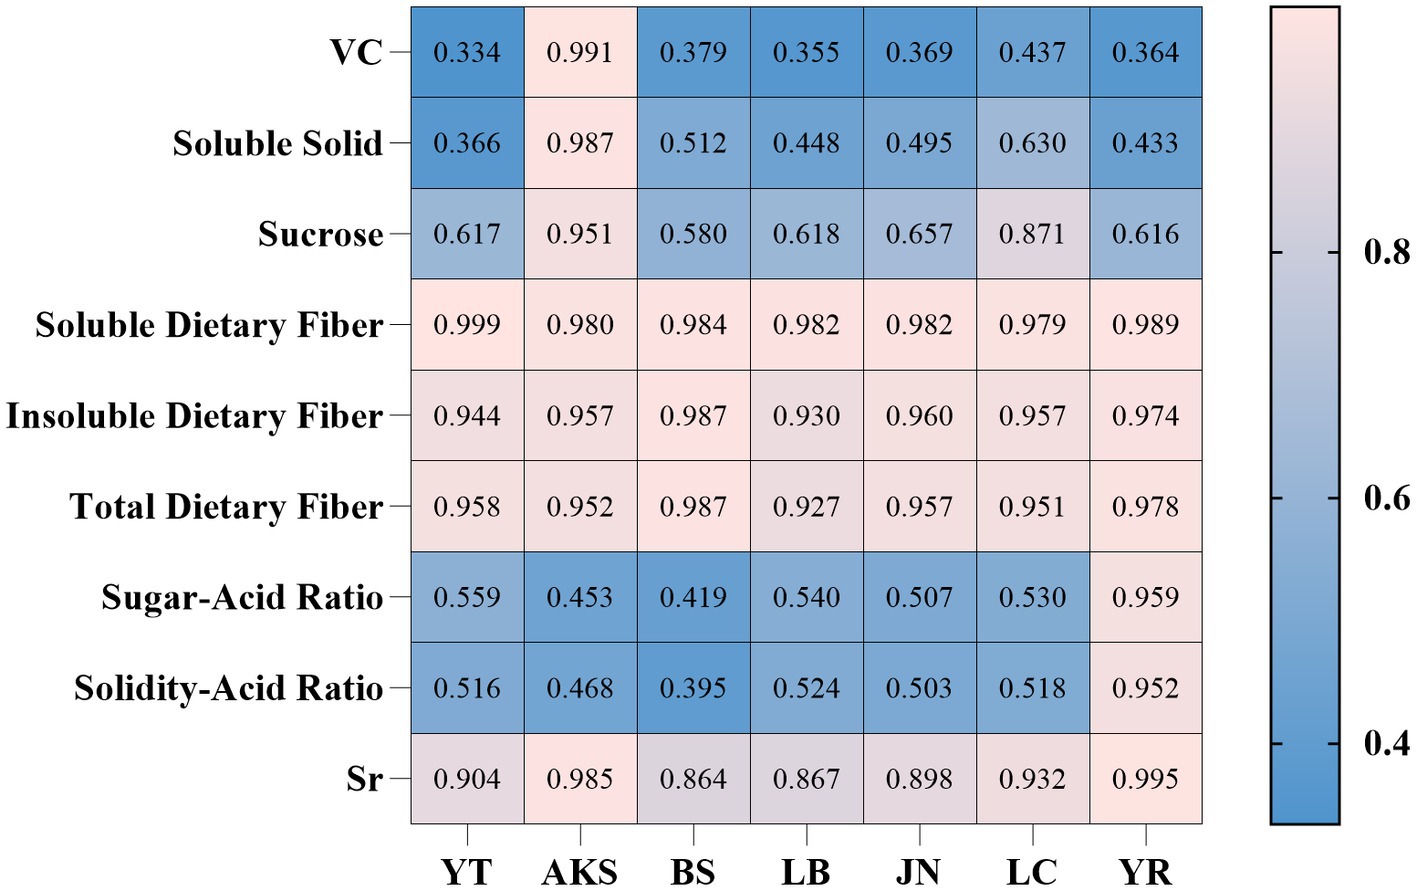
Figure 3. According to the inflection point of the gravel map, the first 4 components can indicate the majority of the nutritional quality information about apples after dimensionality reduction of 15 indicators. (Factor 1: soluble solids, vitamin C, sucrose. Factor 2: solid-acid ratio, Sr. and sugar-acid ratio. Factor 3: insoluble dietary fiber and total dietary fiber. Factor 4: soluble dietary fiber.) Factor 1 contained 46.091% of the original information, Factor 2 contained 20.492%, Factor 3 contained 17.274%, and Factor 4 contained 8.930%. The cumulative variance contribution of the four factors was 92.787%.
3.3. Cluster analysis
The normalized data were next analyzed by systematic clustering using the Ward method with the squared Euclidean interval, and the dimensionality reduction of the 15 indicators is shown in Figure 4. When the square Euclidean linear distance was 6, the 15 indicators could be divided into four categories. The first category consisted of sugar-acid ratio, solidity-acid ratio, and Sr.; the second category consisted of moisture, soluble dietary fiber, and glucose; the third category consisted of insoluble dietary fiber, total dietary fiber, and fructose; and the fourth category consisted of Vitamin C, soluble solids, sucrose, malic acid, total sugar, and titratable acid. These grouping results showed some similarity with the PCA results.
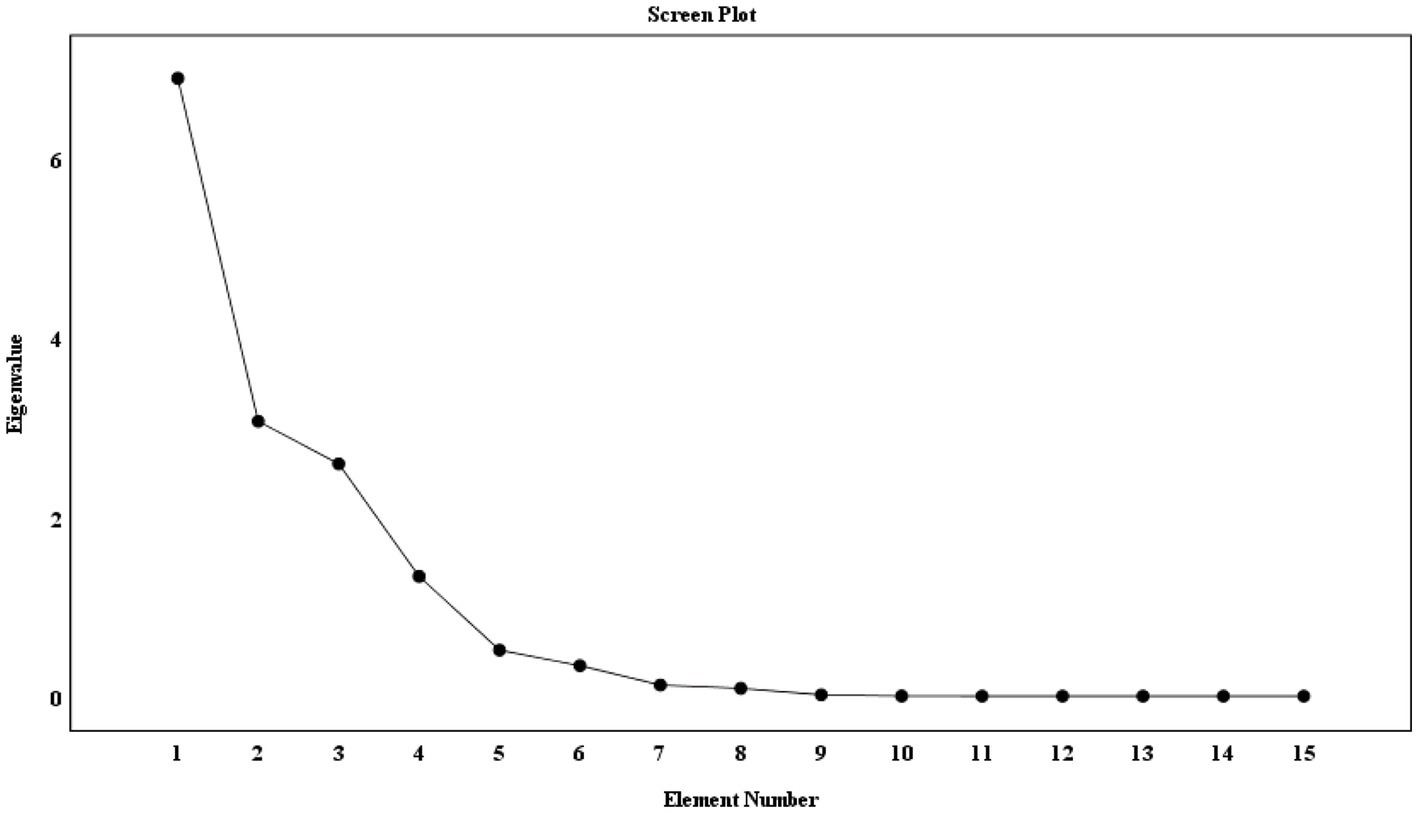
Figure 4. When the square Euclidean linear distance is 6, the 15 indicators of the subject can be divided into 4 categories. Category 1: sugar-acid ratio, solid-acid ratio, and Sr.; Category 2: moisture, soluble dietary fiber, and glucose; Category 3: insoluble dietary fiber, total dietary fiber, and fructose; Category 4: VC, soluble solids, sucrose, malic acid, total sugars, and titratable acids. The results of grouping are similar to those of principal component analysis.
The standardized treatment formula is as follows:
3.4. Grey relational analysis
By combining the existing literature and the results of our PCA and cluster analysis (Wang et al., 2017; Kuang et al., 2020), we found that the 9 indicators of soluble solid, Vitamin C, sucrose, Sr., insoluble dietary fiber, total dietary fiber, solid-acid ratio, sugar-acid ratio, and soluble dietary fiber all belonged to the indicators with larger values in a certain range. Therefore, the maximum value of the above indicators could be taken as the reference value of the “ideal apple,” and the value of these indicators could be designated as a parent sequence X0 (Chung et al., 2020). The corresponding correlation coefficient is given by:
where Δ(min) denotes the second-level minimum difference, Δ(max) denotes the second-level maximum difference, and ρ denotes the resolution factor, usually taken as 0.50.
The equal weight correlation degree is:
and the weighted correlation degree is:
where Wk denotes the weight of each correlation coefficient.
The gray relational analysis was conducted for seven different categories of samples and 9 indicators, with X0 as the parent sequence to investigate the correlation between seven categories of samples and X0 itself. The correlation coefficients closer to 1 represent the stronger correlation between the evaluation and the “ideal apple,” which means a higher evaluation. Figure 5 reflects the results of the correlation between the seven categories of samples and the constructed “ideal apple.” Table 1 shows that Aksu had the highest comprehensive evaluation (correlation degree of 0.858), followed by Yiyuan Red (correlation degree of 0.807).
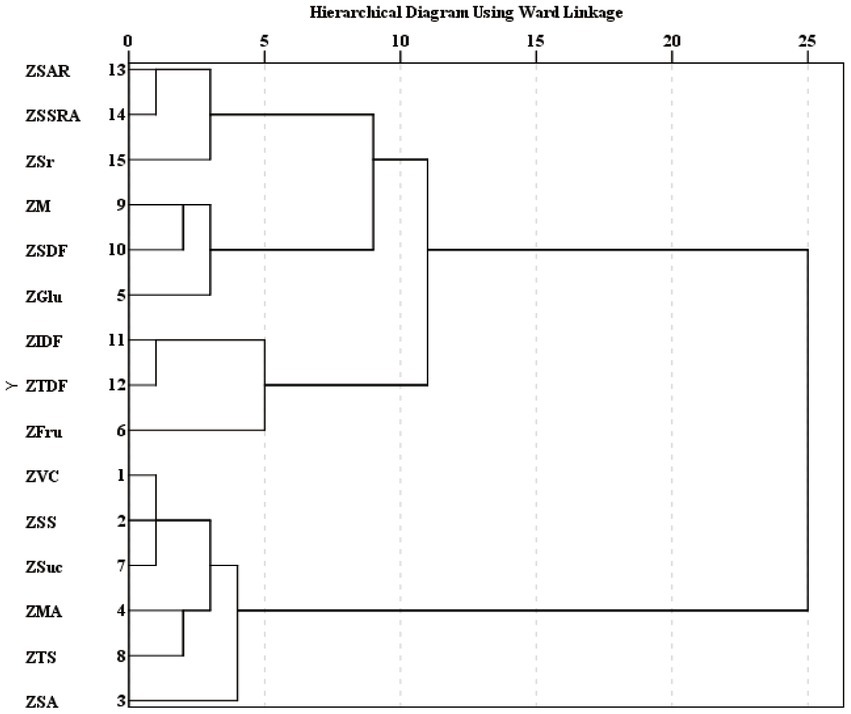
Figure 5. The heat map reflects the correlation between apples from the seven regions and the “ideal apple” in nine indicators. The greater the value of these nine indicators within a certain range, the better the quality of the apples.
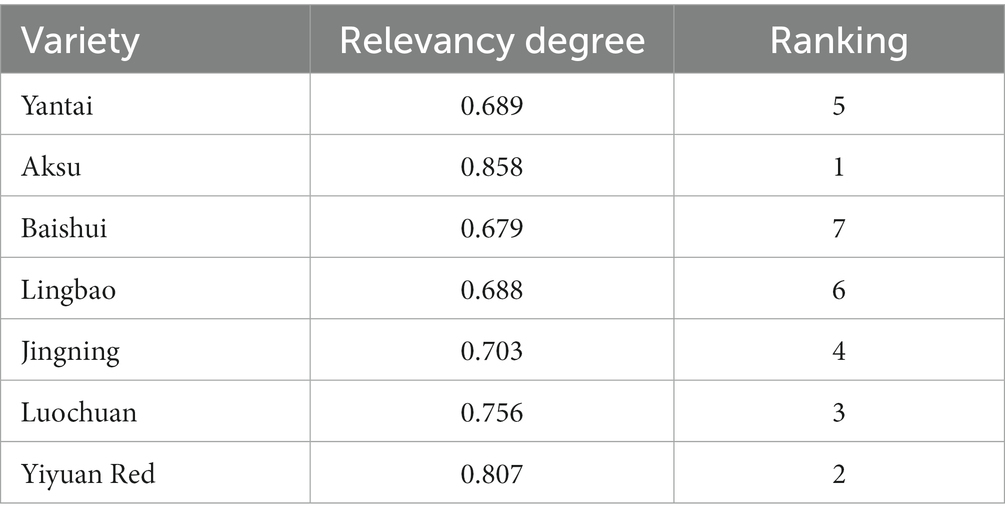
Table 1. Relevance results for nutritional quality in the and the ideal apple.
When using the gray correlation analysis, the resolution coefficient is usually taken as 0.50. The higher the correlation coefficient was, the higher the correlation was, and the stronger the correlation between the evaluation item and the “ideal apple.” For example, Aksu is closer to the ideal apple in terms of VC. By analogy, we can calculate the correlation degree value according to the correlation coefficient between the nine indicators of seven evaluation items and the ideal apple for evaluation and judgment.
3.5. Multiple linear regression
Based on the loadings of each indicator and the eigenvalues of each factor in the PCA results in Supplementary Table S10, we combined the dimension reduction results of PCA and cluster analysis to obtain the following discriminant functions for the 4 factors.
Here, Z denotes the principal component, and ZX denotes the Z-score of Xn (1-vitamin C, 2-soluble solid, 3-sucrose, 4-soluble dietary fiber, 5-insoluble dietary fiber, 6-total dietary fiber, 7-sugar-acid ratio, 8-solidity-acid ratio, 9-Strontium). That is, the variables standardized by the 9 nutritional indicators screened after PCA.
Linear regression was then applied with the 4 principal components as independent variables and the correlation evaluation as the dependent variable, and the standardized linear regression equation was obtained as follows:
After standardizing:
This multiple linear regression equation is the statistical model used in this study to evaluate the nutritional quality of strontium-rich apples.
Table 2 shows the results of the multiple regression statistical model for nutritional quality evaluation obtained after bringing in all data from the seven regional samples. The results of this nutritional quality evaluation were: Yiyuan Red > Aksu > Luochuan > Jingning > Lingbao > Yantai > Baishui.
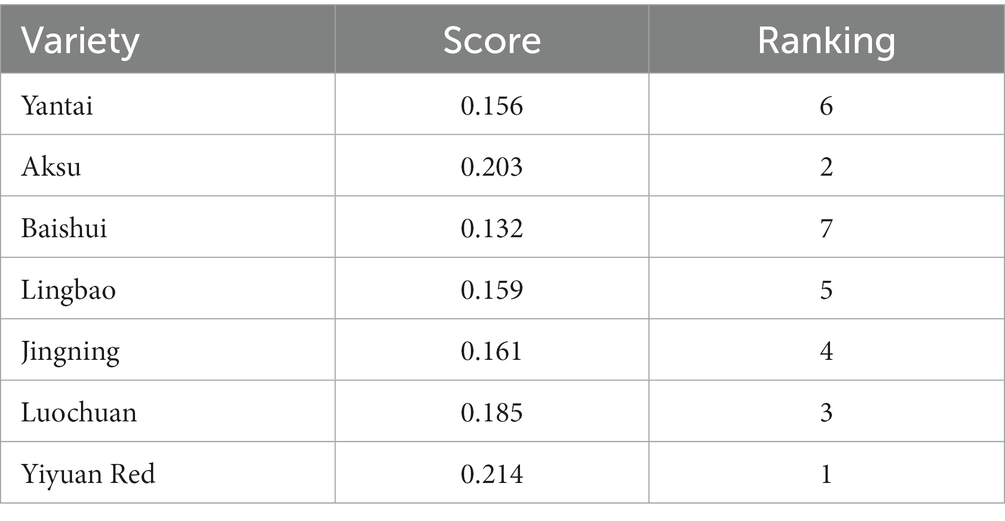
Table 2. Statistical evaluation results.
Evaluation model of apple nutritional quality based on assignment
We also referred to the nutritional evaluation by Zhao et al. (2021) and used the quartile method for nutritional quality evaluation, and the threshold range given in Supplementary Table S15 was used as the benchmark. Malic acid, glucose, fructose, sucrose, soluble dietary fiber, and insoluble dietary fiber had no exact given threshold range, and only reduced sugar (glucose and fructose are both reduced sugar) is specified in DB5205/T 2–2020 Weining Apple, a geographical Indication product.
For the indicators that had a given threshold range, those whose intake or intake ratio had to reach a certain threshold had such a property marked as a positive indicator as the reference specified. It also specified that the property of needing an indicator to be less than a certain ratio is a negative indicator. For positive indicators, a score of 1 is assigned if the threshold value is exceeded, no score is assigned if the threshold value is within the range, and a score is subtracted if the lower limit of the threshold value is not reached. For negative indicators, 1 point is subtracted for exceeding the threshold value, no points are assigned for being within the threshold range, and 1 point is assigned for not reaching the lower limit of the threshold.
For indicators with only upper or lower thresholds, there is no clear threshold range by reviewing the literature and other countries’ existing recommendations, such as moisture, reducing sugars, and total dietary fiber. The indices of samples less than or equal to the first quartile were therefore assigned a value of 0.25. After this set, those less than or equal to the median were assigned a value of 0.5; after that set those less than or equal to the third quartile were assigned a value of 0.75; and those remaining that were greater than or equal to the third quartile were assigned a value of 1. The specific evaluation criteria and assignments are shown in Supplementary Tables S11–S13.
The results shown in Table 3 were obtained by summing all the values of the assignment criteria for the apple nutritional quality indicators. According to the results of the new model based on the quartile method and the threshold values of each criterion, the first-ranked apple was Yiyuan Red with a composite score of 7.125, the second-ranked was Luochuan with a composite score of 6.625, the third-ranked was Aksu with a composite score of 5.75, the fourth-ranked was Lingbao with a composite score of 3.125, the fifth-ranked was Jingning with a composite score of 2.875, the sixth-ranked was Yantai with a composite score of 2.625, and the seventh was Baishui apple, with a composite score of 1.5.
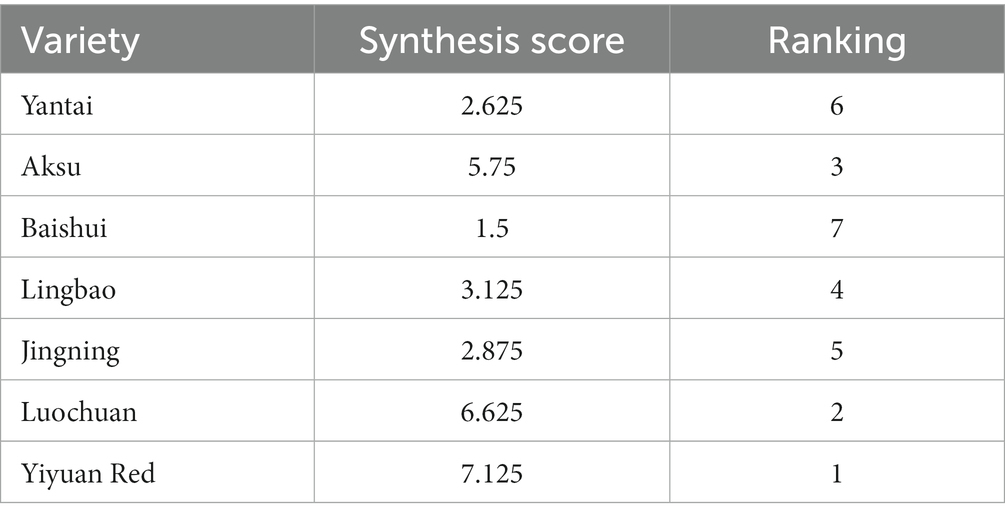
Table 3. Nutritional quality results of apples after using the value assignments.
4. Discussion
4.1. Apple as a potential source of dietary strontium supplementation
The advancement of technology has resulted in increased agricultural yields, thereby mitigating hunger caused by calorie deficiency. However, there is a growing focus on an emerging form of malnutrition known as hidden hunger, which pertains to the inadequate intake of essential micronutrients and vitamins despite sufficient caloric consumption (Padhy et al., 2022; Sreenivasulu et al., 2023). Sr., an essential trace element for human life, is widely distributed throughout all tissues of the human body. Nevertheless, strontium intake among Chinese individuals falls significantly below recommended levels, potentially leading to nutritional deficiencies associated with insufficient strontium consumption. This study demonstrates that apples cultivated in seven major regions across China exhibit detectable levels of strontium, with an average concentration of 0.4 mg/kg. Notably, Yiyuan display a slightly higher mean strontium content of 0.54 mg/kg. These findings suggest that apples, which are not only abundant in essential vitamins but also serve as a valuable source of the trace element strontium, could potentially be utilized as a dietary supplement to address deficiencies in this micronutrient. Moreover, considering the substantial apple production in China and their wide.
spread popularity as a prevalent local fruit, there exists a pervasive acceptance. Consequently, apples possess significant potential as a viable source for strontium supplementation, thereby addressing the issue of hidden hunger resulting from strontium deficiency.
4.2. The refinement of the nutritional evaluation for apples by incorporating strontium content
The trace element content in agricultural products can vary significantly due to a range of environmental factors. Our investigation into the levels of strontium in apples unveiled substantial differences among distinct geographic origins, aligning with prior findings on inconsistencies in trace element composition across diverse agricultural products and regions. Therefore, the implementation of an appropriate evaluation system is imperative to aid consumers in selecting apples based on their nutritional value. However, the existing nutritional assessment systems for apples lack the inclusion of strontium elements. Consequently, this study undertook a comprehensive nutritional analysis of apples sourced from seven distinct regions across China and established two different nutritional evaluation models comprising a total of 15 parameters. Based on the detection of 15 nutritional components, this study established two nutritional evaluation systems employing distinct assignment methods. Upon assessment, although slight disparities were observed in the outcomes between the two models, Yiyuan Red apples consistently exhibited the highest ranking in terms of nutritional value, which is consistent with their strontium content ranking. This finding suggest that the nutritional value of apples is influenced by their strontium content. Incorporating this parameter into the evaluation model can better cater to consumers’ demands and contribute to addressing the prevailing issue of hidden hunger by facilitating the selection of appropriate food choices.
Additionally, the disparity in evaluation outcomes between the two models can be attributed to variations in calculation methodologies. In the multiple linear regression nutritional quality evaluation model, the evaluation factors are weighted differently, resulting in different coefficients for the respective variables in the equation. Among them, factor 2 (solid-acid ratio, strontium, sugar-acid ratio) has a higher contribution, which makes the final evaluation results presented after coefficient redistribution. In the assignment-based nutritional quality evaluation model, except for the four indicators (VC, SS, TA, TSS) with clear thresholds, the remaining six indicators are assigned values by quartile method based on the existing upper and lower thresholds of national standards and industry standards. Therefore, the assignment coefficients have less influence on the final results, so the ranking results obtained by the two models are different, but the overall evaluation results are still somewhat similar, and the top three rankings are always Yiyuan Red, Aksu, and Luochuan. However, the two assessment techniques employed in this study require continuous incorporation of new sample parameters to enhance their accuracy as there is no definitive standard to validate the model. In terms of computational volume, the assignment-based nutritional quality evaluation method is more practical than statistical nutritional quality.
In conclusion, previous studies on the quality evaluation of apples have predominantly focused on visual indicators, such as appearance indicators, and the sugar-acid and solid-acid ratios, while overlooking the significance of trace elements. This study, we incorporated strontium as a unique trace element to establish a comprehensive nutritional evaluation system. Our aim is to provide a theoretical foundation for developing similar systems for other functional agricultural products and guide market development by empowering consumers to make informed choices in reducing hidden hunger through appropriate food selection.
Data availability statement
The original contributions presented in the study are included in the article/Supplementary material, further inquiries can be directed to the corresponding authors.
Author contributions
TH: Conceptualization, Formal analysis, Investigation, Methodology, Visualization, Writing – original draft. ZZ: Conceptualization, Data curation, Formal analysis, Investigation, Software, Writing – original draft. ZL: Data curation, Formal analysis, Supervision, Writing – review & editing. GS: Investigation, Software, Writing – review & editing. YTG: Methodology, Writing – review & editing. LC: Conceptualization, Formal analysis, Funding acquisition, Investigation, Methodology, Project administration, Supervision, Validation, Visualization, Writing – review & editing. YZG: Conceptualization, Funding acquisition, Methodology, Project administration, Visualization, Writing – review & editing. WB: Formal analysis, Writing – review & editing. WZ: Data curation, Writing – review & editing.
Funding
The author(s) declare financial support was received for the research, authorship, and/or publication of this article. YZG acquired the financial support (Agricultural Science and Technology Innovation Program CAAS-ASTIP-2022-IFND) for the project.
Conflict of interest
The authors declare that the research was conducted in the absence of any commercial or financial relationships that could be construed as a potential conflict of interest.
Publisher’s note
All claims expressed in this article are solely those of the authors and do not necessarily represent those of their affiliated organizations, or those of the publisher, the editors and the reviewers. Any product that may be evaluated in this article, or claim that may be made by its manufacturer, is not guaranteed or endorsed by the publisher.
Supplementary material
The Supplementary material for this article can be found online at: https://www.frontiersin.org/articles/10.3389/fsufs.2023.1292999/full#supplementary-material
Abbreviations
OPDA, O-Phenylenediamine; VC, Vitamin C; SSC, Soluble Solid Content; TAC, Titratable Acid Content; TSS, Total Soluble Sugar; MC, Moisture Content; MA, Malic Acid; DFC, Dietary Fiber Content; TDF, Total Dietary Fiber; SDF, Soluble Dietary Fiber; IDF, Insoluble Dietary Fiber; SSAR, Sugar-Acid Ratio; SAR, Solidity-Acid Ratio; PCA, principal components analysis.
References
Bi, J., Wang, X., Chen, Q., Liu, X., Wu, X., Wang, Q., et al. (2015). Evaluation indicators of explosion puffing Fuji apple chips quality from different Chinese origins. LWT Food Sci. Technol. 60, 1129–1135. doi: 10.1016/j.lwt.2014.10.007
Braux, J., Velard, F., Guillaume, C., Bouthors, S., Jallot, E., Nedelec, J.-M., et al. (2011). A new insight into the dissociating effect of strontium on bone resorption and formation. Acta Biomater. 7, 2593–2603. doi: 10.1016/j.actbio.2011.02.013
Chung, P.-L., Liaw, E.-T., Gavahian, M., and Chen, H.-H. (2020). Development and optimization of Djulis sourdough bread using Taguchi Grey relational analysis. Foods 9:Q1. doi: 10.3390/foods9091149
Curtis, E. M., Cooper, C., and Harvey, N. C. (2021). Cardiovascular safety of calcium, magnesium and strontium: what does the evidence say? Aging Clin. Exp. Res. 33, 479–494. doi: 10.1007/s40520-021-01799-x
Dong, X., Li, W., and Wang, B. (2017). Determination of dietary fiber in fresh corn using enzymatic gravimetric method. Qual. Safety Agricul. Products 1, 79–82.
Gashu, D., Nalivata, P. C., Amede, T., Ander, E. L., Bailey, E. H., Botoman, L., et al. (2021). The nutritional quality of cereals varies geospatially in Ethiopia and Malawi. Nature 594, 71–76. doi: 10.1038/s41586-021-03559-3
GB 12456-2021. National standard for Food safety-Determination of total acids in food. (2021). State Administration for Market Regulation, National Health Commission, PRC.
GB 5009.268-2016. National Standard for Food safety-Determination of multi-elements in food. (2016). National Health and family planning Commission of the People’s republic of China state Food and Drug Administration.
GB 5009.3-2016. National Standard for Food safety-Determination of moisture in food. (2016). National Health and family planning commission of the PRC.
GB 5009.86-2016. National standard for food safety—Determination of ascorbic acid in food. (2016). National Health and family planning commission of the PRC.
GB 5009.88-2014. National Standard for Food safety-determination of dietary fiber in food. (2015). National Health and family planning commission of the PRC.
Giller, K. E., and Zingore, S. (2021). Mapping micronutrients in grain and soil unearths hidden hunger in Africa. Nature. 594, 31–32. doi: 10.1038/d41586-021-01268-5
Giuliani, A. (2017). The application of principal component analysis to drug discovery and biomedical data. Drug Discov. Today 22, 1069–1076. doi: 10.1016/j.drudis.2017.01.005
Hanke, M.-V., and Flachowsky, H. (2017). Obstzüchtung und wissenschaftliche Grundlagen. Springer Spektrum. doi: 10.1007/978-3-662-54085-5
Jia, Y. (2022). Multi-indicator correlation and grading model construction of Aksu red Fuji apple quality [master, Tarim university]. Available at: https://kns.cnki.net/KCMS/detail/detail.aspx?dbcode=CMFD&dbname=CMFDTEMP&filename=1022494189.nh&v=
Jiang, X., Mao, J., Xu, J., Ma, Z., Wang, Y., and Chen, B. (2019). Establishment and verification of apple quality evaluation model. J. Gansu Agric. Univ. 54, 69–77. doi: 10.13432/j.cnki.jgsau.2019.03.010
Kuang, L., Nie, J., Li, Y., Cheng, Y., and Shen, Y. (2020). Quality evaluation of Fuji apples in different regions of China. Sci. Agric. Sin. 53, 2253–2263.
Li, Y., Yan, L., Zhang, B., Yang, S., and Zhao, Z. (2021). Study on the characteristics of sugar and acid components in fruits of different apple varieties. J. Fruit Sci. 38, 1877–1889. doi: 10.13925/j.cnki.gsxb.20210209
Lu, Z., Liu, L., Li, X., Gong, Y., Hou, X., Zhu, X., et al. (2008). Analysis and evaluation of nutritional quality in Chinese radish (Raphanus sativus L.). Agric. Sci. China 7, 823–830. doi: 10.1016/S1671-2927(08)60119-4
Lyu, J., Liu, X., Bi, J., Jiao, Y., Wu, X., and Ruan, W. (2017). Characterization of Chinese white-flesh peach cultivars based on principle component and cluster analysis. J. Food Sci. Technol. 54, 3818–3826. doi: 10.1007/s13197-017-2788-0
NY/T 2637-2014. Refractometric method for determination of total soluble solids in fruits and vegetables. (2014). Ministry of Agriculture of the People’s republic of China.
NYT 1793-2009. Standard for grades of apples. (2009). The Ministry of Agriculture of the People’s republic of China.
Offermanns, V., Andersen, O. Z., Riede, G., Andersen, I. H., Almtoft, K. P., Sørensen, S., et al. (2016). Bone regenerating effect of surface-functionalized titanium implants with sustained-release characteristics of strontium in ovariectomized rats. Int. J. Nanomedicine 11, 2431–2442. doi: 10.2147/IJN.S101673
Padhy, A. K., Kaur, P., Singh, S., Kashyap, L., and Sharma, A. (2022). Colored wheat and derived products: key to global nutritional security. Crit. Rev. Food Sci. Nutr. 1–17. doi: 10.1080/10408398.2022.2119366
Pilmane, M., Salma-Ancane, K., Loca, D., Locs, J., and Berzina-Cimdina, L. (2017). Strontium and strontium ranelate: historical review of some of their functions. Mater. Sci. Eng. C 78, 1222–1230. doi: 10.1016/j.msec.2017.05.042
Shin, E.-C., Pegg, R. B., Phillips, R. D., and Eitenmiller, R. R. (2010). Interrelationships among tocopherols of commercial runner market type peanuts grown in the United States. Int. J. Food Sci. Technol. 45, 2622–2688. doi: 10.1111/j.1365-2621.2010.02435.x
Siddique, K. H. M., Li, X., and Gruber, K. (2021). Rediscovering Asia’s forgotten crops to fight chronic and hidden hunger. Nat. Plants 7, 116–122. doi: 10.1038/s41477-021-00850-z
Sreenivasulu, N., Alseekh, S., Tiozon, R. N., Graner, A., Martin, C., and Fernie, A. R. (2023). Metabolic signatures from Genebank collections: an underexploited resource for human health? Annu. Rev. Food Sci. Technol. 14, 183–202. doi: 10.1146/annurev-food-060822-113022
Wang, S., Zeng, F., Ma, Y., Yu, J., Xiang, C., Feng, X., et al. (2023). Strontium attenuates hippocampal damage via suppressing Neuroinflammation in high-fat diet-induced NAFLD mice. Int. J. Mol. Sci. 24:10248. doi: 10.3390/ijms241210248
Wang, J., Zhang, L., Yang, Y., Ma, G., Duan, X., and Li, H. (2017). Research progress of apple quality evaluation index. J. Ningxia Agricul. Forestry Sci. Technol. 58, 3–5.
Wu, K., Wang, S., Song, W., Zhang, J., Wang, Y., Liu, Q., et al. (2020). Enhanced sustainable green revolution yield via nitrogen-responsive chromatin modulation in rice. Science 367:eaaz2046. doi: 10.1126/science.aaz2046
Xu, M., Dai, D. Z., Zhang, Q., Cheng, Y. S., and Dai, Y. (2010). Upregulated NADPH oxidase contributes to diabetic testicular complication and is relieved by strontium fructose 1,6-diphosphate. Exp. Clin. Endocrinol. Diabetes 118, 459–465. doi: 10.1055/s-0030-1248325
Yi, L., He, M., Lu, B., Yi, B. M., and Luo, Q. (2020). Quality analysis and evaluation of early and medium-ripening native apples in northern Xinjiang. Food Sci. 41, 62–67.
Zhang, F. (2021). A brief analysis of global apple production changes in the last decade. China Fruit News 38, 24–33.
Zhang, L., Han, M., Hu, H., Wu, Y., and Wang, L. (2020). Comprehensive evaluation of apple quality based on principal component analysis. Jiangsu Agricul. Sci. 48, 209–213. doi: 10.15889/j.issn.1002-1302.2020.03.037
Zhao, X., Xiang, X., Huang, J., Ma, Y., Sun, J., and Zhu, D. (2021). Studying the evaluation model of the nutritional quality of edible vegetable oil based on dietary nutrient reference intake. ACS Omega 6, 6691–6698. doi: 10.1021/acsomega.0c05544
Keywords: hidden hunger, apple, nutritional quality evaluation, evaluation model, strontium
Citation: Hong T, Zhao Z, Bian W, Zhu W, Li Z, Shen G, Gu Y, Chen L and Guo Y (2023) Development of a novel nutritional assessment model based on strontium and other compositional factors in apples across seven regions in China. Front. Sustain. Food Syst. 7:1292999. doi: 10.3389/fsufs.2023.1292999
Edited by:
Xian Xia, Hubei Normal University, ChinaReviewed by:
Zunji Shi, Lanzhou University, ChinaYuanping Li, Fujian Agriculture and Forestry University, China
Copyright © 2023 Hong, Zhao, Bian, Zhu, Li, Shen, Gu, Chen and Guo. This is an open-access article distributed under the terms of the Creative Commons Attribution License (CC BY). The use, distribution or reproduction in other forums is permitted, provided the original author(s) and the copyright owner(s) are credited and that the original publication in this journal is cited, in accordance with accepted academic practice. No use, distribution or reproduction is permitted which does not comply with these terms.
*Correspondence: Lu Chen, Luchen.0920@gmail.com; Yanzhi Guo, guoyanzhi@caas.cn
†These authors have contributed equally to this work and share first authorship