Land use classification in mine-agriculture compound area based on multi-feature random forest: a case study of Peixian
 Jiaxing Xu
 Chen Chen1,2
 - 1The National and Local Joint Engineering Laboratory of Internet Applied Technology on Mines, China University of Mining and Technology, Xuzhou, China
- 2School of Environment and Spatial Informatics, China University of Mining and Technology, Xuzhou, China
- 3State Key Laboratory of Coal Resources and Safe Mining, China University of Mining and Technology, Xuzhou, China
Introduction: Land use classification plays a critical role in analyzing land use/cover change (LUCC). Remote sensing land use classification based on machine learning algorithm is one of the hot spots in current remote sensing technology research. The diversity of surface objects and the complexity of their distribution in mixed mining and agricultural areas have brought challenges to the classification of traditional remote sensing images, and the rich information contained in remote sensing images has not been fully utilized.
Methods: A quantitative difference index was proposed quantify and select the texture features of easily confused land types, and a random forest (RF) classification method with multi-feature combination classification schemes for remote sensing images was developed, and land use information of the mine-agriculture compound area of Peixian in Xuzhou, China was extracted.
Results: The quantitative difference index proved effective in reducing the dimensionality of feature parameters and resulted in a reduction of the optimal feature scheme dimension from 57 to 22. Among the four classification methods based on the optimal feature classification scheme, the RF algorithm emerged as the most efficient with a classification accuracy of 92.38% and a Kappa coefficient of 0.90, which outperformed the support vector machine (SVM), classification and regression tree (CART), and neural network (NN) algorithm.
Conclusion: The findings indicate that the quantitative differential index is a novel and effective approach for discerning distinct texture features among various land types. It plays a crucial role in the selection and optimization of texture features in multispectral remote sensing imagery. Random forest (RF) classification method, leveraging a multi-feature combination, provides a fresh method support for the precise classification of intricate ground objects within the mine-agriculture compound area.
1 Introduction
Land use classification is a crucial component in the study of land use/cover change (LUCC) (Jansen and Gregorio, 2002). It holds significant importance in adjusting land use structures, rationalizing the development of land resources, dynamically monitoring land use status, and uncovering the underlying mechanisms of LUCC (Lambin et al., 2003; Azizi et al., 2022; Singh et al., 2022). Current monitoring land use changes not only requires identifying the location and direction of change, but also involves assigning relevant attribute information to those changes, effectively recognizing the dynamic types of land use. Remote sensing offers a proficient and swift technical means for extracting land use information, thanks to its macro, real-time, cyclical, and cost-effective benefits (Sertel et al., 2022). Thus, using remote sensing technology to obtain the temporal and spatial distribution characteristics of land cover information rapidly and accurately has become a fundamental technology in land use classification research.
The success of land use classification using remote sensing technology hinges on identifying ground objects by differentiating their spectral, textural, and morphological features in remote sensing images, thereby providing them with accurate labels. In recent years, as the temporal, spectral, and spatial resolution of remote sensing satellite images improve, the accuracy of land use classification is also enhanced (Inglada et al., 2016; Mazzia et al., 2020). Current methods of land use classification comprise supervised classification, unsupervised classification, Object-Based Image Analysis (OBIA), and deep learning (Phiri and Morgenroth, 2017; Macarringue et al., 2022). Supervised classification utilizes prior knowledge in the classification process through the selection of training samples, with the most common classifiers being maximum likelihood, minimum distance, and artificial neural network (ANN) (Ritter and Hepner, 1990; Otukei and Blaschke, 2010; Abida et al., 2022). Unsupervised classification was developed first through different clustering methods such as K-means, interactive self-organization data analysis (ISODATA), and principal component analysis (PCA) (Abbas et al., 2016; Foroughnia et al., 2022; Macarringue et al., 2022). OBIA uses geographic objects as the fundamental units for land cover classification (Macarringue et al., 2022; Shi et al., 2022). Its advantage lies in its ability to incorporate various sources of information such as texture, shape, and position as the basis for classification (Hussain et al., 2013; Peña et al., 2014). With the advent of deep learning, methods such as support vector machine (SVM), neural network (NN), classification and regression tree (CART), and random forest (RF) have become widely adopted due to their high classification accuracy (Alhassan et al., 2020; Navnath et al., 2022). Singh and Tyagi (2021) used a deep learning neural network (DLNN) to classify Landsat 8 OLI multispectral images in flood-prone areas, resulting in an accuracy improvement of 8.52% compared to traditional classification methods. Chamundeeswari et al. (2022) classified crops using the deep convolutional neural network crop classification model, yielding results superior to other methods. Davydzenka et al. (2022) markedly enhanced the remote sensing classification accuracy of machine learning by combining images to generate additional image training data sets. Employing the iterative CART algorithm, Wu et al. (2019) extracted land cover types in sequence, which significantly improved the accuracy by minimizing the phenomenon of mixed division at different levels. However, due to the complexity of ground objects, image resolution, and limitations of processing methods, uncertainty in the classification of remote sensing data is unavoidable (Zhang and Zhang, 2019). Consequently, the design of a reasonable remote sensing image classification algorithm is key to enhancing the accuracy of remote sensing image classification.
Feature selection, a critical component of the remote sensing image classification process, involves choosing multiple features from the initial features to maximize the classification’s separability criterion. This method reduces the initial feature variables, thereby accomplishing the goal of dimensionality reduction of the classification dataset and fulfilling the classification goal of minimal intra-class difference and substantial inter-class difference (Qin and Song, 2008). Li et al. (2011) utilized Landsat image data to compare and analyze the supervised classification results of different combinations of spectral information, principal component analysis information, and texture parameter information. The findings indicate that the remote sensing supervised classification effect, when supplemented with texture parameters, was significantly more robust than that of pure spectral data classification. Lu et al. (2022) integrated a semantic segmentation network with artificial feature selection to determine the best combination of texture features for remote sensing image classification. Despite the extensive research on remote sensing image classification focusing on deep learning models and their enhanced algorithms, there is relatively few research on classification feature selection and data generalization.
Random forest (RF) algorithm is a relatively new and efficient combination classification method. It can effectively process high-dimensional data, provides excellent classification results, and is simple to operate (Breiman, 2001; Belgiu and Dragut, 2016). At present, it has been successfully implemented in various applications such as remote sensing image classification (Zhang and Yang, 2020), urban information extraction (Belgiu and Lucian, 2014), big data analysis (Kumar and Venkatesulu, 2019), and vegetation biomass computation (Karlson et al., 2015). Numerous studies have demonstrated the practicality of using RF with feature combinations for land cover classification using remote sensing images (Hennessy et al., 2020; Zhang et al., 2021). However, the diversity of surface objects and the complexity of their distribution in mixed mining and agricultural areas have brought challenges to the classification of traditional remote sensing images, and the rich information contained in remote sensing images has not been fully utilized. To date, numerous studies have focused on the performance and efficiency of machine learning classification algorithms (Hennessy et al., 2020; Zhang et al., 2021; Navnath et al., 2022), while mining classification features from remote sensing images has received relatively less attention. Existing methods for image feature selection, such as PCA (Macarringue et al., 2022) and RF feature variable importance (Ma et al., 2015), exhibit certain limitations. Particularly, there is a lack of research addressing the combination of classification features of confusing land use types in mine-agriculture compound areas. As a result, innovative and efficient classification solutions that overcome these challenges are urgent needed.
This paper introduced the quantitative difference index to select the different texture feature parameters of easily confused land classes, such as cultivated land and woodland, and combined with the spectral features and remote sensing indices to form a variety of feature variable classification schemes. RF algorithm and feature combination schemes were used to study the land use classification of mine-agriculture compound areas in plain, and compared with CART, NN and SVM classification algorithm, respectively. The purpose was to evaluate the practicability of the RF algorithm with multi-feature combination classification schemes in the land use classification of the plain mine-agriculture compound area, and to provide a basis for monitoring the utilization of land resources and planning management in mine-agriculture compound area in plain.
2 Materials and methods
2.1 Study area
Peixian County in Xuzhou City, Jiangsu Province is as a case study (Figure 1). The study area is situated west of Weishan Lake, part of the Nansi Lake system within the Sishui River system of the Huaihe River Basin. It extends over 34°28′-34°59′N, 116° 41′-117°09′E, covering a total area of 1,806 km2. Peixian is a typical alluvial plain with a flat terrain and temperate monsoon climate. These conditions create a favorable agricultural environment. According to comprehensive statistics of Peixian Bureau of Natural Resources and Planning in 2022, The current cultivated land area is about 77,000 hectares. As part of the East China coal accumulation area, the Peixian coal mining region is an important coal-producing and coal-related industry hub with proven coal reserves of 2.4 billion tons and an annual output of 12 million tons of raw coal. Due to the prolonged period of continuous coal mining, serious ecological problems have emerged, such as ground subsidence, cultivated land destruction, and landscape fragmentation. The intensity of land use/cover change and the high degree of landscape fragmentation pose significant threats to the ecological security of Peixian County (Xu et al., 2019). According to the actual land cover characteristics of the study area, satellite images and the current land use classification standards in China, the primary land use types in this area include cultivated land (dry land and paddy fields), woodland, garden land, water bodies (subsidence ponds, reservoir ponds, rivers), construction land, industrial and mining land, and unused land.
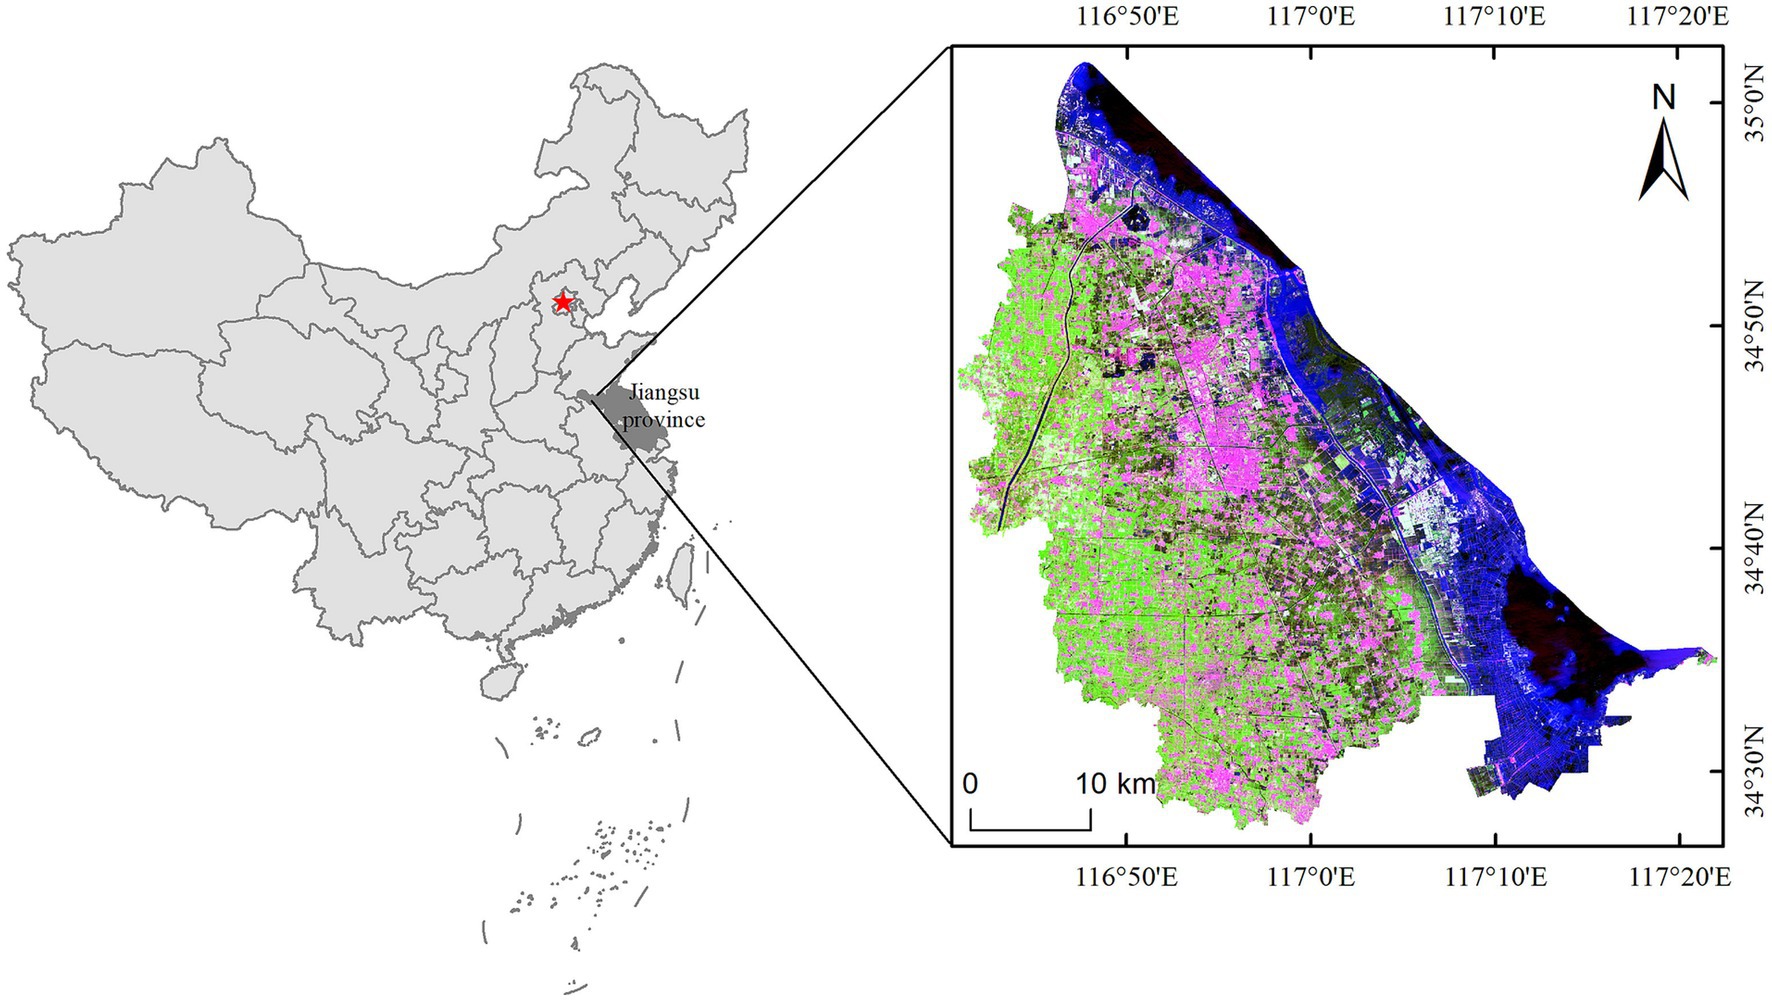
Figure 1. The study area located on the northern of Xuzhou City, Jiangsu, China.
2.2 Data sources and preprocessing
The data used in this paper consists of a Landsat 8 OLI satellite image (LC81220362021211LGN00), obtained on July 30, 2021. This Level-1 product has a spatial resolution of 30 m and is projected in UTM/WGS84. It was downloaded from the United States Geological Survey (USGS,1). The images underwent radiometric calibration and atmospheric correction using the radiometric calibration and FLAASH atmospheric correction modules in ENVI. Following preprocessing, the remote sensing image was clipped to the extent of the study area and histogram equalization was employed for image enhancement. Given the minimal surface variation in Peixian County and the consequent limited impact of terrain on the distribution of land types, this study did not consider the influence of topographic data on land use classification.
2.3 Methods
2.3.1 Feature selection
1. Spectral characteristic factor
In this paper, band 2–7 of Landsat 8 OLI were selected as the characteristic factor for classification considering that Landsat 8 OLI provides rich reflection spectrum information of ground objects. Due to the significant spectral characteristics of specific land classes (vegetation, water area and buildings), normalized difference vegetation index (NDVI), improved normalized water area index modified normalized difference water index (MNDWI) (Xu, 2005) and normalized difference building index (NDBI) (Huang et al., 2013) were selected as the remote sensing indices for classification (Table 1).
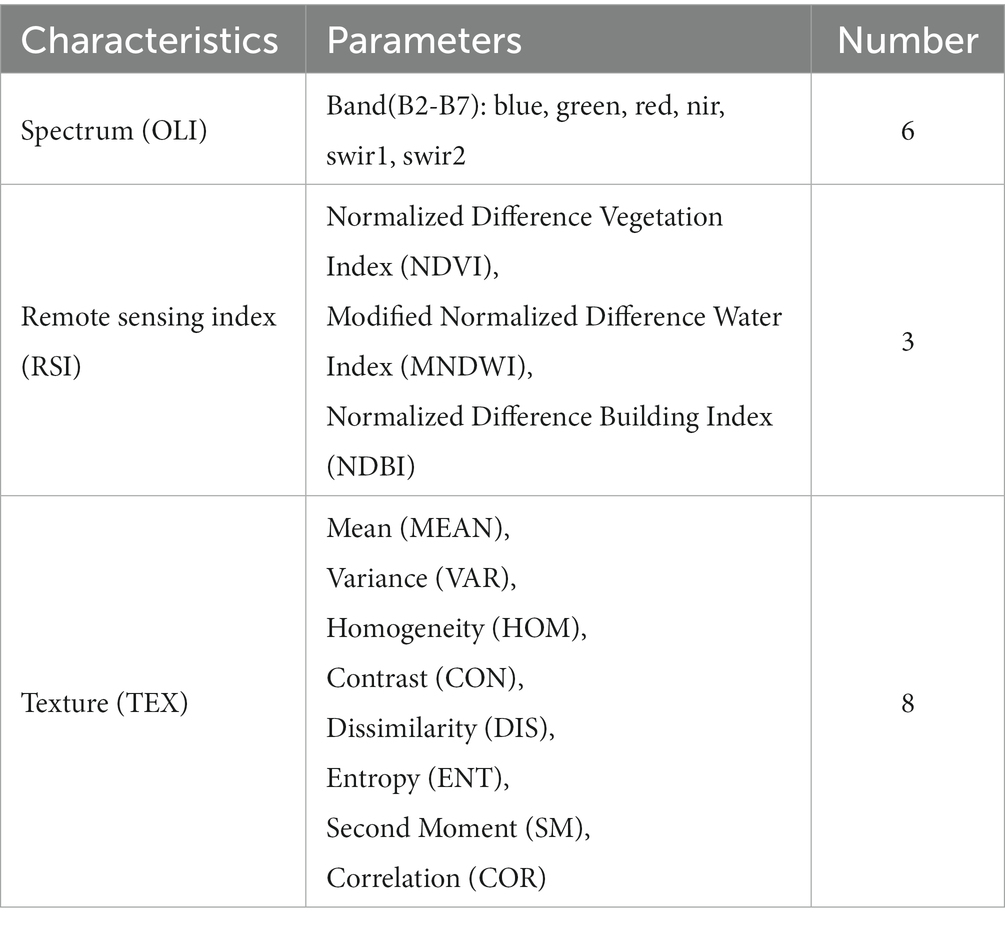
Table 1. Statistic of characteristic parameters.
1. Texture feature factor
Texture feature is a type of visual feature determined by intrinsic attributes such as the shape and physical and chemical properties of ground objects. It manifests periodically and repetitively in the form of local spatial gray distribution. The arrangement of texture features is not influenced by image attributes such as spectrum and color, hence, it can effectively highlight similar image features of homogenous elements to distinguish between different ground objects (Huang et al., 2014). In this study, we used the gray-level co-occurrence matrix (GLCM) to extract the texture features from the remote sensing images (Hu et al., 2008). The calculation formula is as follows:
where i and j represent the gray scale of the pixel pair, while (a, b) describes the spatial distance relationship of the pixel pair. The pairs (1.0), (0.1), (1.1), and (−1, −1) correspond to horizontal 0° scanning, vertical 90° scanning, 45° scanning, and 135° scanning of the pixel pair, respectively. N(i, j) denotes the frequency of the corresponding spatial relationship of the pixel pair. In this study, we employed the (1.1) scanning method to extract texture features (Table 1).
1. Construct quantitative difference index
Peixian is a typical alluvial plain, with woodlands primarily distributed around both rural settlements and some cultivated lands. Given their spectral and vegetation index similarities, woodlands and cultivated lands are typically confused landscapes. However, in terms of texture, most of cultivated land is smooth and flat from June to October, while most of woodlands are rough and scattered.
Therefore, this study selected texture features with significant differences between these two types to improve classification accuracy. In this paper, a quantitative difference index was constructed to quantify and select the variation in texture characteristics between these easily confused land types, such as cultivated land and woodland. The calculation formula is as follows:
where RA represents the value of quantitative difference index, while Amean and Bmean are the mean values of a texture feature of land type A and land type B, respectively. The purpose of constructing this index is to analyze and extract the characteristic factors with large differences among confusable land use types by statistically analyzing the degree of texture difference. In this study, we used the remote sensing interpretation method to extract sample data for the different land use types. We then utilized the quantitative difference index to extract the feature combinations with significant differences among the easily confused types for classification. We eliminated redundant features based on their importance, thereby reducing the data dimensionality of the feature factor.
2.3.2 Classification method
1. Random forest algorithm
The random forest (RF) algorithm is a relatively new machine learning algorithm that consists of multiple classification and regression trees (Breiman, 2001). By employing bootstrap resampling technology, it continuously generates training samples and test samples. These training samples are used to create multiple classification trees, forming a ‘random forest’. The algorithm then utilizes a voting method on these classification trees to derive the final classification results. Essentially, the RF algorithm enhances the decision tree algorithm while exhibiting a stronger generalization capability (Briem et al., 2013). Benefits of the RF algorithm include its rapid training speed, minimal risk of overfitting, balanced error judgment, and its ability to discern the importance of features (Gislason et al., 2006), making it particularly well-suited for remote sensing land use classification. The steps of the RF algorithm are as follows (Amit and Geman, 1997):
where represents the combined classification model, while stands for the decision tree classification model, Y is the output result, I(...) denotes the indicator function, and Y is determined by selecting the result with the most votes from multiple decision tree votes. The RF algorithm requires two important inputs: the number of decision trees and the number of features assigned for each split. In this study, the number of decision trees is set to 100, while the number of features per split is set to 1.
1. Classification and regression tree algorithm.
Classification and regression tree (CART) algorithm is an effective non-parametric supervised learning method (Zhang et al., 2015), that is, it summarizes decision rules from a series of data with features and labels, presents these rules in a tree structure to solve classification and regression problems. CART uses Gini coefficient in economics as the criterion for selecting the best classification feature and feature threshold, defined as follows:
where is the probability that a sample is randomly selected from the training sample set and belongs to class j when the value of a certain test variable is h, is the number of samples belonging to class j when the test variable value is h in the training sample, n(h) is the number of samples in the training sample whose value of the test variable is h, j is the number of categories.
1. Neural network algorithm
Neural network is a computational model that mimics the human nervous system and consists of many basic processing units that perform computations through their interconnections and signaling (Wilkinson, 1996). Neurons are the basic units in neural networks, which receive multiple input signals, generate output signals through certain calculations and transmit them to other neurons. The composition of neurons formula is as follows:
Where a represents the output of the neuron, g (·) represents the activation function, represents the weight of the i th input signal, represents the i th input signal, and b represents the bias.
1. Support vector machine algorithm.
Support vector machine (SVM) is a machine learning algorithm based on statistical learning theory (Vapnik et al., 1994). By solving the optimization problem, it can find the optimal classification hyperplane in the high-dimensional feature space, so as to solve the classification and regression problems of complex data. The basic mathematical form and limitations of SVM are as follows:
where w is the normal vector of the hyperplane, b is the intercept of the hyperplane, is the eigenvector of the training sample, is the label of the training sample, and n is the number of samples.
2.3.3 Accuracy evaluation
Based on the principle of randomness and uniformity, this study selected 847 sample points to establish an accuracy evaluation database, utilizing Google Earth and prior knowledge. The confusion matrix of the classification results is calculated to obtain the overall accuracy (OA) and kappa coefficient for accuracy verification. The calculation formulas of OA and Kappa coefficients are as follows:
Where r is the number of land use types; N is the total number of samples; is the number of samples in row i and column i of the confusion matrix (i.e., the number of correct classification); and are the total number of pixels in row i and column i.
3 Results
3.1 Feature combination
To accentuate the visual differences between various land use types with similar spectra, this study utilized a false color synthesis (using a 7,5,3 band combination) to enhance the efficiency and accuracy of sample data acquisition, as depicted in Figure 2. The spectrum and remote sensing index were standardized according to a 95% confidence interval, and the mean values of spectrum and remote sensing index for the seven landscape categories were tallied and normalized to generate remote sensing parameter curves (Figure 3). As can be observed from Figure 3, water areas, construction land, and industrial and mining land can be efficiently differentiated from other land types via decision tree classification, while cultivated land, woodland, and garden land pose more of a challenge for differentiation.

Figure 2. Characteristics of land use types in the study area on Landsat 8 OLI image [false color synthesis (7,5,3 band combination)].
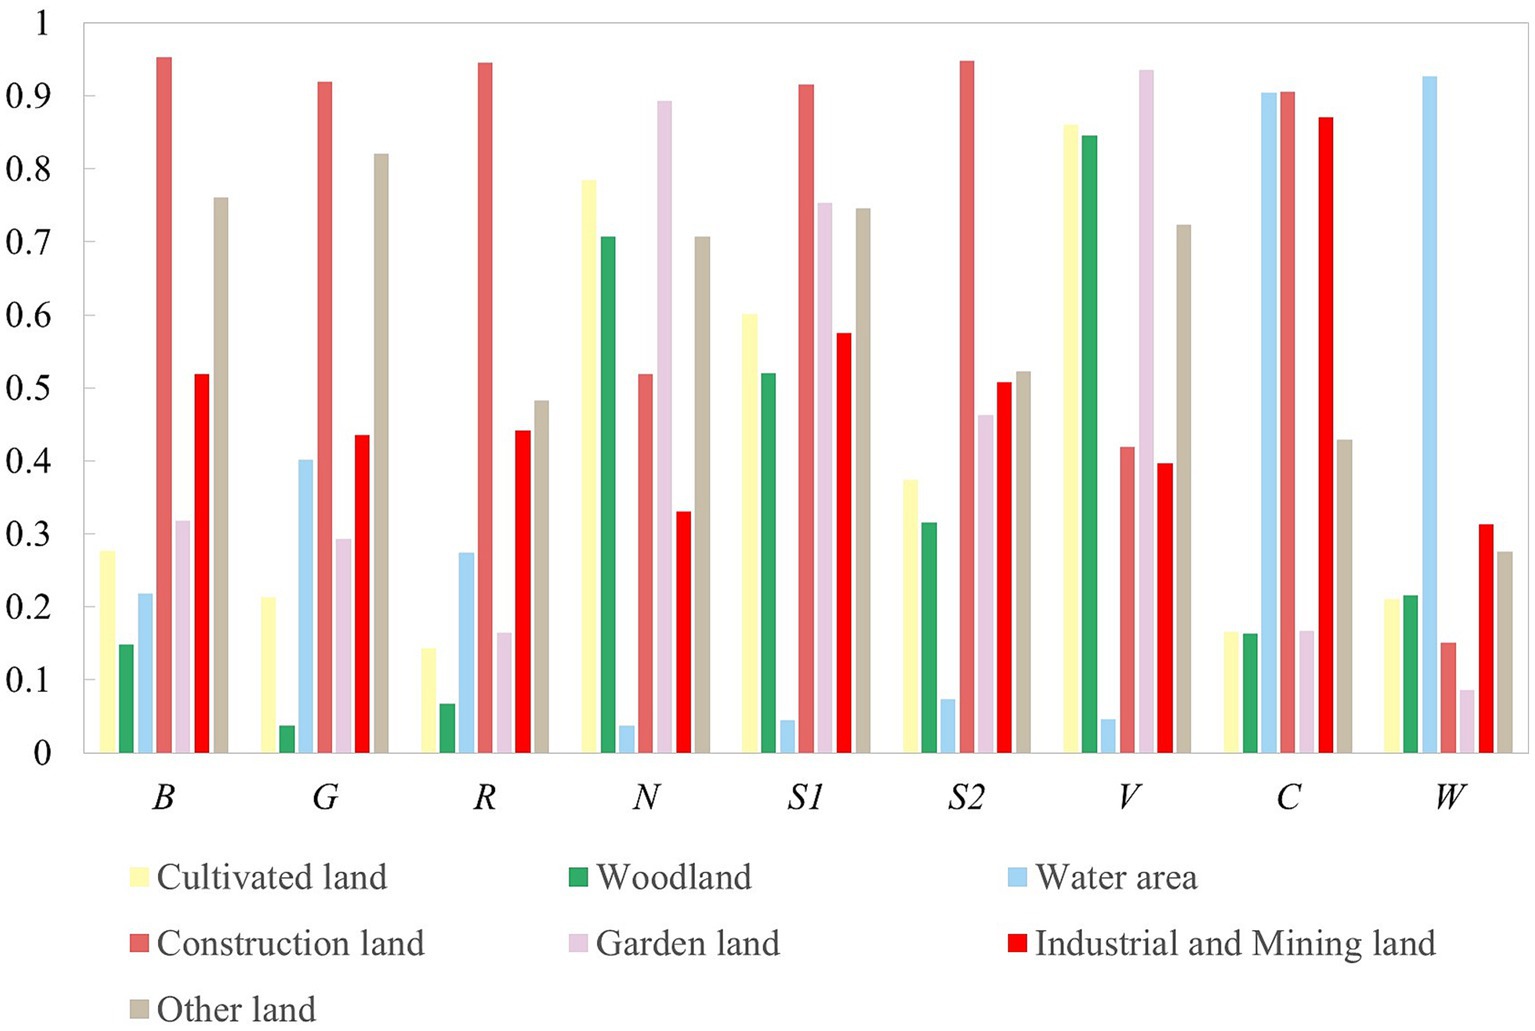
Figure 3. Characteristic statistics of spectrum and remote sensing index of different land types. B-blue, G-green, R-red, N-nir, S1-swir1, S2-swir2, V-NDVI, C-NDBI, W-MNDWI.
Due to the confusion between woodland and cultivated land in Peixian, studying the distinction between these two land types is vital for enhancing the accuracy of classification. Given the small area of the garden and its significant spatial distribution characteristics, appropriate texture feature parameters were selected by analyzing the differences between woodland and cultivated land types to improve overall classification accuracy. In this study, the quantitative difference index of texture characteristics for woodland and cultivated land was calculated. This process involved extracting different bands and texture parameters to distinguish woodland from cultivated land, ultimately identifying the texture parameters with substantial interclass variation.
As shown in Table 2 and Figure 4, the most significant quantitative differences between woodland and cultivated land with respect to texture were seen in the variance, contrast, and correlation parameters, and these varied across different bands. The quantitative difference indexes for variance and contrast in the blue, green, and red bands were greater than 0.8, and for correlation in the swir1 band, it was greater than 0.7, which were substantially higher than other texture parameters. The quantitative difference indexes for variance, contrast, and correlation in the nir and swir2 bands were around 0.3 to 0.5, which were of medium level. The quantitative difference indexes for other texture parameters were less than 0.3, marking them as the lowest level.
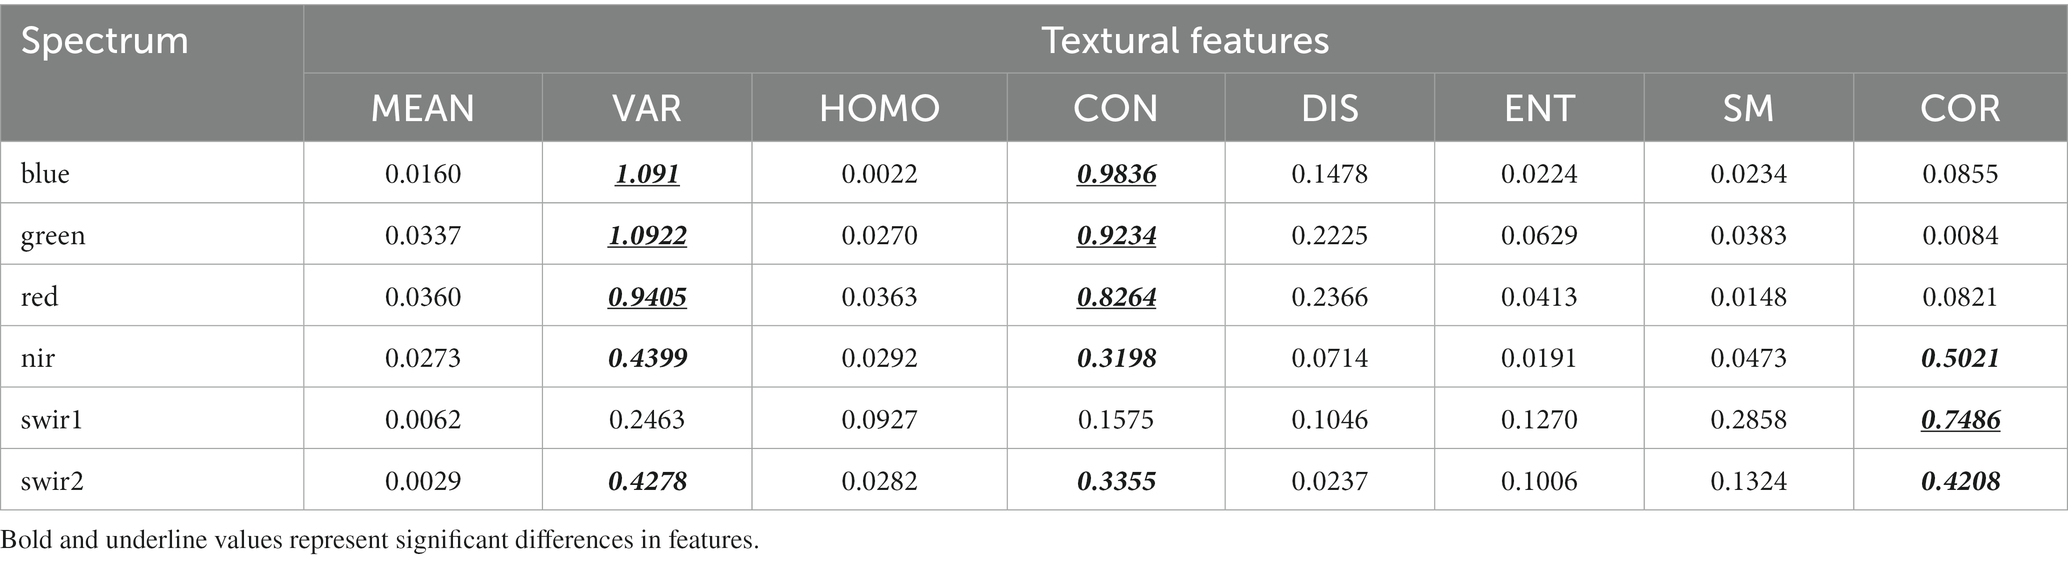
Table 2. The quantitative difference index values of texture characteristics between woodland and cultivated land.
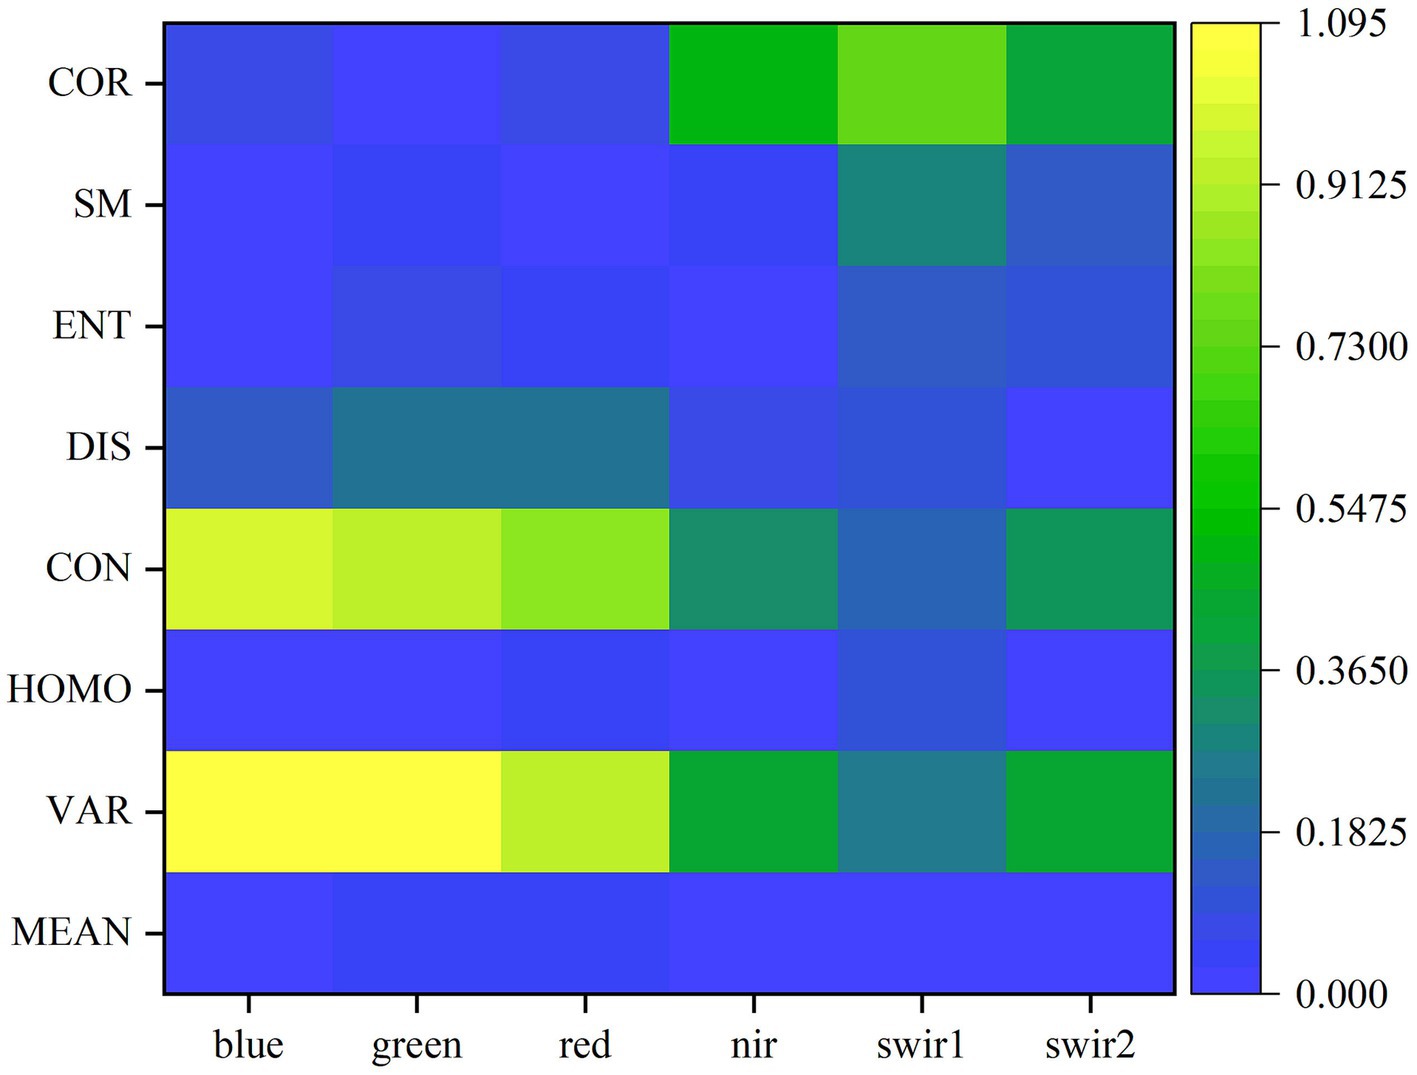
Figure 4. Comparison of texture characteristic difference between woodland and cultivated land.
To verify the accuracy of the quantitative difference index in distinguishing texture feature differences, we analyzed the histogram, frequency, and first-order derivative distribution of texture parameters for cultivated land and woodland, corresponding to the blue band which showed significant differences in features. This analysis enabled us to assess the relationship between the distribution and variations of these two landscape texture features (Figure 5).

Figure 5. Statistical distribution of texture features of cultivated land and woodland in Blue Band.CL: cultivated land, WL: woodland.
As Figure 5 illustrates, for parameters such as mean, homogeneity, dissimilarity, entropy, second-order moment, and correlation, the distributions for cultivated land and woodland are relatively concentrated, and the frequency and trend of the peaks are largely similar. Viewed from the first derivative’s perspective, the degree of dispersion for both landscapes are relatively large, suggesting that they share similar trends and rules and exhibit high inter-class similarity. When it comes to variance and contrast, cultivated land shows an even distribution with fewer peaks compared to woodland. Viewed from the perspective of the first derivative, cultivated land has better continuity and relative stability compared to the disjointed distribution of woodland. Therefore, variance and contrast effectively reflect the differences between cultivated land and woodland. This aligns with the general understanding that cultivated land in the mine-agriculture compound area of Peixian is locally uniform and singular, whereas woodland is locally complex and discrete. Moreover, it confirms the accuracy of the quantitative difference index method for optimizing characteristic parameters.
The texture features were divided into three groups based on the quantification difference index between woodland and cultivated land (RA > 0.7, 0.3 < RA < 0.7, RA < 0.3). These were, respectively, T1 (blue (Variance, Contrast), green (Variance, Contrast), red (Variance, Contrast), swir1 (Correlation)), T2 (nir (Variance, Contrast, Correlation), swir2 (Variance, Contrast, Correlation)), and T3 (textures other than T1 and T2). As outlined in Table 3, five types of classification schemes were constructed by combining spectrum, remote sensing index, and the three texture combinations.
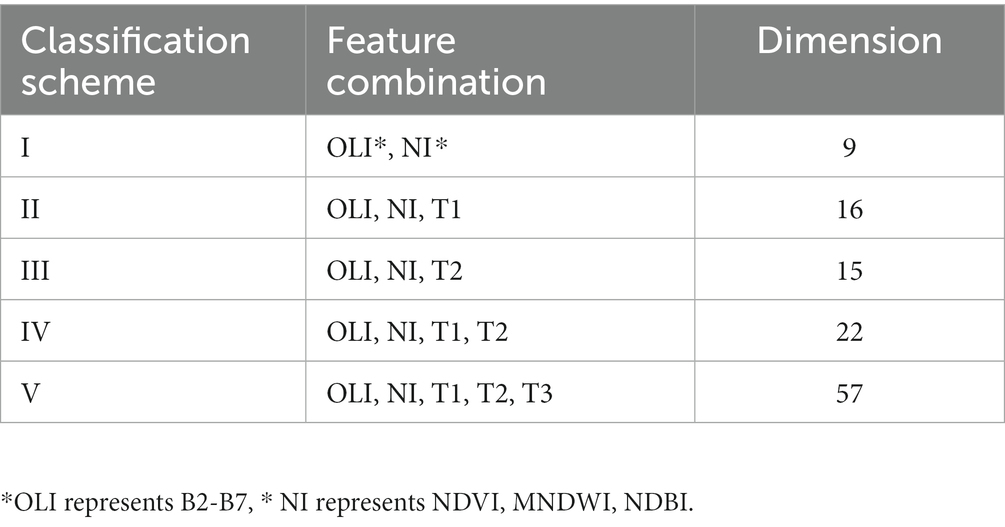
Table 3. Multi-feature combination scheme of remote sensing classification.
3.2 Classification results
To identify the optimal classification scheme, the RF algorithm was applied to the land use classification according to the five schemes outlined above. The classification results of the different schemes are presented in Figure 6. By calculating the confusion matrix (Table 4), the accuracy of the classification results was obtained. As Table 4 reveals, with the incremental addition of texture features, the overall accuracy and Kappa coefficient of classification gradually increased until finally stabilizing. Water area, construction land, and industrial and mining land, were easier to distinguish than others, maintaining a classification accuracy consistently above 85%. The classification accuracy of woodland and cultivated land initially increased, then stabilized. The misclassification of construction land and industrial and mining land was limited, with the accuracy of each model remaining above 90% consistently. The accuracy of garden land fluctuated within a range of 90 to 95%. Given that gardens cover a relatively small area, this level of accuracy was deemed acceptable, thus no further analysis was performed in this regard.
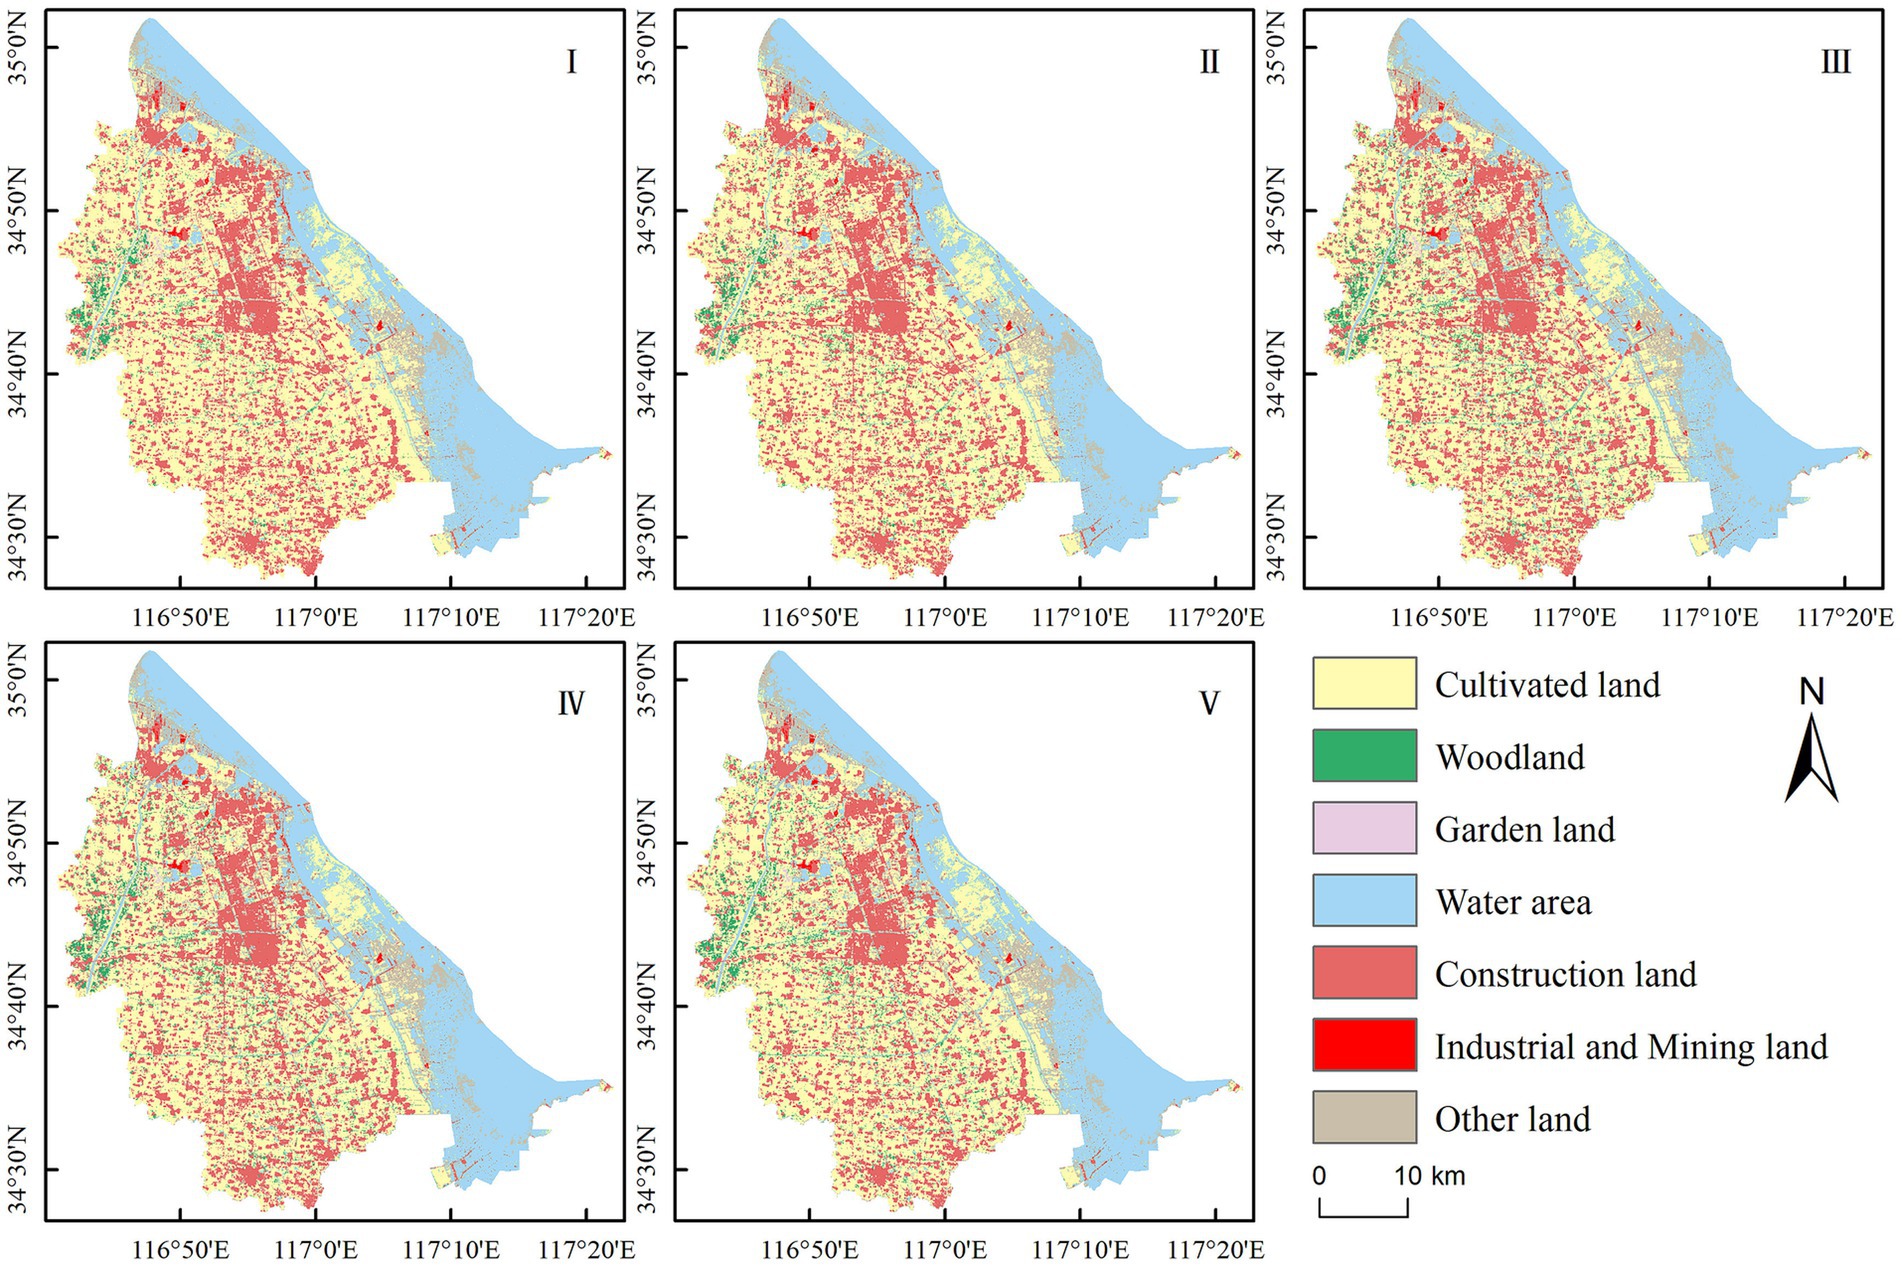
Figure 6. Classification results of different feature combination schemes based on the RF algorithm. I-V represents the five classification schemes.
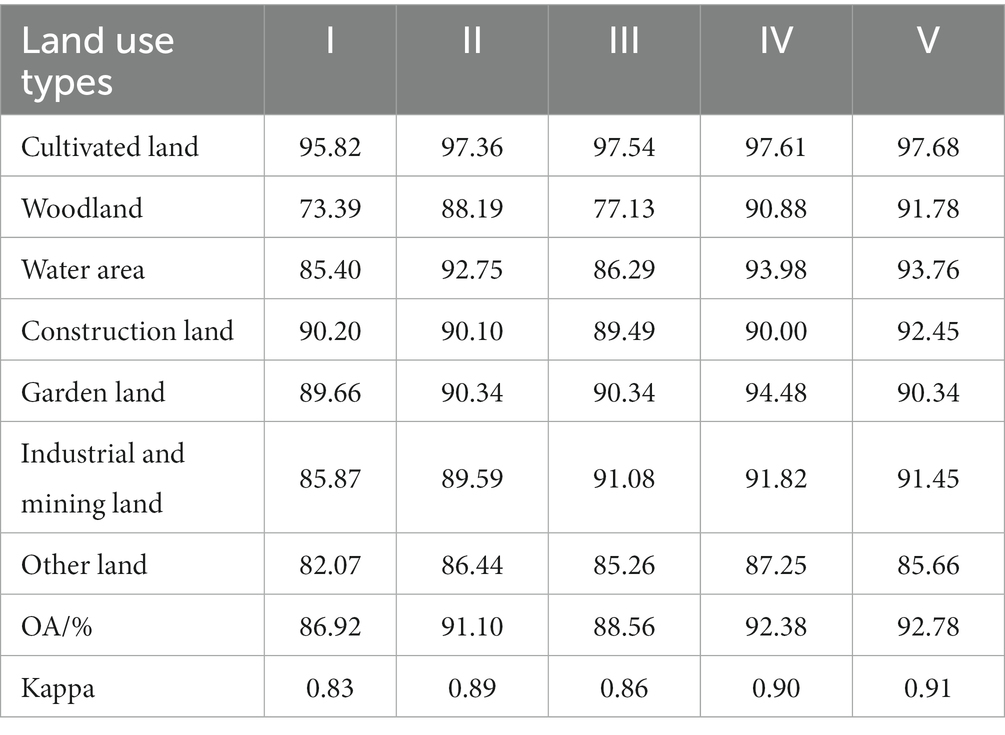
Table 4. Classification accuracy of different feature combination schemes.
Compared with Scheme I, both Scheme II and Scheme III demonstrated improvements in the overall classification accuracy and kappa coefficient, with increases of 4.18%, 0.06 and 1.64%, 0.03, respectively. The classification accuracy of cultivated land increased by 1.54 and 1.72%, respectively, upon the addition of two texture combinations, and the accuracy of woodland rose by 14.80 and 3.74%, respectively. Compared with Scheme III, Scheme II, which had larger quantitative difference index values, had a more pronounced effect on the classification of woodland and cultivated land. The improvement in woodland accuracy was more significant than that of cultivated land. Scheme IV incorporated all texture difference features of woodland and cultivated land with RA > 0.30. Compared with Schemes II and III, the classification accuracy of Scheme IV was only lower for construction land, while the accuracy for other categories surpassed that of Schemes II and III. This suggests that as the number of differences increased, the classification accuracy improved significantly. Compared to Scheme IV, Scheme V had a slightly higher overall accuracy of only 0.40%, but the improvement in accuracy was not particularly noticeable.
Based on the above analysis, incorporating the texture difference features of easily confused land types can significantly enhance the classification accuracy for a mine-agriculture compound area in a plain region. Furthermore, the greater the feature difference, the more precise the classification results become. Considering both classification accuracy and efficiency, the optimal classification scheme consists of 22 characteristic factors: OLI (B2-B7), NDVI, MNDWI, NDBI, VAR (blue, green, red, nir, swir2), CON (blue, green, red, nir, swir2), and COR (nir, swir1, swir2). Compared with the indifference feature classification model, the accuracy of the cultivated land classification improved by 1.79%, while the accuracy of woodland classification increased by 17.49%. The overall accuracy and kappa coefficient were significantly enhanced, with improvements of 6.46% and 0.07, respectively.
3.3 Comparison of classification methods
To assess the impact of varying classification methods with feature selection on land use classification in mine-agriculture compound area, the optimal feature combination scheme that composed of 22 characteristic factors was used for CART, NN and SVM methods for classification, respectively, which were designated as OS_ CART, OS_ NN and OS_ SVM. These results were then compared with the RF algorithm (marked as OS_ RF). The classification results and the accuracy were shown in Figure 7 and Table 5.
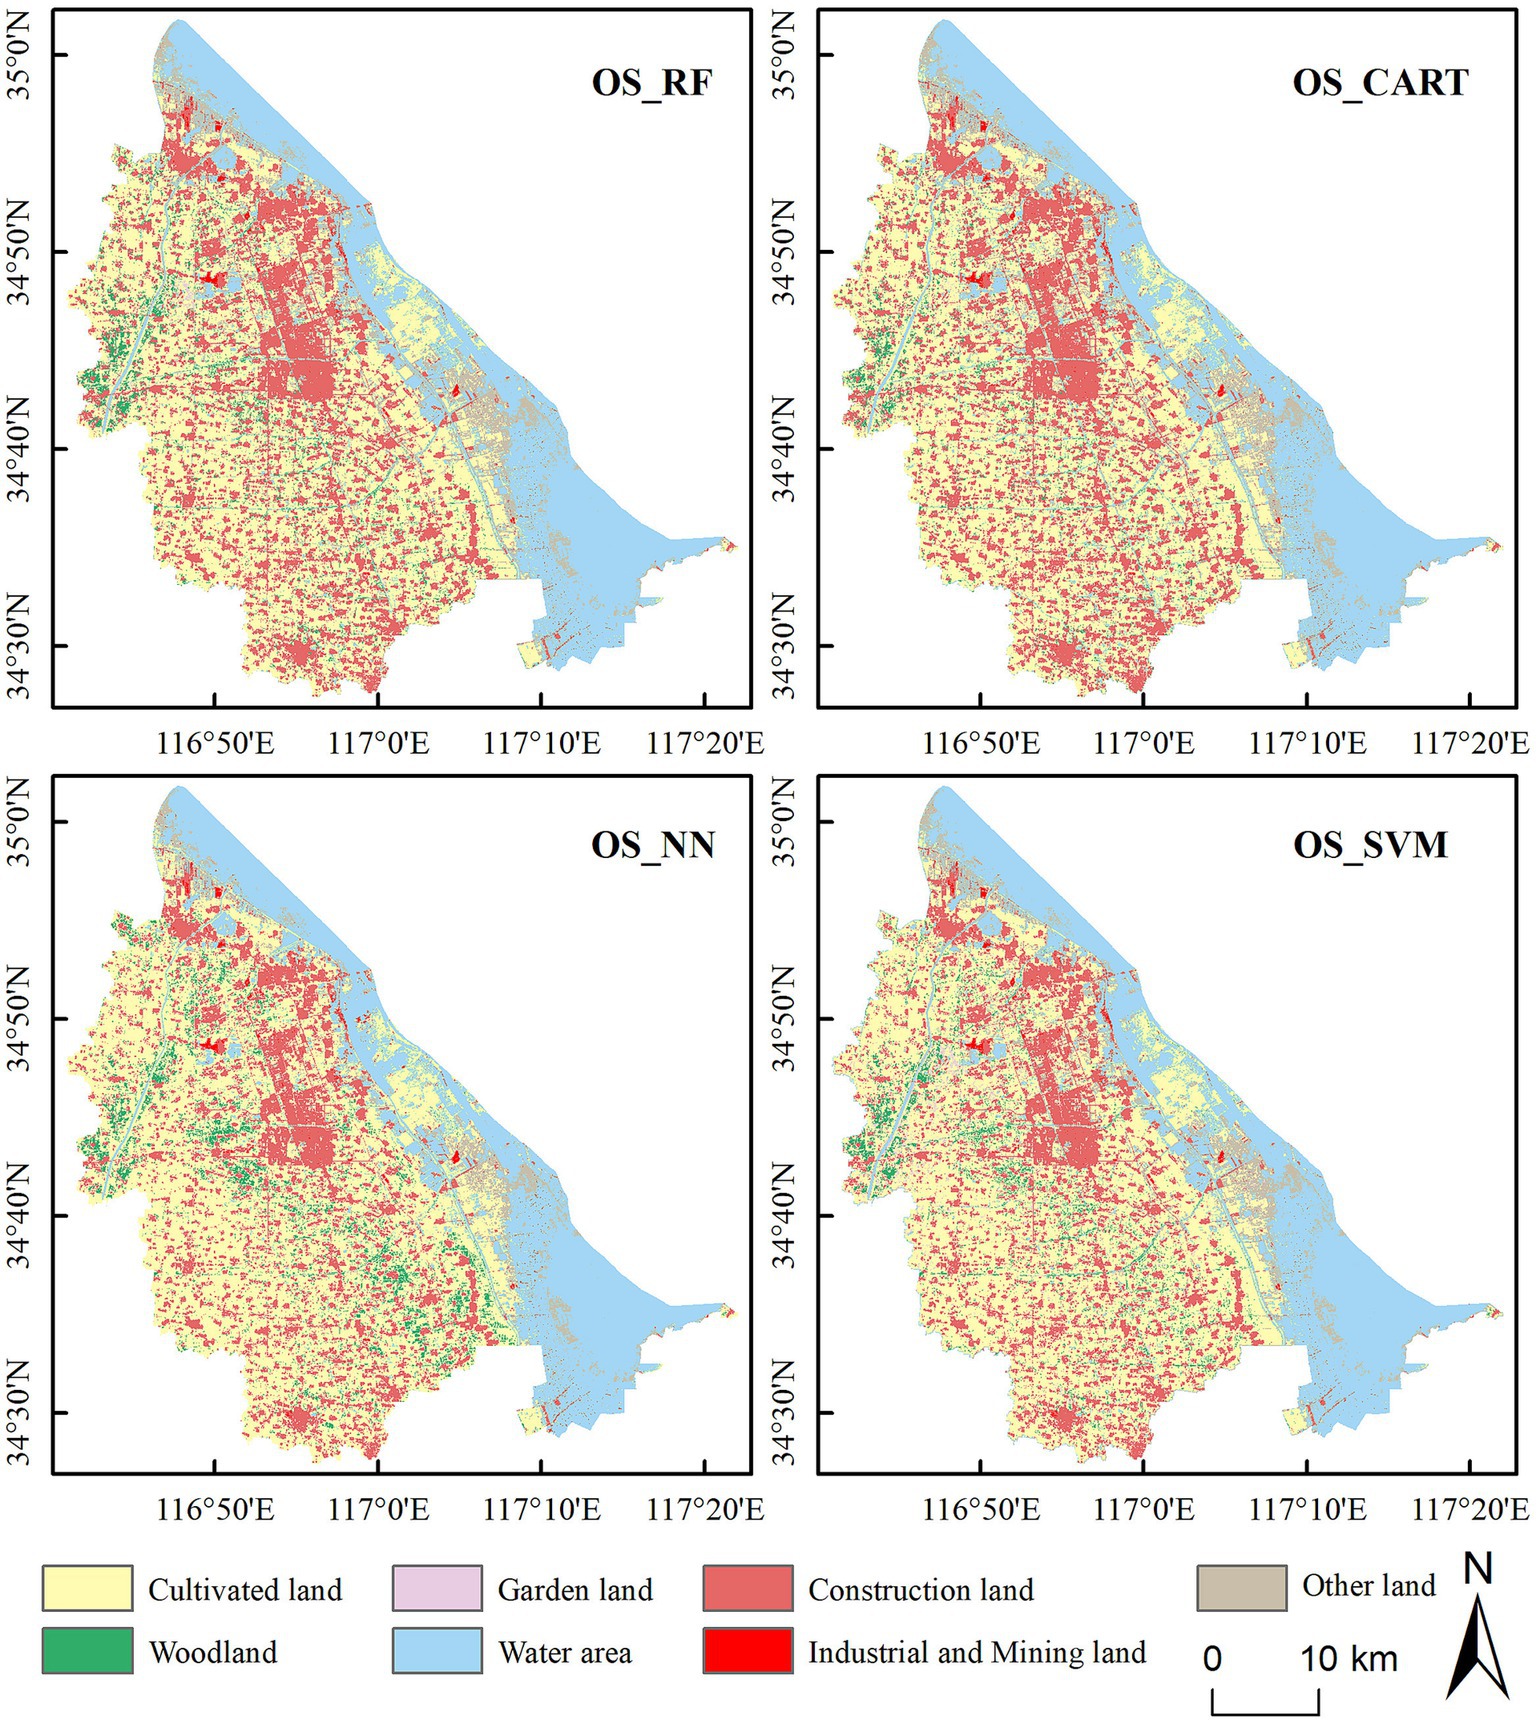
Figure 7. Classification results of different classification methods.
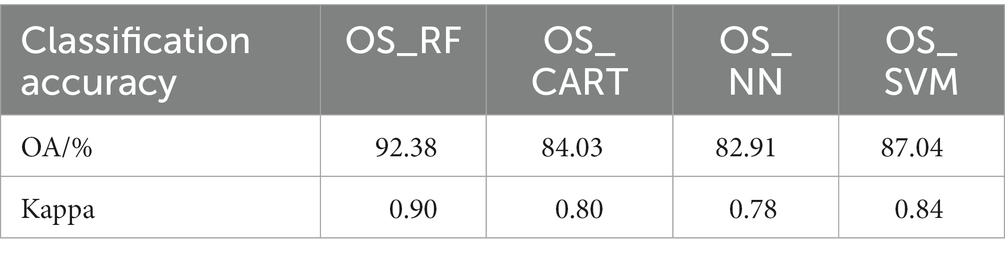
Table 5. Classification accuracy of different classification methods.
According to the classification results, the RF algorithm demonstrated the highest accuracy in the classification of mine-agriculture compound area based on Landsat 8 OLI image, achieving an overall accuracy of 92.38%. The SVM algorithm followed, with an overall accuracy of 87.04%. Both the CART and NN algorithms exhibited overfitting problems to varying degrees, yielding overall accuracies of 84.03 and 82.91%, respectively. From Figure 7, the OS_SVM method classified the land type outlines in the image smoothly and there were fewer small, fragmented patches. Only a small proportion of cultivated lands were misclassified as woodland. Conversely, using the OS_CART method, many woodlands were misclassified as cultivated lands. In the classification using the OS_NN method, many cultivated lands were misclassified as woodland types, rendering the worst overall classification effect. These results indicate that the RF algorithm is more proficient in utilizing the selected features to perform land use cover classification for the mine-agriculture compound area in plain.
4 Discussion
4.1 Impact of feature selection and classification methods on results
In this paper, we used Landsat 8 OLI remote sensing images to extract spectral data, remote sensing indices and texture features to form five classification feature combination schemes. Our objective was to classify land use types in Peixian, a typical mine-agriculture compound area in plain, using the RF classification algorithm. We analyzed the impact of different feature combination schemes on the results of land use classification through an evaluation of classification accuracy, overall accuracy, and the kappa coefficient. It became evident that the selection of features critically influences the accuracy and performance of remote sensing image classification. On the one hand, few feature parameters cannot encapsulate effective information for all land types, leading to issues in precise distinction. On the other hand, having a larger number of features is not necessarily better. An excess of features can create data redundancy, drastically increasing computational demands and leading to a “curse of dimensionality,” which will complicate the classification process and may even cause the decline of classification accuracy (Yao et al., 2012; Cadenas et al., 2013). Our results revealed that adding more feature parameters can significantly improve classification accuracy. Moreover, a greater degree of feature differentiation results in more accurate classification outcomes. Nonetheless, the overall classification accuracy of Scheme V only marginally exceeded that of Scheme IV, by just 0.40%. The main reason is that the addition of characteristic parameters increases the dimension of classification parameters, from 22 dimensions of Scheme IV to 57 dimensions of Scheme V, which leads to an overfitting issue, yielding only a negligible improvement in accuracy (Zhang et al., 2019). Through a comprehensive analysis, we found that the feature combination Scheme IV, based on the RF algorithm, provides the most effective land use classification in mine-agriculture compound area in plain. With an overall accuracy and kappa coefficient of 92.38% and 0.90 respectively, these findings align with the conclusions of other studies (Stromann et al., 2020; Zhang et al., 2023).
The paper used four classification methods to classify the land use in the mine-agriculture compound area, using an optimized feature combination scheme comprised of 22 feature factors. Figure 7 illustrates that the OS_RF method demonstrated strong classification performance, particularly in differentiating between woodland and cultivated land. The extraction of overall feature classification was more detailed, resulting in an optimal classification outcome. By constructing numerous unrelated random decision trees, the RF algorithm accomplishes data set classification through model prediction, guiding and aggregating decision trees (Teluguntla et al., 2018). Owing to its ability to set the variable contribution rate to classification, the RF classifier boasts higher accuracy than alternatives such as the standalone CART algorithm, SVM algorithm and single NN algorithm (Chan and Paelinckx, 2008; Wingate et al., 2016). These findings align with earlier conclusions stating that RF algorithms offer superior performance compared to other methods (Chutia et al., 2015; Belgiu and Dragut, 2016).
4.2 Uncertainty analysis in classification result
Currently, the integration and comprehensive use of multi-source remote sensing data is a critical aspect of remote sensing classification research (Chen et al., 2017; Judah and Hu, 2022). However, this study solely employed Landsat 8 OLI and prior knowledge to classify the land use in mine-agriculture compound area, thus limiting the data source. Due to the complexity of mixed pixels and spectral characteristics of terrestrial objects exemplified by the “same object, different spectrums” and “different objects, same image” phenomena it remains challenging to distinguish the boundary between woodland and cultivated land sections in the 30 meters resolution Landsat image. This complexity leads to instances of misclassification. Similarly, in the sample points chosen via Google Earth and prior knowledge, the “different objects, same image” factor introduces errors despite field research and auxiliary image references. Consequently, establishing a classification and identification database for land use in the mine-agriculture compound area is essential, as it can help mitigate the influence of outliers. Moreover, since the classification algorithms are pixel-based, a certain “salt and pepper” effect is unavoidable (Zhang et al., 2019; Qu et al., 2021). This effect is particularly pronounced in the distribution of woodland and garden land but decreases as the number of texture features increases. This is primarily because woodland and garden land distributions are discrete, often situated near cultivated land and residential areas, making it difficult to accurately identify mixed pixels resulting from the overlap of woodland and cultivated land. Future research will consider the spectral and texture features of multi-temporal remote sensing data. We aim to establish a model that characterizes the differences by quantifying the difference index and histogram statistics. This will more accurately reflect the degree of land type distinction. We also plan to explore remote sensing image classification methods using the RF algorithm and popular deep learning algorithms, such as 3D convolution neural network (3DCNN), long short-term memory (LSTM), transformer, and graph neural network (GNN). The goal is to enhance the accuracy of land use classification in typical plain mine-agriculture compound areas.
5 Conclusion
In this paper, we extracted spectral features, remote sensing indices, and texture features from Landsat 8 OLI images. By utilizing the RF algorithm and determining five different feature classification schemes via a quantitative difference index, we managed to extract land use types in a typical mine-agriculture compound area in Peixian, China. The results show as follows:
1. In the multi-feature comprehensive classification scheme based on RF algorithm, the quantitative difference index used to optimize the feature variables, can effectively improve the classification accuracy and efficiency of easily confused land use types. Furthermore, we observed that the greater the difference in texture features, the more accurate the classification outcome.
2. Among the four classification methods based on the optimal feature classification scheme, the RF algorithm demonstrated the most effective land use classification. With a classification accuracy of 92.38% and a Kappa coefficient of 0.90, it outperformed the SVM algorithm, CART algorithm, and NN algorithm. These findings indicate that coupling the RF algorithm with multi-source feature information can effectively classify the land use types in mine-agriculture compound area in plain.
The primary advantage of this study lies in the construction of a quantitative difference index to select differing texture characteristics for easily confused land use types, such as woodland and cultivated land. Additionally, our research verified the feasibility of the RF algorithm in land use classification within mine-agriculture compound areas. Future studies will consider using multi-temporal remote sensing data to establish the difference of spectral and texture characteristics in different seasons, thereby enhancing the accuracy of distinguishing between land use types. Methods such as quantitative difference index and histogram statistics will be adopted to achieve a comprehensive understanding of spectrum and texture, reality, and characteristics, thereby improving the accuracy of land use classification in mine-agriculture compound area.
Data availability statement
The original contributions presented in the study are included in the article/supplementary material, further inquiries can be directed to the corresponding author.
Author contributions
JX: Conceptualization, Funding acquisition, Project administration, Writing-review & editing. CC: Data curation, Validation, Writing - original Draft, Writing - review & editing. SZ: Formal analysis, Resources, Validation, Writing - review & editing. WH: Resources, Writing - review & editing. WZ: Formal analysis, Writing - review & editing.
Funding
The author(s) declare financial support was received for the research, authorship, and/or publication of this article. This research was funded by “National Natural Science Foundation of China, grant number 52374141” and “Open Foundation of Key Laboratory for Land Environment and Disaster Monitoring of Ministry of Natural Resources, China, grant number LEDM2014B06.”
Conflict of interest
The authors declare that the research was conducted in the absence of any commercial or financial relationships that could be construed as a potential conflict of interest.
Publisher’s note
All claims expressed in this article are solely those of the authors and do not necessarily represent those of their affiliated organizations, or those of the publisher, the editors and the reviewers. Any product that may be evaluated in this article, or claim that may be made by its manufacturer, is not guaranteed or endorsed by the publisher.
Footnotes
References
Abbas, A. W., Minallh, N., Ahmad, N., Abid, S. A. R., and Khan, M. A. A. (2016). K-means and ISODATA clustering algorithms for landcover classification using remote sensing. Sindh University Res. J. 48, 315–318.
Abida, K., Barbouchi, M., Boudabbous, K., Toukabri, W., Saad, K., Bousnina, H., et al. (2022). Sentinel-2 data for land use mapping: comparing different supervised classifications in semi-arid areas. Agriculture 12:1429. doi: 10.3390/agriculture12091429
Alhassan, V., Henry, C., Ramanna, S., and Storie, C. (2020). A deep learning framework for land-use/land-cover mapping and analysis using multispectral satellite imagery. Neural Comput. Appl. 32, 8529–8544. doi: 10.1007/s00521-019-04349-9
Amit, Y., and Geman, D. (1997). Shape quantization and recognition with randomized trees. Neural Comput. 9, 1545–1588. doi: 10.1162/neco.1997.9.7.1545
Azizi, P., Soltani, A., Bagheri, F., Sharifi, S., and Mikaeili, M. (2022). An integrated modelling approach to urban growth and land use/cover change. Land 11:1715. doi: 10.3390/land11101715
Belgiu, M., and Dragut, L. (2016). Random forest in remote sensing: a review of applications and future directions. ISPRS J. Photogramm. Remote Sens. 114, 24–31. doi: 10.1016/j.isprsjprs.2016.01.011
Belgiu, M., and Lucian, D. (2014). Comparing supervised and unsupervised multiresolution segmentation approaches for extracting buildings from vuer high resolution imagery. ISPRS J. Photogramm. Remote Sens. 96, 67–75. doi: 10.1016/j.isprsjprs.2014.07.002
Briem, G., Benediktsson, J., and Sveinsson, J. (2013). Multiple classifiers applied to multisource remote sensing date. IEEE Trans. Geosci. Remote Sens. 40, 2291–2299. doi: 10.1109/TGRS.2002.802476
Cadenas, J. M., Garrido, M. C., and Martinez, R. (2013). Feature subset selection filter-wrapper based on low quality data. Expert Syst. Appl. 40, 6241–6252. doi: 10.1016/j.eswa.2013.05.051
Chamundeeswari, G., Srinivasan, S., Bharathi, S. P., Priya, P., Kannammal, G. R., and Rajendran, S. (2022). Optimal deep convolutional neural network based crop classification model on multispectral remote sensing images. Microprocess. Microsyst. 94:104626. doi: 10.1016/j.micpro.2022.104626
Chan, J. C., and Paelinckx, D. (2008). Evaluation of random forest and adaboost tree-based ensemble classification and spectral band selection for ecotope mapping using airborne hyperspectral imagery. Remote Sens. Environ. 112, 2999–3011. doi: 10.1016/j.rse.2008.02.011
Chen, B., Huang, B., and Xu, B. (2017). Multi-source remotely sensed data fusion for improving land cover classification. ISPRS-J. Photogramm. Remote Sens. 124, 27–39. doi: 10.1016/j.isprsjprs.2016.12.008
Chutia, D., Bhattacharyya, D. K., Sarma, K. K., Kalita, R., and Sudhakar, S. (2015). Hyperspectral remote sensing classifications: a perspective survey. Trans. GIS 20, 463–490. doi: 10.1111/tgis.12164
Davydzenka, T., Tahmasebi, P., and Carroll, M. (2022). Improving remote sensing classification: a deep-learning-assisted model. Comput. Geosci. 164:105123. doi: 10.1016/j.cageo.2022.105123
Foroughnia, F., Alfieri, S. M., Menenti, M., and Lindenbergh, R. (2022). Evaluation of SAR and optical data for flood delineation using supervised and unsupervised classification. Remote Sens. 14:3718. doi: 10.3390/rs14153718
Gislason, P. O., Benediktsson, J. A., and Sveinsson, J. R. (2006). Random forest for land cover classification. Pattern Recogn. Lett. 27, 294–300. doi: 10.1016/j.patrec.2005.08.011
Hennessy, A., Clarke, K., and Lewis, M. (2020). Hyperspectral classification of plants: a review of waveband selection generalisability. Remote Sens. 12:113. doi: 10.3390/rs12010113
Hu, Y., Zhao, C., and Wang, H. (2008). Directional analysis of texture images using gray level co-occurrence matrix. Workshop Comp. Intell. Indus. Appl. IEEE Comp. Soc. 2, 277–281. doi: 10.1109/PACIIA.2008.279
Huang, X., Li, J., and Ding, F. (2013). Extraction information of impervious surface area based on improved NDBI. Geospatial. Information 11:63-64+77+12. doi: 10.11709/j.issn.1672-4623.2013.05.022
Huang, X., Liu, X., and Zhang, L. (2014). A multichannel gray level co-occurrence matrix for multi/hyperspectral image texture representation. Remote Sens. 6, 8424–8445. doi: 10.3390/rs6098424
Hussain, M., Chen, D., Cheng, A., Wei, H., and Stanley, D. (2013). Change detection from remotely sensed images: from pix-el-based to object-based approaches. ISPRS J. Photogramm. Remote Sens. 80, 91–106. doi: 10.1016/j.isprsjprs.2013.03.006
Inglada, J., Vincent, A., Arias, M., and Marais-Sicre, C. (2016). Improved early crop type identification by joint use of high temporal resolution SAR and optical image time series. Remote Sens. 8:362. doi: 10.3390/rs8050362
Jansen, L. J. M., and Gregorio, A. D. (2002). Parametric land cover and land-use classifications as tools for environmental change detection. Agric. Ecosyst. Environ. 91, 89–100. doi: 10.1016/S0167-8809(01)00243-2
Judah, A., and Hu, B. (2022). An advanced data fusion method to improve wetland classification using multi-source remotely sensed data. Sensors 22:8942. doi: 10.3390/s22228942
Karlson, M., Ostwald, M., Reese, H., Sanou, J., Tankoano, B., and Mattsson, E. (2015). Mapping tree canopy cover and above-ground biomass in Sudano-Sahelian Woodllands using Landsat 8 and random forest. Remote Sens. 7, 10017–10041. doi: 10.3390/rs70810017
Kumar, S. A., and Venkatesulu, M. (2019). Gramian matrix date collection-based random forest calssification for predictive an-alytics with big date. Soft Comp. 23, 8621–8631. doi: 10.1007/s00500-019-04014-2
Lambin, E. F., Geist, H. J., and Lepers, E. (2003). Dynamics of land-use and land-cover change in tropical regions. Annu. Rev. Environ. Resour. 28, 205–241. doi: 10.1146/annurev.energy.28.050302.105459
Li, N., Frei, M., and Altermann, W. (2011). Textural and knowledge-based lithological classification of remote sensing data in southwestern Prieska sub-basin, Transvaal Supergroup. South Africa. J. African Earth Sci. 60, 237–246. doi: 10.1016/j.jafrearsci.2011.03.002
Lu, W., Tong, X., and Li, D. (2022). Generalization of landcover classification in remote sensing images combining texture en-hancement, China. J. Army Eng. Univ. 1, 74–81. doi: 10.12018/j.issn.2097-0730.20211108001
Ma, Y., Jiang, Q., Meng, Z., Li, Y., Wang, D., and Liu, H. (2015). Classification of land use in farming area based on random forest algorithm. Trans. Chin. Soc. Agric. Mach. 47, 297–303. doi: 10.6041/j.issn.1000-1298.2016.01.040
Macarringue, L., Bolfe, É., and Pereira, P. (2022). Developments in land use and land cover classification techniques in remote sensing: a review. J. Geogr. Inf. Syst. 14, 1–28. doi: 10.4236/jgis.2022.141001
Mazzia, V., Khaliq, A., and Chiaberge, M. (2020). Improvement in land cover and crop classification based on temporal features learning from Sentinel-2 data using recurrent-convolutional neural network (R-CNN). Appl. Sci. 10:238. doi: 10.3390/app10010238
Navnath, N. N., Chandrasekaran, K., Stateczny, A., Sundaram, V. M., and Panneer, P. (2022). Spatiotemporal assessment of satellite image time series for land cover classification using deep learning techniques: a case study of Reunion Island. France. Remote Sens. 14:5232. doi: 10.3390/rs14205232
Otukei, J. R., and Blaschke, T. (2010). Land cover change assessment using decision trees, support vector machines and maximum likelihood classification algorithms. Int. J. Appl. Earth Observ. Geoinform. 12, 27–31. doi: 10.1016/j.jag.2009.11.002
Peña, J. M., Gutiérrez, P. A., Hervás-Martínez, C., Six, J., Plant, R. E., and López-Granados, F. (2014). Object-based image classification of summer crops with machine learning methods. Remote Sens. 6, 5019–5041. doi: 10.3390/rs6065019
Phiri, D., and Morgenroth, J. (2017). Developments in Landsat land cover classification methods: a review. Remote Sens. 9:967. doi: 10.3390/rs9090967
Qin, Y., and Song, W. (2008). The application of the feature extraction and selection to image classification. China Sci. Surv. Map. 33, 176–178. doi: 10.3771/j.issn.1009-2307.2008.01.054
Qu, L., Chen, Z., Li, M., and Wang, H. (2021). Accuracy improvements to pixel-based and object-based LULC classification with auxiliary datasets from Google earth engine. Remote Sens. 13:453. doi: 10.3390/rs13030453
Ritter, N. D., and Hepner, G. F. (1990). Application of an artificial neural network to land-cover classification of thematic mapper imagery. Comput. Geosci. 16, 873–880. doi: 10.1016/0098-3004(90)90009-I
Sertel, E., Ekim, B., Ettehadi Osgouei, P., and Kabadayi, M. E. (2022). Land use and land cover mapping using deep learning based segmentation approaches and VHR Worldview-3 images. Remote Sens. 14:4558. doi: 10.3390/rs14184558
Shi, J., Li, D., Chu, X., Yang, J., and Shen, C. (2022). Intelligent classification of land cover types in open-pit mine area using Ob-ject-oriented method and multitask learning. J. Appl. Remote. Sens. 16:038504. doi: 10.1117/1.JRS.16.038504
Singh, M., and Tyagi, K. D. (2021). Pixel based classification for Landsat 8 OLI multispectral satellite images using deep learning neural network. Rem. Sens. Appl. Soc. Environ. 24:100645. doi: 10.1016/j.rsase.2021.100645
Singh, B., Venkatramanan, V., and Deshmukh, B. (2022). Monitoring of land use land cover dynamics and prediction of urban growth using land change modeler in Delhi and its environs. India. Environ. Sci. Pollut. 29, 71534–71554. doi: 10.1007/s11356-022-20900-z
Stromann, O., Nascetti, A., Yousif, O., and Ban, Y. (2020). Dimensionality reduction and feature selection for object-based land cover classification based on Sentinel-1 and Sentinel-2 time series using Google earth engine. Remote Sens. 12:76. doi: 10.3390/rs12010076
Teluguntla, P., Thenkabail, P. S., Oliphant, A., Xiong, J., Gumma, M. K., Congalton, R. G., et al. (2018). A 30-m landsat-derived cropland extent product of Australia and China using random forest machine learning algorithm on Google earth engine cloud computing platform. ISPRS-J. Photogramm. Remote Sens. 144, 325–340. doi: 10.1016/j.isprsjprs.2018.07.017
Vapnik, V., Levin, E., and Le, C. Y. (1994). Measuring the VC dimension of a learning machine. Neural Comput. 6, 851–876. doi: 10.1162/neco.1994.6.5.851
Wilkinson, G. G. (1996). A review of current issues in the integration of GIS and remote sensing data. Int. J. Geogr. Inform. Sys. 10, 85–101. doi: 10.1080/02693799608902068
Wingate, V. R., Kuhn, N., Bloemertz, L., Phinn, S. R., and Dhanjal-Adams, K. L. (2016). Mapping decadal land cover changes in the woodlands of north eastern Namibia from 1975 to 2014 using the landsat satellite archived data. Remote Sens. 8:681. doi: 10.3390/rs8080681
Wu, W., Zhang, Y., Li, Q., and Huang, H. (2019). A hierarchical classification and iterative model based method for remote sensing classification of land cover. China. Remote Sens.Technol. Appl. 34, 68–78. doi: 10.11873/j.issn.1004-0323.2019.1.0068 (in Chinese)
Xu, H. (2005). A study on information extraction of water body with the modified normalize difference water index (MNDWI). China J. Rem. Sens. 9, 589–595. doi: 10.11834/jrs.20050586 (in Chinese)
Xu, J., Zhao, H., Yin, P., Wu, L., and Li, G. (2019). Landscape ecological quality assessment and its dynamic change in coal mining area: a case study of Peixian. Environ. Earth Sci. 78:708. doi: 10.1007/s12665-019-8747-5
Yao, X., Wang, X., Zhang, Y., and Quan, W. (2012). Summary of feature selection algorithms. China. Control Dec. 27, 161–166. doi: 10.13195/j.cd.2012.02.4.yaox.013 (in Chinese)
Zhang, L., Gong, Z., Wang, Q., Jin, D., and Wang, X. (2019). Wetland mapping of Yellow River Delta wetlands based on Mul-ti-feature optimization of Sentinel-2 images. China. J. Rem. Sens. 23, 313–326. doi: 10.11834/jrs.20198083
Zhang, N., Wu, Y., and Zhang, Q. (2015). Detection of sea ice in sediment laden water using MODIS in the Bohai Sea: a CART decision tree method. Int. J. Remote Sens. 36, 1661–1674. doi: 10.1080/01431161.2015.1015658
Zhang, F., and Yang, X. (2020). Improving land cover classification in an urbanized coastal area by random forests: the role of variable selection. Remote Sens. Environ. 251:112105. doi: 10.1016/j.rse.2020.112105
Zhang, Y., Yang, W., Sun, Y., Chang, C., Yu, J., and Zhang, W. (2021). Fusion of multispectral aerial imagery and vegetation indices for machine learning-based ground classification. Remote Sens. 13:1411. doi: 10.3390/rs13081411
Zhang, Q., and Zhang, P. (2019). An uncertainty descriptor for quantitative measurement of the uncertainty of remote sensing images. Remote Sens. 11:1560. doi: 10.3390/rs11131560
Keywords: land use classification, random forest, feature selection, texture, mine-agriculture compound area
Citation: Xu J, Chen C, Zhou S, Hu W and Zhang W (2024) Land use classification in mine-agriculture compound area based on multi-feature random forest: a case study of Peixian. Front. Sustain. Food Syst. 7:1335292. doi: 10.3389/fsufs.2023.1335292
Edited by:
Haoming Xia, Henan University, ChinaReviewed by:
Xi Nan, Chinese Academy of Sciences (CAS), ChinaYang Hu, Ningxia University, China
Linghui Guo, Henan Polytechnic University, China
Copyright © 2024 Xu, Chen, Zhou, Hu and Zhang. This is an open-access article distributed under the terms of the Creative Commons Attribution License (CC BY). The use, distribution or reproduction in other forums is permitted, provided the original author(s) and the copyright owner(s) are credited and that the original publication in this journal is cited, in accordance with accepted academic practice. No use, distribution or reproduction is permitted which does not comply with these terms.
*Correspondence: Jiaxing Xu, xujx@cumt.edu.cn