“Where everybody knows your name”: How regulars at farmers' markets differ from less-frequent shoppers
 Tracy Stobbe
- School of Business, Trinity Western University, Langley, BC, Canada
A survey of consumers at three farmers' markets (FMs) was done near Vancouver, British Columbia. The markets span urban and suburb locales, and the survey's 234 respondents were asked questions about shopping behavior, attitudes toward FMs, and demographic information. The focus of the analysis is on the differences between regulars and non-regulars to the market, where a regular is considered a shopper who shops weekly or bi-weekly. The results show that regulars spend more ($46.36 vs. 33.19 for non-regulars), are much more likely to expect higher prices compared to grocery stores than non-regulars, and buy more products (4.15 vs. 3.1). Regulars also value attributes of FMs differently: they value variety, organic products, and being locally-grown more highly. Organic purchasing behavior is also significantly different with regulars much more likely to say they “always” or “usually” buy organic products. As this is the first study to explicitly analyze regulars at FMs, suggested research directions and methods are offered to help guide future research.
1. Introduction
In the first decade of the twenty-first century, there was tremendous energy around the growth of farmers' markets (FMs). In the US, between 2000 and 2011, the number of markets grew from 2,863 to 7,175 (a 151% increase) (USDA, 2019). Many cities, in both Canada and the US, saw a dramatic expansion in the number of FMs and big surges in the number of consumers patronizing them (Daflos, 2013; Shore, 2014). Growth was also observed in other countries (Bukenya et al., 2007).
However, this growth appears to be slowing. From 2011 to 2019, the number of markets in the US increased just 22.3% (from 7,175 to 8,771) and many observers are now concerned with over-saturation (Zezima, 2011; Helmer, 2019). In Vancouver, a 2013 report by city staff had proposed increasing the number of markets up to 22 by the year 2020 (Daflos, 2013). This did not happen and in the 2021 peak summer season, there were nine markets operating (Smit, 2021). In the whole province of British Columbia there were 134 markets operating in 2021 (BCAFM, 2022).
Likewise, publication of studies of FMs' consumers has slowed in the past 10 years. Fewer articles which detail the spending habits, motivations, and demographics of FMs customers are appearing which opens up the possibility that as the local food system develops, the role and appeal of FMs is changing without being documented. Thus, continuing research into FMs is needed to record whether such a shift in preferences and demographics is occurring or not. One broad purpose of this study is continue to document FMs' consumer profiles as time goes on.
A more targeted purpose of this work is to examine questions surrounding the shopping habits of FM regulars—those who shop weekly or biweekly—which has not been explicitly addressed in the academic research previously. Because this is the first published study to examine FM regulars, it is preliminary in nature and can serve a role in suggesting future avenues and awakening the curiosity of other FM scholars. The main question this study sought to answer was: Are these consumers different from less-frequent patrons? This information is valuable to FMs' managers as they attempt to convert more customers into regulars. Managers might like to know if being a regular is associated with other characteristics, such as whether regulars spend more, have fewer children, or are different in their mode of transportation to the market. These results could also be of interest to scholars of consumer behavior. They might be fascinated to learn if regulars have different attitudes toward the market or find different amenities important compared to less-frequent shoppers. This study could help craft better business practices when it comes to market operations, advertising and marketing efforts, and local food advocacy.
The rest of this paper is laid out in a traditional way. The next section examines the published literature on this topic, focusing on the key variables being examined here, including demographics of consumers, spending habits, and how they value market amenities. The following section outlines the survey methodology and sampling procedures, including a sub-section on analysis and statistical methodology. The results section comes next with key statistical tests and comparisons highlighted. A discussion section highlights interesting issues raised by the study, implications, limitations, and areas for future study. Finally, a conclusion ends the paper.
2. Literature review
Studies of FMs' consumers have been published in academic journals, extension reports, and by governments at various levels. Though some variation is inevitable when dealing with different countries and populations, the picture that emerges out of the literature on FMs consumers is surprisingly stable and consistent. Surveys conducted at FMs tend to revolve around a fairly stock set of questions which includes items purchased, amount spent, frequency of shopping, attitudes toward FMs, and various demographic characteristics (for example, see Govindassamy et al., 2002). The amount spent generally hovers around $35 per visit (see Table 1).
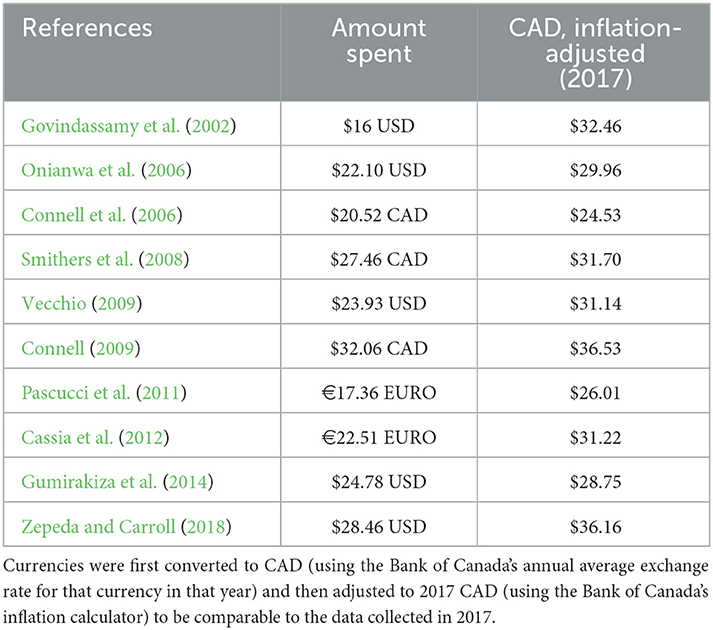
Table 1. Literature on amount spent.
The demographic profile of a FM consumer that has emerged across many studies in the United States seems to be one of a middle-aged women with above-average education and income (McGarry Wolf et al., 2005; Murphy, 2011; Buman et al., 2014). For instance, Baker et al. (2009) found their average survey respondent at two Vermont FMs was a women (70.4% were female) in her early 50s. In a study by Govindassamy et al. (2002) of New Jersey FM patrons, 83% were female, most were at least 51 years old, 62% had graduated from college, and 84% were Caucasian. Gumirakiza et al. (2014) found that 16 FMs in Nevada and Utah attracted an average respondent who was female (66%), with a college degree, and an average age of 42. Henneberry and Agustini (2004) and Henneberry et al. (2009) similarly discovered that Oklahoma FM consumers were mostly women (79%), aged between 51 and 65, Caucasian (88%), and educated (with more than 50% having a college degree and 21% having a graduate degree). Zepeda (2009) also found women were more likely to be FM customers, but she rejected any education, age or income effects.
These trends are enduring around the world. Burns et al. (2018) found educated women were the most common consumers at Australian FMs, while both Pascucci et al. (2011) and Cassia et al. (2012) found older women at Italian markets. In China, a similar result was found by Chen and Scott (2014). And in Canada—the setting for this study—comparable results have been found by Connell et al. (2006), Smithers et al. (2008), Feagan and Morris (2009), and Stobbe (2016).
Demographics aside, the literature is also rather uniform on the question of why people shop at FMs, though many different terms are used to describe this result. In essence, FM shoppers are commonly driven by a set of environmental, economic, and social values which lead them to prefer local food (Connell et al., 2008; Giampietri et al., 2016). Customers usually believe that local food is fresher and better for the environment, commonly because local food had to travel fewer “food miles”. Customers also want to support the local economy through sustaining local farms and businesses, and to socially enhance the local community (Burns et al., 2018).
The concept of “local” is ill-defined for FM consumers (Smithers et al., 2008; Thilmany et al., 2008; Carroll and Fahy, 2015) and is also regularly conflated by ideas of organic production. In some studies, local is defined by the researchers as within a specific distance or travel time, and others use political boundaries such as within a county, state, region, or province. The US Department of Agriculture also reports there is no pre-determined distance to define local, but that local food systems should connect farms and consumers at the point of sale (USDA, 2022). Consumers themselves have disparate definitions of what constitutes local. To add to these difficulties, organic production (whether certified organic or not) is frequently associated with local production and some consumers use these terms interchangeably. Vendors at FMs who are not certified organic will regularly post “no spray” or similar signs which signal environmentally-sensitive production methods, and rely upon the high-degree of trust that most FM customers have in the vendors (Smithers et al., 2008; Feagan and Morris, 2009; Burns et al., 2018). This has led to some instances of unscrupulous behavior where imported food is fraudulently labeled as local (Denne and Foxcroft, 2017). In sum, research on FM consumers is plagued by problems of definitions over what is considered local, both in the minds of researchers and in the minds of the people being studied. The current study has not addressed these issues—the survey used the term “locally-produced” without offering a definition—but it is worth acknowledging this methodological difficulty.
Some researchers are starting to question the romanticism that is built around FMs and alternative food systems in general (Forssell and Lankoski, 2015), including analyzing the problems with confounding localness with moral goodness. Born and Purcell (2006) call this the “local trap”—where activists and researchers assume the local scale is equivalent to desirable outcomes ecologically, for food quality, and for justice and democracy concerns. They warn that the opportunity cost of confusing means with ends is that other options—which may be more effective in achieving a desired outcome—are ignored. Additionally, researchers have pointed out the pitfalls of using “food miles” as a metric of sustainability (Coley et al., 2011).
Surveys at FMs usually ask about the frequency with which a respondent shops at the market. Most studies find that FMs attract a significant number of “regulars”—shoppers who attend with high frequency and thus exhibit a high degree of loyalty to the market. Unfortunately, there is no consistent use or definition of what constitutes a “regular” in the literature. This study uses a definition of weekly or fortnightly shopping. Using this definition, the most comparable findings in the literature are: 71% are regulars in New Jersey (Govindassamy et al., 2002), 55% are regulars in Oklahoma (Henneberry and Agustini, 2004), 92% are regulars in the Lombardy region in Italy (Cassia et al., 2012), and 83% are regulars in Ontario (Feagan and Morris, 2009). Also in Ontario, Smithers et al. (2008) report a weekly attendance of 51.5%. Despite this being a commonly recorded variable, little further analysis is reported in the literature, which provides a motivation for the current paper.
Besides amount spent, two additional variables related to money and prices were part of the current survey. The first is expectations of prices at FMs—whether they were higher, lower, or the same as at grocery stores. Past studies generally show that a majority of consumers perceive prices to be higher at FMs (Murphy, 2011; Burns et al., 2018) but that price is a minor consideration for shoppers (Feagan and Morris, 2009; Henneberry et al., 2009). Incidentally, the question of whether prices at FMs are actually higher than grocery stores has not been settled. In a price analysis, Vecchio (2009) found that Whole Foods was 5% lower than the FM prices and Safeway was 7% cheaper. A study by Pesch and Keeler (2015) found no statistically significant differences between grocery stores' and FMs' prices. Claro (2011) also asserts that price differences are exaggerated, especially when considering organic produce.
The second additional variable related to prices in this study is concerning willingness to pay (WTP) for FM food over grocery story food. The contingent valuation literature in economics—which tries to determine WTP for goods and amenities through surveys and choice experiments—is deep and complex. Researchers that have applied these techniques to the question of local food have generally found positive (though small) affects (Carroll et al., 2013). Lev and Stephenson (1998) found just a $0.06 WTP price premium (on a $1 item) for local food among a general survey of the population, but found FM consumers were willing to pay $0.29 more. Adams and Adams (2011) found that 86% of their FM subjects were willing to pay a local premium (on a $1 item); 31% would pay between one-third and two-thirds more, 26% would pay between two-thirds and twice as much more, and 11% would pay more than twice as much. A Kearney report on local food (Kearney, 2013) reported that a majority of consumers were willing to pay more for local food; the premiums they were willing to pay were more modest than in Adams et al., though: 38% said they would pay up to 5% more, 24% said up to 10% more, and just 8% indicated a local premium of more than 10%. Berg and Preston (2017) found a local premium between 2.1 and 8%, depending (positively) on age and income. Finally, Printezis et al. (2019), in a meta-study of 35 other WTP studies, concluded that a local premium exists and varies between 41.4 and 52.2%.
The current study did not ask about local food per se, but instead asked about WTP for FM food over grocery store food. The methodology used was relatively simple—an open-ended question soliciting the respondent's best guess at their preferences and habits, in percentage terms. Due to this lack of sophistication, this variable is not highlighted in the current work, but it does add to the literature about FM consumers and how other variables are related to this one.
3. Methodology
3.1. Sampling methods
The survey was conducted during the summer of 2017 at three weekly FMs in or near Vancouver, BC, Canada. These markets were the Trout Lake Farmers' Market (Vancouver), the Langley Community Farmers' Market, and the Abbotsford Town and Country Market. A total of 234 surveys were completed on 11 different market days from June to September, with three market days in Vancouver, four market days in Langley, and four market days in Abbotsford. Most collection days were in June or July (which represents the peak of farmers' markets growing seasons) but one collection day (in Abbotsford) was conducted in early September.
The survey was conducted by either the author or an undergraduate research assistant, by inviting people to participate as they left the market. The 10-min questionnaire was oral and responses were recorded by the researchers using a clipboard. It was approved by the researchers' university's Human Research Ethics Board (HREB), operating under standards established by the Social Science and Humanities Research Council of Canada (SSHRCC), the main government body for funding and regulating research in Canada.
Since a truly random sample of shoppers was not possible, several steps were taken to try to limit selection bias. As most markets had several points of egress, researchers would station themselves at different points when working in tandem, or would vary their positions when surveying trips were made alone. The Langley and Abbotsford markets were less busy and so researchers were able to invite the majority of shoppers leaving the market to participate in the survey. The Vancouver market, conversely, is substantially larger and attracts many more people per week; therefore, in principle, more intentionality would be required to randomly select participants. However, researchers also found that Vancouver shoppers declined to participate far more often than at other markets. Thus, in practice, researchers were still able to approach the majority of shoppers leaving the FM in Vancouver in the sampling window each day. The rate of participation for Langley and Abbotsford was 74 and 77%, respectively, but it was only 23% in Vancouver. This opens up the possibility of greater non-response bias from Vancouver, although, as will be seen below, the results are quite consistent on many variables.
3.2. Locations
These three markets were chosen because they provide a cross-section of different farmers' markets types. They can be divided into urban and suburban, but perhaps a more telling distinction is to divide them into three types: well-established, large and thriving (Vancouver); well-established, small but secure (Abbotsford); and a relatively new market, struggling to attract consumers (Langley).
The (Vancouver) Trout Lake Farmers' Market, has been operating since 1995 and is one of the province's most successful markets with a large and stable number of vendors (~60) (VFM, 2017, n.d.). It is situated in the city, near residential neighborhoods, and is easily accessible by car or public transit as it is adjacent to an arterial road. It is open Saturday mornings, closing in the early afternoon.
The Langley Community Farmers' Market and the Abbotsford Town and Country Market represent suburban settings for markets. The Langley market, started in 2009, was situated in 2017 on a campus of a small university, and hosted ~30 vendors. It was convenient for drivers as it had ample parking and was located on the busiest road in the municipality. However, it was not near major residential areas. In 2017, it was open on Wednesdays from noon to 4 p.m.
The Abbotsford market started in 2004 and attracts about 30 vendors per week. In 2017, it was located in a commercial area, although residential neighborhoods were not far away. It was open Saturday mornings. Both Langley and Abbotsford markets were technically accessible by public transit, but the public transportation infrastructure is not well used in either municipality and bus routes are limited and infrequent.
3.3. Survey and coding
The survey took ~10 min to complete. Information was recorded on the behaviors of shoppers (including a list of items purchased, amount spent, and how they got to the market that day), questions concerning their values and beliefs surrounding FMs (measured on Likert scales), and detailed demographic information (see Table A1 for a list of variables. For a copy of the survey, please email the author).
The raw survey data was entered into a spreadsheet and several variables were coded into new variables; for instance, the individual items that consumers bought were categorized into eight bins including produce, dairy/cheese, baked goods, plants/flowers, etc. Respondents provided their postal code which allowed two distance variables to be created: distance via roads, and direct distance measured in a straight line. In the demographic section, the survey asked about household income levels. This question was refused the most often of any question-−25 respondents declined to answer it. In the analysis therefore, to capture wealth levels, some models were run which used the income variable while other models used education levels as an (imperfect) proxy variable for wealth.
3.4. Analysis methodology
Standard statistical techniques were used to analyze the results, including two-sample t-tests, chi-square tests for differences between groups, and OLS regression. The statistical software package STATA was employed. Multivariate regression was used to analyze the quantitative variables such as amount spent and distance traveled to reach the FM. The regression model is:
Routine checks for common problems facing multivariate regression analysis were performed, such as tests for multicollinearity.
In addition to linear regression, logistical regression was used to analyze the categorical dependent variables using the following functional form:
As the key focus of the paper is how regular patrons of FMs differ from non-regulars, this model type is central to the analysis. Marginal effects of those model's results were also calculated, evaluated at the mean of continuous variables.
The hypotheses for the analysis can be found in Table A1. In general, the directions of the hypotheses (signs on the coefficients) line up with both past literature in this area and with common intuition; for example, it is hypothesized that people who say buying local is very important to them will spend more at the FM. When considering the factors that are associated with being a regular shopper at a FM, the key variables of interest include how much they spend, how they get to the market, what types of products they buy, and major demographic trends.
This survey included questions that ask respondents about their attitudes toward farmer's markets; in particular, their preferences and priorities about key features of the market and its products. The choice of which specific characteristics to include was made based on past FM literature which has shown a high degree of uniformity in this regard (for instance, see Baker et al., 2009; Buman et al., 2014; Zepeda and Carroll, 2018). The questions in this study could be grouped as food/product-based characteristics—such as freshness of the produce, production methods (organic or not), variety of produce available, etc.—and market-based characteristics—such as cleanliness of the market, convenience of location and hours, social atmosphere, etc. These responses were coded using a simple ordinal scale where 1 was used for “not important,” 2 was used for “slightly important,” 3 was used for “moderately important,” and 4 was used for “very important.” Though some past studies which used similar questions have calculated and compared means of the recorded data, this method is not appropriate. Since the scale is qualitative and thus there is no objective measurement taking place, it is inappropriate to assume that all respondents would hold the same criterion for classifying something as “very important”, or any other category. Thus, in this study, these variables are treated as categorical variables in regression models or are analyzed using other appropriate methods such as chi-square independence tests.
In some parts of the analysis, a cut-off is employed at $30 to differentiate “low spenders” from “high spenders”. This cut-off is admittedly a choice made by the author in an attempt to profile different customer types for practical applications of this research for use by FM managers. The $30 cut-off is close to the average spent at FMs found across many studies (of $30.85) (see Table 1). Another justification for this cut-off amount is it is a reasonable amount to differentiate those shoppers who are either casual visitors to the market or just purchasing a few items, from the more serious shoppers. Of course, a more robust way of analyzing spending would be to use multivariate regressions which then control for many factors—which is why that analysis method is principally employed in this study. The $30 definition is used primarily as an avenue to make the analysis more understandable and practical for non-specialists who do not possess advanced statistical educational backgrounds.
4. Results
Overall this study found a similar archetype of consumers at FMs compared with many other studies in the literature. The average consumer is female, white, well-educated, very interested in fresh and organic food, is not particularly interested in seeking out inexpensive food, and someone who shops regularly at the FM (see Table 2 for summary statistics).
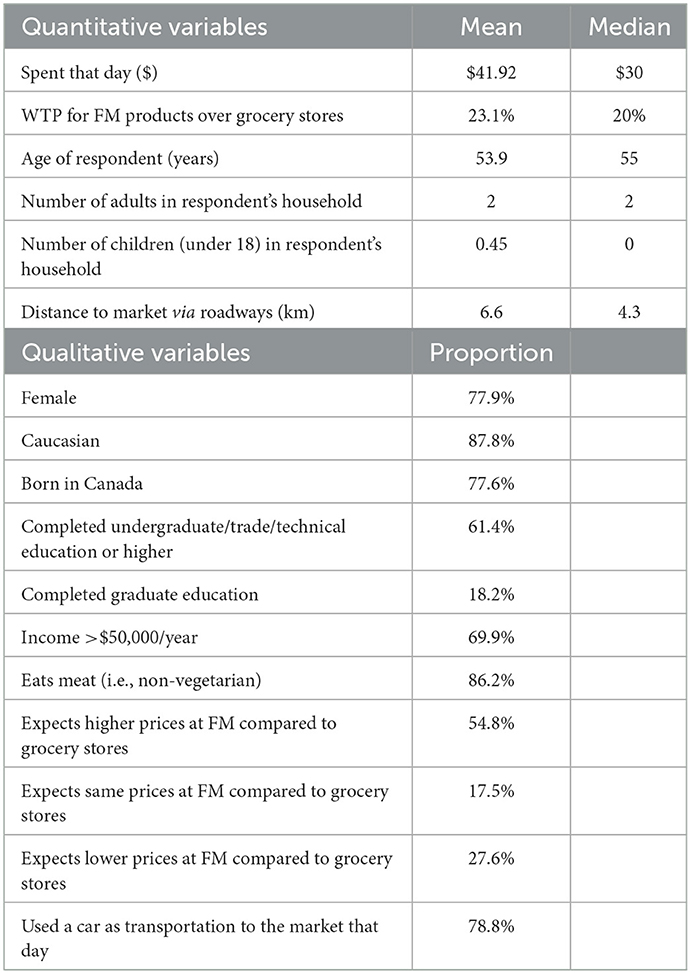
Table 2. Summary statistics of respondents, n = 234.
4.1. WTP and price premium
The average amount spent at an FM was nearly $42; the median was lower ($30) owing to the fact that a small number of people (5%) spent more than $100. The Vancouver market witnessed higher spending with an average of $62.50 (median $50), while the Langley and Abbotsford markets saw more moderate spending at $31.38 and 31.47, respectively (with a median of $25 at both markets).
More than half the shoppers (55%) expected to pay higher prices than at a grocery store, but when asked how much more, two-thirds of respondents reported a willingness to pay of 20% or less as their top premium. This low stated WTP premium may reflect real preferences, but it may also reflect uncertainty of how FM prices stack up against grocery stores in the minds of consumers (refer back to the literature review section for a discussion of how price comparisons between FMs and grocery stores are scarce and inconclusive). In addition, the methodology of the survey may impact on this result—the survey used a simple, open-ended question, as opposed to a complex choice experiment set-up. Putting aside these issues of interpretation and methodology, the current study's results on price expectations being higher than grocery stores is in keeping with past published research.
This WTP price premium was significantly related to respondents' opinions about whether FM products were more expensive compared to grocery stores products (p-value of 0.0003 on a chi-square test). Not surprisingly, those with higher WTP (30–100% price premium) are more likely to believe FMs have higher prices. Conversely, those with the lowest WTP (of 0–10% price premium) were less likely to believe prices are higher and much more likely to believe prices are lower at the FM. This makes perfect sense: if those with a low WTP believed FM products commanded a large premium, they wouldn't shop there. Another possibility is that the question order influenced how people answered. Because the price expectations question came before the WTP question, people who had already expressed a belief that FM products are more expensive may have felt a need to report a higher WTP in order to make their presence at the market logical to themselves and avoid cognitive dissonance.
In sum, we see shoppers at FMs are generally not there to find “a deal”. They tend to view FMs as more expensive and to have an explicit preparedness to pay more for the products on offer.
4.2. Spending regression model
To further explore what factors are correlated to the amount spent at the FM, an OLS regression model was created with variables including frequency of shopping, opinions about the importance of some market attributes, organic buying preferences, and several demographic variables (see Table 3). The three factors with the largest effect on spending are choosing organic food always, having higher education, and rating local food for environmental reasons as a “very important” attribute of the FM. If a respondent chose organic food always, the model reports that they spent $27.42 more on average than those who do not always choose organic. Respondents with an undergraduate or trade degree are found to spend $10.18 more than those without an undergraduate degree, and those with graduate education spend $16.20 more on average. Finally, those who rated local food as a “very important” attribute of the FM spent $13.35 more on average than others with less important ratings.
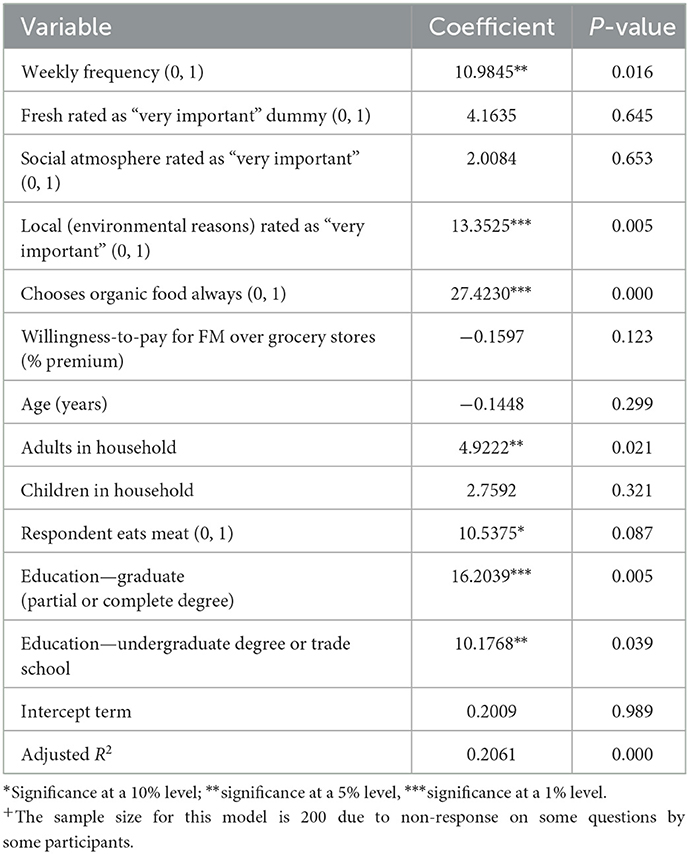
Table 3. OLS regression model of spending ($) as dependent variable, n = 200+.
Demographic variables do not loom large in explaining consumer spending at FMs. High levels of education does play a role, as previously discussed, but age is not significant. Gender was also highly insignificant (and removed from the model early on). The gender profile of respondents being predominantly female (78%) (Table 2) is perhaps exaggerated. It was observed by the surveyors that when male-female couples were invited to take the survey, it was heavily skewed toward the female volunteering and thus having her data be recorded. It is unknown to what extent this phenomenon has occurred and influenced the results of other studies in the literature which found a higher proportion of female shoppers. But in any event, gender was not statistically significantly related to spending.
If the responses are broken down into sub-groups based on their spending, it is possible to compare low spenders (those who spent up to $30) with high spenders (those who spent in excess of $30). Surprisingly, perhaps, there are not many measured differences between these groups (see Table 4). The only statistically significant difference (employing a two-sample t-test) is that high spenders are significantly more likely to be regulars to the market. This result reinforces that investigating the differences between regulars and non-regulars is a potentially fruitful place to learn about FM shoppers.
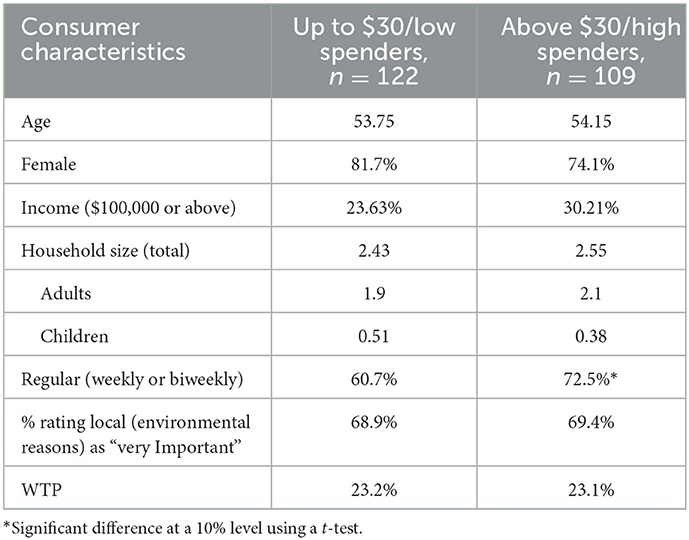
Table 4. Categories of spending.
4.3. Analyzing regular shoppers
Regular shoppers (comprising 66.2% of the sample) are defined as those who identified as weekly or biweekly (fortnightly) shoppers; conversely, non-regulars (comprising 33.8%) are all other categories, including monthly, one-to-three-times per season, and first-time shoppers. Table 5 lists different measures related to spending, WTP, and price expectations and how these vary with frequency of shopping at a FM. It shows that frequent shoppers are buying more items at the market on average and are doing so expecting it to cost them more than a traditional grocery store would cost.
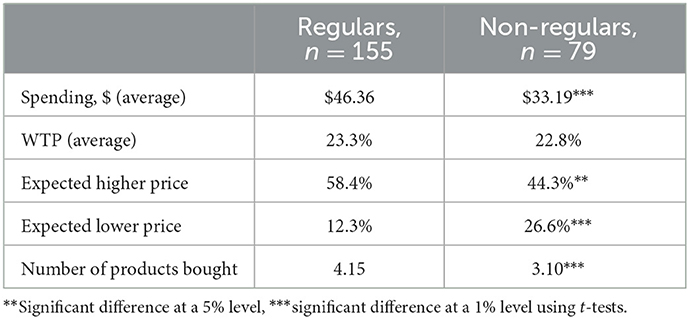
Table 5. Regulars vs. non-regulars on spending, WTP, and price expectations.
As mentioned in the literature review, it is not well-established whether FMs' prices are in fact always, or even usually, higher or not (the limited number of published studies shows a great deal of variability, according to geographic location of the market, season, and study methodology). A potential implication to draw is that perhaps sellers at FMs do not need to be overly concerned about price-matching competing products at grocery stores in order to keep their regulars as patrons. Competition within the FM, between different vendors selling similar products, may be more relevant than competition from grocery stores outside it. However, these FMs are not particularly large—the Langley and Abbotsford markets in particular had only about 30 vendors. There were often only two to four vendors selling a variety of vegetables with the balance of the vendors selling dairy, bakery, specialty artisan products, crafts, or flowers. Therefore, it may be more accurate to categorize the FM as an oligopoly rather than a competitive market. In particular, the Abbotsford market was explicitly managed to limit competition in order to keep the vendors happy and returning (Fatkin, 2017). Be that as it may, it is clear from the data that two-thirds of the survey respondents were regulars and thus, were willing to pay the prices posted at the FMs. Whether the FMs would have a great number of customers in total if prices were lower is an open question and is impossible to answer with the current survey data.
The regulars did not have a higher stated WTP compared to non-regulars, even though a significantly higher proportion of them said they expected to pay more at the FM compared to grocery stores. It is important to remind ourselves that economists generally consider stated WTP to not be as accurate as revealed WTP. Even though regulars show no difference on stated WTP, their revealed preferences are displayed through actual spending which is significantly higher for regulars vs. non-regulars. Assuming these shoppers are well-informed and rational, one can conclude that they are willing to pay more for FM products.
On demographic measures, regulars show only a few differences from non-regulars (see Table 6). They tend to be older, have a smaller total household size (due to fewer children living at home), and they tend to live closer to the market. Their closer proximity to the market, however, does not translate into different choices for how they get to the market compared to non-regulars. On all transportation options (car, walk, bike, or public transportation), there are no significant differences between regulars and non-regulars. Regulars also do not show any differences on measures related to race or education from non-regulars.
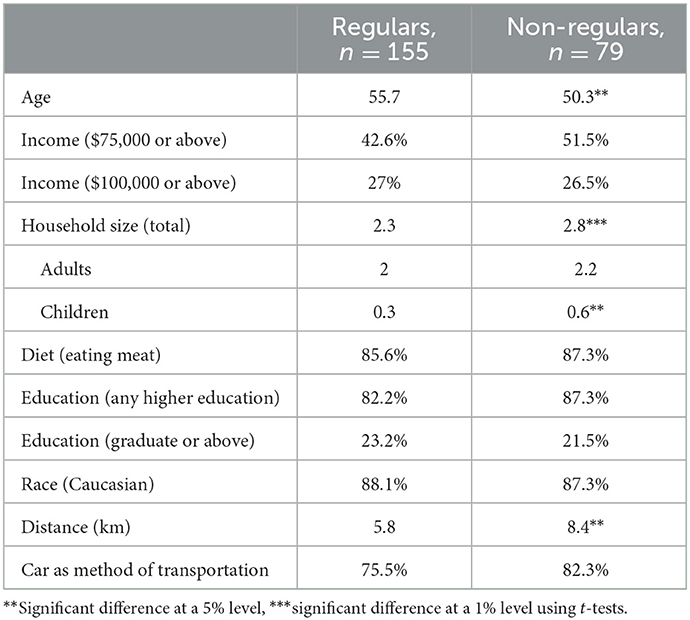
Table 6. Demographics of regular vs. non-regulars.
Regular shoppers value a few attributes of FMs significantly higher than non-regulars (see Table 7). Though both groups say freshness is of the utmost importance (with 94 and 95% rating this attribute as “very important”), having a high degree of variety is significantly more important to regulars. A plausible theory to explain this is that regulars may rely upon the FM for their fresh produce needs and thus deny themselves the variety available at most grocery stores. Therefore, variety at the FM is more desired by them than their non-regular counterparts who shop more broadly.
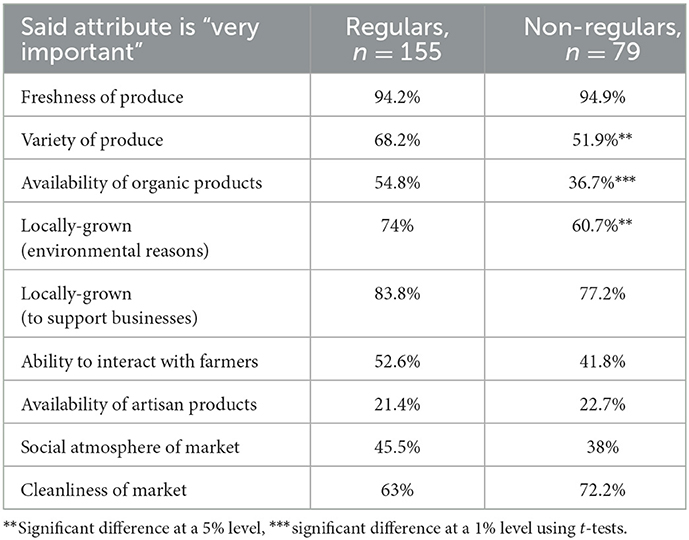
Table 7. Attributes toward farmer's markets for regulars vs. non-regulars.
The availability of organic products was also rated as considerably more important by regular shoppers compared to non-regulars (see Figure 1). Remember, the spending regression model (Table 3) showed that people who choose organic options “always” ended up spending significantly more ($27.42 more, on average).
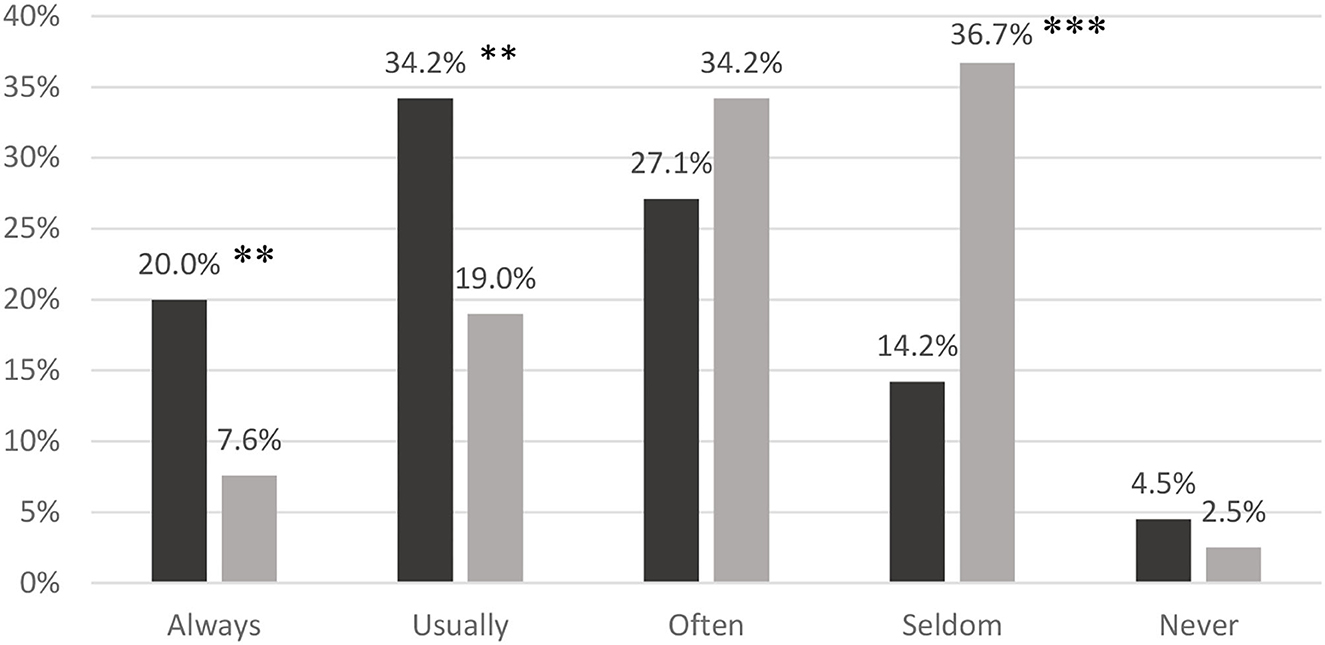
Figure 1. Organic preferences for regulars (dark) and non-regulars (light). **Significant difference at 5%, ***Significant difference at 1%.
Regular shoppers also have stronger feelings about supporting the FM for the sake of the environment, but show no difference from non-regulars on supporting local farm businesses. This might indicate that regulars would classify themselves as more strident environmentalists than non-regulars, though this would have to be settled by future research.
4.4. Regulars regression model
To analyze the behavioral patterns, attitudes, and demographics of regulars more fulsomely, a non-linear logistical regression model was created which incorporated the key variables that were found to be significant in the preceding section. As Table 8 shows, some of the variables that were statistically significant between regulars and non-regulars when analyzed in insolation are no longer significant when analyzed as part of a whole model.1 However, others are still significant including buying produce, always buying organic food, expecting FM prices to be higher than grocery store prices, rating variety as “very important”, having a smaller total household size, and traveling fewer km distance to reach the FM.
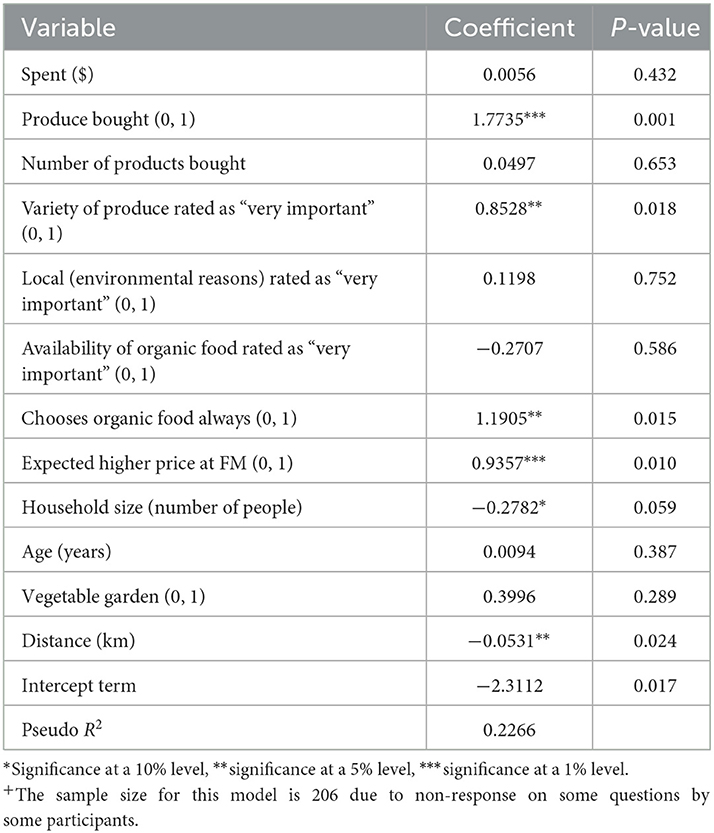
Table 8. Logistical regression model of regulars (weekly or biweekly) as dependent variable, n = 206+.
In terms of consumer behavior, buying produce is significantly linked to being a regular. The marginal effects, displayed in Table 9, show that there is a 41% increased probability of being a regular for those who purchase produce. Always choosing organic food results in a 24% increased probability of being a regular, and expecting prices at the FM to be higher than grocery store prices results in almost a 20% increased probability. In terms of attitudes and demographics, rating variety as “very important” results in an 18% increased probability of being a regular.
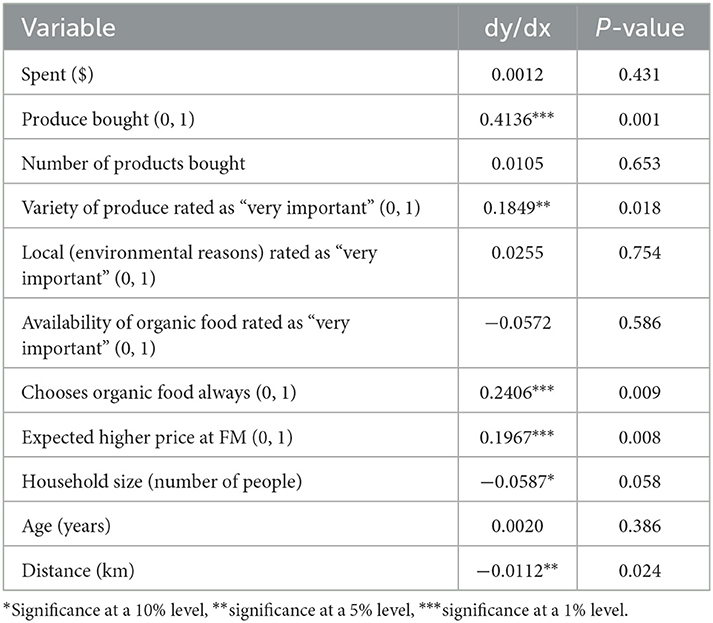
Table 9. Marginal effects of logistical regression model.
The remaining two significant variables, total household size and distance from the market, are quantitative, and so the marginal effects are calculated at the mean. Table 9 shows that having an additional family member results in a reduced probability of being a regular of almost 6%. Living an additional kilometer away from the FM results in a reduced probability of being a regular of just 1%. These two variables are good examples of the principle that statistical significance is distinct from the actual effect size or importance of the variable in a predictive sense. So while this study does predict that smaller households that live nearer to the FM are more likely to be regulars, the actual effects are tiny, and market managers would probably be wiser to focus their time and attention on other aspects, such as attracting vendors that sell a variety of organic produce options.
5. Discussion
The goal of every FM manager is to have a thriving market with a growing customer base, including a large stock of repeat customers, as well as satisfied vendors with robust sales. This study can help managers by identifying which factors are associated with being a regular customer. Some of the factors highlighted in the previous sections are beyond the control of the managers, such as family size. Some factors, however, are within the control of market managers, such as having a large variety of produce for sale and having many organic options. Managers can prioritize attracting new vendors which enhance the variety of produce available.
Since 60% of regulars expect prices at FMs to be higher than grocery stores, compared to only 45% of non-regulars, this may represent an opportunity to confound expectations. If, in actuality, prices are the same or lower than grocery stores, clever advertising can capitalize on this discrepancy between expectations and reality with the result of perhaps attracting non-regulars to come more faithfully, or for shoppers to purchase more.
Therefore, for future research, market managers should be keenly interested in the results of studies that systematically compare actual prices at FMs and grocery stores. If the perception of FMs being more expensive is erroneous, that can be a key part of future advertising campaigns and marketing measures.
As mentioned in the introduction, FM numbers have grown markedly more slowly in the past decade. Observers have noted the over-saturation of FMs (too many markets for too few customers) and the tendency of markets to fail (Helmer, 2019). For instance, in their 2008 paper, Stephenson et al., note that 32 of the 62 markets that opened between 1998 and 2005 in Oregon ceased operations (Stephenson et al., 2008). More recently, FMs in major cities such as Boston have reported major drops in attendance (Teitell, 2017).
The global COVID-19 pandemic, which is ongoing at the time of this article being written, has had major impacts on community gatherings, including FMs. The Langley Community Farmers Market did not operate at all during the 2020 season. Media coverage of the FMs in Vancouver reported that flower, soap and other non-food vendors were upset at provincial health orders that restricted their inclusion at the markets during various waves of the COVID pandemic (Ross, 2021).
It is uncertain how FMs will fare coming out of the pandemic. On one hand, global supply shortages of many goods, including some food categories, may encourage some people to support local production of food. FMs, being held outdoors, may also be seen as a safer alternative for shopping in the short run while the pandemic is still ongoing. FMs might also serve to fill part of the gap in community gatherings and to counter social isolation. On the other hand, the pandemic was also associated with high levels of unemployment and high inflation. This survey suggested that the majority of shoppers at FMs expect prices to be higher. If so, then FMs might see a loss of sales as non-regulars substitute toward the perceived less-expensive grocery stores. The effect of COVID-19 upon the success of FMs and the profitability of vendors is left to be settled by future research.
5.1. Limitations and areas for future research
This study has several limitations. One is that results may not be generalizable to other countries or locations. Though results on some variables such as spending have been remarkably consistent across studies from around the world, it is possible that the key variable under examination here—being a regular and how that affects consumer habits—may not be consistent across locations. Since this is the first study looking at this variable in-depth, time will tell if this is a universal finding or not.
Regulars in this sample made up 66.2% of FM shoppers. This is in keeping with past studies (see the literature review section above). This raises the question though of non-response bias among regulars and non-regulars. If regulars agreed to take the survey at a higher rate than non-regulars, this would skew the results. Even if non-response bias is not a concern, a larger overall sample of shoppers would be advisable to ensure there is enough variation for statistical tests to reveal differences between the groups.
Another limitation of the current study is that the methodology for the WTP question was very simple. The economics literature surrounding WTP is vast and complex with many sophisticated methods to address concerns related to bias and unfamiliarity with the task of thinking about hypothetical prices. Because it was not a key feature of this survey, these complex methods were not employed and people were simply asked to estimate how much more (if any) they think they would be willing to pay for FM food. Therefore, these results in particular should be used with caution.
More generally, this survey and analysis should be viewed as exploratory, examining a previously unstudied dimension of FM consumers. This study used a fairly stock set of questions found in most FM consumer surveys. This allowed for comparability with past research. But now that features of regulars have been identified, this work needs to be repeated with different populations and to be elaborated upon with more testable theories to explain the patterns seen here. The regressions and tests employed here establish correlation, not causation. More data collected on specific behaviors, attitudes, and demographics of regulars and non-regulars will add more evidence to help explain the differences.
For instance, is the higher observed spending in regulars (compared to non-regulars) due to higher WTP for FM food? Regulars believe, in higher proportions, that FM food is more expensive which may indicate they are willing to pay more for it. Future work is needed to measure the price elasticity of demand for FM food for regulars and non-regulars. Experimental work (i.e., choice experiments) could accomplish this; also collecting data on the behavior of the two types for checking and comparing prices between FMs and grocery stores could help shed some light. As stated earlier, there is a lack of studies which even establish whether FMs are, in fact, more expensive than grocery stores. More research is needed here too.
Another avenue future research could pursue the differences in attitudes between regulars and non-regulars. The current study indicated that regulars value variety in FM food to a greater extent than non-regulars and they also more-highly value the perceived environmental benefits of locally grown food. This raises many questions including what proportion of their household food/produce purchases are done via FMs? If the regulars use FMs to a greater extent to feed themselves, this could help explain their greater desire for variety. Also, are regulars more strident environmentalists on other measures of concern for the environment compared to non-regulars? Given that most respondents were also female, there may be an influence of gender on these factors. A more detailed examination into attitudes could help reveal these interactions.
6. Conclusion
The broad purpose of this study was to add to the literature documenting consumers at FMs, particularly in light of the dwindling number of published studies over time. The more specific purpose was to contribute to our understanding of how regulars at FMs differ from non-regulars. This study revealed that regulars and non-regulars do have some observable differences when it comes to shopping behavior, how they value the attributes of FMs, and demographically. Specifically, they tend to value variety in produce more highly than non-regulars, they shop for organic products more consistently, and they have a smaller household size.
Market managers want to convert non-regulars into regulars because, by definition, they create a more stable consumer base for vendors at the market. This study reveals that regulars buy more products and spend more on average. Understanding your customer is one of the first rules of business and marketing, so it is hoped that this study will add nuance to our understanding of regulars and will spur on future researchers to deepen and elaborate on these findings.
Data availability statement
The raw data supporting the conclusions of this article will be made available by the authors, without undue reservation.
Ethics statement
The studies involving human participants were reviewed and approved by TWU Human Research Ethics Board. The patients/participants provided their written informed consent to participate in this study.
Author contributions
The author confirms being the sole contributor of this work and has approved it for publication.
Funding
This work was funded partially through an internal grant (through the office of the Vice Provost of Research) at TWU.
Conflict of interest
The author declares that the research was conducted in the absence of any commercial or financial relationships that could be construed as a potential conflict of interest.
Publisher's note
All claims expressed in this article are solely those of the authors and do not necessarily represent those of their affiliated organizations, or those of the publisher, the editors and the reviewers. Any product that may be evaluated in this article, or claim that may be made by its manufacturer, is not guaranteed or endorsed by the publisher.
Supplementary material
The Supplementary Material for this article can be found online at: https://www.frontiersin.org/articles/10.3389/fsufs.2023.970335/full#supplementary-material
Footnotes
1. ^This might cause some confusion for non-statistically advanced readers. Some traits in regulars vs. non-regulars were significant when analyzed in isolation (with t-tests) but were not significant when analyzed in a regression. This, however, is the primary reason for using regression—its strength in controlling for other factors and identifying true relationships. The t-test results still have value though because they could be useful to market managers on the ground. For example, age is a significant variable using a t-test, but not in the regression. A market manager may try to design an advertising campaign to convert more people to being regulars using age to target the most likely would-be regulars. It doesn't matter to him or her that the correlation is likely through a third variable.
References
Adams, D., and Adams, A. E. (2011). De-placing local at the farmers' market: consumer conceptions of local foods. J. Rural Soc. Sci. 26, 74–100.
Baker, D., Hamshaw, K., and Kolodinsky, J. (2009). Who shops at the market? Using consumer surveys to grow farmers' markets: findings from a regional market in northwestern Vermont. J. Extens. 47, 1–9. Available online at: https://archives.joe.org/joe/2009december/pdf/JOE_v47_6a2.pdf
BCAFM (2022). Annual General Report 2021 (Report). British Columbia Association of Farmers' Markets. Available online at: https://bcfarmersmarket.org/app/uploads/2022/02/FINAL-2021-BCAFM-Report-optimized.pdf
Berg, N., and Preston, K. L. (2017). Willingness to pay for local food? Consumer preferences and shopping behavior at Otago Farmers Market. Transport. Res. Part A 103, 343–361. doi: 10.1016/j.tra.2017.07.001
Born, B., and Purcell, M. (2006). Avoiding the local trap: scale and food systems in planning research. J. Plann. Educ. Res. 26, 195–207. doi: 10.1177/0739456X06291389
Bukenya, J. O., Mukiibi, M. L., Molnar, J. J., and Siaway, A. T. (2007). Consumer purchasing behaviors and attitudes toward shopping at public markets. J. Food Distrib. Res. 38, 12–21. doi: 10.22004/ag.econ.43494
Buman, M. P., Bertmann, F., Hekler, E. B., Winter, S. J., Sheats, J. L., King, A. C., et al. (2014). A qualitative study of shopper experiences at an urban farmers' market using the Stanford Healthy Neighborhood Discovery Tool. Public Health Nutr. 18, 994–1000. doi: 10.1017/S136898001400127X
Burns, C., Cullen, A., and Briggs, H. (2018). The business and politics of farmers' markets: consumer perceptions from Byron Bay, Australia. Aust. J. Reg. Stud. 24, 168–190.
Carroll, B. E., and Fahy, F. (2015). Locating the locale of local food: the importance of context, space and social relations. Renew. Agric. Food Syst. 30, 563–576. doi: 10.1017/S1742170514000404
Carroll, K. A., Bernard, J. C., and Pesek, J. D. Jr. (2013). Consumer preferences for tomatoes: the influence of local, organic, and state program promotions by purchasing venue. J. Agric. Resour. Econ. 38, 379–396. doi: 10.22004/ag.econ.165934
Cassia, F., Ugolini, M., Bonfanti, A., and Cappellari, C. (2012). The perceptions of Italian farmers' market shoppers and strategic directions for customer-company-territory interactions (CCTI). Proc. Soc. Behav. Sci. 58, 1008–1017. doi: 10.1016/j.sbspro.2012.09.1081
Chen, W., and Scott, S. (2014). Shoppers' perceived embeddedness and its impact on purchasing behavior at an organic farmers' market. Appetite 83, 57–62. doi: 10.1016/j.appet.2014.08.010
Claro, J. (2011). Vermont Farmers' Markets and Grocery Stores: A Price Comparison (Report). Northeast Organic Farming Association of Vermont.
Coley, D., Howard, M., and Winter, M. (2011). Food miles: time for a re-think? Br. Food J. 113, 919–934. doi: 10.1108/00070701111148432
Connell, D. J. (2009). The National Farmers' Market Impact Study 2009 (Report). Farmers' Markets Canada and Agriculture and Agri-Food Canada. Available online at: https://www2.unbc.ca/sites/default/files/sections/david-connell/farmers-markets/nationalfarmersmarketimpactstudy2009.pdf
Connell, D. J., Smithers, J., and Joseph, A. (2008). Farmers' markets and the “good food” value chain: a preliminary study. Local Environ. 13, 169–185. doi: 10.1080/13549830701669096
Connell, D. J., Taggart, T., Hillman, K., and Humphrey, A. (2006). Economic and Community Impacts of Farmers' Markets in British Columbia (Report). School of Environmental Planning, University of Northern British Columbia, in Partnership With the British Columbia Association of Farmers' Markets.
Daflos, P. (2013). Plan to Double Vancouver Farmers' Markets Causes Concerns. CTV News British Columbia. Available online at: https://bc.ctvnews.ca/plan-to-double-vancouver-farmers-markets-causes-concern-1.1131285
Denne, L., and Foxcroft, T. (2017). ‘People Are Being Duped’: CBC Exposes Homegrown Lies at Farmers' Market. CBC News. Available online at: http://www.cbc.ca/news/business/farmers-market-lies-marketplace-1.4306231
Fatkin, B. (2017). Market Manager. Interview with the author at the Abbotsford Town and Country Market, Manager's Table.
Feagan, R. B., and Morris, D. (2009). Consumer quest for embeddedness: a case study of the Brantford Farmers' Market. Int. J. Consum. Stud. 33, 235–243. doi: 10.1111/j.1470-6431.2009.00745.x
Forssell, S., and Lankoski, L. (2015). The sustainability promise of alternative food networks: an examination through ‘alternative’ characteristics. Agric. Hum. Values 32, 63–75. doi: 10.1007/s10460-014-9516-4
Giampietri, E., Koemle, D. B. A., Yu, X., and Finco, A. (2016). Consumers' sense of farmers' markets: tasting sustainability or just purchasing food? Sustainability 8, 1157. doi: 10.3390/su8111157
Govindassamy, R., Italia, J., and Adelaja, A. (2002). Farmers'markets: consumer trends, preferences and characteristics. J. Extens. 40. Available online at: https://archives.joe.org/joe/2002february/rb6.php
Gumirakiza, J. D., Curtis, K. R., and Bosworth, R. (2014). Who attends farmers' markets and why? Understanding consumers and their motivations. Int. Food Agribus. Manag. Rev. 17, 65–81. doi: 10.22004/ag.econ.167905
Helmer, J. (2019). Why Are So Many Farmers' Markets Failing? Because The Market Is Saturated. National Public Radio. Available online at: https://www.npr.org/sections/thesalt/2019/03/17/700715793/why-are-so-many-farmers-markets-failing-because-the-market-is-saturated
Henneberry, S. R., and Agustini, H. N. (2004). “An analysis of oklahoma direct marketing outlets: case study of produce farmers' markets [Paper presentation],” in Southern Agricultural Economics Association Annual Meeting (Tulsa, OK).
Henneberry, S. R., Whitacre, B., and Agustini, H. N. (2009). An evaluation of the economic impacts of oklahoma farmers' markets. J. Food Distribut. Res. 40, 64–78. doi: 10.22004/ag.econ.34710
Kearney, A. T. (2013). Buying Into the Local Food Movement: 2014 Restaurant Industry Forecast (Report). National Restaurant Association. Available online at: https://www.kearney.com/documents/20152/434348/Buying%2Binto%2Bthe%2BLocal%2BFood%2BMovement.pdf/6b193c5d-336c-ef01-6e2e-794731a61a1b?t=1493941676300
Lev, L., and Stephenson, G. (1998). Analyzing Three Farmers' Markets in Corvallis and Albany, Oregon (Oregon Small Farms Technical Report Number 2). Oregon State University Extension Service.
McGarry Wolf, M., Spittler, A., and Ahern, J. (2005). A profile of farmers' market consumers and the perceived advantages of produce sold at farmers' markets. J. Food Distribut. Res. 36, 192–201. doi: 10.22004/ag.econ.26768
Murphy, A. (2011). Farmers' markets as retail space. Int. J. Retail Distribut. Manag. 39, 582–597. doi: 10.1108/09590551111148668
Onianwa, O., Mojica, M., and Wheelock, G. (2006). Consumer characteristics and views regarding farmers' markets: an examination of on-site survey data of alabama consumers. J. Food Distribut. Res. 37, 119–125. doi: 10.22004/ag.econ.8547
Pascucci, S., Cicatiello, C., Franco, S., Pancino, B., and Marino, D. (2011). Back to the future? Understanding change in food habits of farmers' market customers. Int. Food Agribus. Manag. Rev. 14, 105–126. doi: 10.22004/ag.econ.117604
Pesch, R., and Keeler, M. (2015). West Central Minnesota Farmers' Market Pricing Study: A Price Comparison of a Market Basket from Farmers' Markets and Grocery Stores (Report). University of Minnesota Extension.
Printezis, I., Grebitus, C., and Hirsch, S. (2019). The price is right!? A meta-regression analysis on willingness to pay for local food. PLoS ONE 14, e0215847. doi: 10.1371/journal.pone.0215847
Ross, A. (2021). Flower Vendors Frustrated by B.C.'s COVID Restrictions at Farmers' Markets. CBC News. Available online at: https://www.cbc.ca/news/canada/british-columbia/farmers-markets-bc-covid19-rules-1.5926995
Shore, R. (2014). The Best of B.C. Farmers' Markets. The Vancouver Sun. Available online at: https://vancouversun.com/news/staff-blogs/the-best-of-b-c-farmers-markets
Smit, L. (2021). Executive Director of Vancouver Farmers Markets. Personal email communication with author.
Smithers, J., Lamarche, J., and Joseph, A. E. (2008). Unpacking the terms of engagement with local food at the Farmers' Market: Insights from Ontario. J. Rural Stud. 24, 337–350. doi: 10.1016/j.jrurstud.2007.12.009
Stephenson, G., Lev, L., and Brewer, L. (2008). ‘I'm getting desperate’: what we know about farmers' markets that fail. Renew. Agric. Food Syst. 23, 188–199. doi: 10.1017/S1742170507002153
Stobbe, T. (2016). Making sense of the dollars spent at farmers' markets. J. Food Distribut. Res. 47, 138–161. doi: 10.22004/ag.econ.240765
Teitell, B. (2017). You Might Think Having More Farmers' Markets Is Good for Farmers. Often It's Not. Boston Globe. Available online at: https://www.bostonglobe.com/metro/2017/07/29/the-number-farmers-markets-mass -has-nearly-tripled-since-why-isn-michelle-obama-dream-come-true/XFhxKJl0T0MG Ped09sFPFI/story.html
Thilmany, D., Bond, C. A., and Bond, J. K. (2008). Going local: exploring consumer behavior and motivations for direct food purchases. Am. J. Agric. Econ. 90, 1303–1309. doi: 10.1111/j.1467-8276.2008.01221.x
USDA (2019). National Count of Farmers' Market Directory Listings Graph: 1994-2019. United States Department of Agriculture, Agriculture Marketing Service. Available online at: https://www.ams.usda.gov/sites/default/files/media/NationalCountofFarmersMarketDirectoryListings082019.pdf
USDA (2022). Local Foods. United States Department of Agriculture, National Agricultural Library. Available online at: https://www.nal.usda.gov/legacy/aglaw/local-foods#quicktabs-aglaw_pathfinder=1
Vecchio, R. (2009). “European and United States farmers' markets: similarities, differences and potential developments [Paper presentation],” in EAAE Seminar “A resilient European food industry and food chain in a challenging world” (Chania).
VFM (2017). Annual Report 2016-2017. Vancouver Farmers' Markets Society. Available online at: http://eatlocal.org/assets/uploads/2014/05/VFM-2016-17-AR-web.pdf
VFM (n.d.). About Us. Available online at: https://eatlocal.org/about-us/
Zepeda, L. (2009). Which little piggy goes to market? Characteristics of US farmers' market shoppers. Int. J. Consum. Stud. 33, 250–257. doi: 10.1111/j.1470-6431.2009.00771.x
Zepeda, L., and Carroll, K. A. (2018). Who shops at a mature farmers' market? Choices 33. Available online: http://www.choicesmagazine.org/choices-magazine/theme-articles/engaging-consumers-in-the-dynamic-local-foods-marketplace/who-shops-at-a-mature-farmers-market
Zezima, K. (2011). As Farmers' Markets Go Mainstream, Some Fear a Glut. New York Times. Available online at: http://www.nytimes.com/2011/08/21/us/21farmers.html?_r=0
Keywords: agricultural economics, farmers' markets, regular shoppers, consumer preferences, local food, sustainability
Citation: Stobbe T (2023) “Where everybody knows your name”: How regulars at farmers' markets differ from less-frequent shoppers. Front. Sustain. Food Syst. 7:970335. doi: 10.3389/fsufs.2023.970335
Received: 15 June 2022; Accepted: 16 January 2023;
Published: 09 February 2023.
Edited by:
Karl S. Zimmerer, The Pennsylvania State University (PSU), United StatesReviewed by:
Iryna Printezis, Arizona State University, United StatesRussell Hedberg, Shippensburg University, United States
Copyright © 2023 Stobbe. This is an open-access article distributed under the terms of the Creative Commons Attribution License (CC BY). The use, distribution or reproduction in other forums is permitted, provided the original author(s) and the copyright owner(s) are credited and that the original publication in this journal is cited, in accordance with accepted academic practice. No use, distribution or reproduction is permitted which does not comply with these terms.
*Correspondence: Tracy Stobbe,  tracy.stobbe@twu.ca