Agroecological planning of productive systems with functional connectivity to the ecological landscape matrix: two Colombian case studies
 Álvaro Acevedo-Osorio
 Jonathan Salas Cárdenas2
  Angela Maribeth Martín-Pérez
- 1Centro de Excelencia en Sistemas Agroalimentarios Sustentables, Universidad Nacional de Colombia, Bogotá, Colombia
- 2Departamento de Ciencias, Universidad Nacional de Colombia, Bogotá, Colombia
Given the need for agricultural system management under sustainability principles, identification and quantification of the landscape structure surrounding production systems is a tool that allows farmers to make their agroecological transition processes more appropriate. An ACI with eight indicators was proposed for farm assessment. This ACI is focused on functional connectivity both at farm and landscape levels. Two Colombian farms with different connectivity characteristics were evaluated under the index. Tosoly presented a stronger ecological structure and higher connectivity and diversity. Villa Alicia showed a weak ecological structure and low connectivity and complexity. From a systemic approach, the ACI allows an analysis of landscape structural conditions that promote ecological functions of pollination and biological controllers. With landscape structural conditions, it is possible to analyze the quantity and quality of the habitat for designing agroecological transition programs focused on obtaining productive agroecosystems that simultaneously comply with conservation strategies.
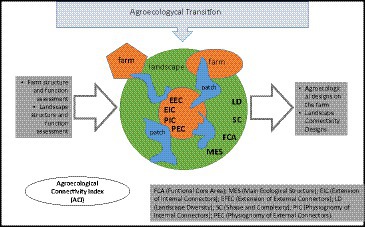
GRAPHICAL ABSTRACT.
1 Introduction
Agriculture is the human activity that has generated the greatest transformation of ecosystems worldwide (Millennium Ecosystem Assessment, 2005; Zimmerer et al., 2019). Agricultural technological intensification has negatively impacted ecosystems, compromising their conservation over time (Liere et al., 2017; Thrupp, 2004). Due to its relevance and predominance, agriculture should not only be concerned with production but also the preservation of wild biodiversity and ecosystem functions: the latter determines the continuity of the former. Biodiversity is essential for agricultural production and also for technological innovations, food security, and environmental conservation (Thrupp, 2004). For this reason, it is urgent to manage the biodiversity of agricultural landscapes through ecologically-based farming approaches (Scherr and McNeely, 2009).
Agroecology has emerged as a methodological approach for transitioning to sustainable production systems (Nicholls et al., 2016) that guarantee environmental functions conservation in agroecosystems (Acevedo-Osorio, 2016). However, in many cases, the transition from conventional to agroecological agriculture only means a mere input substitution. The result of this substitution cannot be classified as an actual agroecological system but, at most, as a proposal for organic production. Agroecology is based on returning unbalanced systems to stable ecological conditions that allow farms to drastically reduce their dependence on exogenous inputs (Gliessman, 2002). To achieve this, agroecology focuses on maximizing the benefits that local (farm level) and regional (landscape level) biodiversity can provide to agriculture (Altieri and Nicholls, 2007).
This research proposes a tool, adapted from already established landscape indexes, to assess the degree of functional connectivity between productive systems and the landscape matrix. This assessment is aimed to be integrated into agroecological transition processes based on the redesign of productive systems with particular emphasis on pollination as an ecological regulation process. To do this, it is necessary to achieve specific objectives that allow gathering the required data to calculate the indicators linked to each farm. These objectives are (1) to identify the land covered and land uses, (2) to establish patches with functional area, and (3) to calculate neighborhood metrics (extension and physiognomy of the internal and external vegetation connectors) and the similarity of each patch to a circle through the shape and complexity indicator.
1.1 Planning the agroecological transition
Agroecological systems are sets of spatial and temporal arrangements or designs of biotic and abiotic components (Martínez, 2002). These arrangements are dynamic and can take different technological patterns depending on both biophysical and socioeconomic circumstances and the interests of each producer (Altieri and Nicholls, 2012; Noguera-Talavera et al., 2019). Agroecological systems should be understood as continuous transformation processes towards adapted and resilient systems at the farm, landscape, or organizational and market systems levels that contribute to food system sustainability (Noguera-Talavera et al., 2019).
A careful design process is needed to constitute agroecological systems. This process intends to integrate existing ecological components in order to increase biological efficiency while the productive and self-sufficient capacities of the system are maintained (Noguera-Talavera et al., 2019). The transition to agroecological systems is usually a slow but steady process in a three-step sequence (Gliessman, 2002; Marasas et al., 2014). The first is oriented toward the efficient use of inputs, while the second focuses on substituting these inputs. The third aims to redesign productive systems through optimal distributions of crops and livestock that promote interactions so that the agroecosystem can manage processes related to soil fertility, natural pest control, and crop productivity (Hill and MacRae, 1996). Emphasis has been placed on the fact that this process must go beyond the change of isolated practices, which implies an investment in time, knowledge, and a systemic vision. It also requires the application of agroecological principles instead of general rules since it assumes the particularity of each system.
An adequate transition process guarantees the development of environmental functions that favor the system’s self-regulation. These functions, in turn, form the basis for establishing more balanced productive systems that depend less on external inputs. Working on distinct levels (parcel of land, farm, and territory), a highly diverse landscape structure, reflects a greater possibility of natural control of herbivores due to a higher presence of their natural enemies (Altieri and Nicholls, 2007).
From an agricultural production perspective, the most crucial ecosystem functions include processes related to the soil (mineralization and nutrient recycling, organic matter decomposition, soil aggregate stabilization, organic matter formation, and water regulation), trophic web complexity (food sources for other species, and pest, disease, and weed control), gene flow (pollination), and production increase (food and materials) (Altieri, 1999; Moonen and Bárberi, 2008).
1.2 Studies on landscape connectivity
According to landscape ecology, human actions alter natural habitats, the landscape, and the functioning of ecosystems (Calabuig, 2013). For example, if the movement of pollinators, dispersers, or other natural biological control agents is curtailed by fragmentation, the remaining forests might become genetically and demographically isolated units (Calabuig, 2013; Gutiérrez-Chacón et al., 2020). In this sense, a fragment might be extremely isolated to the point that the populations of seed dispersers or pollinators might not reach it, causing the local extinction of certain species (Forman, 1995; Murcia, 1995).
Functional connectivity corresponds to the degree to which the landscape facilitates or prevents the movement of specific biota between habitat fragments as a result of the interaction between behavioral ecological processes and the landscape’s physical structure of the landscape (Taylor et al., 1993; Crooks and Sanjayan, 2006; Alonso F et al., 2017). Functional attributes such as high levels of biodiversity, the exchange of species between cultivated and uncultivated lands, and resilience require the maintenance of connectivity between the ecosystem elements in order to linger over time (Swift et al., 2004).
Depending on the degree of intensification linked to different agricultural systems, there are several effects on the fragmentation of habitats and the loss of biodiversity; monoculture is one extreme of this spectrum. Farm mechanization and modernization bring uniformity to the landscape, erase bordering zones, increase pesticide use, among other changes (Altieri, 1999). The result corresponds to the creation of systems considerably open to matter and energy exchanges, influenced heavily by external conditions, and with clear cultural control (Gómez, 1993; Ramírez and Hernández, 2013).
Landscape connectivity allows the enhancement of the ecological functions of the landscape with agroecological production practices, and therefore, it can be evaluated spatially in terms of composition and function (Bennet, 1999; Taylor et al., 2006). To assess the potential of agricultural production systems and take advantage of the ecological structure, León-Sicard et al. (2018) proposed a useful methodology that begins with the Main Agroecological Structure (MAS) as a concept. This refers to the arrangements of internal and external connectors in farms that might be related to the likelihood of resilience or adaptation of the agricultural systems to different ecological disturbances. Through these arrangements, it is possible to establish design options for adapting to and mitigating the changing weather and other daily risks in agricultural systems (Cleves 2018). Considering that this methodology analyzes aspects of the structure (for example, how a production system connects with the surrounding landscape through vegetation cover or bodies of water), it is necessary to complement this analysis with data about the types of covers that determine the functionality that those connectivity covers might provide to both the production system and the landscape.
It is fundamental to develop studies on landscape structure and its implications in the intensification of ecosystem functions to the scope of planning agroecological production systems. This is the contribution this research aims to make to this field. Therefore, the purpose of this article is to address, from a functional connectivity perspective, landscape studies based on known and new indicators related to the farm’s internal and external structure to facilitate production and conservation designs that improve the sustainability of long-term agricultural production.
2 Methodology
The methodology in this research was based on the Agroecological Connectivity Index (ACI) which integrates a set of eight indicators and 12 variables (landscape metrics) that aim to collect different ecological, biological, and agricultural key aspects of the landscape and the farm (Table 1).
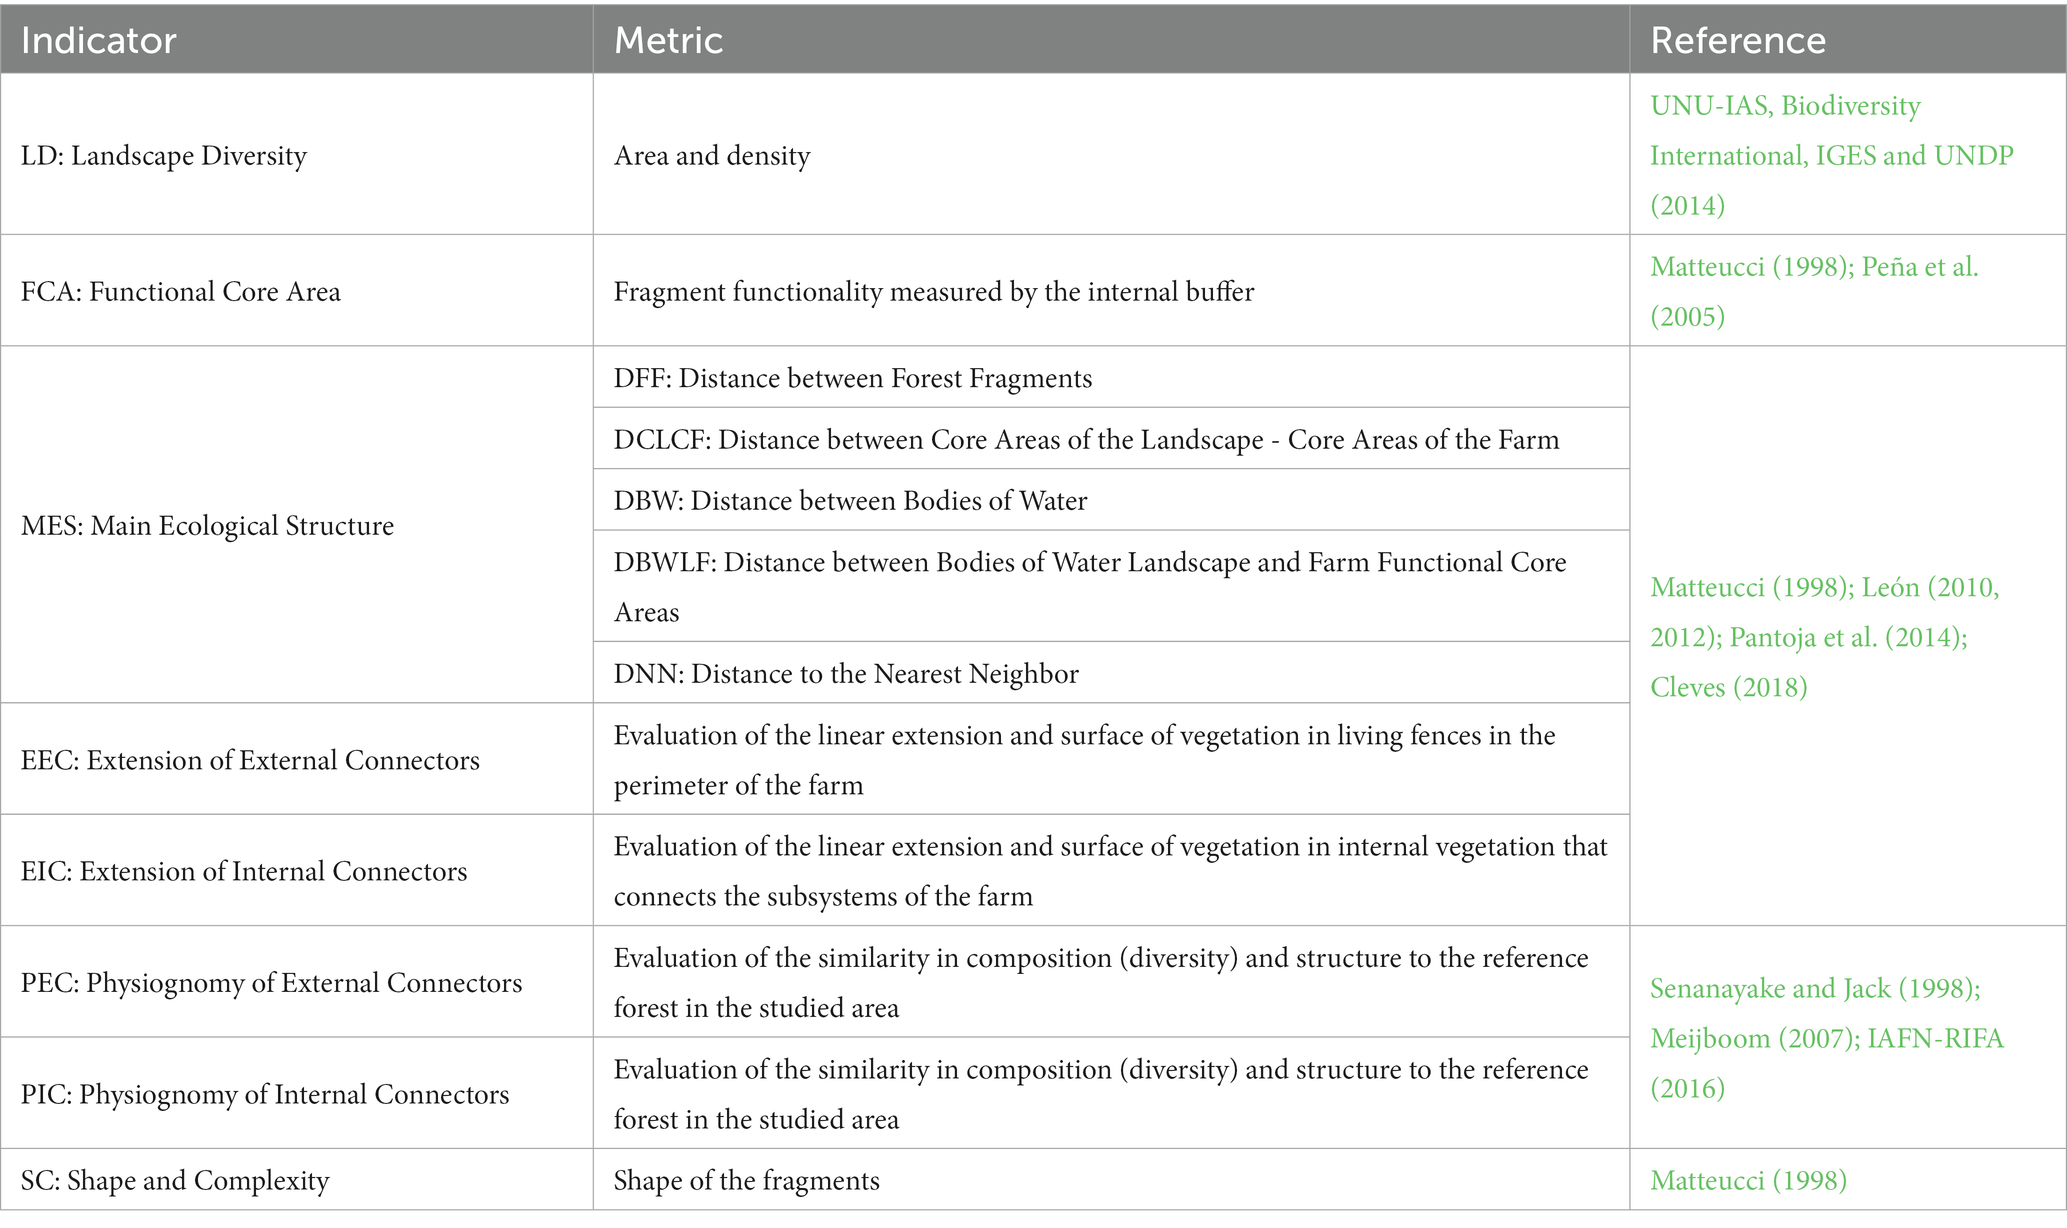
Table 1. Indicators and metrics for the agroecological connectivity index (ACI).
Land measurements were made in the open-source software Qgis 3.14, and land cover maps were digitized using Google Earth images (2020), obtained from the service connection tool XYZ Tiles, using as reference the descriptions of the CORINE Land Cover methodology as reference adapted for Colombia (IDEAM, 2010a). A minimum mappable area of 0.01 ha was chosen because the size of the area of influence of the farms and the available satellite images allowed such a level of detail. In addition, field verifications were carried out based on observation and the georeferencing of borders between covers, which allowed us to refine each cover polygon to subsequently assign the current land use to each identified cover.
Two case studies were selected due to the contrasting conditions of land use between cultivated land inside the farm and the configuration of the area of influence of the landscape. The farms are located in the departments of Santander and Cundinamarca (Colombia; Figure 1). The first farm, called Tosoly, is in the village of Morario, municipality of Guapotá, Santander, with an average temperature of 21.7°C and average annual precipitation between 2700 and 3000 mm. The 8.54 ha farm is located between 1480 and 1535 m.a.s.l and integrates elements of conservation and agroecological production with an emphasis on energy cycling. The second farm, called Villa Alicia, is in the village of La Playa, municipality of Carmen de Carupa, Cundinamarca, with an average temperature of 12°C and average annual precipitation between 500 and 1000 mm (IDEAM, 2010b). The farm covers an area of 18.23 ha and is located between 2800 and 2900 m.a.s.l. It is mainly intended for the conservation of the remnants of a secondary-growth forest, pastures for extensive stock farming, and some subsistence crops.
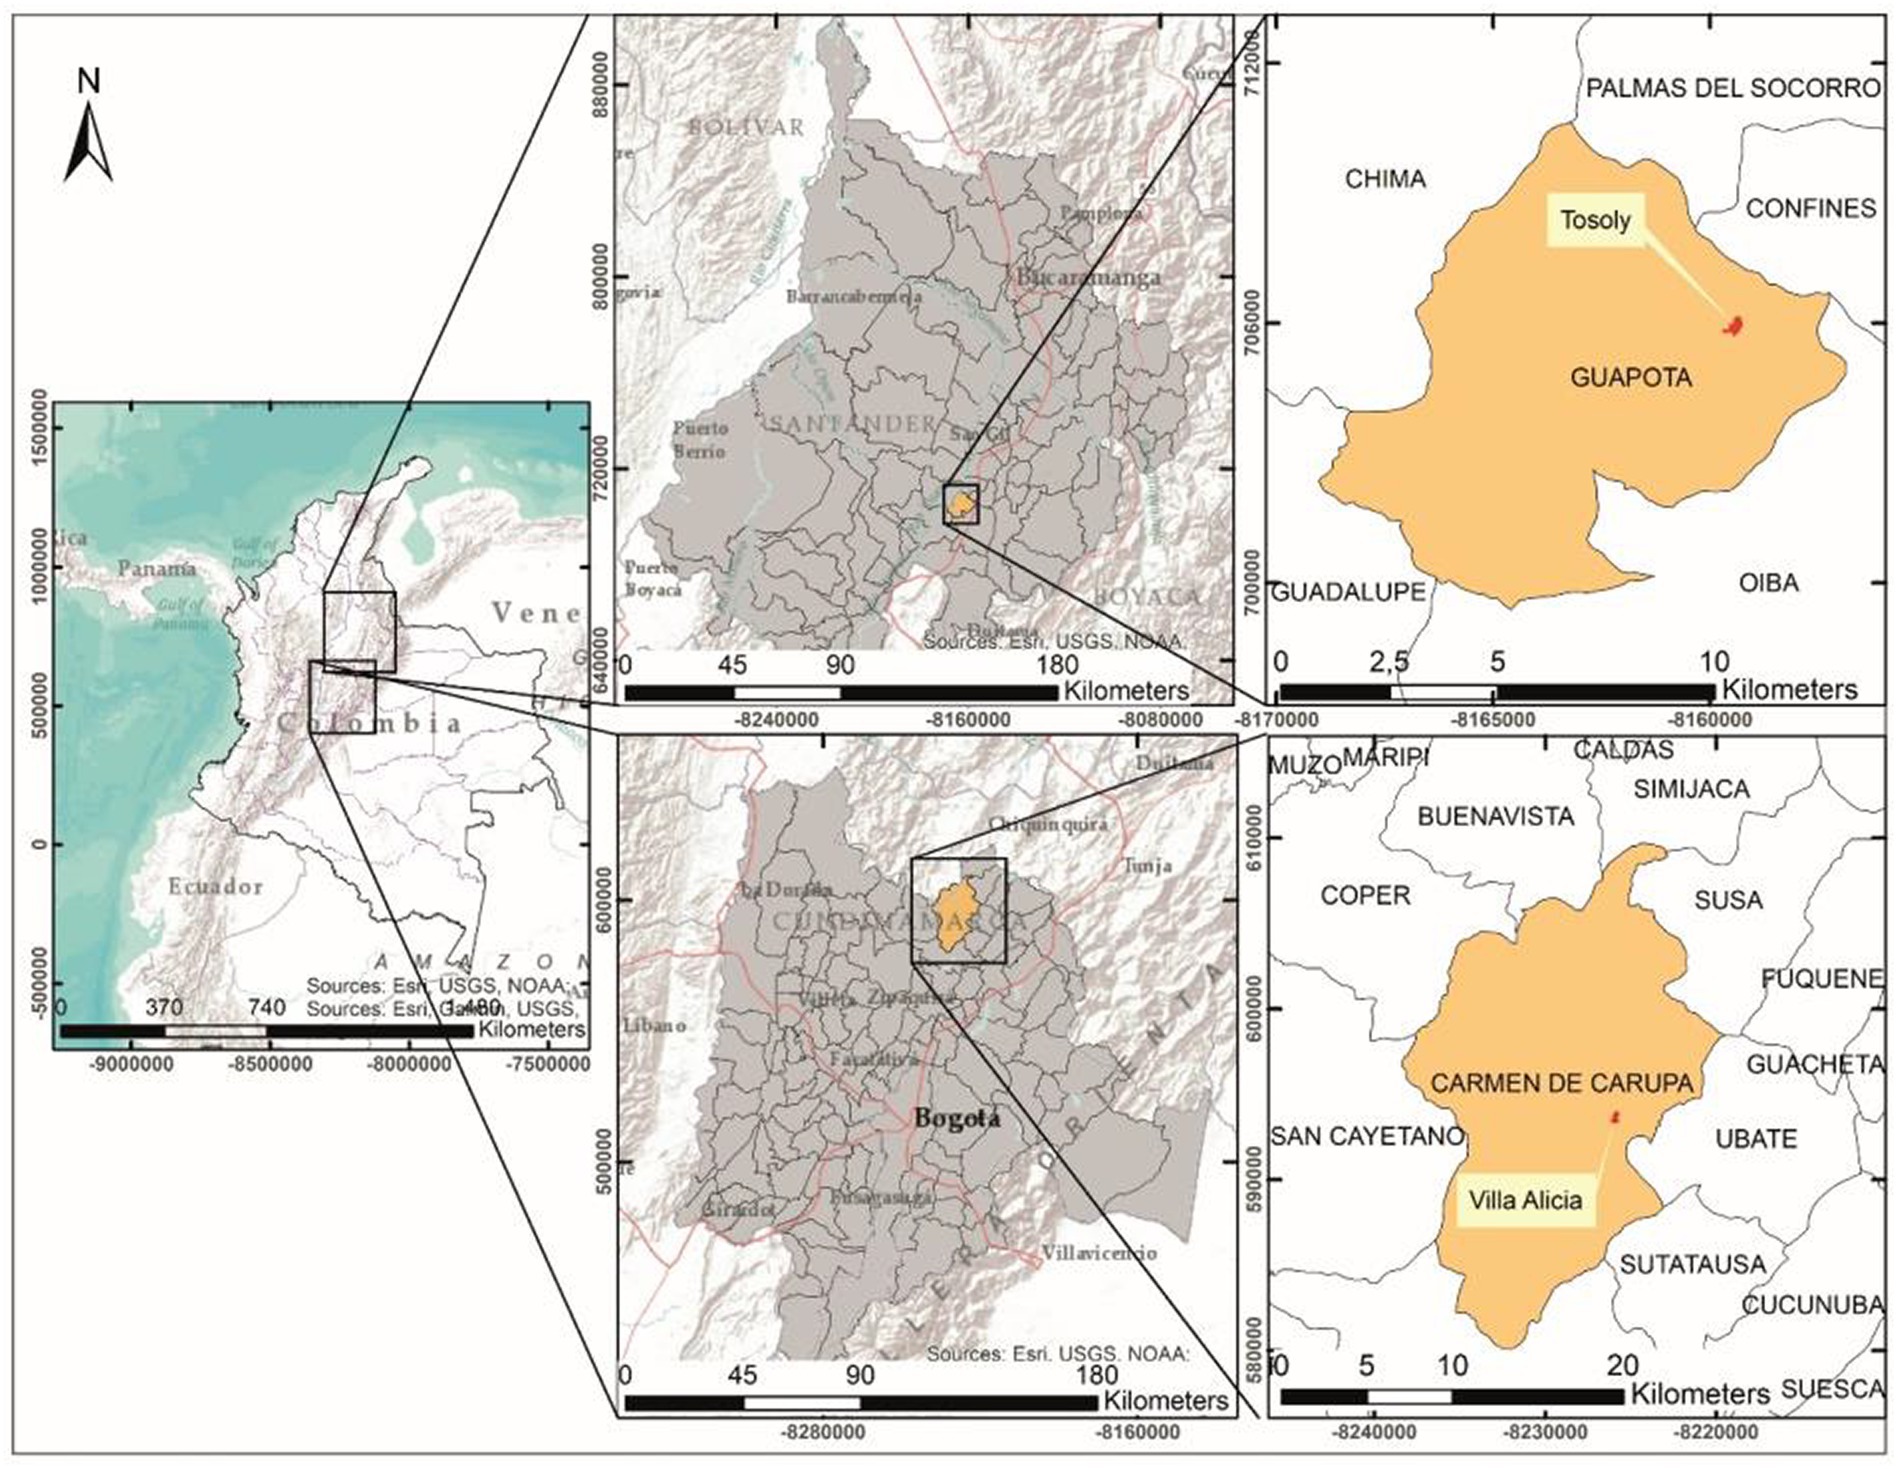
Figure 1. Location of the studied farms.
The indicators, based mainly on the MAS (León-Sicard et al., 2018), were weighted according to their estimated degree of specific importance for the agroecological connectivity between the farm and the landscape. Subsequently, the ACI was obtained.
The criteria for the indicators’ weightings were determined following data from scientific articles related to these indicators (Peña et al., 2005; Fahrig, 2013; UNU-IAS, et al., 2014; Hilty et al., 2020) as well as previous experiences of the authors (1). Two indicators proved to be more relevant compared to others: (1) the Main Ecological Structure (MES) because of its effect on the assessment and the complete analysis of the connectivity networks of the landscape-farm and (2) the identification of the edge effect (core area) due to its influence over the behavior of animals and plants populations in the short term. The following is the final equation that illustrates all the weightings for the eight indicators:
(1)
The values of the eight indicators were obtained from ratings, resulting from normalizing measurements on a scale from 1 to 5, according to the perceived level of agroecological connectivity: 1 as undesirable and 5 as desirable.
2.1 Landscape diversity (LD)
For this indicator, the area of influence of the landscape over the farm was calculated. To do so, first, the area of a circle drawn from the center of the farm was obtained, following the equation R = 2Y, where Y is the measurement of the longest possible diagonal between the borders of the farm, and R corresponds to the radius of the circle (León, 2010; 2012). Then, the inner area of this circle was subtracted from the total area including the outer limits of the farm, resulting in the area of influence. The CORINE Land Cover methodology adapted for Colombia was used to carry out the inventory for vegetation cover and land use. The methodology was also used to characterize, classify (IDEAM, 2010a), and compare the two sites and, with this information, know the degree of similarity between the covers that make up the landscape (dominant matrix and fragments). Subsequently, the equitability of the covers was established, counting the existing fragments for each class. Finally, the total area and density were calculated as the percentage of each cover in relationship with the total area of the circle. This value was normalized in the numerical scale from 1 to 5.
2.2 Functional core area (FCA)
This indicator evaluates the edge effect. Following Peña et al. (2005), we defined an edge effect of 20 m corresponding to the distance of the internal buffer zone that can be plotted for each of the natural vegetation fragments. Fragments with a functional area (fragments with a remaining inner area after eliminating the edge effect) were selected as functional fragments for the index. Then, through the relation a /A * 100, the corresponding numerical values for the functional fragments were calculated, with A the total area of natural fragments and a the total area of the functional nuclei.
2.3 Main ecological structure (MES)
Neighborhood metrics are defined by the MES: these metrics assess the distances between the fragments with natural covers of landscape and bodies of water and the farm (León-Sicard et al., 2018). A spatial and temporal analysis was considered, framed in both the hypotheses of fragmentation-island biogeography (Hilty et al., 2020) and the habitat’s quality and quantity (Fahrig, 2013) as determinants of the density and richness of the associated biodiversity.
The weightings for each component in the MES equation are derived from fieldwork conducted by the authors and the literature linked to these metrics. The Presence of Native Forest Fragments (%F) corresponds to the native forest cover of each area reflected in the habitat’s quality and quantity (Fahrig, 2013; Hilty et al., 2020). DCLCF shows the connectivity network between the landscape and the farm. DNN uses native covers (%F) to exhibit the connectivity network among the vegetation fragments that offer the ecosystem services necessary for ecological balance (Fahrig, 2013; Hilty et al., 2020). DBWLF presents the routes of the associated fauna to obtain water resources and the network of connectivity between vegetation fragments and their connections with bodies of water. The complete MES equation and the definitions for each parameter needed for its calculation are presented next.
(2)
Presence of Native Forest Fragments, expressed as a percentage (%F), is the sum of the vegetation cover areas comparable in structure and diversity to the native ecosystems in the studied area.
Distance between Forest Fragments (DFF) is the average distance to the closest functional fragment of any cover. Modeling and creation of ecological corridors are its base. Therefore, it is measured based on the likelihood and minimum distance criteria.
Distance between Core Areas of the Landscape and Core Areas of the Farm (DCLCF) is based on the connection network created for DFF, and it corresponds to the average of the distances between the functional fragments of the farm and those of the landscape.
Distance to the Nearest Neighbor (native forest) (DNN) is related to a temporal analysis, as it evaluates the average distance of the connection between forest fragments and native vegetation (existent from the past). It aims to include the habitat’s quantity and quality hypothesis in the methodology and assessment.
Distance between Bodies of Water (DBW) corresponds to the connections network created between natural and artificial bodies of water in the landscape and the farm. Their lengths are averaged.
Distance between Bodies of Water and Landscape and Farm Functional Core Areas (DBWLF) corresponds to the average distance species should travel from functional fragments to the closest body of water. Only straight measurements followed by an animal to access a network of connectivity with the water resource are calculated.
Presence of Bodies of Water expressed as a percentage (%BW) is the percentage of the areas of natural and artificial bodies of water found in the studied area.
Since MES is an indicator that is formed of five metrics, the following scale has been defined for its numerical assessment: MES between 20 and 14 = 5; MES between 13 and 11 = 4; MES between 10 and 7 = 3: MES between 6 and 4 = 2; MES between 3 and 1 = 1.
2.4 Extension of External Connectors (EEC)
It corresponds to the percentage of the perimeter of the farm covered with vegetation, either natural or planted, native or introduced, with elements >1 m in height.
2.5 Extension of Internal Conectors (EIC)
It refers to the percentage of patches of vegetation comparable to the natural ecosystems corresponding to the study area connected by linear plant formations with elements >1 m in height, regardless of whether they are natural forest extensions or products of intentional farm management (León-Sicard et al., 2018; Castell and Almarales, 2021).
2.6 External Connectors (PEC) and Internal Connectors (PIC)
These indicators correspond to an approach to assess the structure and the basic forms of growth of the species existing in the external and internal connectors. Analog forestry methodology is their base (Senanayake and Jack, 1998; Meijboom, 2007; IAFN-RIFA, 2016), and their calculation uses a reference equation linked to the natural ecosystem area.
For the construction of this equation, we worked by height strata. To each stratum, a symbol was assigned (Table 2) following three characteristics: basic forms of growth, height, and approximate cover percentage of this basic form of growth. The symbols of the external and internal connectors of the farm strata were obtained, and each of these symbols was contrasted with the symbols of the reference formula. Then, a weight equal to 12.5 was assigned to each stratum. A comparison between referential strata and the existing strata (external and internal connectors of the farm) in the current physiognomy was carried out: total code match corresponded to a total value of the stratum (12.5); partial match of at least the first letter of the code equaled half the value of the stratum (6.3); and, no match in the first letter corresponded to zero.
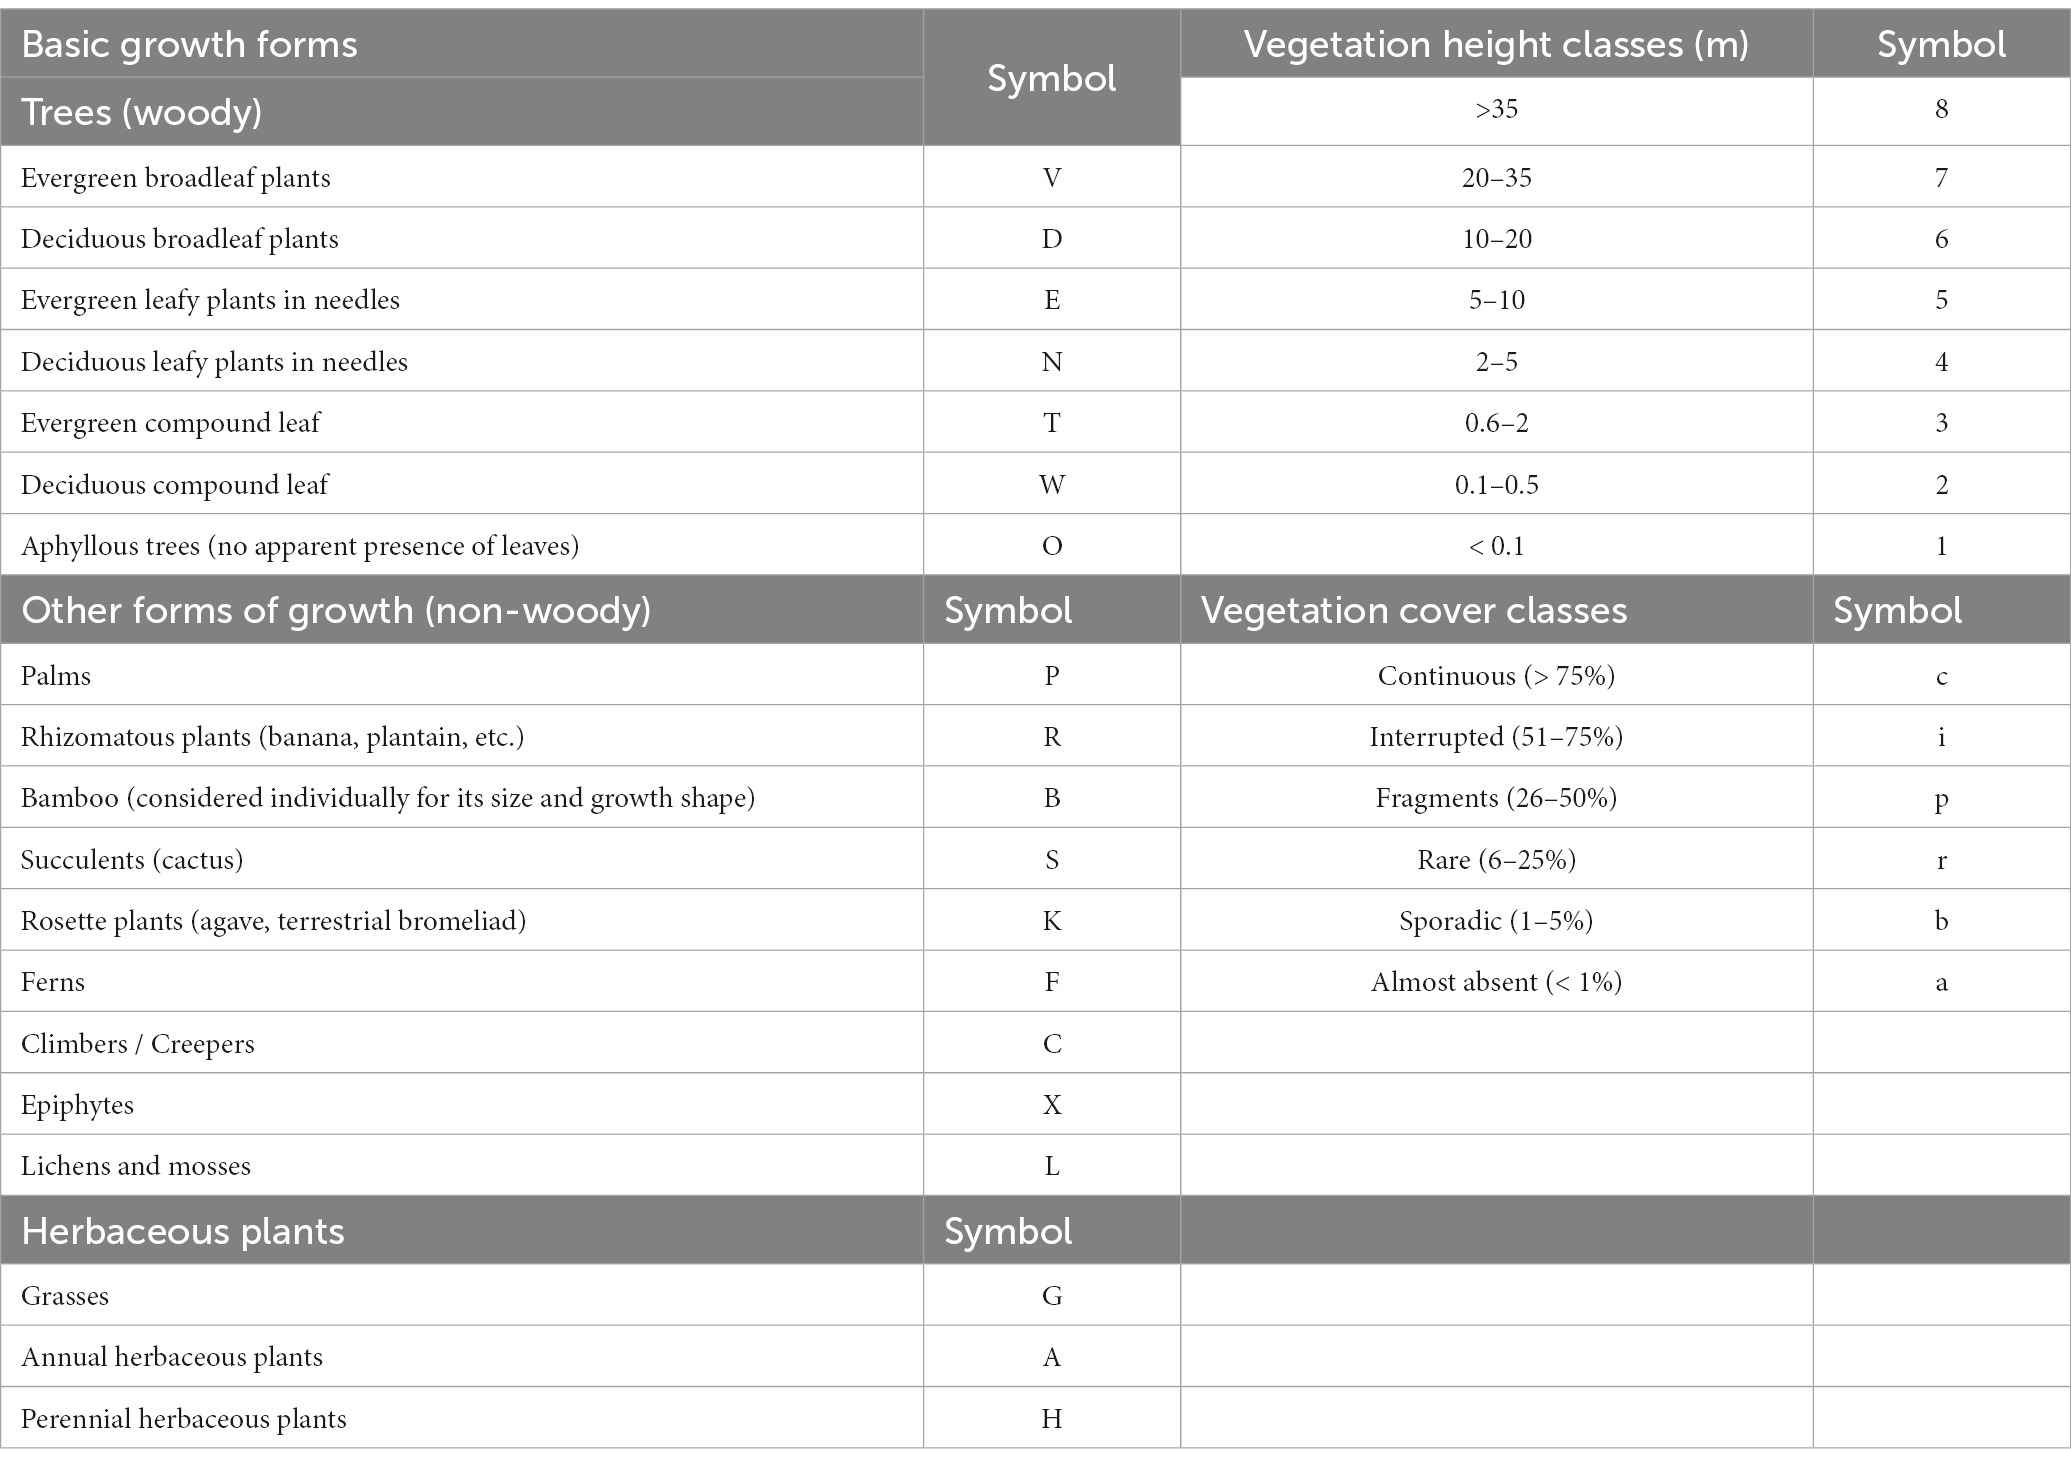
Table 2. Symbols for coding each stratum in the reference formula and on the external and internal connectors.
2.7 Shape and complexity
Shape has been considered another edge effect indicator because there is a positive relationship between circular patches and tree species richness (Matteucci, 1998; Torras et al., 2008).
For calculations, each of the eight quantitative indicators was normalized on a scale from 1 to 5, according to the perceived level of Agroecological Connectivity: 1 as a minimum and 5 as a maximum value of each indicator. The results were also interpreted on a scale from 1 to 5 (Table 3). The evaluation implied a perceptual consensus of those who participated in the evaluation to provide an adequate level of objectivity to the analysis.
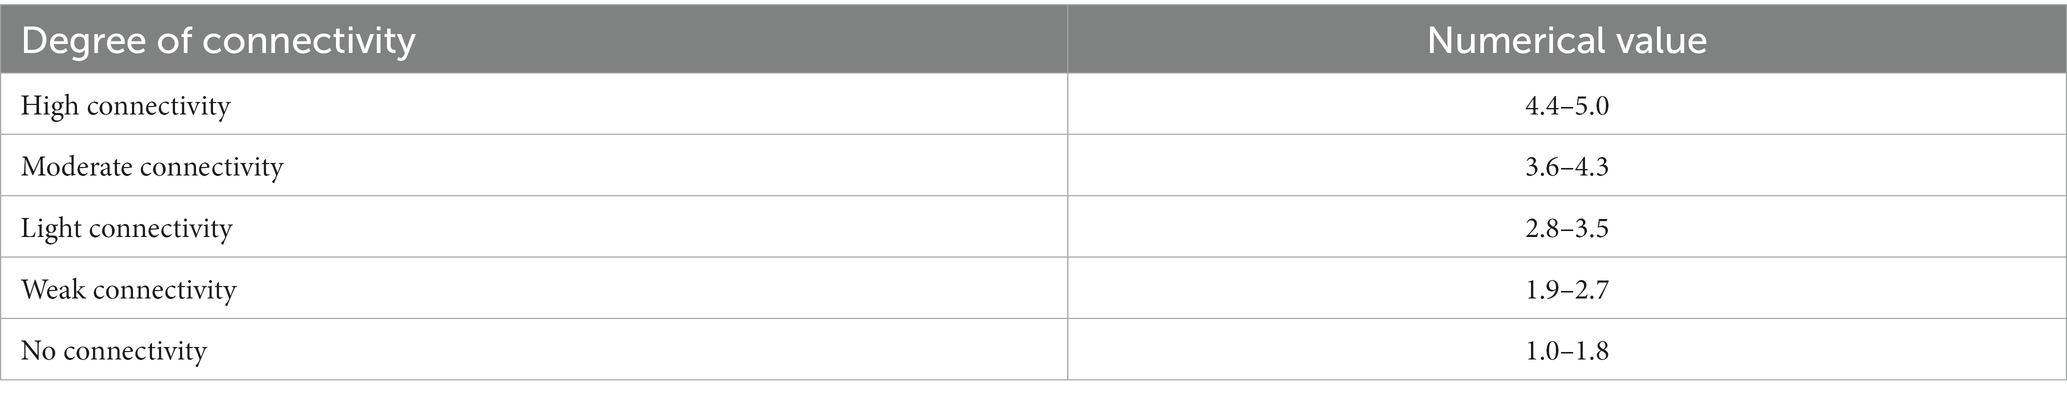
Table 3. Interpretation of the agroecological connectivity index.
3 Results
3.1 Characteristics of production systems and regions
Tosoly farm presented nineteen uses, most of them linked to crops (53%), followed by forests and secondary vegetation (25%; Table 4). In the area of influence determined in the landscape (248.05 ha), four land uses were associated with the fragments of interest for Ecological Connectivity, with dense forest as the dominant land use (Table 5). The landscape matrix of the area of influence is mostly formed of wooded and clean pastures and crops. However, out of the 248.05 ha of the plotted circle, 68.09 ha have usable covers for connectivity purposes, including forest plantations.
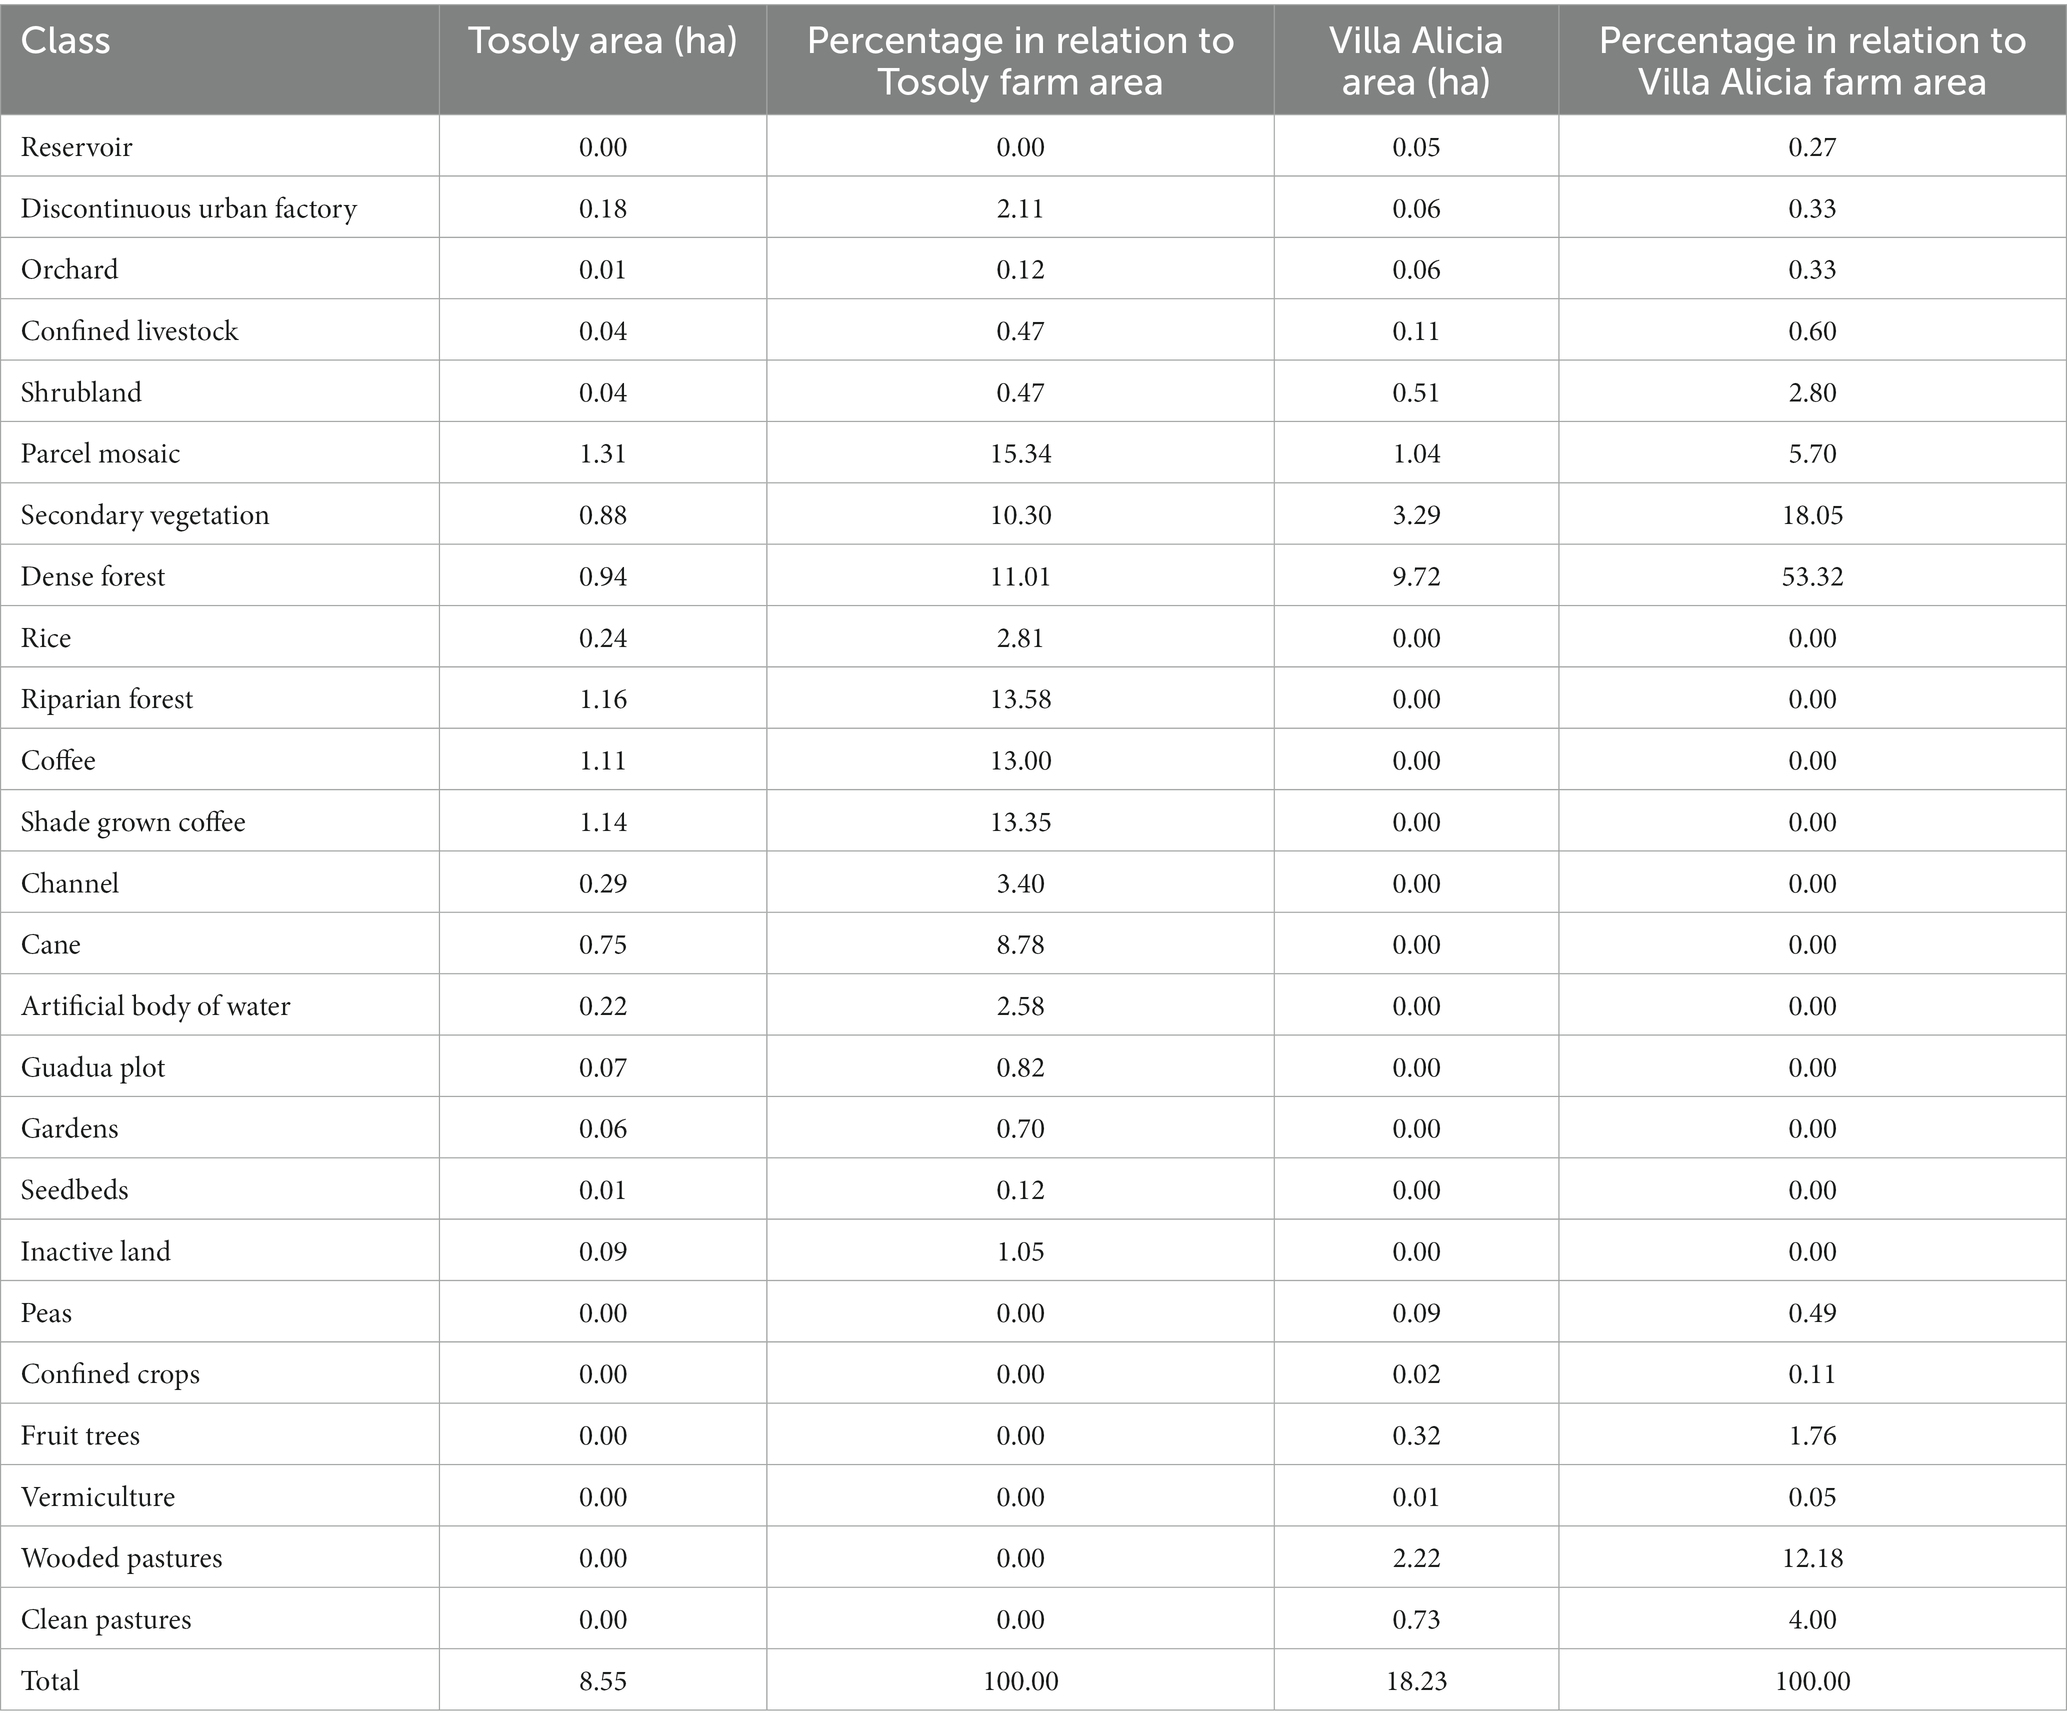
Table 4. Land uses in Tosoly and Villa Alicia farms.
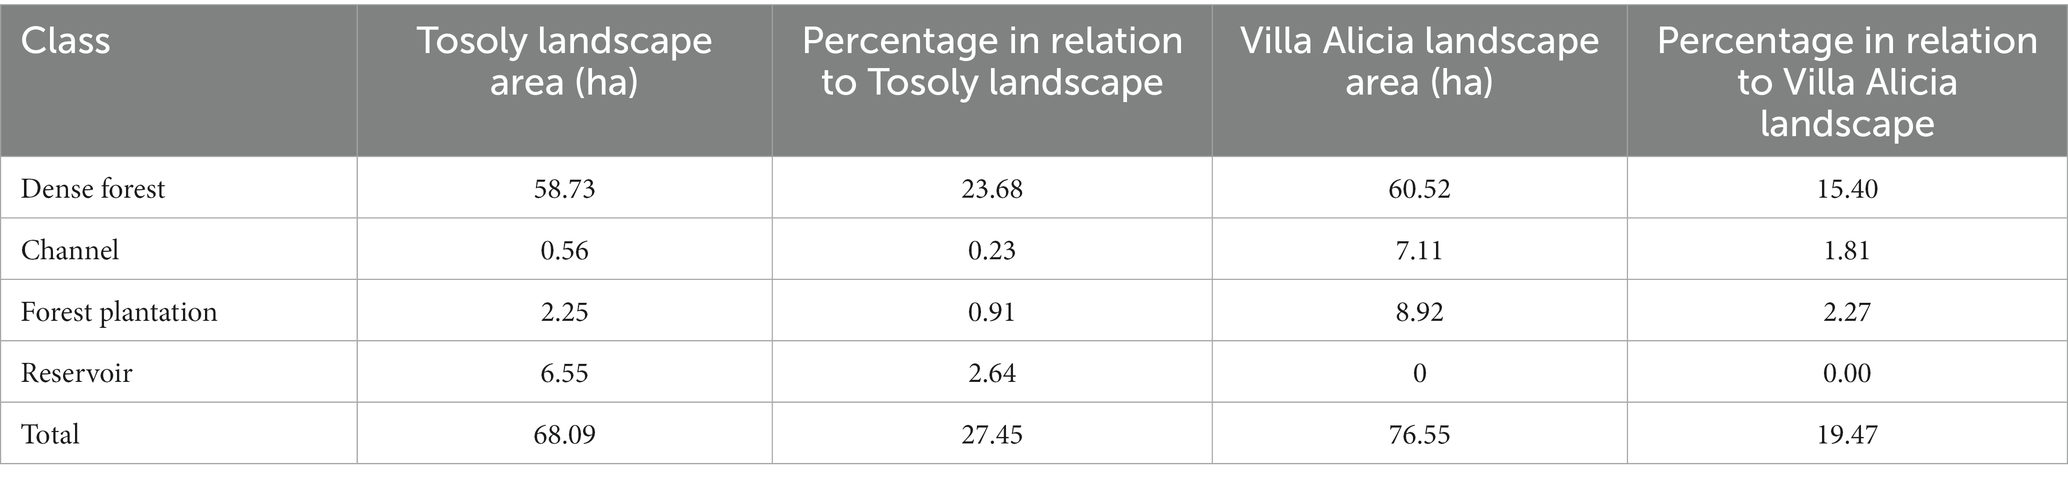
Table 5. Covers of the fragments of interest for connectivity in influence area of Tosoly and Villa Alicia farms.
In contrast, Villa Alicia presented 14 land uses linked to the dense forest (53%), secondary vegetation (18%), and wooded pastures (12%): the cultivated land is quite reduced (only 8%) (Table 4). The landscape matrix of the area of influence was 380.98 ha and was dominated by pastures and bare soil. There are 76.55 ha of fragments of interest for connectivity purposes (Table 5).
3.2 Evaluated indicators
Both Tosoly and Villa Alicia presented low landscape diversity (LD) (Table 6). For Tosoly’s influence area, the percentage of fragments with vegetation cover comparable with the original natural nearby ecosystems ranged between 20 and 29.9% of the total farm area. This range allowed an LD rating equivalent to 3 (on a 1 to 5 scale). An advantageous feature of such fragments is that they mostly correspond to dense forests (Table 5), representing a secure feeding source for fauna, with a lear possibility of further expansion of the vegetation cover. For Villa Alicia’s influence area, the percentage of fragments with vegetation cover comparable with the original natural nearby ecosystems ranged between 10 and 19.9% of the total farm area. This range corresponded to an LD rating of 2. Similarly, as for Tosoly, most of these connectivity-related fragments are dense forest relicts (around 60 ha - Tables 5).
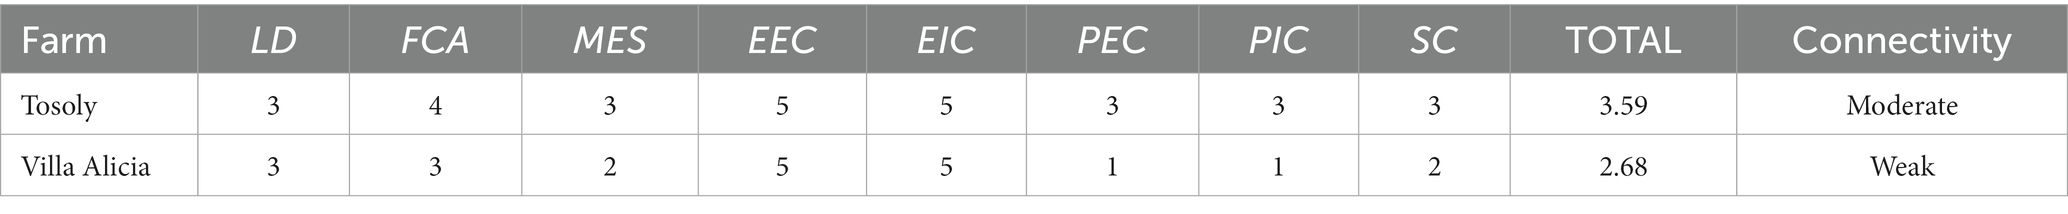
Table 6. Ratings for the eight indicators composing the agroecological connectivity index (ACI) for Tosoly and Villa Alicia farms.
The landscape FCA for Tosoly (Figure 2) was higher than for the fragments in Villa Alicia, which are much narrower and separated from each other (Table 7). This is because Villa Alicia is located in the province of Ubaté, which is considered one of the main dairy regions in the Department of Cundinamarca. About 4% of the total milk production in Colombia comes from this province, with great pressure on the natural ecosystems of the area. These natural ecosystems have been transformed for livestock use and, to a lesser extent, for potato, wheat, and barley cultivation. Additionally, there is a high susceptibility to laminar erosion (Municipal Council of Carmen de Carupa, 2000). It is worth mentioning that fragments with useful covers for connectivity that do not have a Functional Core Area can be considered in planning as stepping stones that facilitate movement from one fragment to another. Therefore, these fragments were also registered.
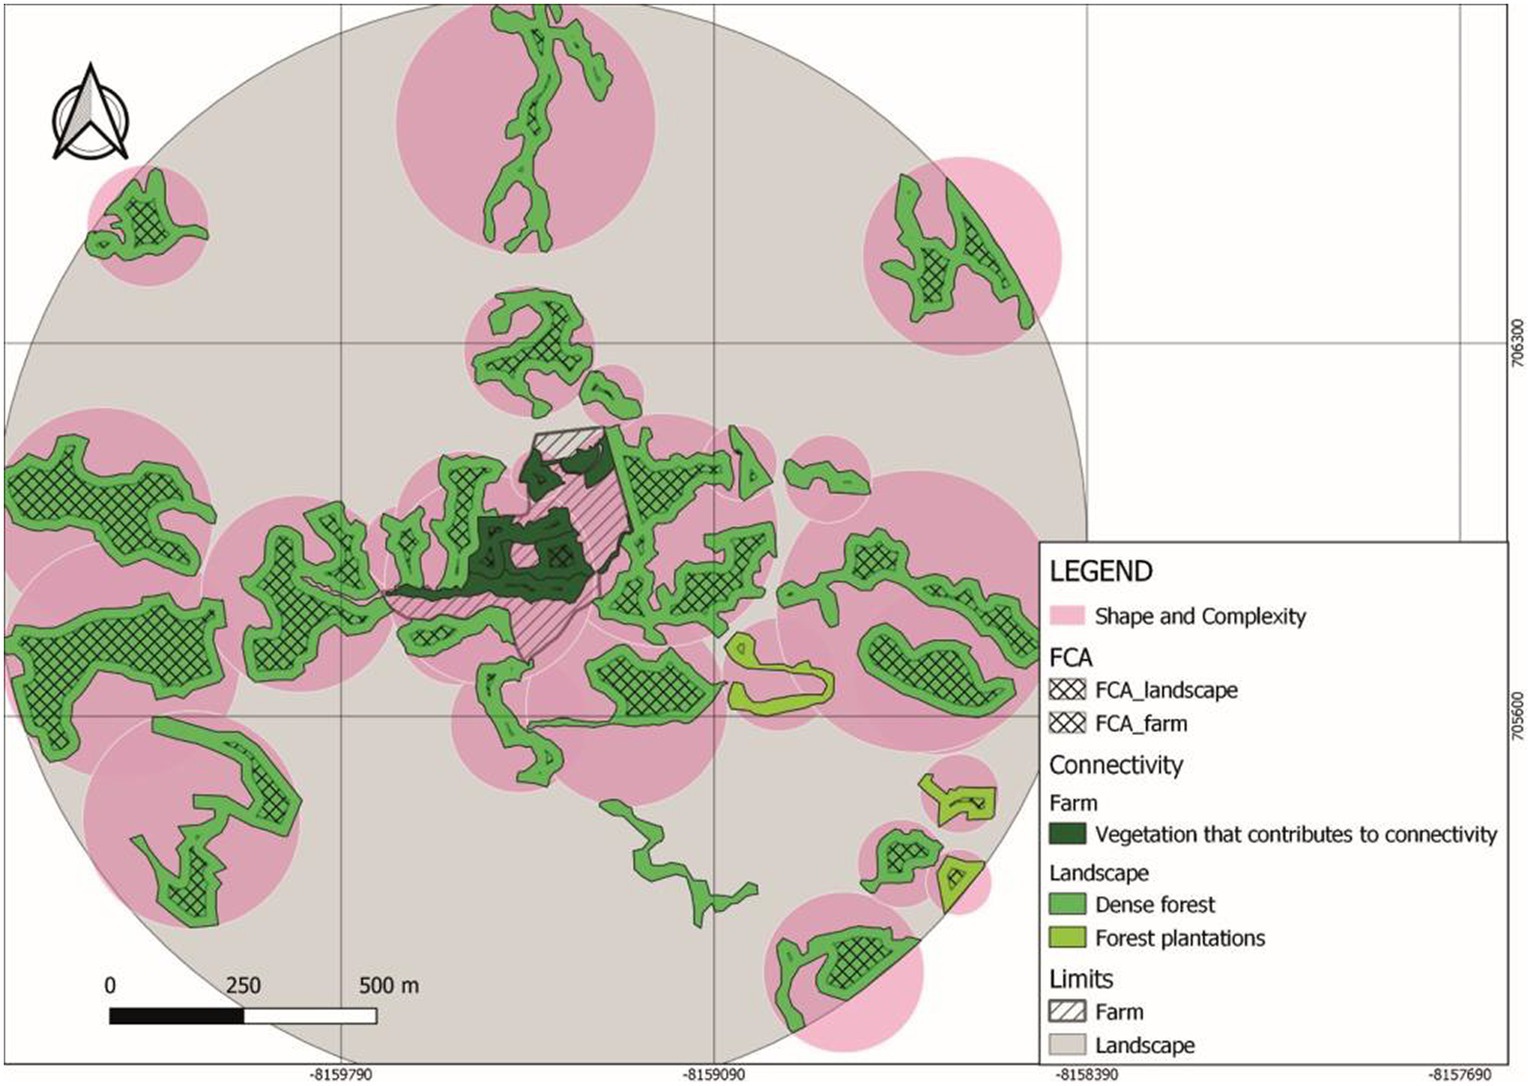
Figure 2. Functional core area (FCA) and shape and complexity (SC) indicators in Tosoly farm and its surrounding landscape.
Table 7. Area of fragments that contribute to connectivity and functional core areas for Tosoly and Villa Alicia farms.
The Distance between Forest Fragments (DFF) (Table 8) showed a degree of difficulty in achieving an inter-species matter and energy exchange (Figure 3) three times greater in the Villa Alicia landscape in comparison with Tosoly. This matter and energy exchange was assessed considering the criteria of a real possibility of creating future and parsimony connectors which is equal to taking the closest connection option in the landscape.
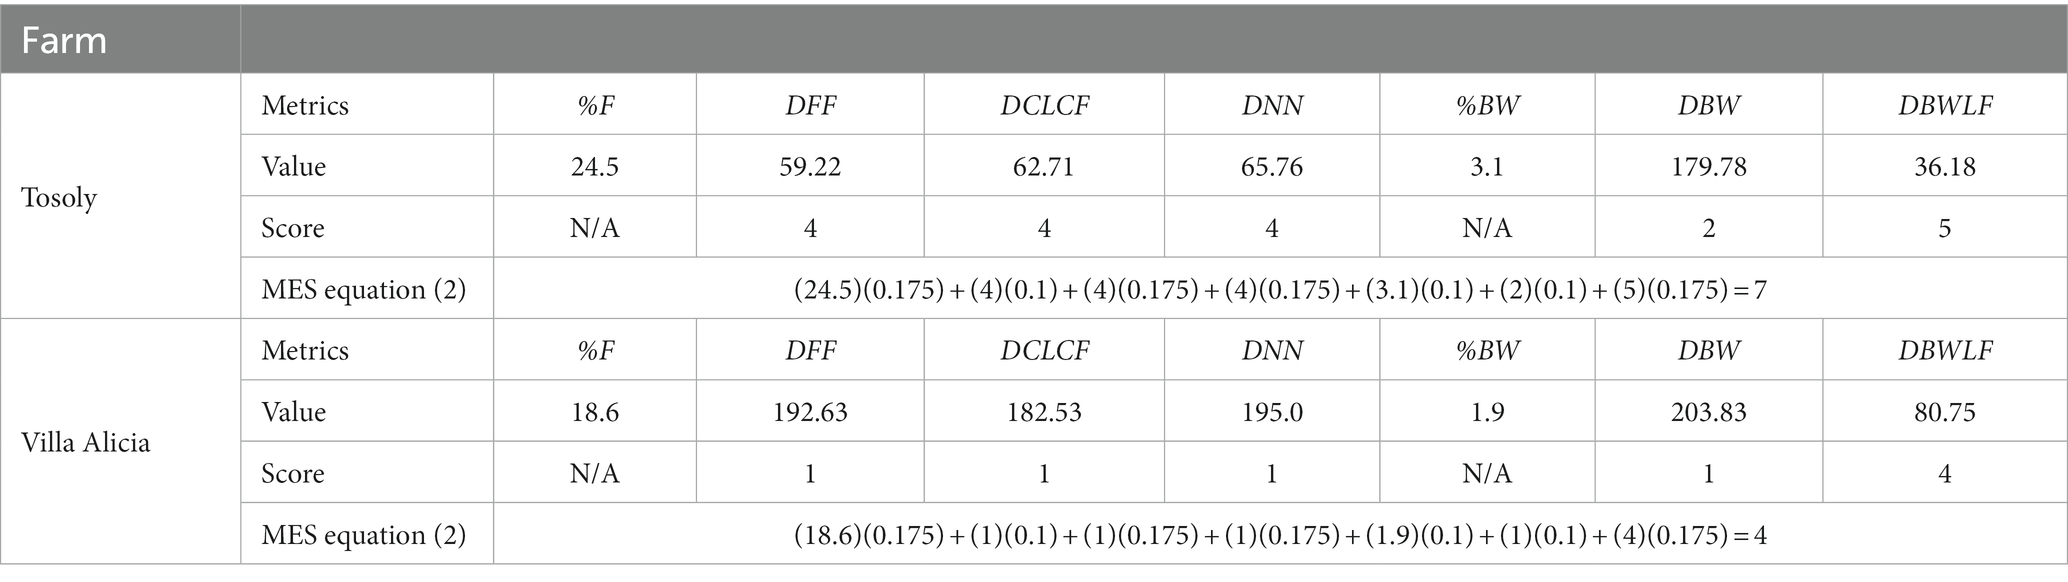
Table 8. Assigned values to the metrics composing the main ecological structure (MES) for Tosoly and Villa Alicia farms.
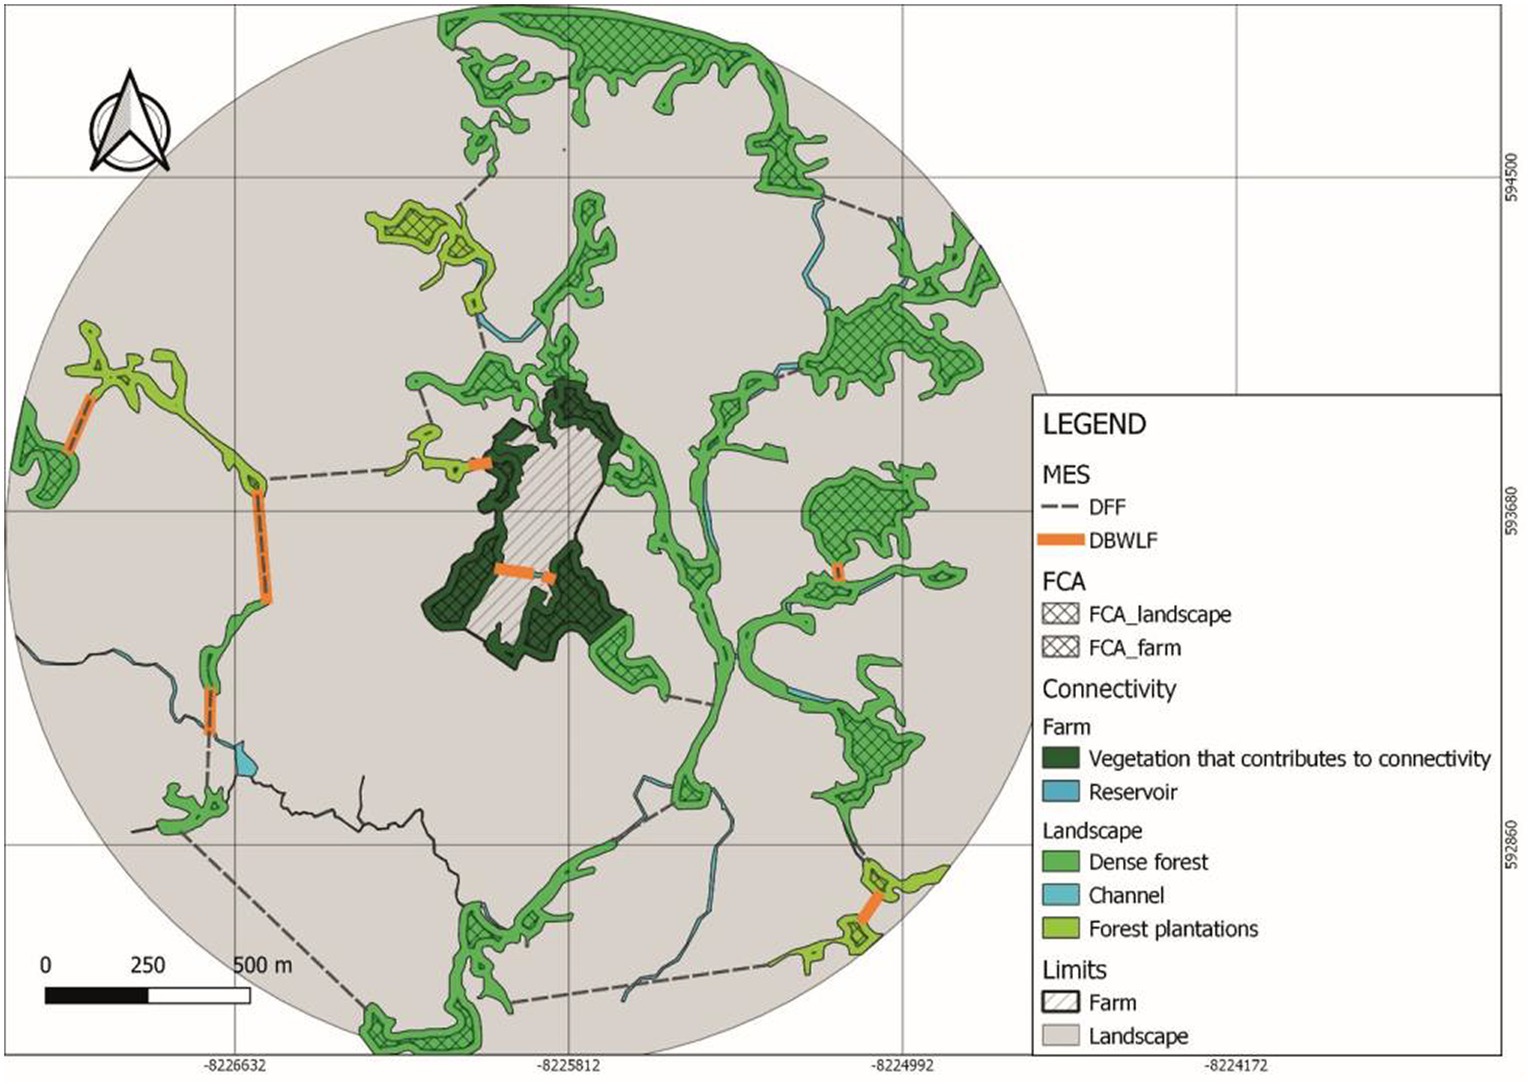
Figure 3. Distance between forest fragments (DFF) and distance between bodies of water and landscape and farm functional core areas (DBWLF) (variables of the Main Ecological Structure [MES]) neighborhood metrics in Villa Alicia farm and its surrounding landscape.
The Distance between Core Areas of the Landscape and Core Areas of the Farm (DCLCF) revealed that Tosoly had better structural connectivity, with an average distance nearly three times shorter than that in Villa Alicia (Table 8). In the latter, the area of influence almost lacked natural ecosystems and very scarce Functional Core Areas, especially to the south and west.
When plotting the waterbody connection network, the Distance between Bodies of Water (DBW) for both farms showed a low score: there were not enough areas with this element to encourage fauna movement towards the farms. However, for Tosoly, at least three bodies of water (0.51 ha) were identified with riparian buffer zones, including forests or agroforestry crops. In contrast, Villa Alicia only had a waterbody (0.05 ha) within the property: one of these waterbody’s edges limits with a clean pasture cover. This situation reduces the likelihood of fulfilling its long-term ecosystem function if no protection strategy is implemented.
The Bodies of Water percentage (%BW) is low for both landscapes. However, for Tosoly, there was greater protection in the riparian buffer zones. For Villa Alicia, there was a lower availability of surface water, and the riparian buffer zones were also more unprotected. Both aspects increase waterbody exposure to contamination by agrochemicals and high concentrations of organic matter, which is common in Ubaté (Concejo Municipal de Carmen de Carupa, 2000).
The Distances required to connect the Bodies of Water with the Functional Core Areas (DBWLF) for Villa Alicia (Figure 3) were more than double compared to Tosoly. However, the scores for the farms were high since the measured distances were not even half the maximum distance (180 m) required by pollinators to move from one fragment to another.
Finally, the Distance to the Nearest Neighbor (DNN) was high for Tosoly because there was a higher density of dense forest fragments compared to Villa Alicia. In the latter, the low density of dense forest fragments meant that their distances were three times greater than in Tosoly.
Both farms presented the highest rating for the External and Internal Connectors (EEC and EIC) (Table 9) because there was continuity with living fences or forest remnants in most of the property boundaries since their managers decided to plan the conservation of these connectors.
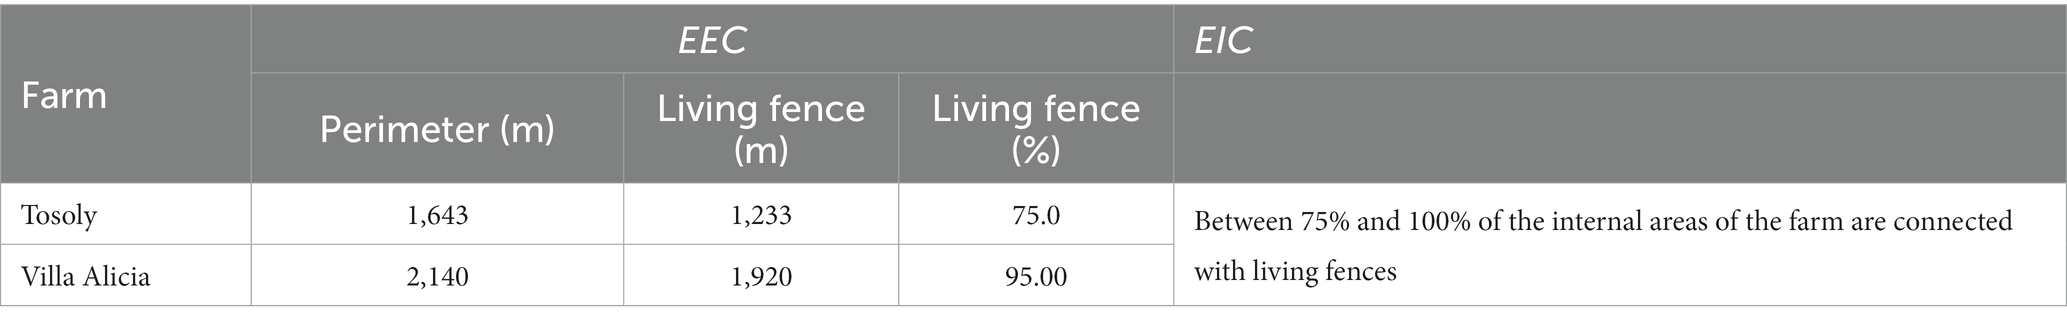
Table 9. Extension of external and internal connectors for Tosoly and Villa Alicia farms.
Shape and Complexity were low in both production systems (Table 10), especially for Villa Alicia where the fragments of interest for connectivity were extremely elongated (between 0.6 and 0.8). This shows both low structural complexity and high edge effects. Tosoly might be roughly considered as circular (between 0.4 and 0.6, respective to 0 as the referential value), and its fragments were more likely to contribute to the connectivity network by providing greater complexity, supporting more biological interactions.
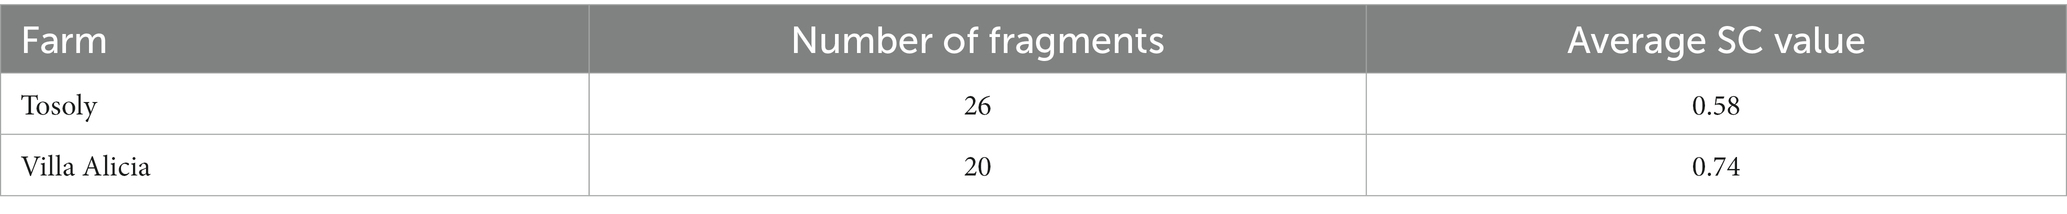
Table 10. Fragment shape and complexity indicator for Tosoly and Villa Alicia farms.
Regarding the complexity of the fragments, the physiognomic formulas for the two corresponding referential forests were established.
According to the symbology in Table 2, the referential formula for Tosoly contained the physiognomy of eight strata (identified while touring the area). The most representative species are shown in Figure 4. Table 11 shows the similarity values with the referential formula for each stratum. The highest stratum W8b did not exist in any of the connectors, which is why it was assigned a value of 0 in all columns. The next stratum V7c was shared thoroughly by connectors CE1 and CI1 (12.5) and partially shared by connectors CE2 and CI2 (6.3). Then, by adding the values of each connector and weighting them using its distance, the rating values for all external (47.7) and internal (48.4) connectors were obtained. Only one of the external connectors CE1 presented a high similarity with the referential forest. However, it is the most extensive connector covering 57% of the farm perimeter, providing greater weighting to the diverse physiognomy of this connector. In addition, CE1 was shared over its entire length with the internal connector CI1, and therefore, the same value of 41.2 was given to the internal connectors.
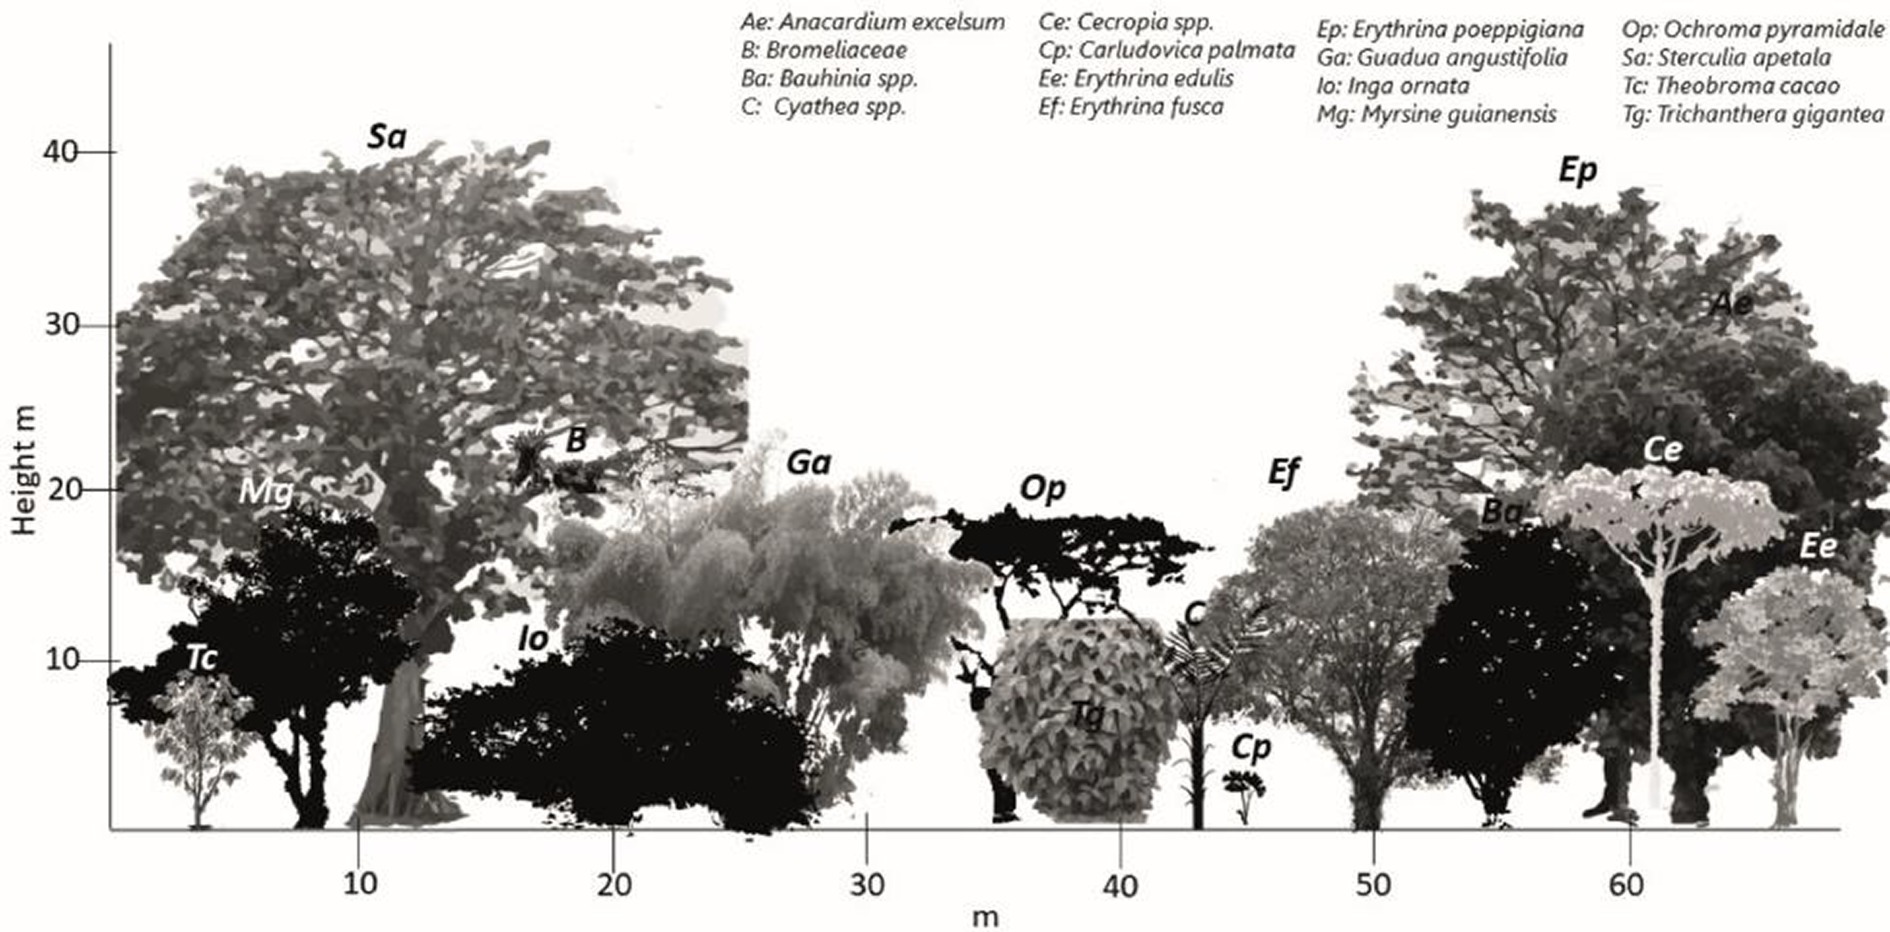
Figure 4. Reference forest profile for the physiognomy formula for Tosoly farm.
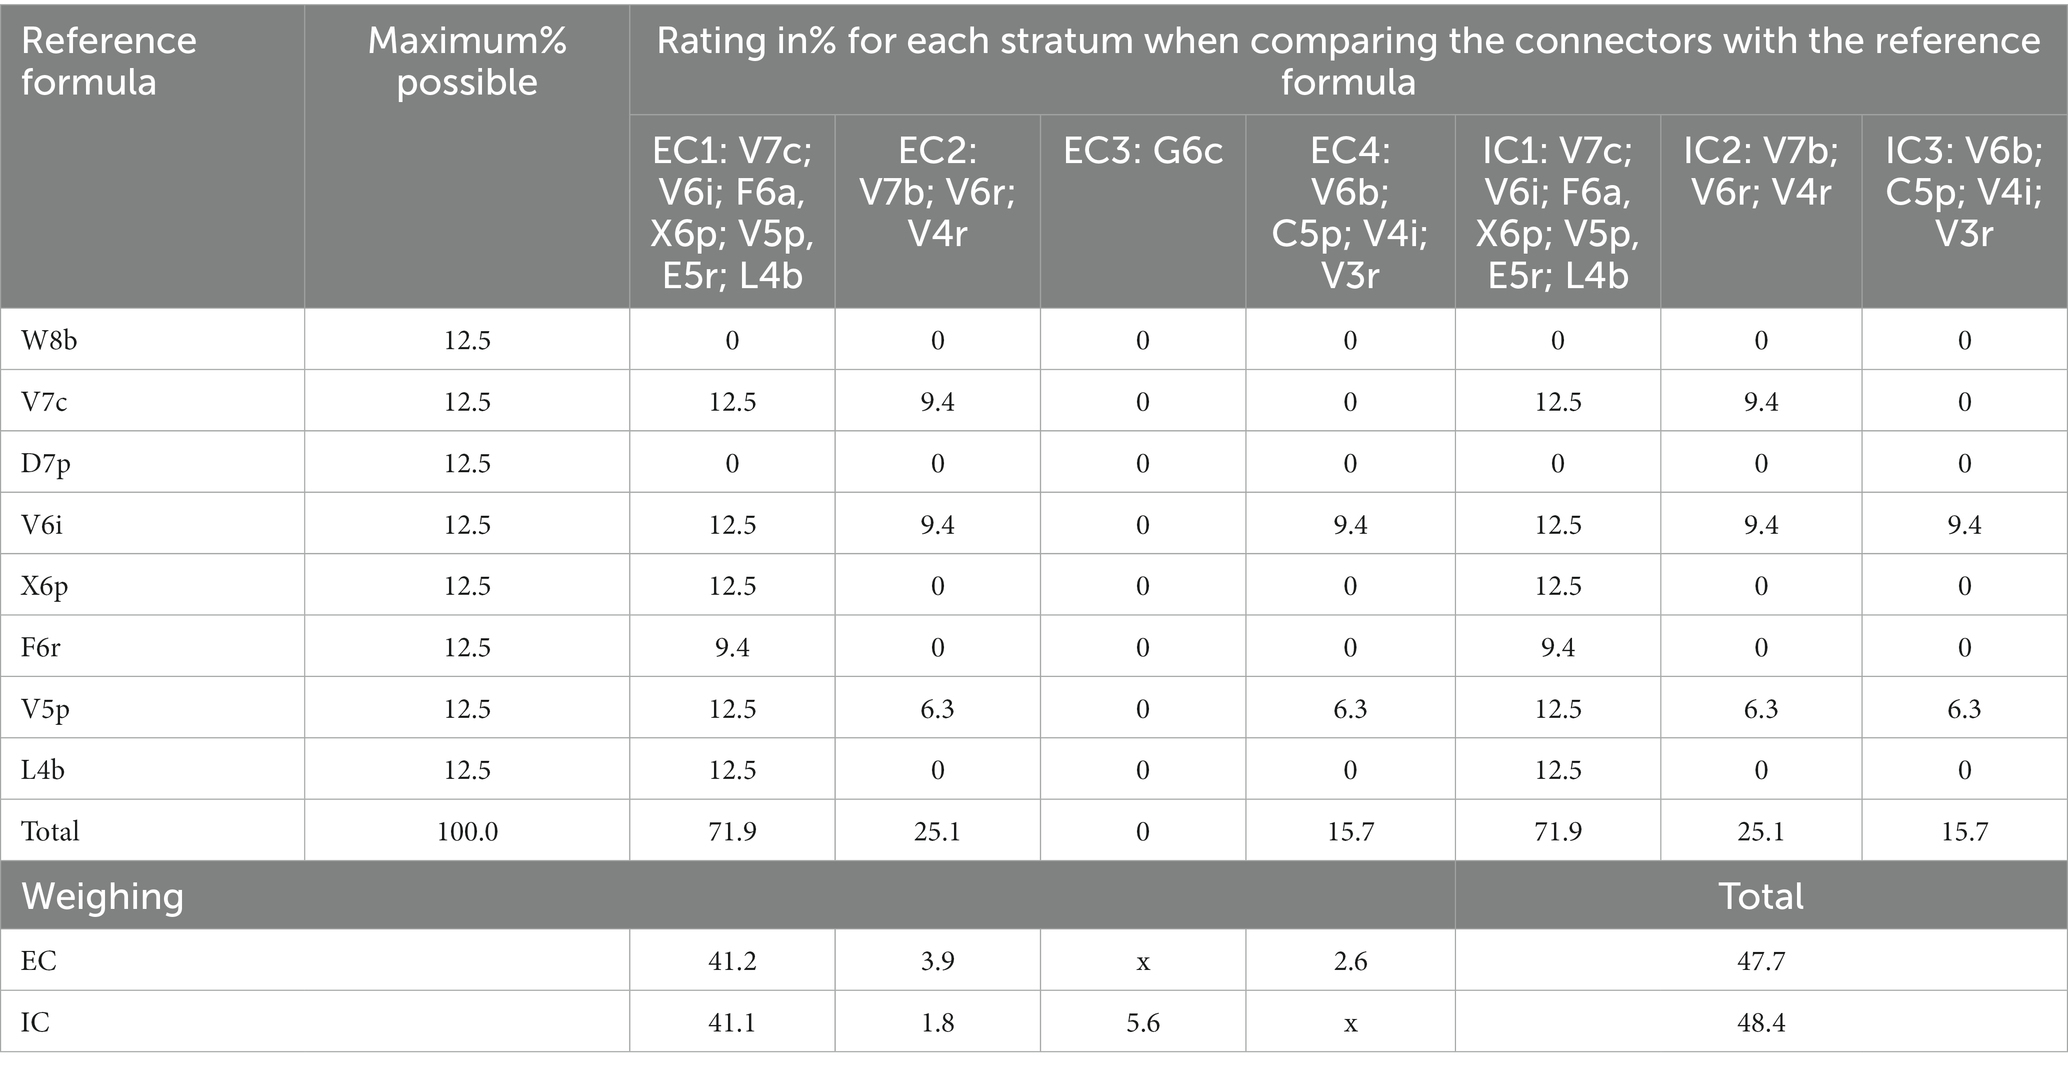
Table 11. Comparison between each external and internal connector of Tosoly farm and the reference forest formula and weighting according to the percentage extension of each connector.
Similarly, the referential formula was established for Villa Alicia. Species such as Cedrela spp. and Quercus spp. and families such as Arecaceae, Bromeliaceae, Piperaceae, Loranthaceae and other hemiparasites and epiphytes were found. Each stratum was compared with the existing physiognomy (Table 12). Only the presence of broadleaf deciduous trees was shared, but there were no more shared elements, not even tree height: this value in the referential forest reached the range between 10 and 20 m, while in the existing connectors, this value did not exceed 5 m. Even when an external connector shared its length with an internal one (finding up to four vertical strata), no strata were similar to the referential forest, which is why this farm obtained the lowest possible score for this indicator.
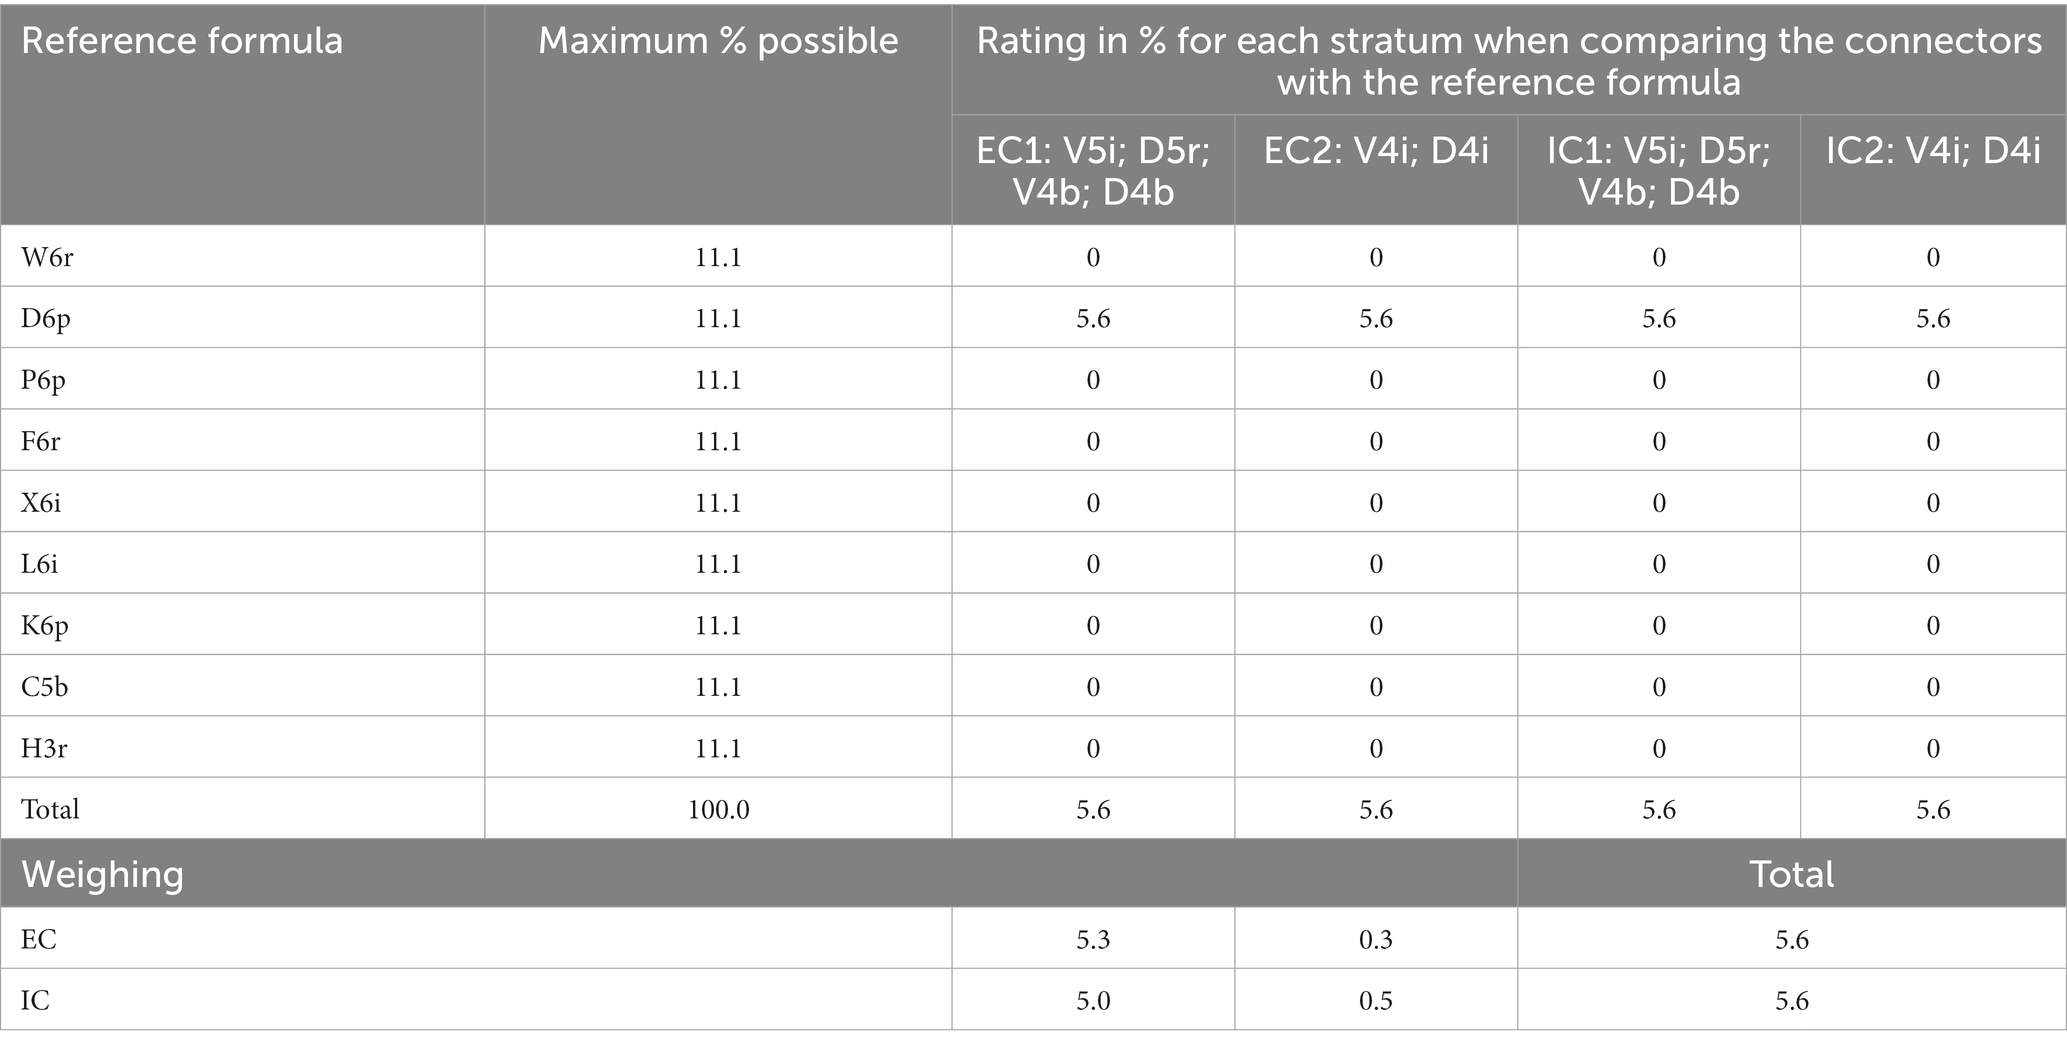
Table 12. Comparison between each external and internal connector of Villa Alicia farm and the reference forest formula and weighting according to the percentage extension of each connector.
3.3 Comparative connectivity
The comparative analysis between both production systems indicates how Tosoly farm showed planning and management focused on sustainable practices that strengthened the functional connectivity network and the exchange of matter and energy with natural ecosystems (Figure 5).
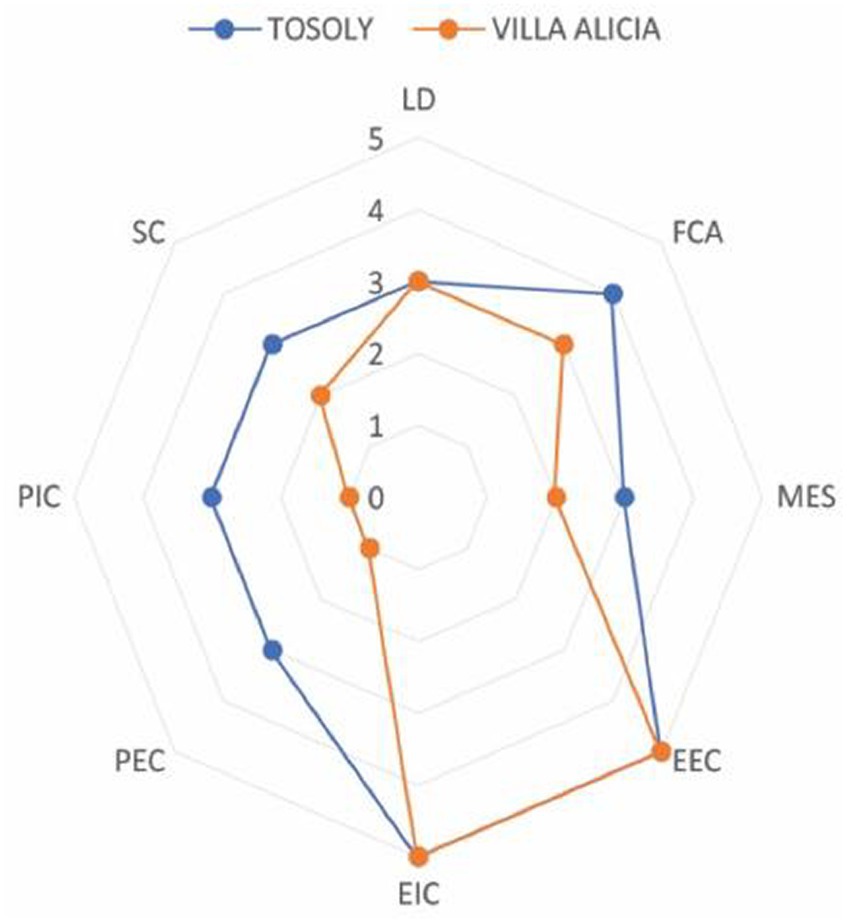
Figure 5. Comparative analysis of the agroecological connectivity index (ACI) for Tosoly and Villa Alicia farms.
Although both farms had similar values for the Landscape Diversity indicator, the edge effects (Functional Core Areas) and the spatial distribution (shortest Distance between Fragments) showcased a connectivity network with more parsimony. Therefore, there is a higher possibility of maintaining and offering ecosystem services to the farms and their productive units.
Due to the initiatives of Tosoly’s managers, wild vegetation native greenhouses have been established. In these greenhouses, seeds from the same native forests of the region are collected, preserved, exchanged, reproduced, and germinated to nurture the conservation areas and build the external and internal connectors of the farm. These actions contrasted with the substantial transformation of the landscape in Villa Alicia, resulting in marked differences in the numerical values of the indicators for the physiognomy of internal and external connectors.
4 Discussion
A paradigm based on biodiversity management for sustainable agriculture represents enormous potential to face many of the current agricultural challenges because it could increase environmental and socioeconomic resilience (Jackson et al., 2007) of production systems and agricultural territories. This paradigm considers biodiversity management as creative, pragmatic, and planned but mostly as a key component of the agro-productive designing processes.
The expansion of the agricultural frontier implies the destruction of extensive areas of wild biodiversity with a direct impact on the attributes of the forest (Safar et al., 2022). However, there are more rational alternatives to landscape modification that do not radically disturb ecological attributes and, on the contrary, guarantee the spatial flow of ecosystem services varying according to landscape structure (Assis et al., 2023). Agroecology proposes the application of transitional principles towards sustainability based on biodiversity management for the transformation of productive systems (Nicholls et al., 2016). Such management allows biodiversity use, conservation, and enrichment at the farm level, increasing productivity and reducing pressure on the landscape (Thrupp, 2004). However, productive strategies (use of living fences, covers, crop association, agroforestry, and composting, among others) are not enough to enrich biodiversity within productive systems (Nicholls et al., 2016) since farms undoubtedly interact with ecosystem components surrounding them. Therefore, agroecological planning is not only exclusively inherent to the farm but also involves the landscape. In its conceptual and methodological evolution, agroecology has integrated a larger scope into its analysis, moving from the plot and farm to the landscape unit (Wezel et al., 2020).
There is increasing scientific evidence for the need to closely link landscape ecology with agroecology to move towards the transformation of agricultural systems (Batáry et al., 2020). This study proposed the Agroecological Connectivity Index as a diagnostic and planning tool that considers the ecosystem and agroecosystem structure of both landscape and production systems from the perspective of ecological structure functional connectivity. Its operation allows adequate farm planning for the production of healthy food and biodiversity conservation.
4.1 Environmental ecological functions and connectivity
In an analysis carried out on more than 172 agricultural production projects worldwide, Mijatovic et al. (2013) showed how biodiversity contributed to landscape resilience through ecological restoration practices, productive diversification, and soil and water management, and all activities promoted by agroecological approaches. Ecological functions developed by agroecological processes in agriculture have valuable repercussions for sustainable production, especially for the protection of pollinating populations and natural enemies considered critical ecological services for agricultural systems (Liere et al., 2017). Functional connectivity represents a particularly pivotal issue in agricultural landscapes where the Green Revolution agriculture has intensified. This is because monoculture trends in large areas have made remaining patches of biodiverse wild vegetation scarce. In addition, such trends do not guarantee the continuity of functionally desirable species for agriculture (Harvey, 2009). However, projects such as those mentioned above, carefully planned, and with property design processes manage to reactivate these essential functions for a more balanced operation of production systems.
Connectivity is a function of the distribution and types of natural vegetation patches in the agricultural landscape (Hilty et al., 2006) evidenced in the indicators used for the ACI and applied to Tosoly and Villa Alicia. In general, landscapes with a high degree of functional connectivity, those maintaining large areas of natural vegetation with short distances between remaining patches while having extensive corridor networks that facilitate species mobility, have the greatest likelihood of preserving species populations (Bennet, 1999). In that sense the farm Tosoly is an example of higth functional connectivity because have short distances beetwen patches of natural vegetation and can provide a network of corridors. Blann (2006), Castell and Almarales (2021), Liccari et al. (2022), and Miñarro, et al. (2023) ratify how the different land uses in the surrounding landscape and the degree to which a patch is connected to similar patches determine not only the abundance and richness of species but also ecological processes associated to them (seed dispersal, prey–predator interactions, and pollination, among others). The sole presence of tree corridors of a single species does not guarantee adequate connectivity and flow of species through them. Thus, conserving patches and corridors with vegetation comparable to the native one found in the region enables the highest flow of pollinators, biological controllers (Saunders, 2016), as well as native microfauna that require exclusively unmodified habitats (Sanabria et al., 2016). The scarce structure of the connectors for Villa Alicia was related to land uses in the surrounding landscape. A historical look at the landscape transformation showed that, for at least two decades, only 19% of the covers might have potentially contributed to connectivity. The rest have been transformed into clean pastures or monocultures. This limits any possibility of connectivity and expansion of ecosystem functions within the region.
It is well-founded to integrate ecological connectivity into the planning processes of the farm and the landscape through diverse biological corridors (Gutiérrez-Chacón et al., 2020). These corridors expand the insect trophic networks and promote exchanges of associated fauna and flora due to their high capacity to fulfill ecosystem functions that can be useful for agricultural production processes. However, this does not occur immediately after the establishment of the corridor but, along the restoration process of the physiognomy of local ecosystems. Knowledge of the complexities between landscape ecology and agroecology allows a comprehensive vision of the ecosystems’ spatial distribution. Additionally, being able to recognize the connections of the ecosystems with human activities allows and improves their conservation and management.
4.2 Landscape analysis based on connectivity indicators
The study of the landscape in terms of agroecological connectivity and environmental functions that can be used by agroecosystems must be analyzed from a systemic approach. For landscape studies, the importance of natural vegetation fragments is no longer questionable: what is important now is to develop a comprehensive and detailed understanding of when and how fragmentation matters (Rybicki et al., 2020). In this case, this understanding is necessary for procuring an ecosystem balance at the productive system level.
In this regard, two components influence the potential connectivity for a species, community, or ecological process: the structural and the functional (Fahrig et al., 2011; Ana Milena Alonso et al., 2017; Liere et al., 2017). The structural component corresponds to the spatial connection of different types of habitats in the landscape, and the functional component refers to the spatial arrangement and composition of the habitats, which generates a behavioral response of individuals and species towards the landscape’s physical structure. Thus, the ACI incorporates indicators related to these two crucial landscape components.
One of the structural indicators is the landscape diversity (LD) which makes an inventory of covers and uses and focuses on characterizing the fragmentation degree of the landscape to identify whether the matrix is governed by natural fragments (when it is greater than 50%) or not.
The main ecological structure (MES) integrates five landscape metrics to measure the distances at which fragments of natural vegetation and bodies of water can be found. Its interpretation scale was structured for pollinators, considering that wild bees do not fly beyond 180 m from their hives and, therefore, the effective pollination ecosystem service cannot occur outside this range of action (Pantoja et al., 2014).
The functional core area (FCA) analyzes the edge effect as an important characteristic in vegetation patches in fragmented landscapes that generates changes at different levels due to the transition between diverse ecosystems. For example, at the microclimatic level and within the physical soil conditions, the edge effect makes the composition and structure of the vegetation different in the perimeter and inside the forest (Fox et al., 1997). Consequently, it also affects insect diversity (Harvey, 2009). The fragments that show a Functional Core Area (those that exceed the edge effect) are taken into account for connectivity networks and the calculation of other indicators. The fragments that do not show this characteristic are regarded as “stepping stones” but are not mandatorily included in the neighborhood connections in the connectivity networks. FCA does not take into account riparian forests since the edge effect is null when limited by a waterbody (Granados-Sánchez et al., 2006). No limitation was determined in the size of the Functional Core Areas since it has been shown that small tree covers (≤1 ha) within agricultural matrixes are essential to maintain landscape connectivity as they have different functions (perching places, “stepping stones,” dispersal routes, and additional habitats for the associated fauna). This proves even more critical for animals that move daily for short distances (Saura et al., 2014; Cadavid-Florez et al., 2020).
Shape and complexity (SC) is another structural indicator related to the edge effect. It detects thin and elongated patches compared to a hypothetical circle, which is considered as the desirable shape, since it reduces said effect by the minimum (Patton, 1975; Saura and Carballal, 2004) and facilitates the balance of ecosystem relationships within the fragments (Fox et al., 1997). The relevance of the indicator is higher when the landscape matrix generates stronger resistance to the movement of fauna or dispersal of flora. This is the case of a matrix dominated by clean pastures and constant livestock and monoculture dynamics, as for Villa Alicia.
Other structural indicators are the extension of connectors, both internal and external (EIC, EEC). They identify the connection routes between natural fragments through which their functions extend. For example, soils of these connection routes act as more effective repositories of organic carbon, promote infiltration and reduce run-off, and increase the diversity of organisms such as earthworms and even arbuscular mycorrhizae (Holden et al., 2019). They also contribute to the restoration of fragmented agricultural landscapes (Francesconi et al., 2011). In the internal connectors at the farm level, there may be more controlled management and more rigorous monitoring through the implementation of basic agroecological practices that favor pollination and biological control.
The functionality of the landscape analyzes the functional value of the fragment in relationship to its size. The quality of the fragment refers to how much its structure and floristic composition has been modified, that its structure and floristic quality have had. Therefore, the more modified or degraded the fragment is, the lower its quality is (Kennedy et al., 2003). In the ACI, this characteristic is analyzed through Physiognomy Indicators of Internal and External Connectors (PIC, PEC). These Physiognomy Indicators are based on the analog forestry methodology (Senanayake and Jack, 1998; Meijboom, 2007; IAFN-RIFA, 2016), and they describe the physiognomy (external appearance) of the vertical structure of the fragments that serve as connectors.
This comparative analysis of Physiognomy Indicators is carried out considering that agricultural modifications in an ecosystem can be established while trying to imitate the initial ecosystemic architecture. In this sense, it is possible to maintain many of the initial natural ecosystem functions (Scherr and McNeely, 2009). The analysis begins with a description of a referential forest by direct observation: a nearby patch is highly preferable, but if it is not available, the description can be established using local knowledge and secondary information about the biome, life zone, and vegetation inventories of the natural ecosystem comparable to the analyzed area. This referential forest description is then compared to the external and internal connectors, and even future monitoring might be carried out. The descriptions should primarily focus on the species’ adult forms (IAFN-RIFA, 2016). Analyzing the proximity of fragments of similar composition is crucial because specific species might move between patches of vegetation in the landscape if they are similar and relatively close to each other. However, if those patches are considerably distant, such mobility can be hampered. In this way, landscapes are functionally connected when wild species can move freely from one patch to another within the same landscape (Harvey, 2009).
Several studies on the ecological structure of the landscape and its effects on agricultural processes have been conducted in Colombia. The use of the MAS index applied to high Andean regions dedicated to livestock and milk production has shown how a landscape structure with high connectivity is directly related to the increase in agrobiodiversity and positively related to functions, such as the increase of soil organic matter (Quintero et al., 2022). The MAS index has also been applied to citrus cultivars, finding that a greater ecological structure improves the resilience capacity of agroecosystems against climate variability phenomena (Cleves 2018). Another study demonstrated how forest and waterbody connectivity reduces the incidence of the two main pests of oil palm in highland regions (Opsiphanes cassina and Rhynchophorus palmarum) (Gómez et al., 2023).
4.3 Planning the agroecological transition
Agroecological designs do not only enrich biodiversity within the farm but simultaneously enhance functions between fragments of natural habitat (Vandermeer and Perfecto, 2007). For this reason, it is important to act inside and outside the production system. Within the production system, one of the essential activities is to promote connectivity restorative practices such as the use of living fences, agroforestry crops, crop association, cover crops etc. Such practices should be strategically located to enhance both structure (fragment size) and functionality (fragment quality) of the farm. Additionally, these practices benefit the services of the agroecological production process, especially pollination and biological control of pests, diseases, and weeds (Altieri, 1999; Crowder and Jabbour, 2014). Agroforestry and silvipastoral crops deserve special attention as they correspond to strategies that increase above-ground biodiversity and activation of ecosystem functions. A study carried out with silvipastoral systems based on Leucaena leucocephala in the Colombian Andes showed a higher number of native ants compared to treeless grasslands (Rivera et al., 2013).
While agroecological connectivity within the farm represents a process over which the managers of the productive system have absolute control, connectivity outside the productive system implies a negotiation process with other actors. The result of this negotiation escapes the decision of a single agroecological producer. In this way, when assuming the agroecological transition outside the productive system, the construction of community agreements for an adequate territorial intervention is quintessential. This is known as the territorial agroecological governance process (Camacho et al., 2020). This process requires closer articulation and effort at institutional and community levels to guarantee action-oriented policies for agrobiodiversity conservation that provide public benefits (Thrupp, 2004).
5 Conclusion
Agroecological farm planning based on the functional connectivity in the farm and landscape is in a paradigm context different from the one associated with a productivist farm and territorial planning since it analyzes the structure and functions of the landscape from a systemic approach and takes advantage of them for restoring the ecosystem balance. From this perspective, the landscape is an agroecological matrix with natural vegetation fragments and agroecosystems that retain the functionality of natural ecosystems in favor of agroecological production processes at the farm and the regional level.
Agroecology must not be understood as limited to reducing the use of synthetic inputs or substituting biological and organic inputs. Therefore, the agroecological transition process must be reconsidered: it begins with a complete redesign of the productive system, articulating it to the landscape. The authors argue that such a transition must start from recognizing the connectivity status within the productive system and the area of influence of the landscape over the farm. Essentially, the transition must be carried out inside and outside the production system.
The ACI incorporates landscape indicators and metrics that show aspects of both the structure and functionality of the landscape. In the Colombian case studies analyzed, Villa Alicia, located in Cundinamarca, showed a weak ACI index (2.59 on a scale between 1 and 5): the farm presented fewer productive uses, both in its interior and in the landscape. This situation translated into a low main ecological structure and reduced complexity and physiognomy of its connectors. In contrast, Tosoly, located in Santander, showed moderate functional connectivity (3.59) due to a good MES and a high score of functional core areas. The suggested methodology allowed the analysis of the fragmentation and quantity and quality of the habitat, which supported the design of productive agroecosystems that simultaneously comply with conservation strategies.
In future studies, it is necessary to analyze the relationship between the ACI and the dynamics of populations of pollinating insects and organisms that control pests and diseases. The purpose of such analysis is to establish incidental relationships between the introduced indicators and the ecological processes that are triggered by the structure and operation of the connectivity elements present or included in the productive systems and the landscape.
From the social perspective, it is decisive to change individual and community attitudes to ensure collective action to conserve the ecosystem. The transformation of the landscape matrix is undoubtedly achieved from the transformation of each of its segments (farms) while constantly avoiding the interruption of connectors and planning connectivity through the farms to recover the regional ecological structure. One question is open to debate here: how much are the farmers aware and willing to contribute to a coordinated effort in the territorial transformation when productive planning, in general, is done individually and disjointed?
Additionally, community action on the landscape must be strengthened with public policies that promote collective connectivity actions. Social action (participatory governance) and public action (institutional policies) can create a new order which is capable of recovering and invigorating the ecosystem balance needed for agroecological production.
Data availability statement
The raw data supporting the conclusions of this article will be made available by the authors, without undue reservation.
Author contributions
ÁA-O: Formal analysis, Investigation, Supervision, Writing – review & editing. JC: Conceptualization, Data curation, Formal analysis, Investigation, Methodology, Writing – original draft. AM-P: Formal analysis, Investigation, Methodology, Writing – original draft.
Funding
The author(s) declare that no financial support was received for the research, authorship, and/or publication of this article.
Conflict of interest
The authors declare that the research was conducted in the absence of any commercial or financial relationships that could be construed as a potential conflict of interest.
Publisher’s note
All claims expressed in this article are solely those of the authors and do not necessarily represent those of their affiliated organizations, or those of the publisher, the editors and the reviewers. Any product that may be evaluated in this article, or claim that may be made by its manufacturer, is not guaranteed or endorsed by the publisher.
References
Acevedo-Osorio, Á. (2016). Monofuncionalidad, Multifuncionalidad e Hibridación de funciones de las agriculturas en la cuenca del río Guaguarco, sur del Tolima. Revista Luna Azul 43, 251–285. doi: 10.17151/luaz.2016.43.12
Altieri, M. A. (1999). The ecological role of biodiversity in agroecosystems. Ecosyst. Environ. 74, 19–31. doi: 10.1016/S0167-8809(99)00028-6
Altieri, M. A., and Nicholls, C. I. (2007). Biodiversidad y manejo de plagas en agroecosistemas. Barcelona, Icaria.
Altieri, M., and Nicholls, C. (2012). Agroecology scaling up for food sovereignty and resiliency. Sustain Agric Rev 11, 1–29. doi: 10.1007/978-94-007-5449-2_1
Alonso, F., Finegan, B., Brenes, C., Günter, S., and Palomeque, X. (2017). Evaluación de la conectividad estructural y funcional en el corredor de conservación Podocarpus-Yacuambi. Caldasia 39, 143–156. doi: 10.15446/caldasia.v39n1.64324
Assis, J. C., Hohlenwerger, C., Metzger, J. P., Rhodes, J. R., Duarte, G. T., da Silva, R. A., et al. (2023). Linking landscape structure and ecosystem service flow. Ecosyst. Serv. 62:101535. doi: 10.1016/j.ecoser.2023.101535
Batáry, P., Báldi, A., Ekroos, J., Gallé, R., Grass, I., and Tscharntke, T. (2020). Biologia Futura: landscape perspectives on farmland biodiversity conservation. Biologia Futura 71, 9–18. doi: 10.1007/s42977-020-00015-7
Bennet, A. F. (1999). Linkages in the landscape: The role of corridors in connectivity in wildlife conservation. Gland, Switzerland and Cambridge, UK: World Conservation Union (IUNC).
Blann, K. (2006). Habitat in agricultural landscapes: How much is enough? A state of the science literature review. Defenders of wildlife. US.
Cadavid-Florez, L., Laborde, J., and Mclean, D. J. (2020). Isolated trees and small woody patches greatly contribute to connectivity in highly fragmented tropical landscapes. Landsc. Urban Plan. 196:103745. doi: 10.1016/j.landurbplan.2020.103745
Camacho, L.C., Acevedo-Osorio, Á., and Velásquez, M.X. (2020). Gobernanza territorial para el fortalecimiento de procesos en transición agroecológica: Caso Sumapaz-Cundinamarca. VII Congreso Latinoamericano de Agroecología, Montevideo, Uruguay. Available at: https://www.researchgate.net/publication/347525199_Gobernanza_territorial_para_el_fortalecimiento_de_procesos_en_transicion_agroecologica_Caso_Sumapaz-Cundinamarca
Castell and Almarales. (2021). Conectividad de paisajes en la finca agroforestal “El Ocho de Mella”, Santiago de Cuba, Cuba: Acta botánica cubana, 220, 1–15.
Cleves, A. (2018). Resiliencia de agroecosistemas citrícolas a la variabilidad climática en el departamento del Meta, Colombia (Doctoral dissertation, Universidad Nacional de Colombia-Sede Bogotá).
Crooks, K., and Sanjayan, M. (2006). Connectivity conservation. Cambridge: Cambridge University Press.
Crowder, D. W., and Jabbour, R. (2014). Relationships between biodiversity and biological control in agroecosystems: current status and future challenges. Biol. Control 75, 8–17. doi: 10.1016/j.biocontrol.2013.10.010
Calabuig, E. L. (2013). “Corredores, conectividad y ecología del paisaje” in Planificación Espacial y Conectividad Ecológica: Corredores Ecológicos. eds. P. Herrera, Y. Santos, and L. Ganges (Spain: Instituto Universitario de Urbanística, Universidad de Valladolid)
Fahrig, L. (2013). Rethinking patch size and isolation effects: the habitat amount hypothesis. J. Biogeogr. 40, 1649–1663. doi: 10.1111/jbi.12130
Fahrig, L., Baudry, J., Brotons, L., Burel, F. G., Crist, T. O., Fuller, R. J., et al. (2011). Functional landscape heterogeneity and animal biodiversity in agricultural landscapes. Ecol. Lett. 14, 101–112. doi: 10.1111/j.1461-0248.2010.01559.x
Forman, R. (1995). Land mosaics: The ecology of landscapes and regions. Cambridge: Cambridge University Press.
Fox, B. J., Taylor, J. E., Fox, M. D., and Williams, C. (1997). Vegetation changes across edges of rainforest remnants. Biol. Conserv. 82, 1–13. doi: 10.1016/S0006-3207(97)00011-6
Francesconi, W., Montagnini, F., and Ibrahim, M. (2011). “Living fences as linear extensions of Forest remnants: A strategy for restoration of connectivity in agricultural landscapes” in Restoring degraded landscapes with native species in Latin America (environmental remediation technologies, regulations and safety). eds. F. Montagnini and C. Finney (New York: Nova Science Publishers Inc.), 115–126.
Gómez, A. M., Domptail, S., Magiera, A., and Waldhardt, R. (2023). How landscape characteristics in a heterogeneous oil palm plantation mitigate pest abundance: A case study from Mapiripán. Colombia. Forest Ecol. Manag. 540:121061. doi: 10.1016/j.foreco.2023.121061
Granados-Sánchez, D., Hernández-García, M. Á., and López-Ríos, G. F. (2006). Ecología de las zonas ribereñas. Revista Chapingo. Serie ciencias forestales y del ambiente 12, 55–69.
Gutiérrez-Chacón, C., Valderrama-A, C., and Klein, A. M. (2020). Biological corridors as important habitat structures for maintaining bees in a tropical fragmented landscape. J. Insect Conserv. 24, 187–197. doi: 10.1007/s10841-019-00205-2
Harvey, C. A. (2009). “Designing agricultural landscapes for biodiversity conservation” in Farming with nature. The science and practice of Ecoagriculture. eds. S. J. Scherr and J. A. McNeely (Washington and London: Island Press), 1–16.
Hill, S. B., and MacRae, R. J. (1996). Conceptual framework for the transition from conventional to sustainable agriculture. J. Sustain. Agric. 7, 81–87. doi: 10.1300/J064v07n01_07
Hilty, J. A., Lidicker, W. Z., and Merenlender, A. M. (2006). Corridor ecology: The science and practice of linking landscapes for biodiversity conservation. Washington and London: Island Press.
Hilty, J., Worboys, G. L., Keeley, A., Woodley, S., Lausche, B., Locke, H., et al. (2020). Guidelines for conserving connectivity through ecological networks and corridors. Best Practice Protected Area Guidelines. doi: 10.2305/IUCN.CH.2020.PAG.30.en
Holden, J., Grayson, R. P., Berdeni, D., Bird, S., Chapman, P. J., Edmondson, J. L., et al. (2019). The role of hedgerows in soil functioning within agricultural landscapes. Agric. Ecosyst. Environ. 273, 1–12. doi: 10.1016/j.agee.2018.11.027
IAFN-RIFA. (2016). Forestería Análoga: Una guía práctica para la restauración de la biodiversidad. Available at: http://www.analogforestry.org/resources/publications/?lang=es
IDEAM. (2010a). Leyenda Nacional de Coberturas de la Tierra. Metodología CORINE Land Cover adaptada para Colombia, Escala 1. Available at: http://siatac.co/c/document_library/get_file?uuid=a64629ad-2dbe-4e1e-a561-fc16b8037522&groupId=762
IDEAM. (2010b). Atlas Climatológico de Colombia 1981–2010. Available at: http://atlas.ideam.gov.co/visorAtlasClimatologico.htm
Jackson, L. E., Pascual, U., and Hodgkin, T. (2007). Utilizing and conserving agrobiodiversity in agricultural landscapes. Agric. Ecosyst. Environ. 121, 196–210. doi: 10.1016/j.agee.2006.12.017
Kennedy, C., Wilkinson, J., and Balch, J. (2003). Conservation thresholds for land use planners. Washington: Environmental Law Institute.
León, T. (2010). “Agroecología: desafíos de una ciencia ambiental en construcción” in Vertientes del pensamiento agroecológico: fundamentos y aplicaciones. eds. T. León and M. Altieri, (Bogotá: Opciones Gráficas Editores) 53–77.
León, T. (2012). Agroecología: la ciencia de los agroecosistemas. Colombia. La perspectiva ambiental. Instituto de Estudios Ambientales/Universidad Nacional de Colombia.
León-Sicard, T. E., Calderón, J. T., Martínez-Bernal, L. F., and Cleves-Leguízamo, J. A. (2018). The Main Agroecological structure (MAS) of the agroecosystems: concept, methodology and applications. Sustain. For. 10:1–21. doi: 10.3390/su10093131
Liccari, F., Boscutti, F., Bacaro, G., and Sigura, M. (2022). Connectivity, landscape structure, and plant diversity across agricultural landscapes: novel insight into effective ecological network planning. J. Environ. Manag. 317:115358. doi: 10.1016/j.jenvman.2022.115358
Liere, H., Jha, S., and Philpott, S. M. (2017). Intersection between biodiversity conservation, agroecology, and ecosystem services. Agroecol. Sustain. Food Syst. 41, 723–760. doi: 10.1080/21683565.2017.1330796
(Millennium Ecosystem Assessment). (2005). Ecosystems and wellbeing: Synthesis. US: World Resources Institute.
Marasas, M., Blandi, M. L., Dubrovsky, D., and Fernández, V. (2014). “Transición Agroecológica: de sistemas convencionales de producción a sistemas de producción de base ecológica. Características, criterios y estrategias” in Agroecología: bases científicas para el diseño y manejo de agroecosistemas sustentables. eds. S. Sarandón and C. Flores (Montevideo: Universidad de La Plata), 411–436.
Martínez, R. (2002). Agroecología: atributos de sustentabilidad InterSedes. 3(5), 25–45. Available at: http://revistas.ucr.ac.cr/index.php/intersedes/article/view/852
Matteucci, S. D. (1998). “La cuantificación de la estructura del paisaje” in Sistemas Ambientales Complejos: Herramientas de Análisis Espacial. eds. S. D. Matteucci and G. D. Buzai (Argentina: EUDEBA)
Meijboom, M. (2007). Analog Forestry Application in Vietnam A Step-by-step Guide. Available at: https://www.naturefund.de/fileadmin/pdf/Agroforst/2007%20-%20Marianne%20Meijboom%2C%20Analog%20Forestry%20Application%20in%20Vietnam%20A%20Step-by-step%20Guide.pdf
Mijatovic, D., Van Oudenhoven, F., Eyzaguirre, P., and Hodgkin, T. (2013). The role of agricultural biodiversity in strengthening resilience to climate change: towards an analytical framework. Int. J. Agric. Sustain. 11, 95–07. doi: 10.1080/14735903.2012.691221
Miñarro, M., García, D., and Rosa-García, R. (2023). Pollination of exotic fruit crops depends more on extant pollinators and landscape structure than on local management of domestic bees. Agric. Ecosyst. Environ. 347:108387. doi: 10.1016/j.agee.2023.108387
Moonen, A.-C., and Bárberi, P. (2008). Functional biodiversity: an agroecosystem approach. Agric. Ecosyst. Environ. 127, 7–21. doi: 10.1016/j.agee.2008.02.013
Municipal Council of Carmen de Carupa, 2000. (2000). Acuerdo No. 012 del 2000 (Por medio del cual se adopta el Esquema de Ordenamiento Territorial Municipal, se establece la misión del municipio, sus objetivos, estrategias, programas, los usos del suelo para la zona rural y el área urbana de Carmen de Carupa). Available at: https://mapasyestadisticascundinamarcamap.opendata.arcgis.com/datasets/a7f6ca47cce84d1b84a6861ef969905e
Murcia, C. (1995). Edge effects in fragmented forest implications for conservation. Trends Ecol. Evol. 10, 58–62. doi: 10.1016/S0169-5347(00)88977-6
Nicholls, C. I., Altieri, M. A., and Vazquez, L. (2016). Agroecology: principles for the conversion and redesign of farming systems. J EcosysEcograph. 1, 1–18. doi: 10.4172/2157-7625.S5-010
Noguera-Talavera, A., Salmerón, F., and Reyes-Sanches, N. (2019). Bases teórico-metodológicas para el diseño de sistemas agroecológicos. Rev. FCA UNCUYO 51, 273–293.
Pantoja, A., Smith-Pardo, A., García, A., Sáenz, A., and Rojas, F. (2014). Principios y avances sobre polinización como servicio ambiental para la agricultura sostenible en países de Latinoamérica y el Caribe. Organización de las Naciones Unidas para la Alimentación y la Agricultura (FAO). Available at: http://www.fao.org/3/a-i3547s.pdf
Patton, D. R. (1975). A diversity index for quantifying habitat “edge.” In: Wildlife society bulletin (pp. 171–173). Available at: http://www.jstor.org/stable/3781151
Peña, J. C., Monroy-Ata, A., Álvarez-Sánchez, F. J., and Orozco-Almanza, M. S. (2005). Uso del efecto de borde de la vegetación para la restauración ecológica del bosque tropical. TIP Revista Especializada en Ciencias Químico-Biológicas 8, 91–98.
Quintero, I., Daza-Cruz, Y. X., and León-Sicard, T. (2022). Main agro-ecological structure: an index for evaluating agro-biodiversity in agro-ecosystems. Sustain. For. 14:13738. doi: 10.3390/su142113738
Ramírez, O., and Hernández, S. (2013). “La conectividad ecológica en los espacios agrarios. aportaciones desde los procesos de concentración parcelaria” in Planificación Espacial y Conectividad Ecológica: Corredores Ecológicos. eds. P. Herrera and L. Santos (Valladolid: Universidad de Valladolid Instituto Universitario de Urbanística), 269–298.
Rivera, L. F., Armbrecht, I., and Calle, Z. (2013). Silvopastoral systems and ant diversity conservation in a cattle-dominated landscape of the Colombian Andes. Agric. Ecosyst. Environ. 181, 188–194. doi: 10.1016/j.agee.2013.09.011
Rybicki, J., Abrego, N., and Ovaskainen, O. (2020). Habitat fragmentation and species diversity in competitive communities. Ecol. Lett. 23, 506–517. doi: 10.1111/ele.13450
Safar, N., Sande van der, S., Schaefer, C. E., Magnago, L. F., Martins, S. V., Simonelli, M., et al. (2022). Landscape openness has different effects on the structure, diversity, and functional composition of Brazilian rainforests. For. Ecol. Manag. 520:120395. doi: 10.1016/j.foreco.2022.120395
Sanabria, C., Dubs, F., Lavelle, L., Fonte, S., and Barot, S. (2016). Influence of regions, land uses and soil properties on termite and ant communities in agricultural landscapes of the Colombian llanos. Eur. J. Soil Biol. 74, 81–92. doi: 10.1016/j.ejsobi.2016.03.008
Saunders, M. E. (2016). Resource connectivity for beneficial insects in landscapes dominated by monoculture tree crop plantations. Int. J. Agric. Sustain. 14, 82–99. doi: 10.1080/14735903.2015.1025496
Saura, S., Bodin, Ö., and Fortin, M. J. (2014). Stepping stones are crucial for species' long-distance dispersal and range expansion through habitat networks. J. Appl. Ecol. 51, 171–182. doi: 10.1111/1365-2664.12179
Saura, S., and Carballal, P. (2004). Discrimination of native and exotic forest patterns through shape irregularity indices: an analysis in the landscapes of Villa Alicia. Landsc. Ecol. 19, 647–662. doi: 10.1023/B:LAND.0000042905.97437.78
Scherr, S. J., and McNeely, J. A. (2009). “The challenge for ecoagriculture” in Farming with nature. The science and practice of Ecoagriculture. eds. S. J. Scherr and J. A. McNeely (Washington and London: Island Press), 1–16.
Senanayake, R., and Jack, J. (1998). Analogue forestry: An introduction. Melbourne: Monash Publications in Geography.
Swift, M., Izac, A., and Van Noordwijk, M. (2004). Biodiversity and ecosystem services in agricultural landscapes-are we asking the right questions? Agric. Ecosyst. Environ. 104, 113–134. doi: 10.1016/j.agee.2004.01.013
Taylor, P., Fahrig, L., Henein, K., and Merriam, G. (1993). Connectivity is a vital element of landscape structure. Oikos 68, 571–572. doi: 10.2307/3544927
Taylor, P., Fahrig, L., and With, K. (2006). “Landscape connectivity: A return to basics” in Connectivity conservation. Maintaining connections for nature. eds. K. R. Crooks and M. Sanjayan (Cambridge: Cambridge University Press), 29–43.
Thrupp, L. A. (2004). The importance of biodiversity in agroecosystems. J. Crop Improv. 12, 315–337. doi: 10.1300/J411v12n01_03
Torras, O., Gil-Tena, A., and Saura, S. (2008). How does forest landscape structure explain tree species richness in a Mediterranean context? Biodivers. Conserv. 17, 1227–1240. doi: 10.1007/s10531-007-9277-0
UNU-IAS (2014). Toolkit for the indicators of resilience in socio-ecological production landscapes and seascapes (SEPLS). Tokyo: Agrobiodiversity Conservation.
Vandermeer, J., and Perfecto, I. (2007). The agricultural matrix and a future paradigm for conservation. Conserv. Biol. 21, 274–277. doi: 10.1111/j.1523-1739.2006.00582.x
Wezel, A., Gemmil, B., Bezner, R., Barrios, E., Rodrigues, A. L., and Sinclair, F. (2020). Agroecological principles and elements and their implications for transitioning to sustainable food systems. Rev. Agronomy for Sustain. Develop. 40:40. doi: 10.1007/s13593-020-00646-z
Keywords: agroecological transition, biodiversity, agroecosystems, ecosystem functions, agroecological governance
Citation: Acevedo-Osorio Á, Cárdenas JS and Martín-Pérez AM (2024) Agroecological planning of productive systems with functional connectivity to the ecological landscape matrix: two Colombian case studies. Front. Sustain. Food Syst. 8:1257540. doi: 10.3389/fsufs.2024.1257540
Edited by:
Massimo De Marchi, University of Padua, ItalyReviewed by:
Pablo Torres-Lima, Metropolitan Autonomous University, MexicoFrancesca Peroni, University of Padua, Italy
Copyright © 2024 Acevedo-Osorio, Cárdenas and Martín-Pérez. This is an open-access article distributed under the terms of the Creative Commons Attribution License (CC BY). The use, distribution or reproduction in other forums is permitted, provided the original author(s) and the copyright owner(s) are credited and that the original publication in this journal is cited, in accordance with accepted academic practice. No use, distribution or reproduction is permitted which does not comply with these terms.
*Correspondence: Álvaro Acevedo-Osorio, aacevedoo@unal.edu.co