Using the Net-Map tool to analyze stakeholder networks in the city region food systems of seven European cities
 Melissa Leimkühler1*
  Kathrin Specht1
  Barbara Schröter1,2,3*
  Anna Wissmann1 Chiara Iodice1 Runrid Fox-Kämper1
  Ann-Kristin Steines1
  Francesca Monticone4 Antonella Samoggia4 Giuseppe Carlo Modarelli5 Lélia Reynaud-Desmet6 Adam Curtis7 Isabella Righini8 Michele D’Ostuni4 Jaime Ramón9 Samir Amghar10 José J. Pascual-Fernández9
- 1Research Institute for Regional and Urban Development gGmbH, Dortmund, North Rhine-Westphalia, Germany
- 2Leibniz Center for Agricultural Landscape Research (ZALF), Müncheberg, Germany
- 3Center for Sustainability Studies, Faculty of Social Sciences, Lund University, Lund, Skane County, Sweden
- 4Department of Agri-Food Sciences and Technologies, University of Bologna, Bologna, Emilia-Romagna, Italy
- 5University of Naples Federico II, Naples, Campania, Italy
- 6Ville de Romainville, Romainville, France
- 7Åsli Gård, Oslo, Norway
- 8Business Unit Greenhouse Horticulture, Wageningen University and Research, Wageningen, Netherlands
- 9Instituto Universitario de Investigación Social y Turismo, University of La Laguna, San Cristóbal de La Laguna, Spain
- 10Municipality of Lansingerland, Lansingerland, Netherlands
The current global food system is characterized by anonymity in the value chain, global food trade, loss of knowledge about food sources, and a distant producer-consumer relationship. In addition, the negative environmental impacts of the agricultural sector, such as pollution, degradation of soil and water quality, loss of biodiversity, and significant greenhouse gas emissions, make this sector a major driver of climate change. In contrast, the city region food system (CRFS) approach captures the complexity of a food system and its actors at the local level. It aims to meet the requirements of sustainable transformation along the food value chain and offers an alternative approach to the challenges of the global food system. However, the actors and their relationships in CRFS are rarely analyzed. To fill this gap, this study focuses on analyzing CRFSs as networks using the Net-Map tool to study different CRFS in seven European cities (Bologna, Naples, Lansingerland, Tenerife, Oslo, Dortmund, and Romainville). The aim of this paper is to concentrate on the method and to show how the Net-Map tool can effectively support the evaluation of the CRFS by identifying different actor roles, recognizing patterns of relationships. Additionally, the strengths and weaknesses of the network can be assessed by a strengths, weaknesses, opportunities and threats (SWOT) analysis. The paper highlights the limitations, advantages, and practical use of the Net-Map tool and discusses potential transferability to other case studies.
1 Introduction
In today’s world, the food system operates at the global level. In the past, it operated on a smaller, more local scale, and the various steps and activities involved in producing and distributing food were closely connected. Producers and consumers interacted directly with each other. The current food system is characterized by anonymity in the value chain, global food trade and competition, loss of knowledge about the food that is available for wholesale purchase and the elimination of a close producer-consumer relationship (Clapp, 2015; Heuser et al., 2017; Tucci, 2020; Säumel et al., 2022). Due to the destruction and pollution of soil and water quality, declining air quality from pesticides (UBA—Umweltbundesamt, 2019), and loss of biodiversity caused by present-day agricultural practices (IPBES, 2019), the food system has negative impacts on the environment and people. The agricultural sector is responsible for 1/3 of global greenhouse gas emissions and is considered one of the main contributors to climate change (FAO, 2022).
Given these negative factors, the need for an immediate and urgent transformation of the local food system has become evident. According to Blay-Palmer et al. (2018), ensuring an explicit “city focus” is crucial for developing a sustainable food system. The reasons lie in urbanization and the resulting increasing concentration of people in cities. This development creates local opportunities to generate social, environmental, and economic benefits within the context of the food system, promoting positive synergies in food access, livelihoods, and the environment. At the local level, spatial distances can be reduced, economic activities can be embedded in social and ecological contexts, and a direct connection can be established between consumers, producers, and other relevant stakeholders (Schmied, 2018).In urban society, there are growing demands for a shift in food practices and implementation at the local level. Simultaneously, there is an increasing willingness among citizens to contribute to the sustainable development of this issue (Tucci, 2020). Civil society initiatives such as food policy councils are emerging with the goal of transforming urban food systems (Bassarab et al., 2019; Trivette, 2019; Kropp and Da Ros, 2021; Michel et al., 2022). This exerts pressure on local policies and signals a movement toward integrating the topic of food into city administration (Morgan, 2015). However, a challenge lies in the fact that in municipal policies, the topic of food is often not anchored and defined as a political issue due to its cross-cutting nature, lacking concrete responsibilities (Schanz et al., 2020).
The Milan Urban Food Policy Pact (MUFFP), established by the Food and Agriculture Organization of the United Nations (FAO), represents a significant milestone to solve the mentioned challenges. This political consolidation of grassroots initiatives and the integration of the food issue into municipal policies highlights the substantial potential for transforming urban food systems (UBA—Umweltbundesamt, 2019; Carey and Cook, 2021; Milan Urban Food Policy Pact, 2021).
There is a growing body of research focused on alternative food systems and solutions (Feagan, 2007; Biel, 2016; Blay-Palmer et al., 2018; Baldy and Kruse, 2019; Doernberg et al., 2019; Mastronardi et al., 2019; Tucci, 2020). While most research on local food systems has traditionally focused on product flows, quantity, and spatial origin, actor structures at the local level have often been overlooked (Sipple and Schanz, 2019). Additionally, previous research has attempted to improve our understanding of the complexity of food systems and the concept of food democracy (Lohest et al., 2019; Tucci, 2020) and examined the importance of stakeholders within the food system (Sonnino and Marsden, 2006).
According to the findings of Baldy et al. (2020), to reach a transformation of the food system, it is very important for policymakers to involve and link the many stakeholders in the complex food system. It is necessary to consider who the actors are in order to jointly develop goals and visions for a sustainable local food network. This should be done in an exchange of information about preconditions, contexts and common or different. The new and holistic city region food system (CRFS) approach is employed to delineate the actors under consideration (FAO, 2022). It captures the complexity of the topic by addressing the urban region and the food system together. The CRFS includes all the actors, processes, and relationships involved in the food chain from production to processing to the distribution, marketing, and consumption of food in a given geographic region. However, the actors and their relationships in CRFS are rarely analyzed. In their typology for stakeholder analysis, Reed et al. (2009) propose three different methods for investigating relationships between stakeholder: actor-linkage matrices, Social Network Analysis and knowledge mapping.
There are few studies that examine local food systems using SNA (Freedman and Bess, 2011; Christensen and O’Sullivan, 2015; Trivette, 2019; Brinkley et al., 2021; Bruce et al., 2021; Levkoe et al., 2021; Li et al., 2022). All of them use standardized surveys for data collection. We are not aware; of any study that employs social network analysis using a participatory tool. Some highlight the possible additional value of qualitative interview data to their studies (Christensen and O’Sullivan, 2015; Brinkley et al., 2021; Levkoe et al., 2021). Levkoe et al. (2021) explicitly state that “SNA results can and should be explored interactively with network members to gain further insights from the statistical analysis and visualizations relative to a member’s position within the network” (Levkoe et al., 2021, p.74).
One way to engage stakeholder is to gather SNA data in a participatory manner with the Net-Map tool. This is a relatively new approach that differs from “traditional” SNA in that the results are visualized participatively during the process, whereas in traditional network analysis data are gathered with a standardized survey and visualization is performed at the end of the data collection (Schönhuth 2013). The tool was developed by Eva Schiffer and was first applied in 2006 in a partnership between the Challenge Program for Water and Food and the White Volta Basin Board (WVBB), a local multistakeholder organization, in Northern Ghana (Schiffer and Hauck, 2010).
With regard to previous studies, testing the Net-Map tool for CRFSs network analysis fills a research gap.
To fill this gap, this paper pioneers the application of the Net-Map tool to examine CRFS networks in seven European cities (Bologna, Naples, Lansingerland, Tenerife, Oslo, Dortmund, and Romainville). The analysis demonstrates the suitability of the tool for generating pertinent results tailored to the distinctive attributes of each examined case in terms of
• displaying the roles of actors;
• revealing relationship patterns between actors;
• illustrating the strengths and weaknesses of the network; and
• defining solutions for strengthening the CRFS in each case.
Furthermore, we aim to evaluate the suitability of the method in a more general, transferable sense through
• evaluating and discussing the method’s limitations and benefits; and
• developing recommendations for the practical uses of Net-Map and potential transferability to other case studies
The remainder of this paper is structured as follows. In order to address the analytical aspects described, we first explain the Net-Map tool and its procedure as well as the SWOT analysis used and its implementation methodology in the Methods section. In the result section, we then use the results from the seven European cities as examples in regard to the roles and relationships of the actors in the network and for the initial solutions for strengthening the CRFS. We present the findings which identify the roles of the actors, showing the motivations and influences of the actors, taking into account the socio-economic context, followed by the results of the visualization of relationship patterns between actors, with network maps showing the relationships investigated. In the discussion section, we discuss the benefits and limitations of the methodology for Network Analysis in CRFS Transformation and reflect on the practical use and the transferability of our results to other cases before we end with concluding remarks. The results of the analysis can also be found in the FoodE project deliverable (Wissmann et al., 2023).
2 Methods
2.1 Introduction of the Net-Map tool
The Net-Map tool1 is an interview-based mapping tool that combines the empirical research of narrative interviews and participant observation so that the interviewer, in addition to conducting interviews, observes the expressed reflections of the interviewees and the process of map creation (Schönhuth, 2013).
The Net-Map tool is used with the aim of clarifying individual perspectives in the network of actors and analyzing the structures that are not based on physical infrastructures but are hidden in social networks (Hauck, 2012). Based on these insights, the tool promotes dialogue and helps to develop approaches to the problem under investigation. Through the entire process of the Net-Map design, the interviewees have the opportunity to name important key persons, relationship patterns, and influences, or power structures of actors in the network (Cassaniti, 2021). Thus, the Net-Map tool can capture the existing value chain in the local food system and represents the actual state of active stakeholders in the network, their relationship patterns, and existing gaps but also potential improvements in the network (Schiffer and Hauck, 2010). The end product is a visual network map created through a participatory process that allows social relationships to be surveyed and analyzed (Lelong, 2015).
Although the Net-Map tool was originally intended as a paper-to-pen method (Lelong et al., 2016), it allows a certain flexibility in the choice of formats and interview forms, which have already been implemented in different ways in other research, e.g., using online tools (Lelong et al., 2016; Sattler et al., 2022; Schröter, 2022a). Considering individual factors such as the size of the study area, the number of interviewees, and their time and financial resources (for example, travel to the interview location, etc.), the flexibility justifies a high tolerance for implementing this method (Sattler et al., 2022). To investigate the social network dynamics within this process, data capturing the relational patterns among actors are collected. While the material of the narratives can be analyzed qualitatively, the actors and their links can be analyzed quantitatively using graph theory (Lelong et al., 2016). Thus, the Net-Map tool is a hybrid tool that follows the mixed-method approach (Lelong et al., 2016), meaning that both qualitative and quantitative data are collected and combined in the chosen research design (Kuckartz, 2014).
A Net-Map interview consists of an overall Net-Map question asking who are the important actors in a defined network at a certain time and several consecutive interview steps (Schiffer, 2007):
1. Which actors are included? (Actors).
2. In what ways are these actors linked? (Relationships).
3. How influential are these actors in the network? (Influence).
4. What are their goals or motivations in this context? (Motivations).
2.2 Interview preparation
To define the interview framework, the third coauthor hosted a 2-day online workshop with the project team to introduce the Net-Map tool to all participating case studies in September 2022. In the workshop, the rules and implementation of the tool were presented and the Net-Map research questions for the CRFS in each of the seven European cities were defined (Figure 1).
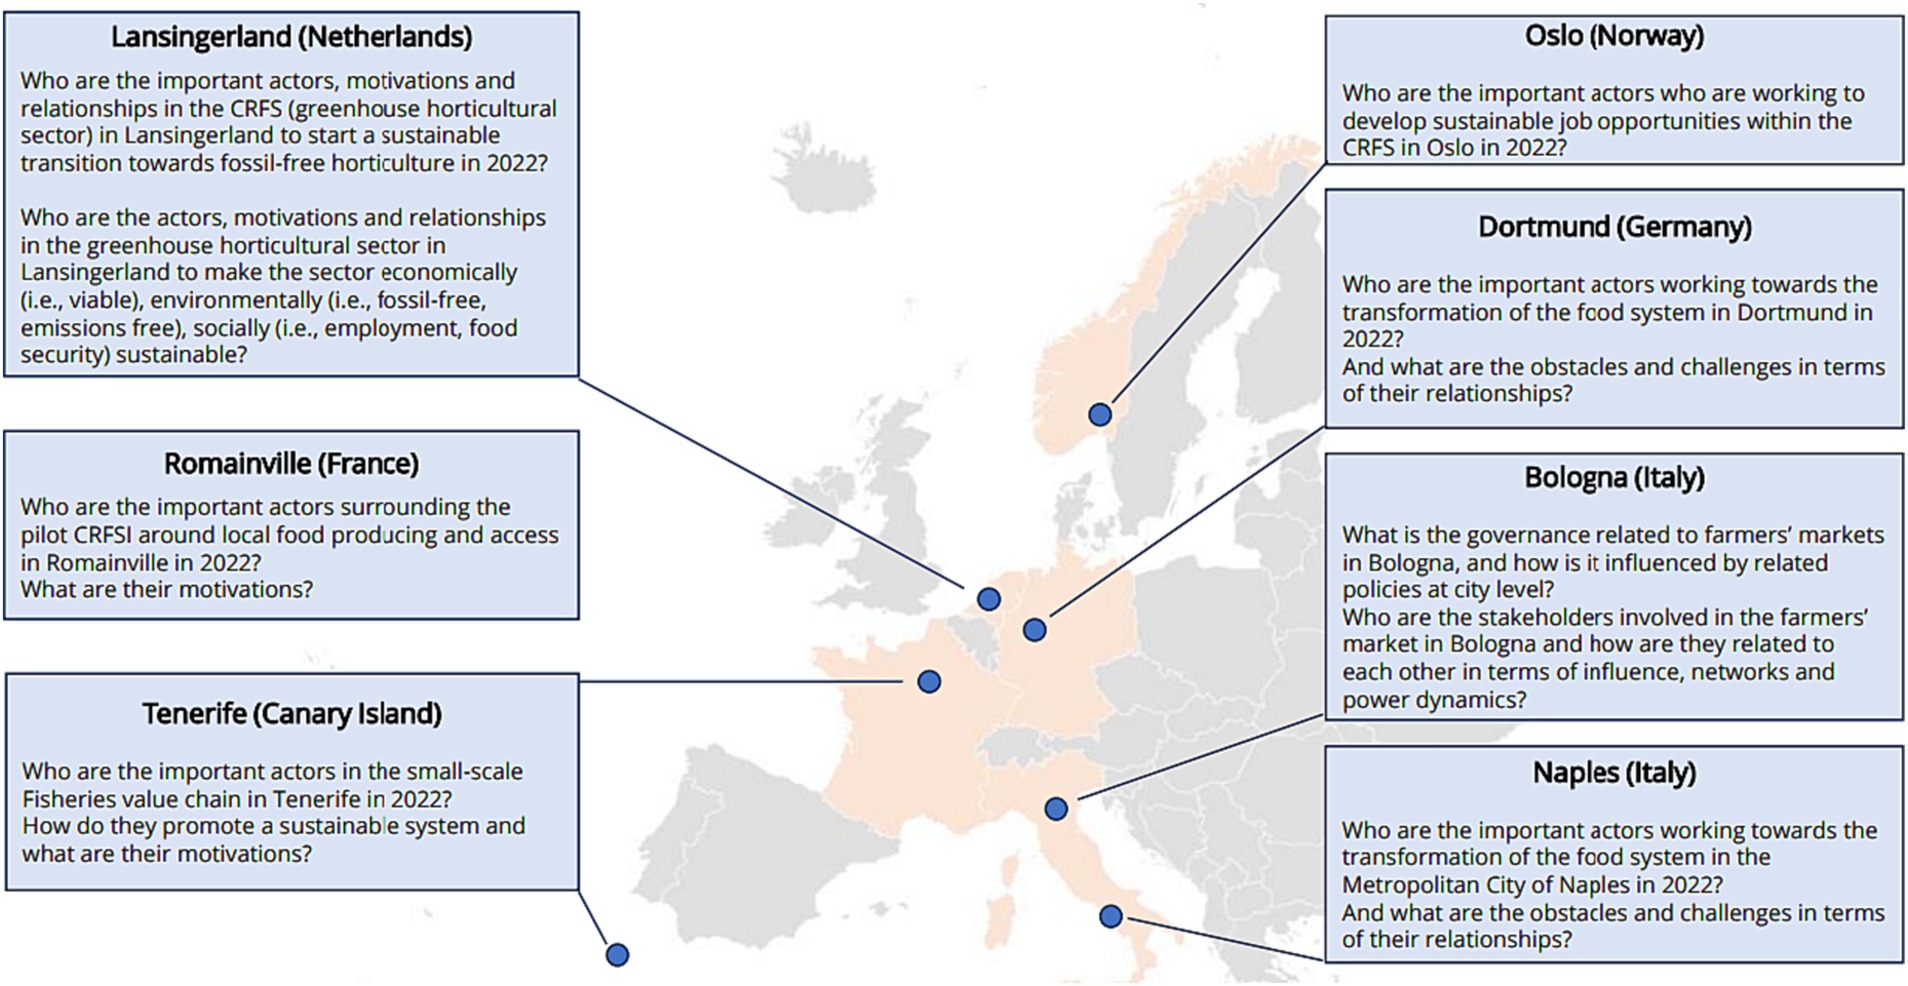
Figure 1. Seven European cities as case studies and their specific research questions.
Furthermore, which relationships between the actors would be gathered were defined, and the motivations that drove individual initiatives to participate in food system transformation were investigated. As a result, four different relationship categories—support, commercial, hindrance, and desired—were broadly defined and further differentiated in the cases, as elaborated in the results section. In addition, four motivations—common good, commercial interest, awareness raising, and CRFS education and strengthening—were captured during the workshop. Finally, the strength of perceived influence was delineated on a scale from one (lowest influence) to five (highest influence) for each case study (Figure 2). We also decided to distinguish the actors in the three groups—food economy, civil society, and public administration/government—that make up the CRFS.
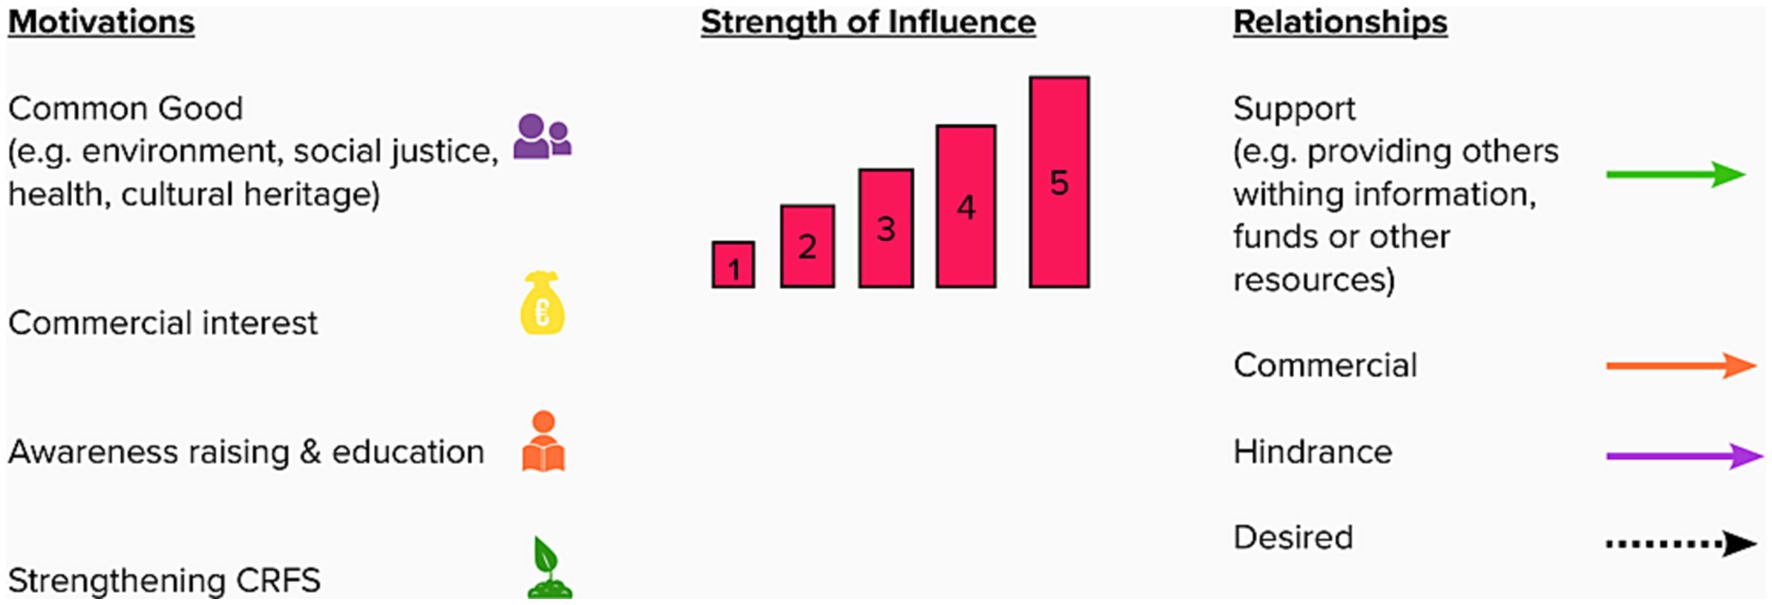
Figure 2. Elements of the Net-Map method via the Mural platform.
2.3 Data collection
The within the workshop jointly developed interview framework ensured a consistent data generation process across all case studies (Annex 2). The next step was the respective research teams conducting the interviews, focusing on their individual research questions but following the same Net-Map interview process. The teams also chose between in-person or online interviews, depending on their resources.
The interviewees were generally six to eight key actors so that at least two key persons were represented from each of the three stakeholder groups (civil society, public administration, and food economy) (see Table 1).
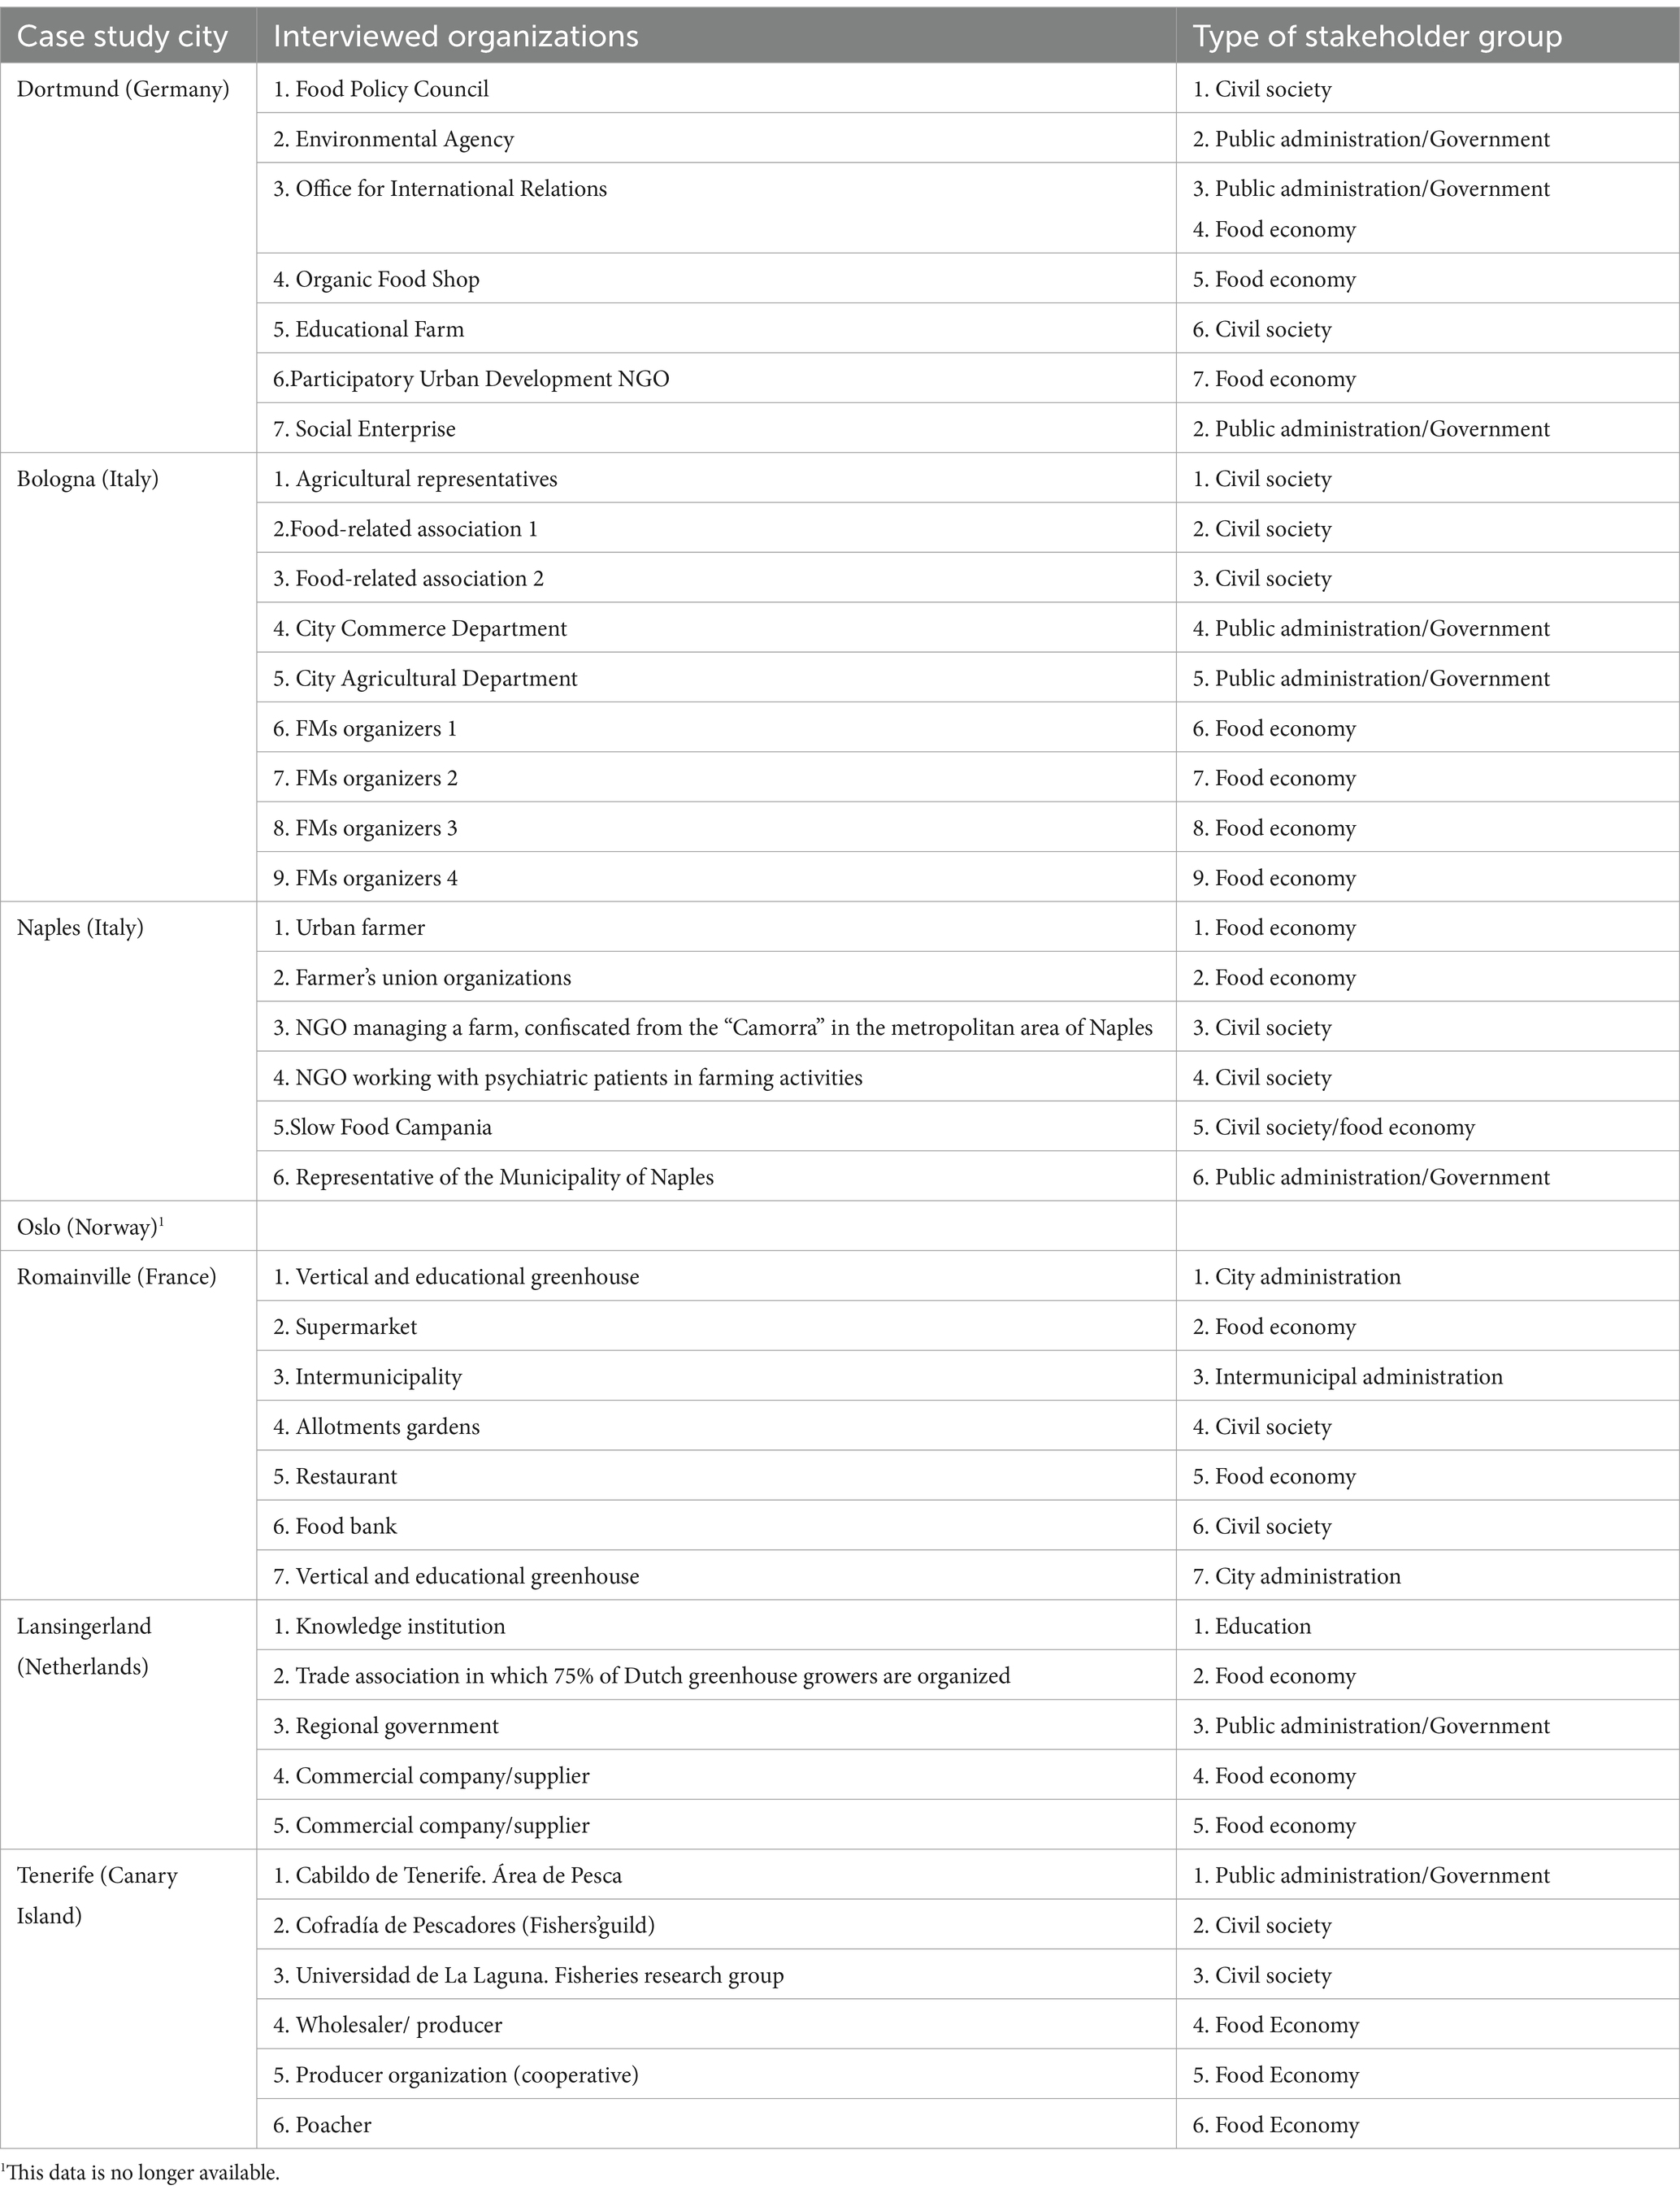
Table 1. Overview over interviewees in each case study.
The interviewees were selected through intensive research by the research teams with the aim of interviewing individuals who were actively involved in the network and had a good overall understanding of its actors. Subsequently, face-to-face interviews were conducted with the selected individuals in either an online or on-site setting.
During the interviews, large sheets of paper were utilized to create network maps, while actor cards and Post-it notes were employed to designate the identities and motivations of the actors. To depict the relationships, pens in four different colors were used, and influence tower disks were created to determine the level of influence of each actor. In the online interviews, the Mural online platform (Mural, 2022) was used to visually represent the network maps.
First, the actors involved in the networks were identified. To provide quick access to the food network interviews, the research teams selected 20–40 actors based on prior research and close examination of the CRFS networks. These 20–40 actors were then described to the respondents. The respondents were then asked to name additional actors, if needed. In some cases, a minimum number of 5–10 actors was selected before beginning the Net-Map process, while in other cases, no strict minimum number was specified. The limited number of actors was an attempt to streamline the length of the interviews and keep the complexity of the network manageable. However, it is worth noting that in some cases, the number of actors mentioned far exceeded the 10-actor limit.
To collect data on how the actors were connected to each other in supportive, desired, hindering and commercial relationships, arrows that were color-coded to indicate specific connections were drawn between actors (Figure 3). The arrows indicated a resource flow from one actor to another. If there was a mutual exchange, the arrows pointed in both directions (Schiffer and Hauck, 2010; Schröter, 2022a). In addition, the motivations (see Figure 2) were placed next to the actor maps as icons (Schiffer and Hauck, 2010, Schröter, 2022a). Furthermore, the interviewees were asked who had how much influence in the network, and the influence towers were then placed next to the actor cards (Figure 3). The higher a tower was at the end, the stronger the influence of that actor (Schiffer and Hauck, 2010, Schröter, 2022a).
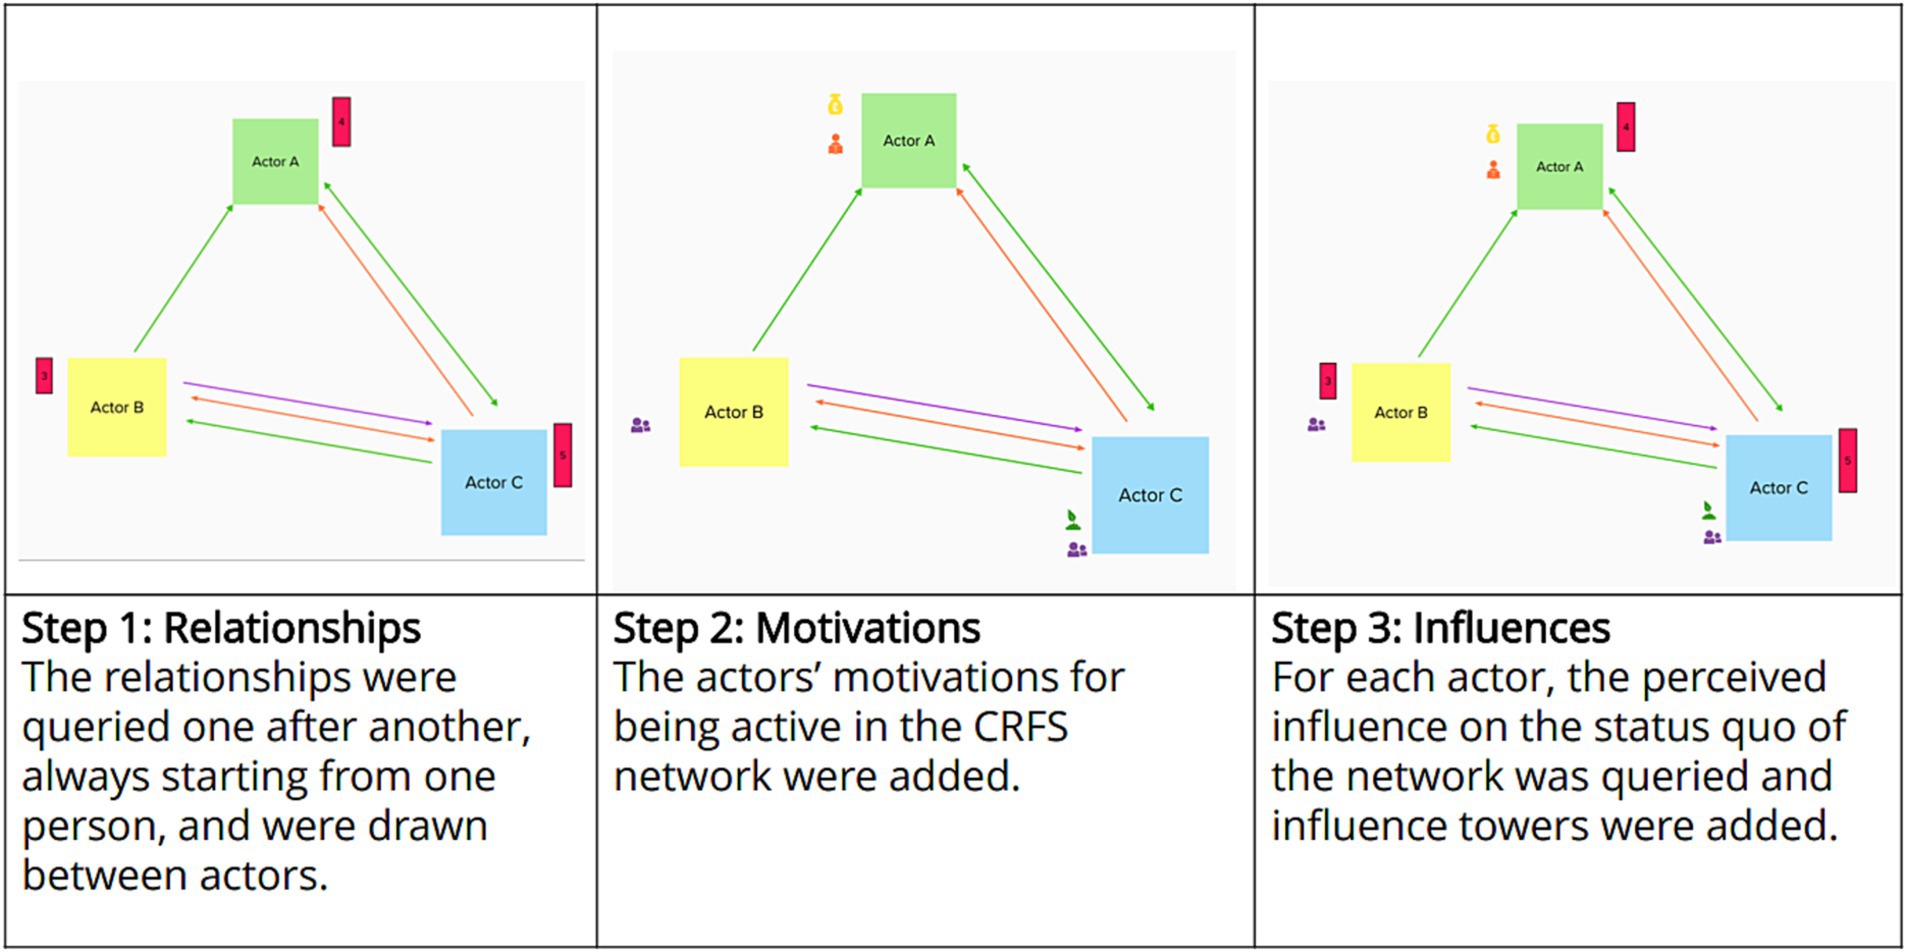
Figure 3. The three main steps for drawing Net-Maps via Mural.
Together with the perceived motivations, the information on influences was helpful for the interviewees to identify which actors they could strengthen in the future and which potential conflicts of interest they should be aware of (Schiffer and Hauck, 2010).
2.4 Data processing and analysis
2.4.1 Quantitative data analyzed by SNA measures
The final CRFS maps can be read using graph theory. The visualized actors and relationships are referred to as “nodes” and “edges.” Here, the nodes represent the individual actors in the network, which can be individual or collective (Borgatti et al., 2018). Connections are mapped between the actors and can be of different types, such as social relationships or resource flows. The nodes and edges form the output of the SNA, that is, the network (Borgatti et al., 2018).
The individual Net-Maps were analyzed mathematically by transferring and accumulating matrices in Excel spreadsheets. The relationships of the actors were detected in adjacency matrices where the rows and columns each represented an actor in the network (Fuhse, 2018). To capture the relationships, a “0” was inserted for no connection, and a “1” was inserted for an existing relationship. This created an Excel spreadsheet for each interview and each connection category, and the results for each connection category were then added together (Schröter, 2022b).
The quantitative data generated through the Net-Map process were analyzed using SNA measures.
To convey all the information about the overall structure of the network, e.g., how influential individual nodes are within the network, it helps to represent different “centralities.” These can be measured in different ways (Fuhse, 2018). In this study, degree centrality was used. Degree centrality shows the number of incoming, as well as outgoing, connections and indicates nodes that are relevant for the flow of information (Cherven, 2015). Nodes with high degree centrality can be considered key actors, as they receive and transmit a larger amount of information or influence. This can aid in identifying important actors in the network and comprehending which nodes are particularly influential within the CRFS network.
Another measure that was calculated is reciprocity. A simple way to measure reciprocity is to count the number of reciprocal connections and divide it by the total number of connections. In directed networks, reciprocity occurs when an actor receives a connection from another actor and then returns a connection to that same actor (Borgatti et al., 2018). In networks that are inherently symmetric, full reciprocity exists by definition, meaning that both parties affirm the relationship equally. An example is a mutually supportive relationship through networking that is undirected and therefore reciprocal (Schönhuth, 2013). Reciprocity is useful for understanding how information or decisions circulate within a CRFS network and which nodes are particularly closely connected.
2.4.2 Visualization of the network
A map was visualized with Gephi software (Gephi, 2022) for each connection, resulting in a total of four network maps:
1. Net-Map of the supporting relationship.
2. Net-Map of the desired relationship.
3. Net-Map of the hindering relationship.
4. Net-Map of the commercial relationship.
Additionally, the three different actor spheres were distinguished by color coding when visualizing the maps (civil society actors in green, local food actors in blue, and public administration/government in yellow).
The relationships between actors were represented by edges, which indicate connections. The thickness of an edge and the intensity of its color between two actors illustrate the strength of the connection. Here, arrows at the end of the connection lines show the direction of the relationship and indicate whether it is reciprocal or one-sided. A larger arrow indicates that the flow of information is more often directed from one actor to the other. The node size is depicted depending on actors’ calculated degree centrality.
For visualization, the Force Atlas algorithm was chosen for the layout of the graphs. This algorithm follows a twofold linear model in which the attraction and repulsion of the nodes are calculated proportionally to their distance. With this layout, the attraction of the nodes can be represented (Jacomy et al., 2014).
The Net-Maps visualized the density of the network, which provided initial information about the network structure. In this way, the number of actual relationships among potential connections in the network was determined. This concept of density provides insight into the overall connectivity of the network (Schönhuth, 2013).
Along with the layout, density, degree centrality, and reciprocity, we interpreted the roles of actors in the CRFS network. This allowed us to identify who were the central actors, intermediaries, or those not in focus within the CRFS network.
2.4.3 Analysis of motivations and influence towers
Influences and motivations were elaborated in the diagram representations. The motivations and influences of each actor were captured in an Excel file. The results of the individual network maps were entered along the four types of motivations on a scale of 0–2 (0 = not present, 1 = present, 2 = main motivation). Finally, the results were summed up in a separate spreadsheet. Regarding influence, values from 1 to 5 of the influence markers assigned to actors in the interview were assigned to the corresponding actors. The results for influence were also summed up. The influence and motivations assigned to the actors were visualized with simple bar charts. Together with the perceived motivations, the information about the influences is helpful for the interviewees to identify which actors they could strengthen in the future and which potential conflicts of interest they should be aware of (Schiffer and Hauck, 2010).
2.4.4 Analysis of the narratives
The qualitative analysis involved the examination of the narrative data from the interviews (Steinbrink et al., 2012). The interviews were transcribed and coded using both indicative and deductive categories (Flick, 2021). The results also captured information “between the lines” and revealed the individual perceptions of interviewees within the actor network (Küsters, 2009). The narratives provided greater clarity regarding the nature of these relationships, allowing us to identify specific aspects within the categories.
Supportive relationships: these predominantly involve information exchange, networking, cooperation, and promotion.
Desired relationships: these mainly encompass the desire for new or increased information exchange, networking, the alignment of interests, financial and material support, and the creation of synergies.
Hindering relationships: these represent weaknesses, obstacles, and conflicts within the network and between actors.
Commercial relationships: these reveal which actors are engaged in business dealings with one another.
2.5 Strengths, weaknesses, opportunities and threats analysis
Based on the results of the final network maps, a SWOT analysis was carried out for each CRFS as a final step. This made it possible to identify strengths and weaknesses of the current network and, on this basis, to record opportunities and threats for the future.
The SWOT analysis was conducted by the case study research team itself in most of the case studies, based on the qualitative analysis of the individual interview transcripts, with the exception of the SWOT analysis in Dortmund. There, a stakeholder workshop was held online with one key person per stakeholder group in the network, and the results were discussed and elaborated together. The participants were presented with the four final Net-Maps of supportive, desired, hindering and commercial relationships in the food network in Dortmund and diagrams that showed the influences and motivations of the actors on a Mural board. The participants were asked for their impressions of these results, and they had the opportunity to examine the maps and diagrams in more detail. This created the opportunity to express new ideas and problems and to discuss possible solutions. Through the ideas and suggestions summarized in the SWOT table, the stakeholder workshops provided the opportunity to collect further aspects that would contribute to the improvement of the CRFS. This process was designed to be interactive, and the participants themselves formulated their thoughts in digital notes, which were then discussed in plenary.
3 Results
In the following section, the results from the seven European cities are used as examples to provide insights into the results that can be achieved through the Net-Map tool in regard to analyzing the roles and relationships of the actors in the network and developing initial solutions for strengthening the CRFS.
3.1 Insights for identifying the roles of actors
The results of the Net-Map interviews enabled us to identify the roles of the actors in each CRFS. Due to the specific research questions and the different individual situation of each case study and specific changes or problems in the cases for transformation of the food system, the roles of the actors in each CRFS network differed (Table 2). By identifying the degree centrality, reciprocity, and density and using the Force Atlas algorithm, it was possible to illustrate which actors were key persons, which played an intermediary role and through which information flows at the shortest distance and which were perceived little or not at all (see section 2.5). As shown in Table 2, it is evident that each city had very different main actors (actor focus) for the transformation of its CRFS, including in the three different actor groups. For example, in Dortmund, the Food Policy Council as a civil society initiative was seen as the driver of food transformation in the city, whereas in Tenerife, the focus was on the economic actors in the local fisheries value chain in regard to driving change in the network. In Oslo, the city was seen as the most important transformer. The actors’ roles could be captured by the Net-Map tool in the context of each CRFS.
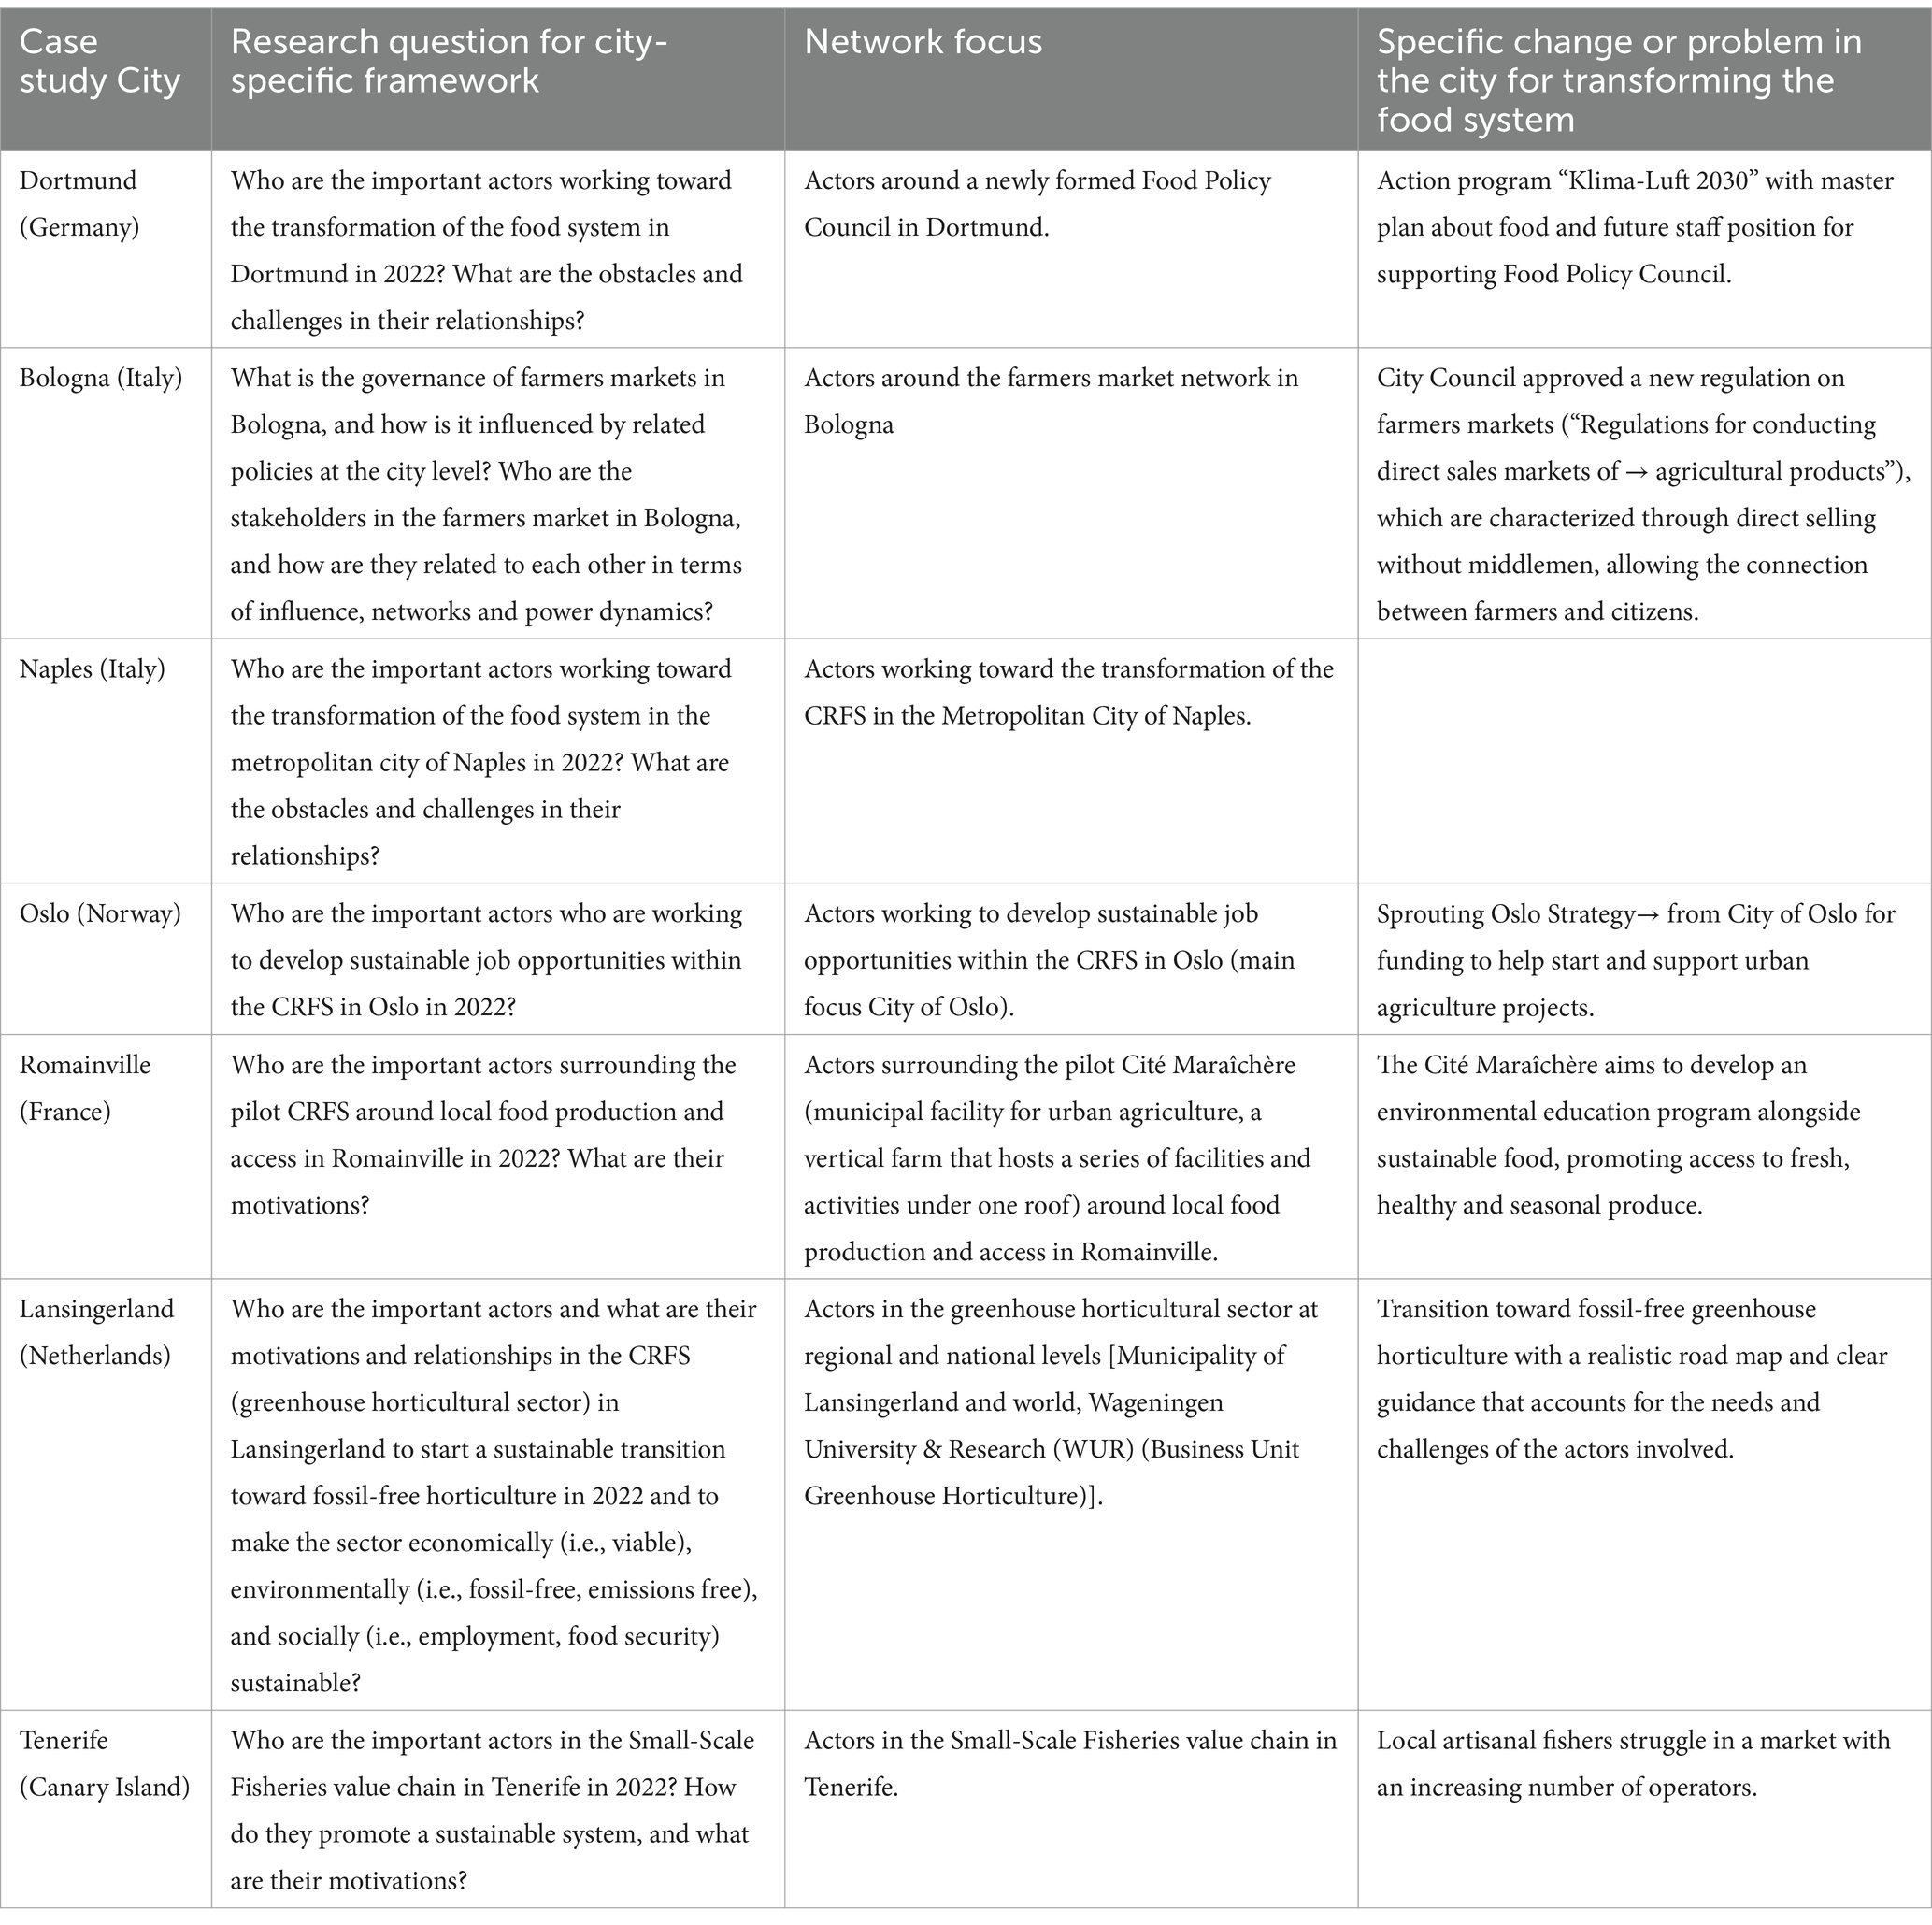
Table 2. Context and focus of each CRFS network in the seven different European cities.
In addition, the results generated from the sum of the influence towers were relevant to the roles of the actors. These show how individual actors and their influences are perceived in the CRFS network and how the actor groups and their influence are distributed. The results show that all three actor groups were present with high influence values. It became clear that the distributions differed in each case study and that the actors with the highest values also differed in their functions, ranging from farmers to the Food Policy Council to universities and research institutions (Table 3).
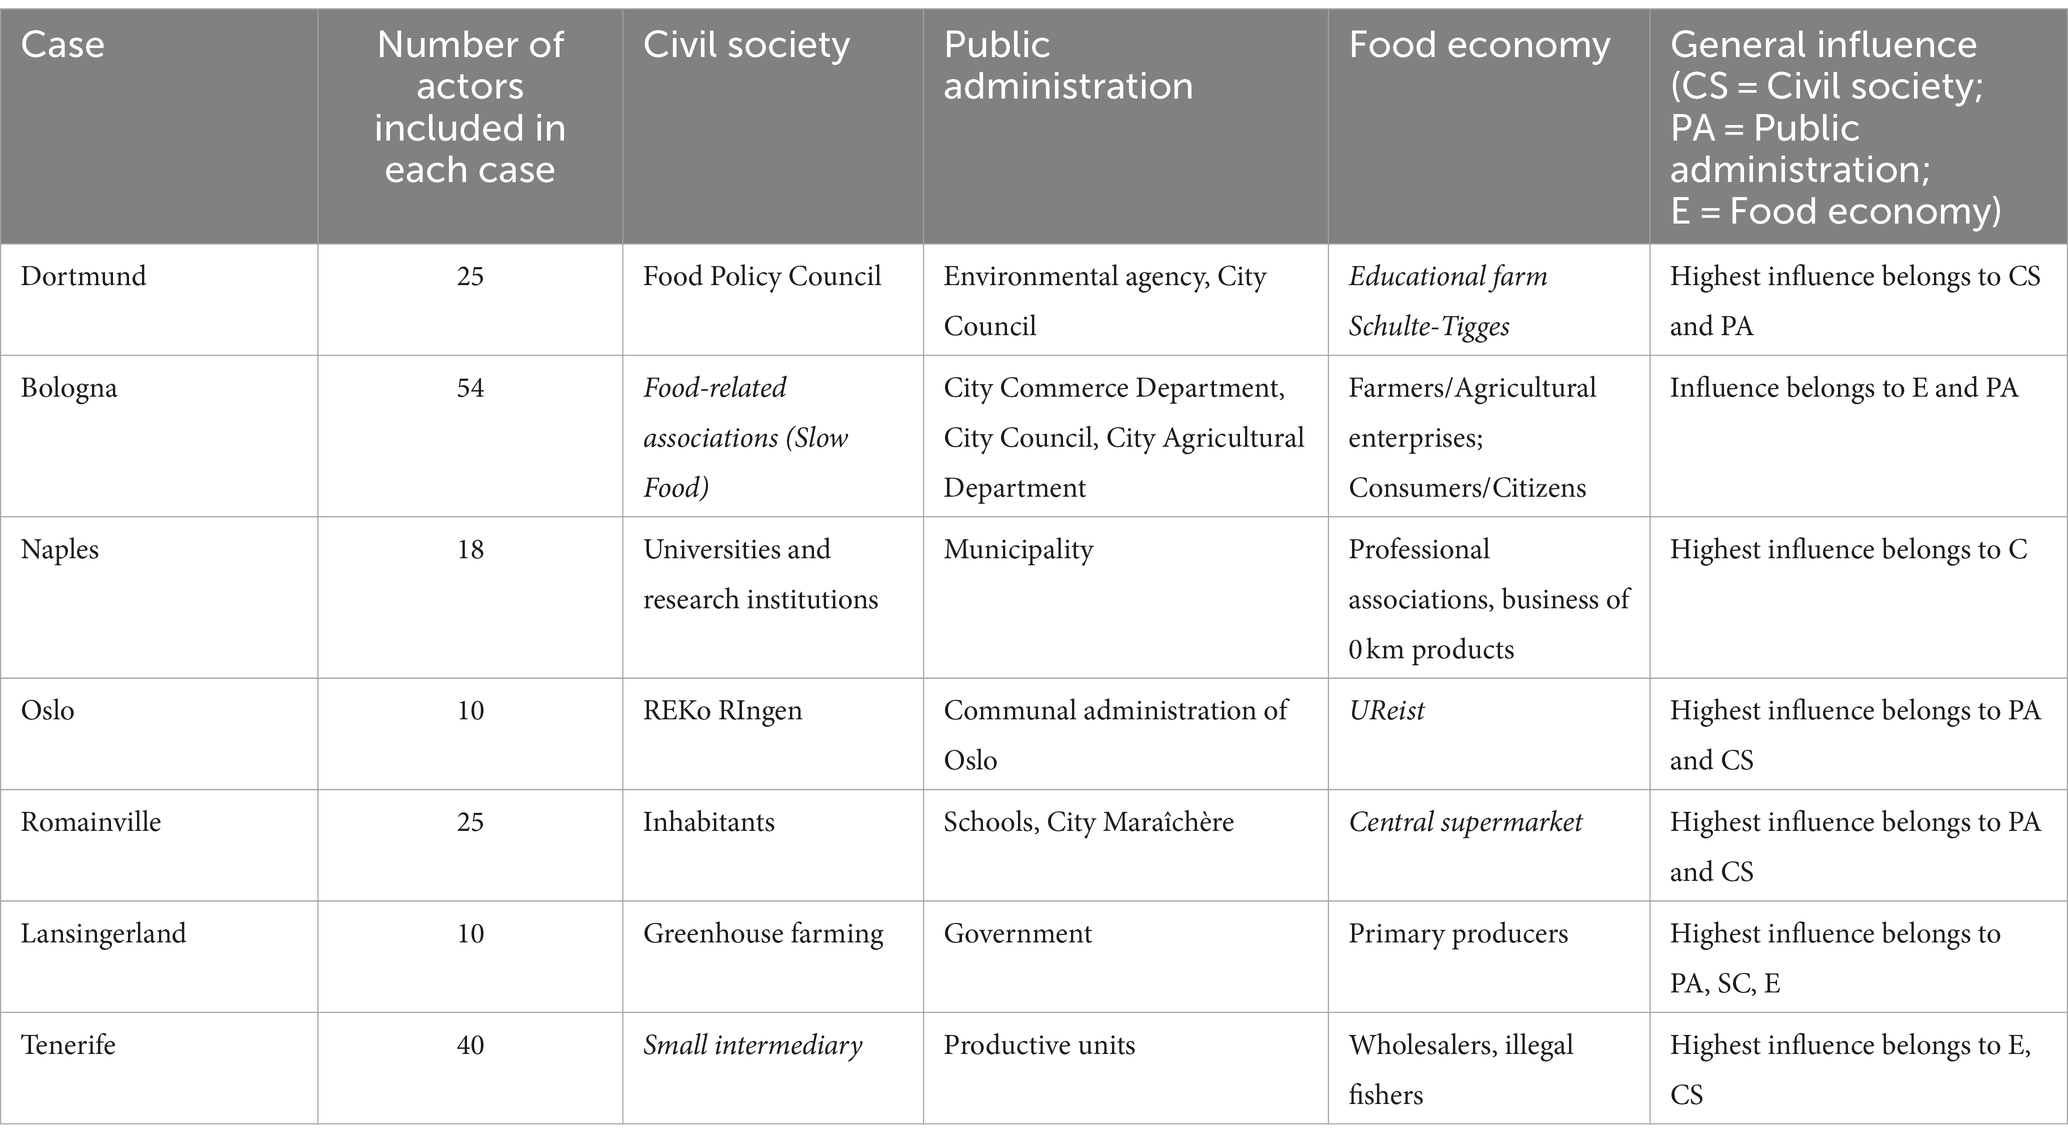
Table 3. Actors with the highest influence in each CRFS separated into the three actor groups: civil society (CS), public administration (PA), and food economy (thick letters show the actor with the highest general influence).
By capturing the motivations of the actors in the CRFS networks, it is possible to identify what drives the actors to be active. It turns out that the strengthening of CRFSs is highly relevant in all CRFS networks and that commercial intentions relate only to the food economy, but these relationships are not truly relevant for the functioning of the network itself (Table 4).
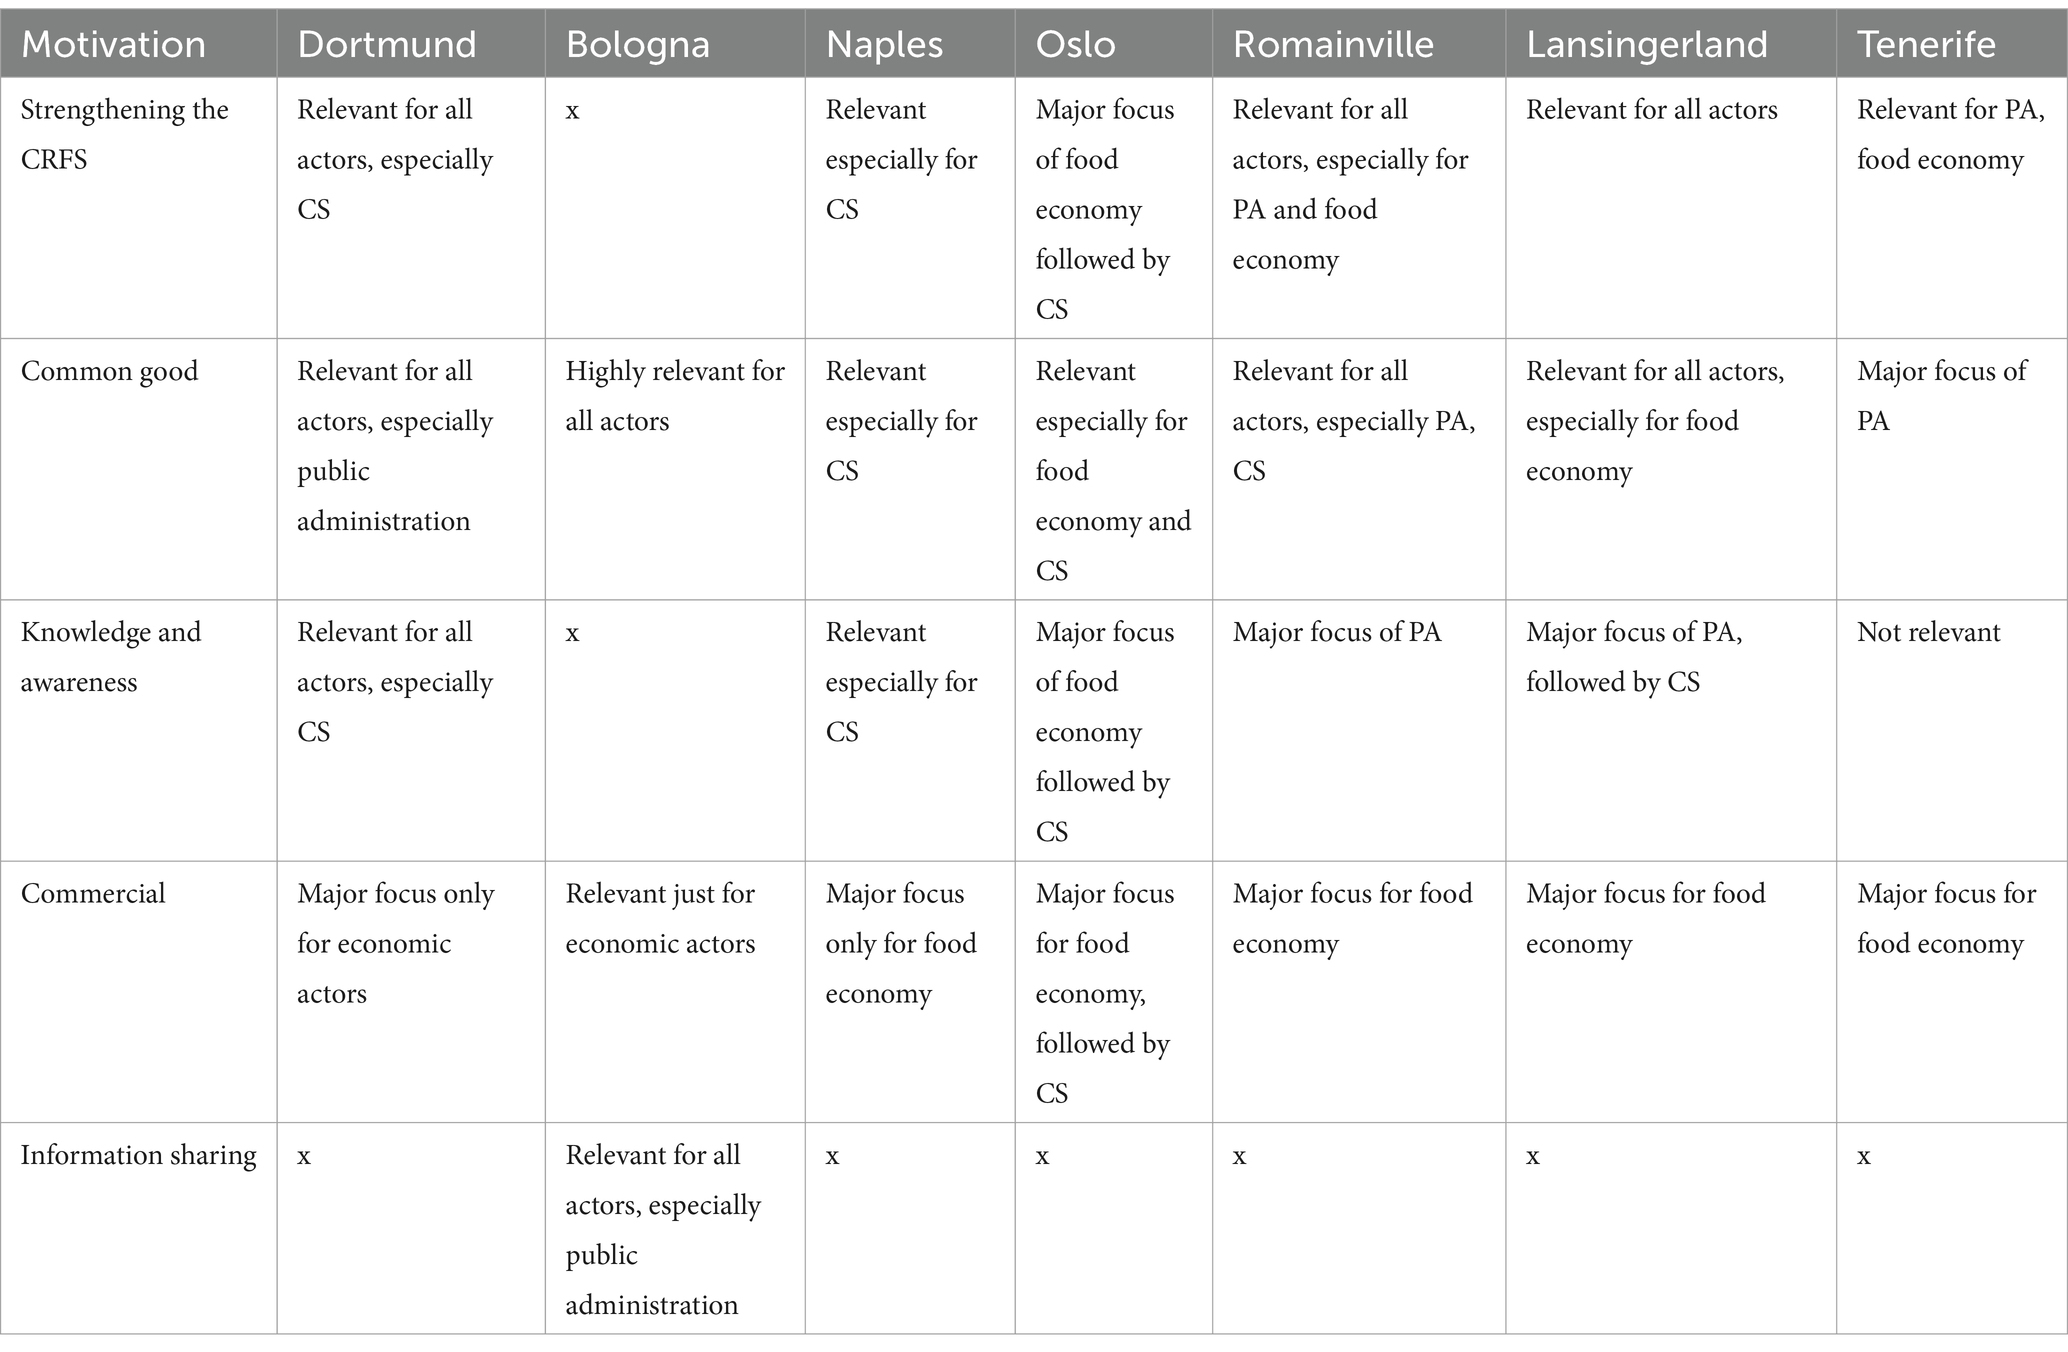
Table 4. Motivation of actors per case study (x = not mentioned).
In the context of motivations, the distribution and function of the three actor groups, civil society, food economy and city government, as well as the identification of key actors provided insights into the CRFSs and identified the main drivers of each network.
3.2 Insights for visualizing relationship patterns between actors
To portray the supportive, desired, hindering and commercial relationships, the connections among actors in the food network were illustrated in the Net-Map interviews. Subsequently, the individual network maps of relationship categories were aggregated into a final map.
3.2.1 Supportive relationships
The network maps of the supportive relationships illustrated which actors in each CRFS network had reciprocal or unilateral relationships, who occupied key positions in the network and thus represented intermediaries in the support network and who did not. Both individual actors and entire groups of actors and their support functions were analyzed.
Through the layout interpretation of density and the intensity of interconnectedness through the measures reciprocity and degree centrality, conclusions could be drawn about the willingness to support and the degree of awareness and activity of the actors in the network.
The analyses of the interview narratives revealed that supporting relationships primarily involved information exchange, networking, cooperation, and promotion. In all seven case studies, all actor spheres were interconnected, forming dense networks. This indicated a strong willingness among the participants to support each other within the CRFS network. Moreover, it was observed that central actors, who had the most connections, also had the strongest influence on transforming the CRFS. For each specific network, it was possible to identify its support dynamics.
To provide an example, the Net-Map for Dortmund (Figure 4) shows a dense support network among the actors in the CRFS. The green arrows between the nodes (actors) represent the supported relationships, indicated by their thickness and intensity of color. The map primarily shows mutual relationships, as indicated by arrows that point in both directions. All actor groups are strongly represented in the relationships, as is evident from the nodes in yellow (public administration), green (civil society), and blue (food economy). What stands out in the map is the high level of support from the city administration (yellow nodes), which also has a significant influence on transforming the CRFS. The Food Policy Council has the highest degree centrality, holds the largest node in the map and is centrally positioned with numerous relationship ties. The clear results demonstrate that the Food Policy Council plays the most important support role and is perceived as a point of contact for civil society regarding food matters, serving as an essential link for all three stakeholder groups. These results with the information generated in the qualitative interviews while drawing the Net-Map underline the strong commitment to transformation in Dortmund from all actor groups facilitated by mutual support within the CRFS.
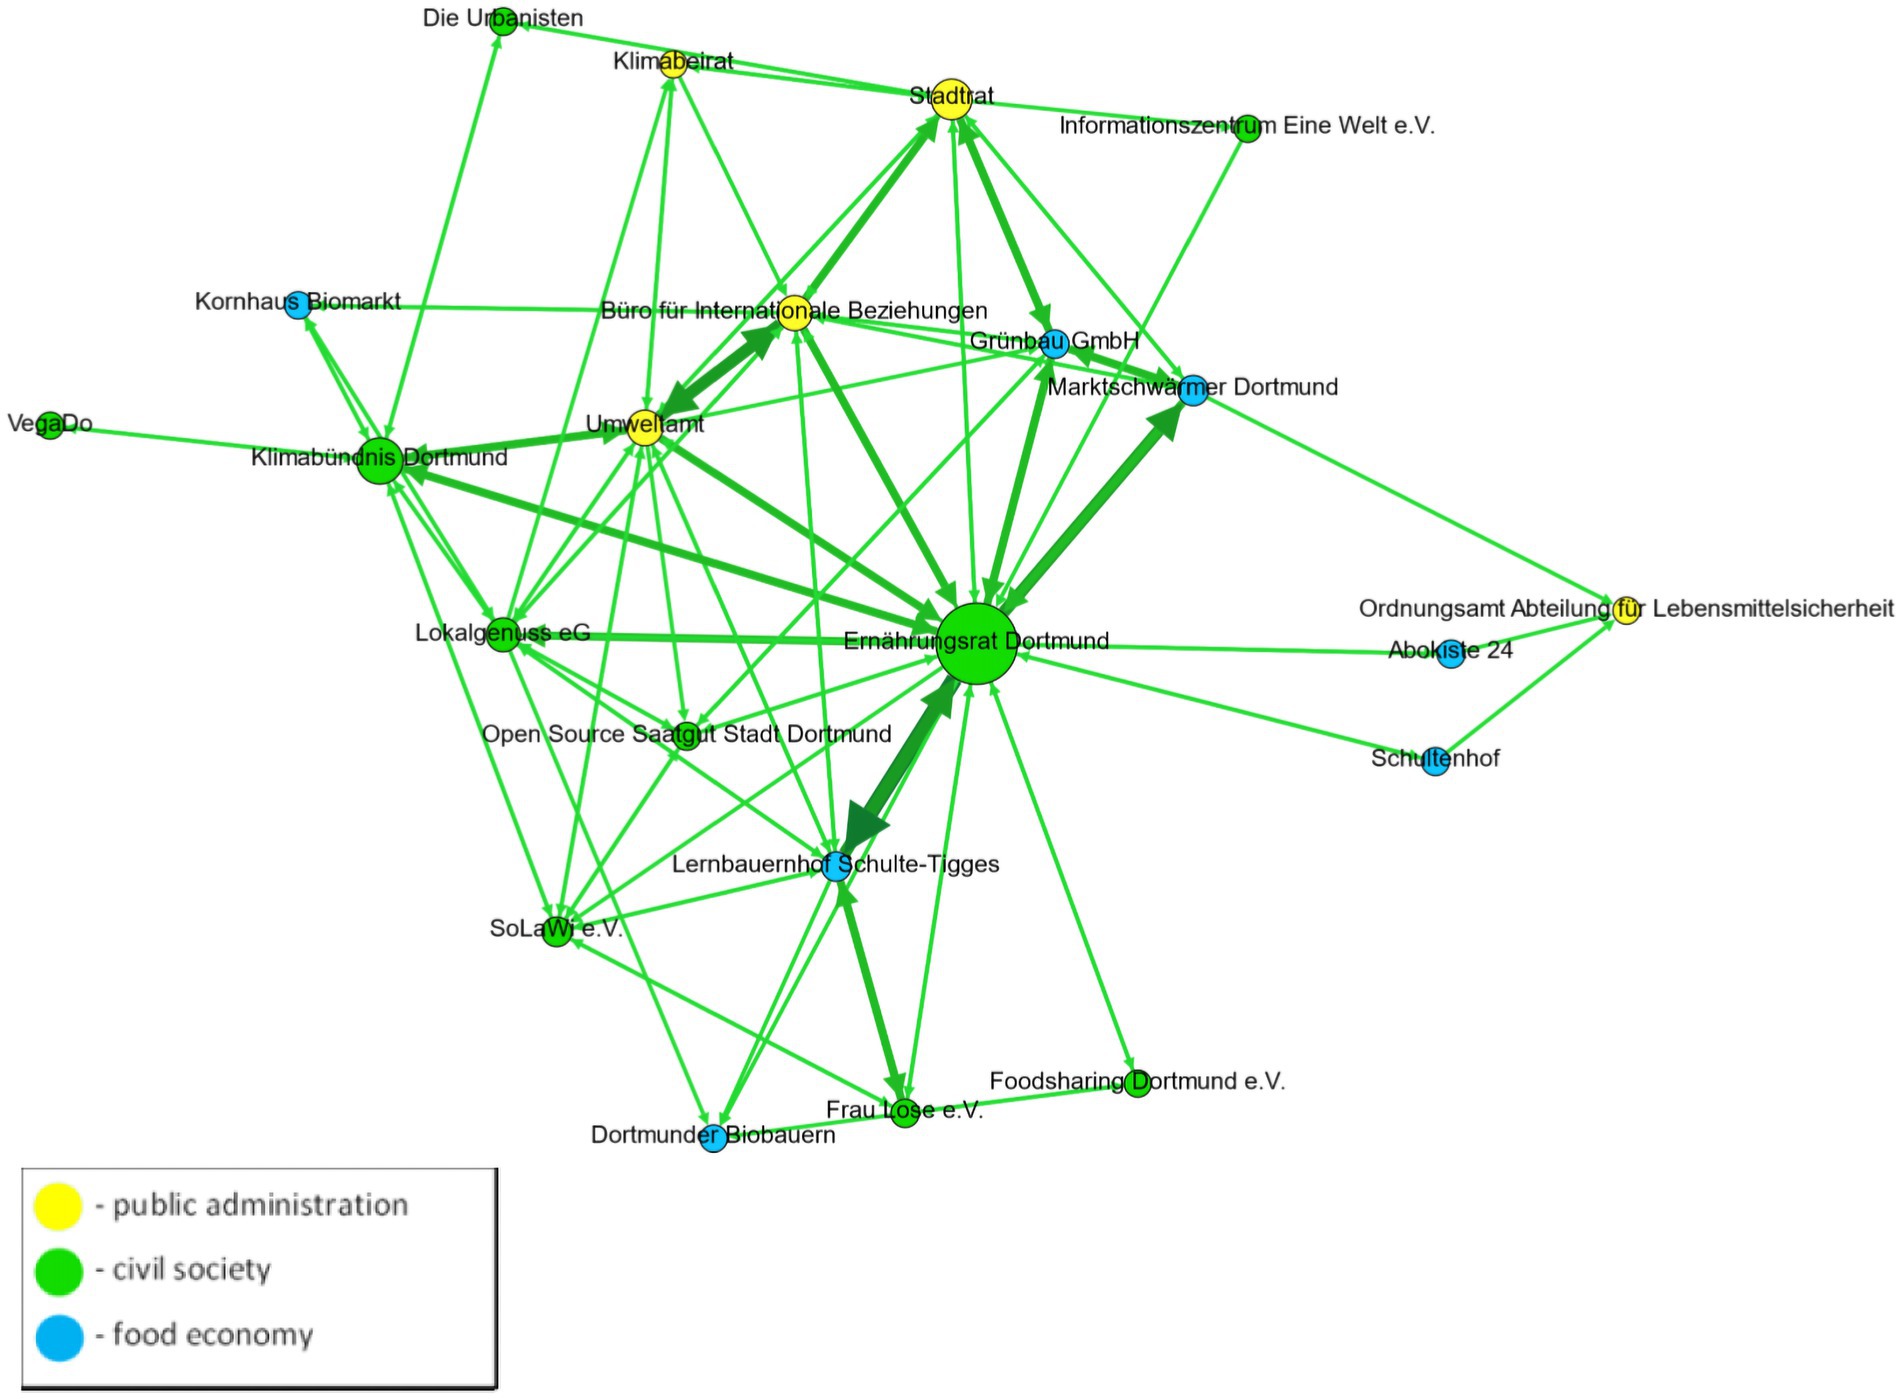
Figure 4. Net-Map of supportive relationships of the relevant actors of all three actor groups, food economy (blue), civil society (green), and public administration (yellow), in the CRFS in Bologna. All ties depicted. Node size according to degree centrality. Node color intensity according to betweenness centrality. The direction of the arrow indicates the direction of the relationship, as well as one-sided or two-sided relationships. (ILS/FoodE).
In comparison to Dortmund, in the Net-Map of Bologna (Figure 5), many more relevant actors are visible. As shown on the map, a dense network with a high number of supportive relationships is also evident here. The strongest supportive relationship, between farmers and citizens, is represented by the thickest edge with the darkest green color. Not only does this connection have the highest level of support, but the actors also have the strongest influence on the CRFS network. This relationship makes visible how closely connected citizens and farmers are with each other in the CRFS and highlights the importance of this relationship. In the interviews, the respondents pointed out that this connection can create a community that helps to create awareness among future consumers.
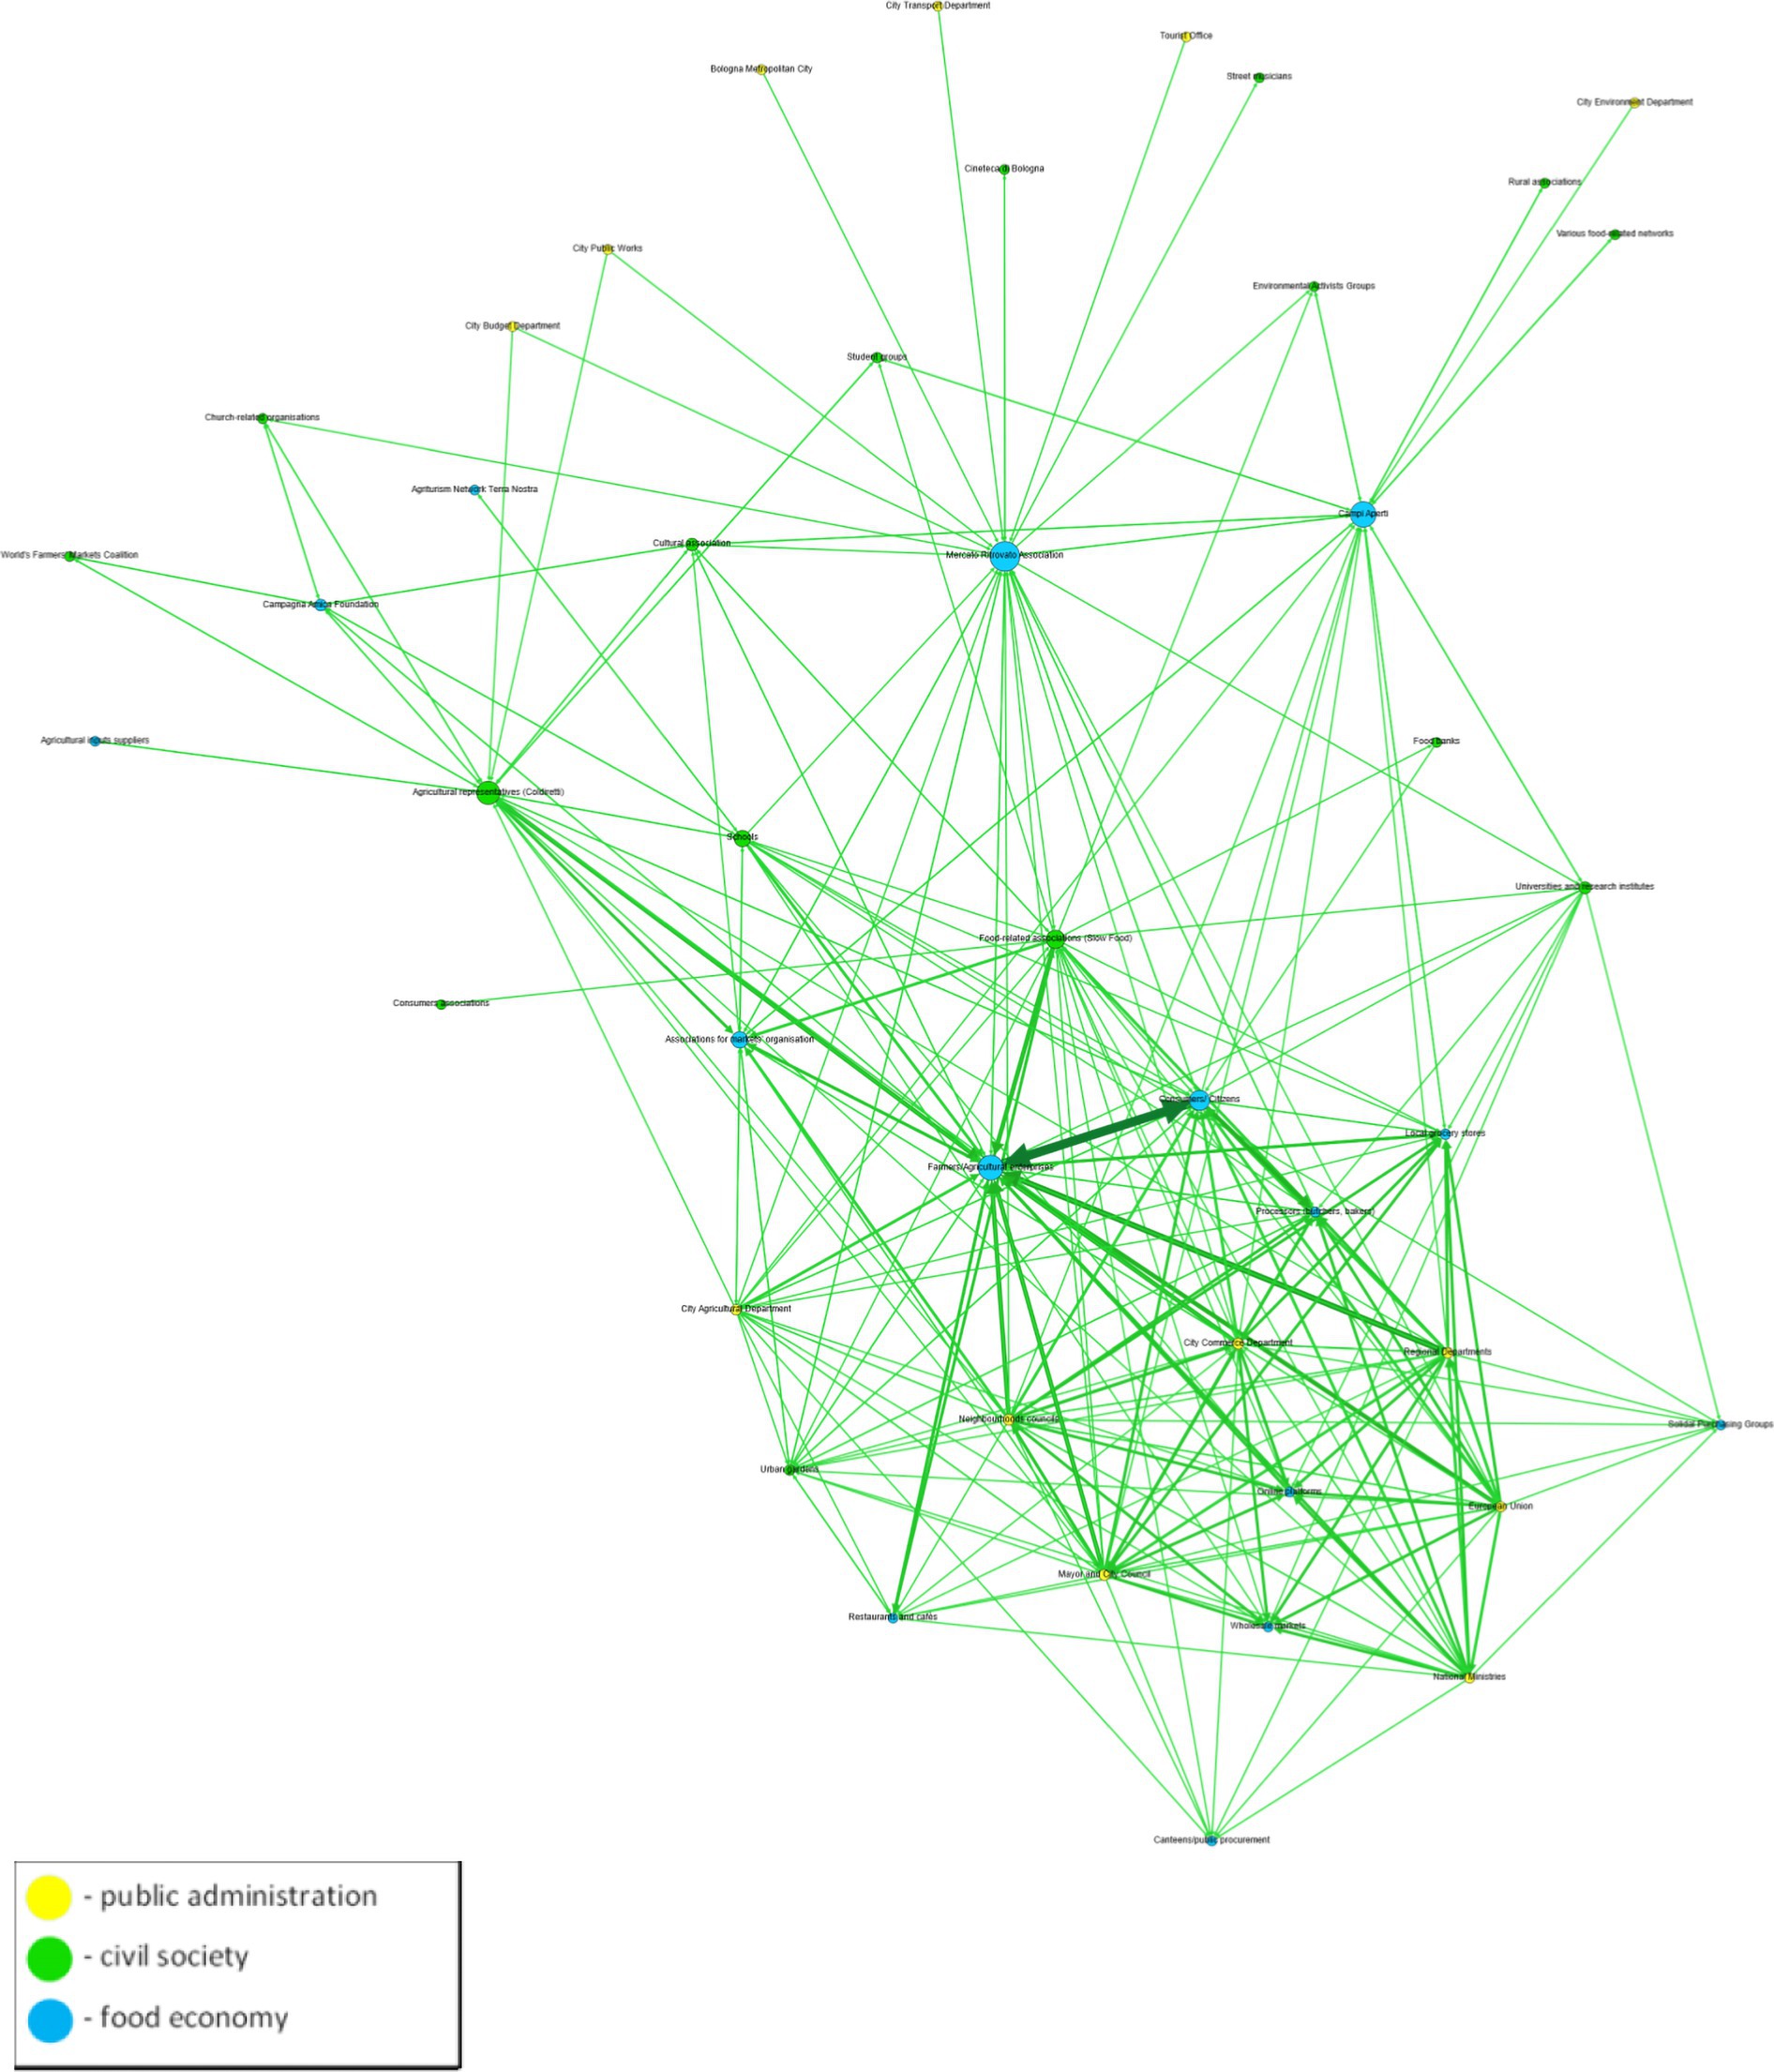
Figure 5. Net-Map of supportive relationships of the relevant actors of all three actor groups, food economy (blue), civil society (green), and public administration (yellow), in the CRFS in Bologna. All ties depicted. Node size according to degree centrality. Node color intensity according to betweenness centrality. The direction of the arrow indicates the direction of the relationship, as well as one-sided or two-sided relationships. (ILS/FoodE).
3.2.2 Desired relationships
The Net-Maps with desired relationships show which connections did not exist in the status quo in the network but would be desirable for the CRFS or which connections should be expanded more strongly. This mostly encompassed new or increased information exchange, networking, bundling interests, financial and other material support, and the creation of synergies. In contrast to the support network, the case studies revealed varying levels of density within the desired networks, ranging from frequently drawn connections to highly dense networks. Notably, support was the network with the highest density, but in all cases, the actors also wanted more relationships in the future, especially with the municipality and with the key actors of the CRFS.
For example, the Net-Map of Oslo (Figure 6) shows that the actors had no great size differences in their nodes and thus no highly fluctuating degree centrality. Incoming and outgoing relationships were therefore more equally represented among the actors, which also expressed a high desire for relationships among all actors in the network. However, dark red edges can be seen, especially toward the municipality of Oslo, which was also centrally located in the network, indicating a high level of magnetism.
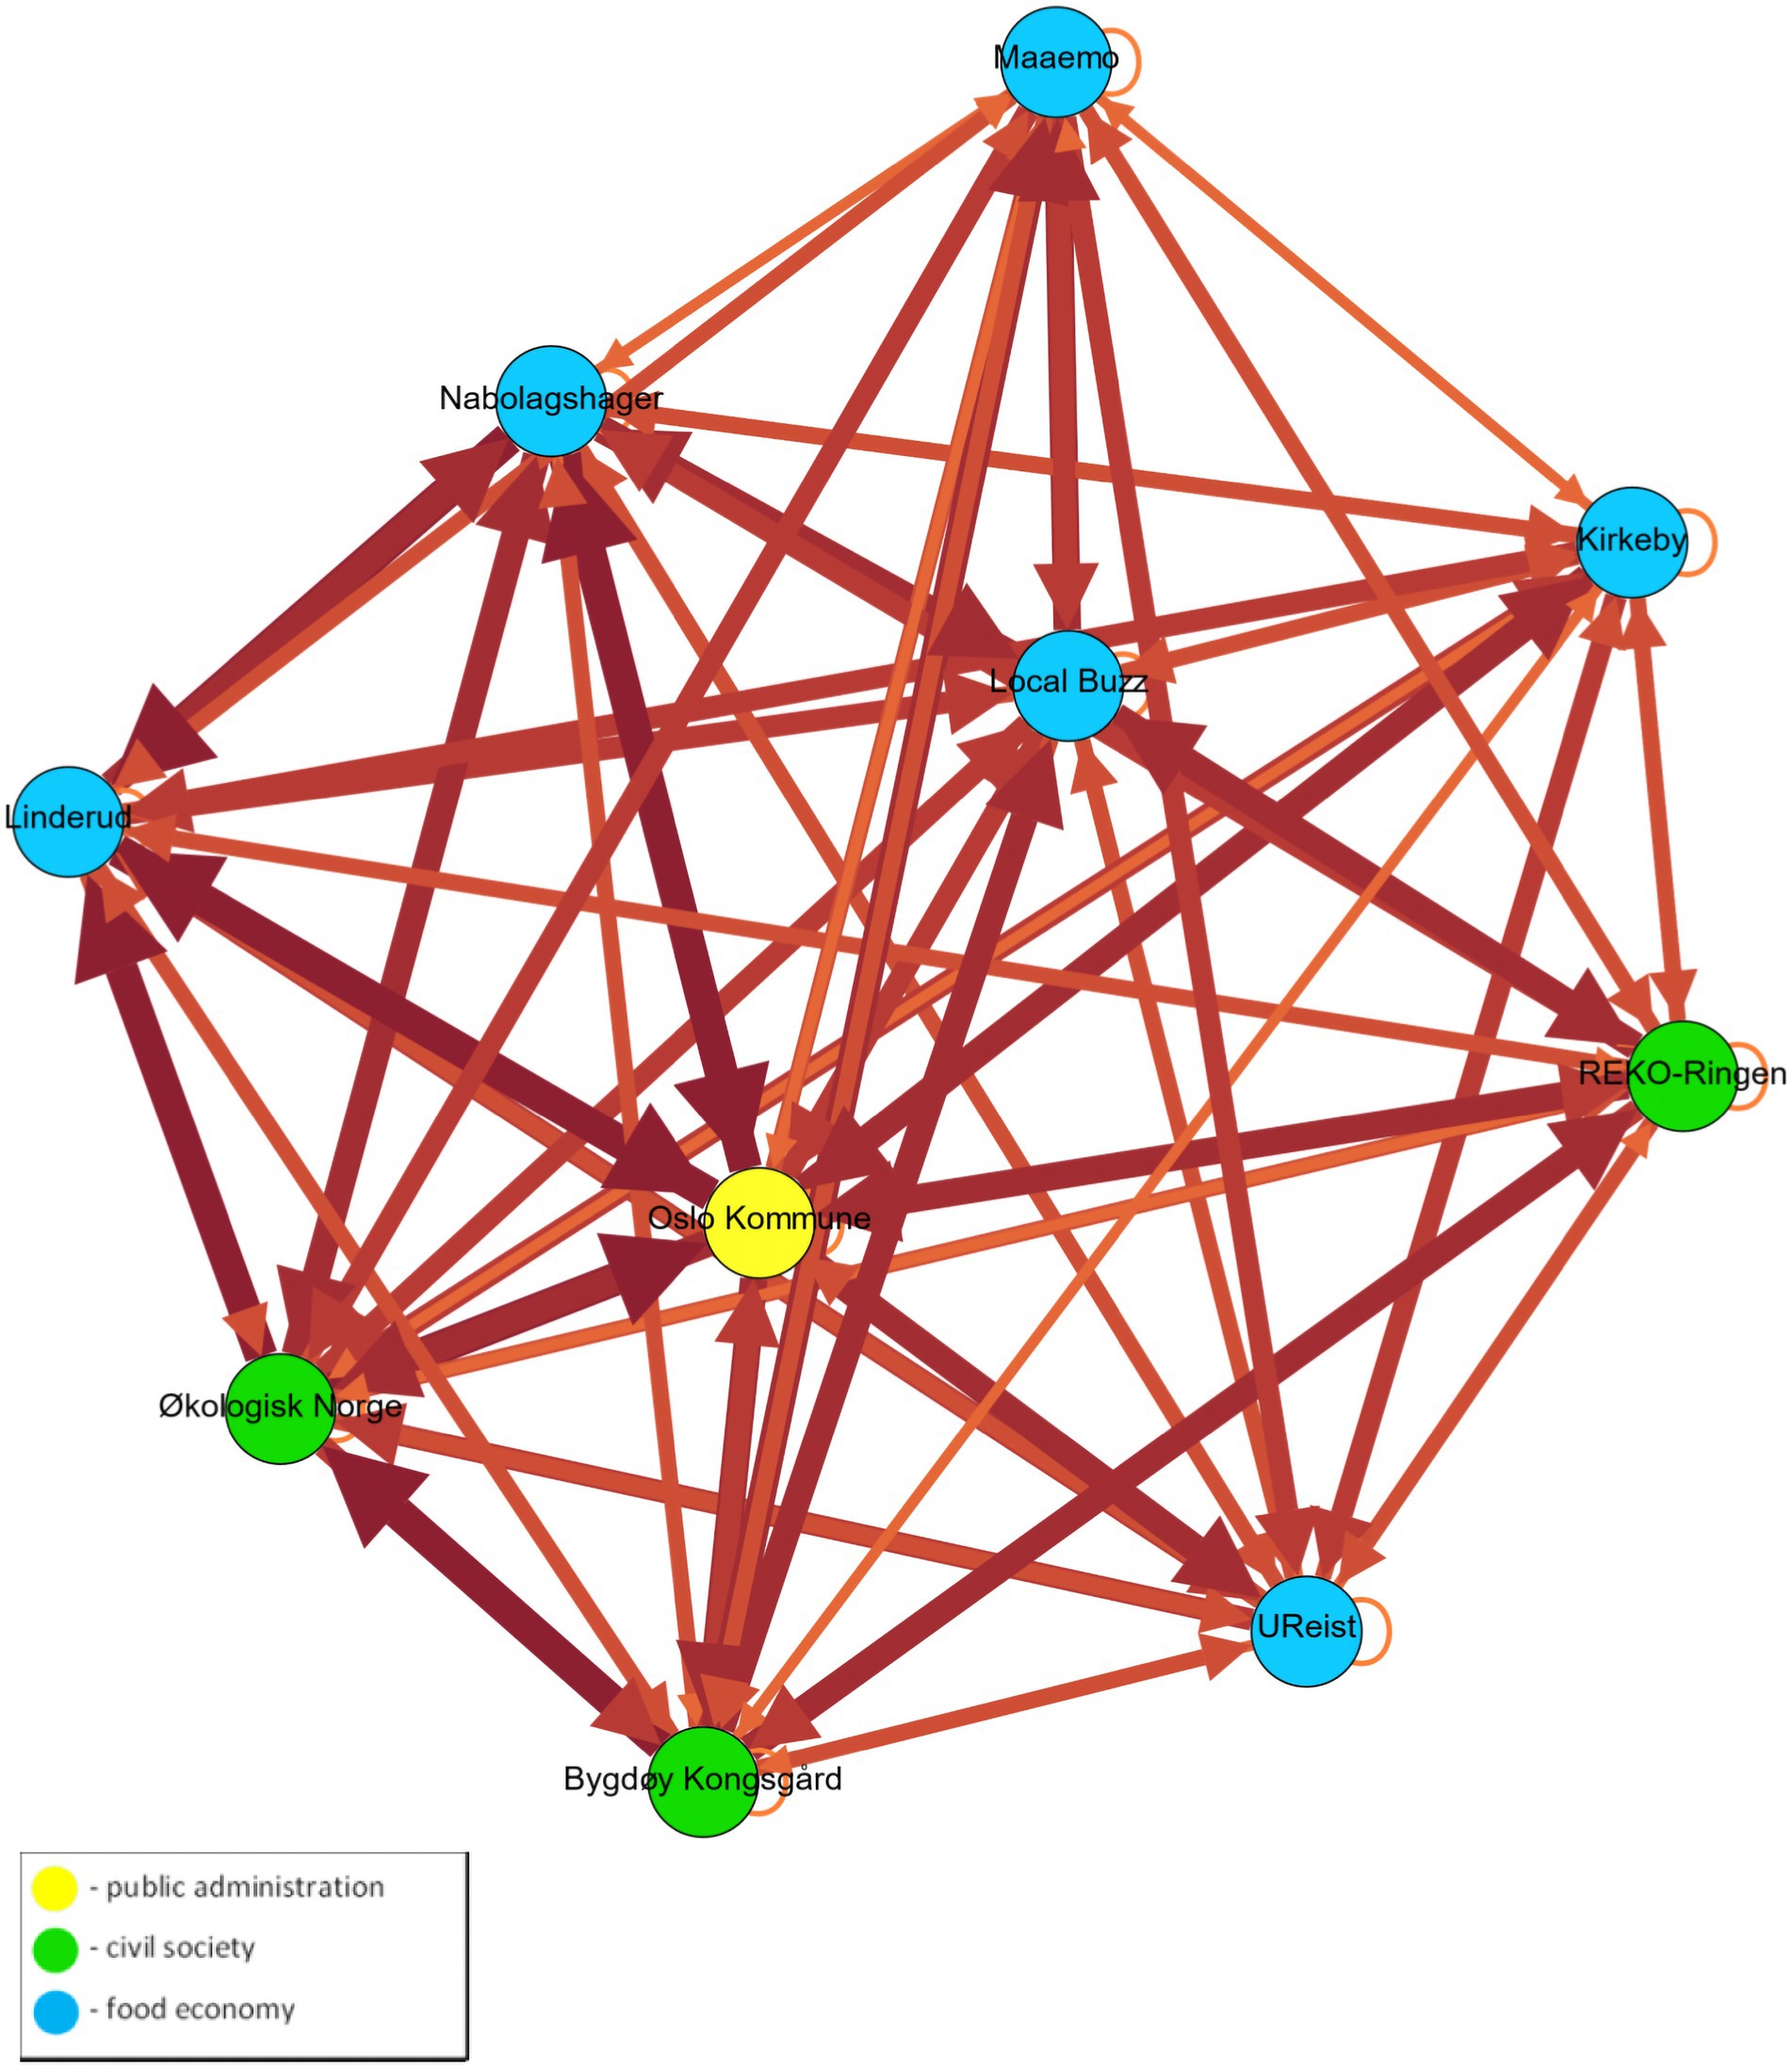
Figure 6. Net-Map of desired relationships of the relevant actors of all three actor groups, food economy (blue), civil society (green), and public administration (yellow), in the CRFS in Oslo. All ties depicted. Node size according to degree centrality. Node color intensity according to betweenness centrality. The direction of the arrow indicates the direction of the relationship, as well as one-sided or two-sided relationships. (ILS/FoodE).
Using Oslo as an example, the Net-Map shows that participants mostly wanted the city of Oslo, which had the strongest influence and potential to transform the CRFS, to strengthen relationships with other actors in the future. Statements from the interviews revealed that the desired relation was perceived as not strong enough and not always reciprocal. In addition, stronger coordinated cooperation with other actors in the network was desired.
In the desired relationships in the CRFS in Naples (Figure 7), the Net-Map shows that there are main actors located in the center of the map, with high degree centrality and a high number of incoming and outgoing relationships. To the left and right of this density are individual strands of connections in the network. While these may not be the central focus, they hold significance for comprehending the relationships depicted in this map, enriched by additional insights provided in the interviews.
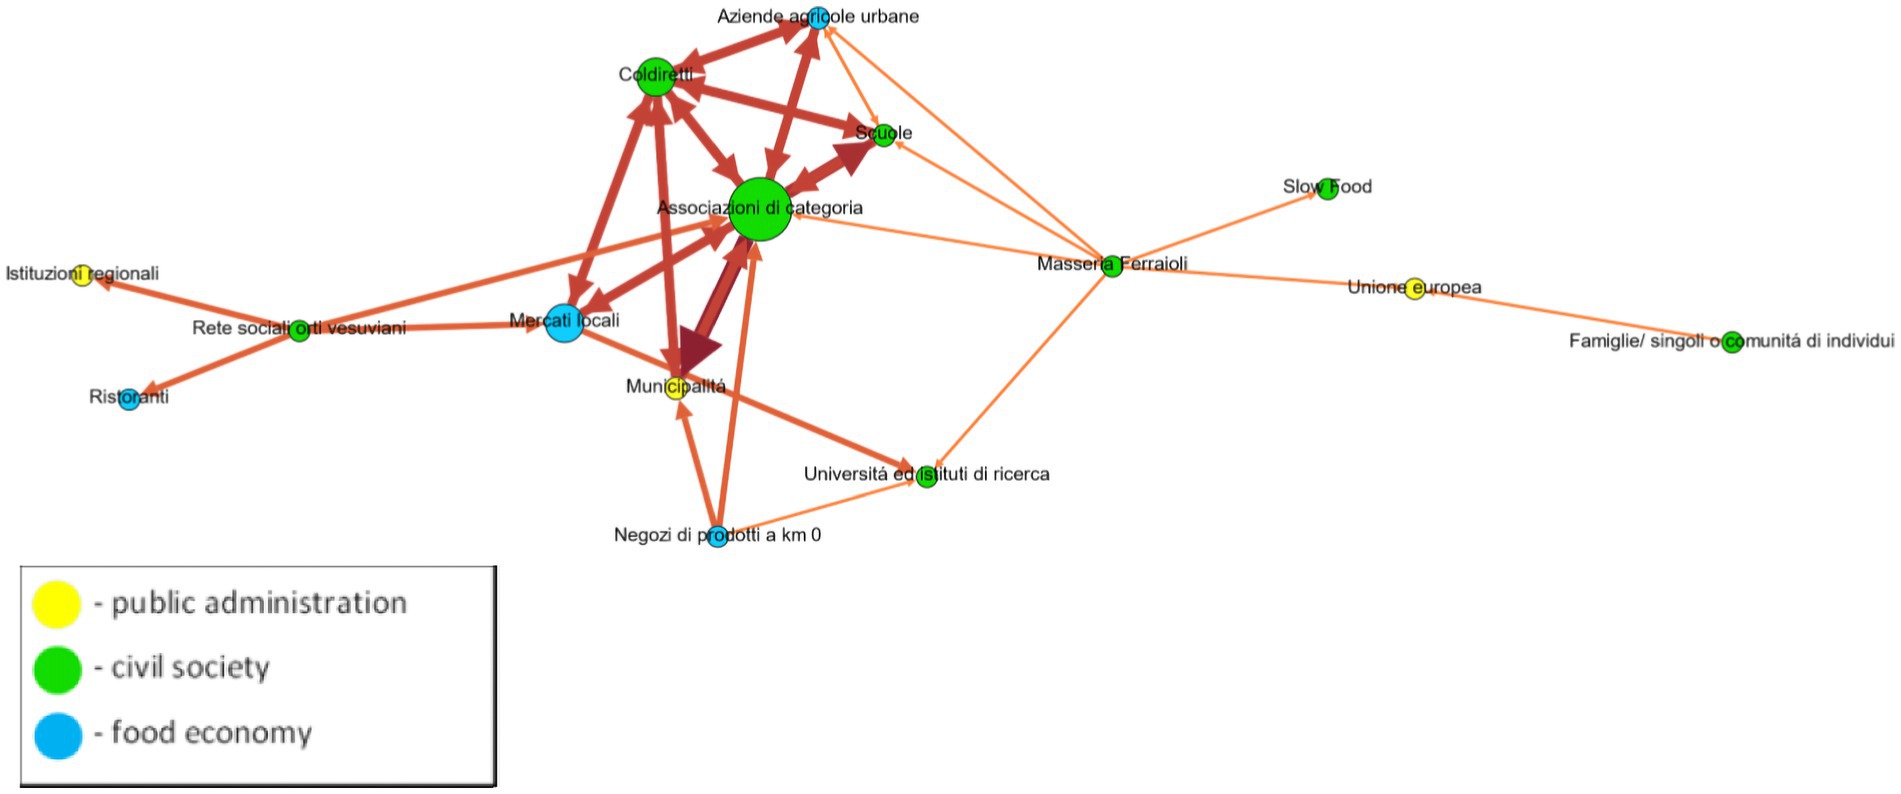
Figure 7. Net-Map of desired relationships of the relevant actors of all three actor groups, food economy (blue), civil society (green), and public administration (yellow), in the CRFS in Naples. All ties depicted. Node size according to degree centrality. Node color intensity according to betweenness centrality. The direction of the arrow indicates the direction of the relationship, as well as one-sided or two-sided relationships. (ILS/FoodE).
The Net-Map shows that it is not the city but the civil society initiatives that form the core of the desired network relationships. The highest degree centrality is mainly that of the farmers’ associations, especially Coldiretti. In relation to families, individuals or communities of citizens, the need for a stronger relationship with the European Union was highlighted in the interviews, as this institution and its actions were perceived as far removed from the needs of the people.
3.2.3 Hindering relationships
For hindering relationships, the Net-Map reveals weaknesses, hurdles, and conflicts that exist within the network and between the actors. The case studies show that there were mostly fewer hindering relationships than supportive relationships.
In the CRFS in Tenerife (Figure 8), illegal fishermen had a particularly strong obstructive relationship with the legitimate producers of the fisheries sector and with the public administration. The Net-Map of Tenerife shows that the illegal fishermen (poachers) were the central actors in the hindering relationships, with the highest degree of centrality. Imported and illegal products hindered fair trade in local catches, sometimes representing strong unfair competition with local producers. The public administration’s decision-making position was perceived as being hindered by rules, boundaries, and laws, as well as bureaucratic hurdles and a lack of resources to implement a regulated framework and reduce the activities of illegal fishers.
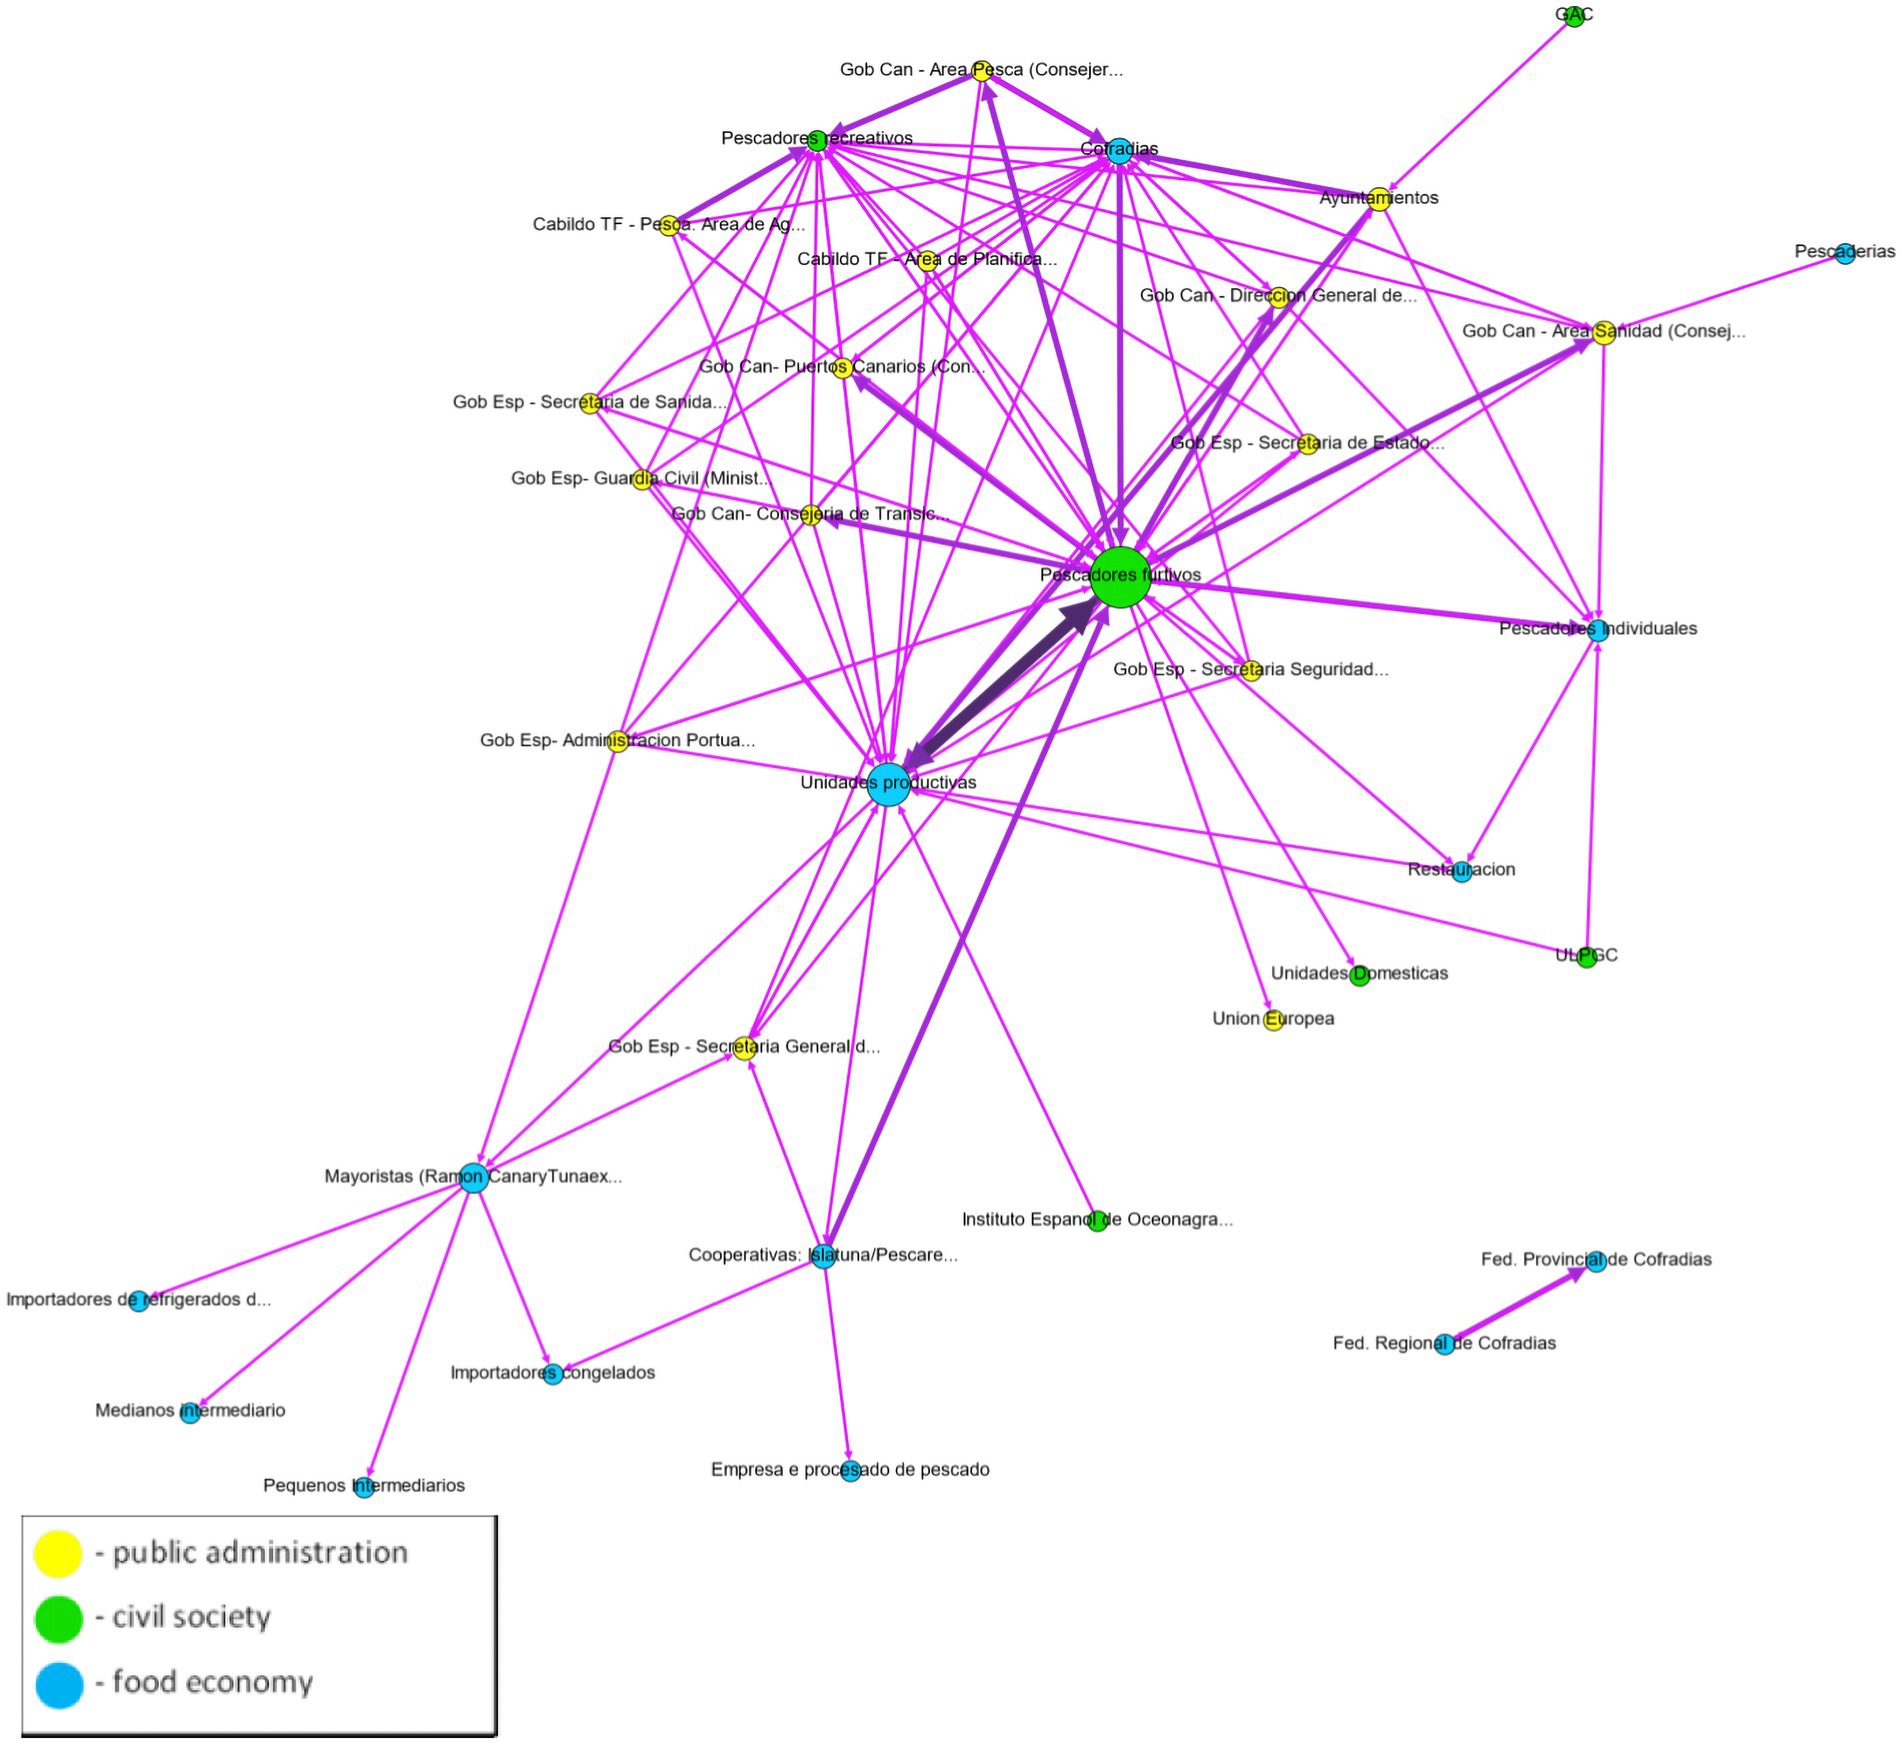
Figure 8. Net-Map of hindering relationships of the relevant actors of all three actor groups, food economy (blue), civil society (green), and public administration (yellow), in the CRFS in Tenerife. All ties depicted. Node size according to degree centrality. Node color intensity according to betweenness centrality. The direction of the arrow indicates the direction of the relationship, as well as one-sided or two-sided relationships. (ILS/FoodE).
The Net-Map of hindering relationships in the CRFS in Romainville (Figure 9) shows that few actors played a role here and that there were only hindering relationships with the Cité Maraîchère. The interviewees mentioned the perception of a lack of support on the part of the public administration in the form of financial assistance as an obstacle.
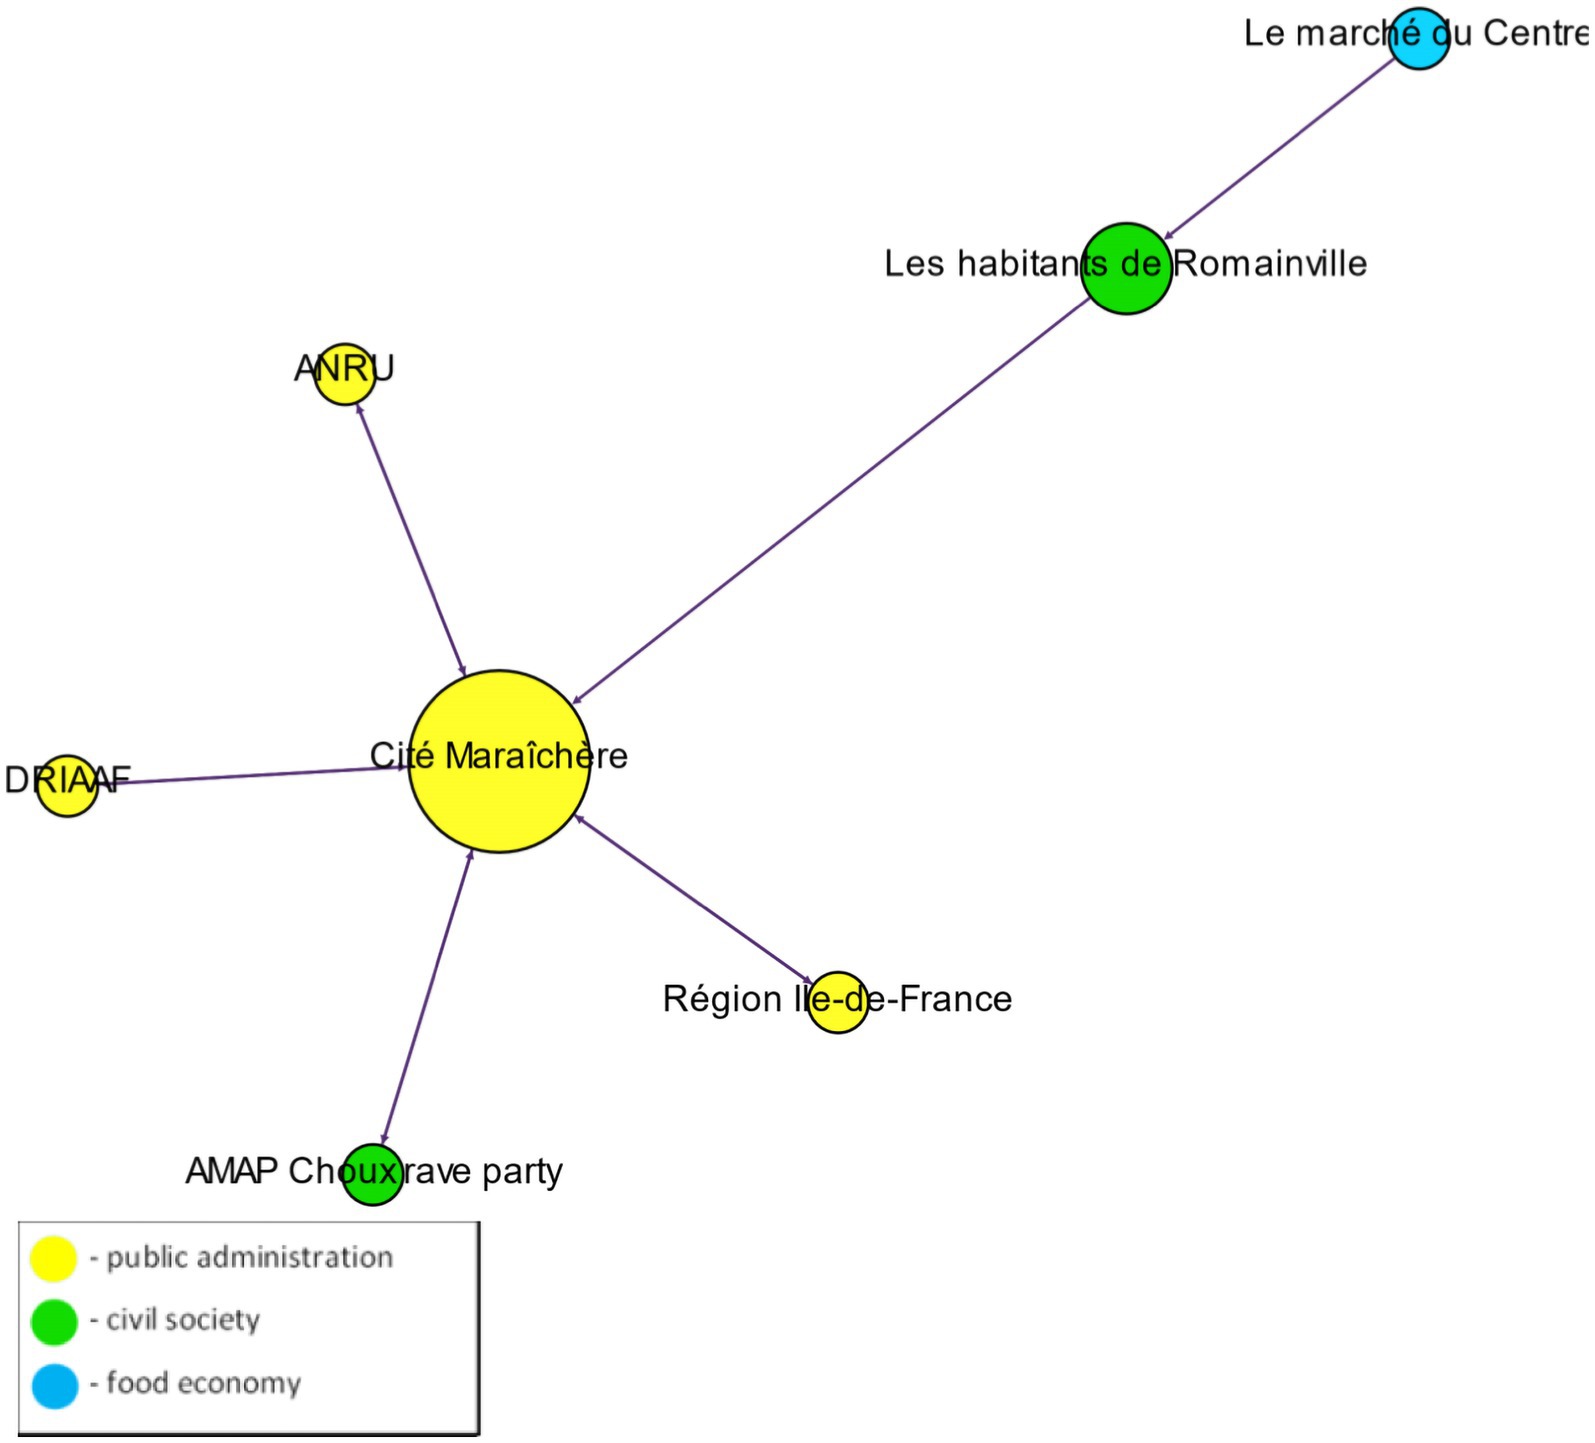
Figure 9. Net-Map of hindering relationships of the relevant actors of all three actor groups, food economy (blue), civil society (green), and public administration (yellow), in the CRFS in Romainville. All ties depicted. Node size according to degree centrality. Node color intensity according to betweenness centrality. The direction of the arrow indicates the direction of the relationship, as well as one-sided or two-sided relationships. (ILS/FoodE).
3.2.4 Commercial relationships
Commercial relationships show which actors are in a business relationship with each other. The example of the CRFS in Lansingerland (Figure 10), which is concerned primarily with the energy transition, shows that these relationships existed primarily among the food economy and public administration. The map shows the interrelationships between food economy actors and civil society actors through the triangles in the center of the map, which thus also illustrate a high level of interdependent dynamics among the actors. Primary producers had well-established (and mutual) connections with private investors, energy suppliers, general suppliers, and research institutions. In this case, research institutions played a key role as connectors for the network as a whole and especially served as a bridge with the sphere of civil society.
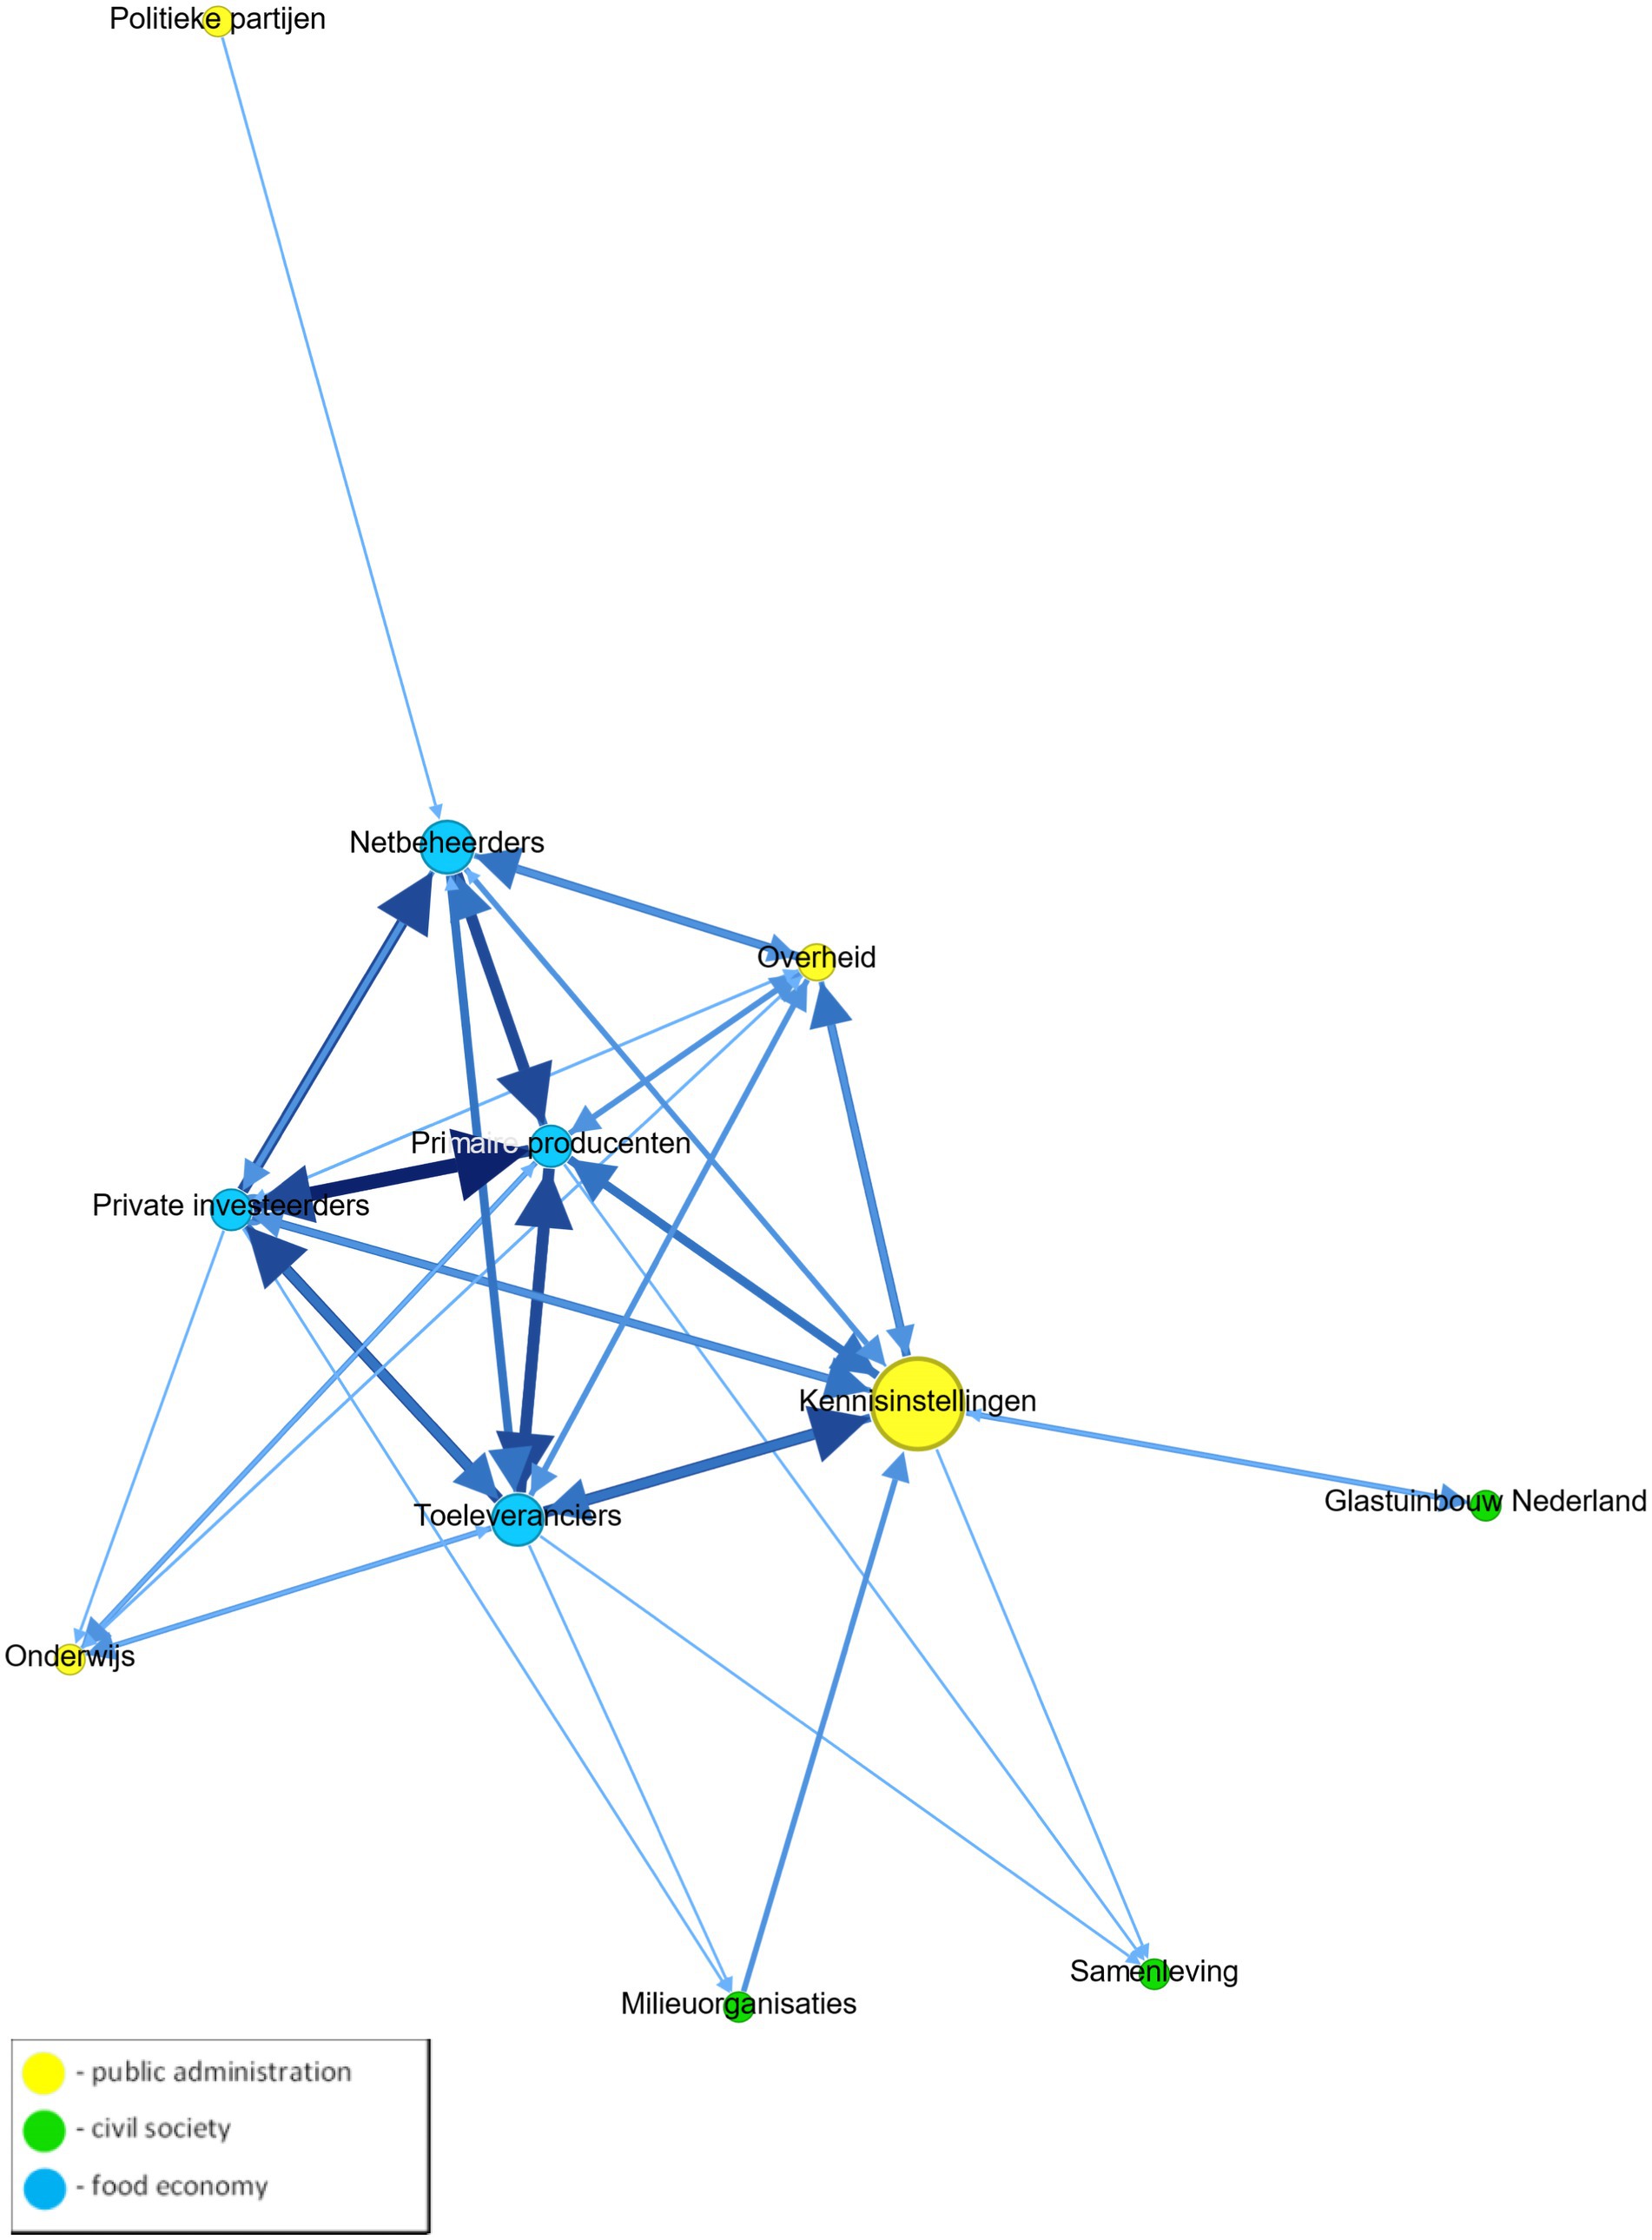
Figure 10. Net-Map of commercial relationships of the relevant actors of all three actor groups, food economy (blue), civil society (green), and public administration (yellow), in the CRFS in Lansingerland. All ties depicted. Node size according to degree centrality. Node color intensity according to betweenness centrality. The direction of the arrow indicates the direction of the relationship, as well as one-sided or two-sided relationships. (ILS/FoodE).
3.3 Insights for determining strengths and weaknesses and elaborating solutions in the network
Based on the results obtained through the Net-Map tool, the researchers then conducted a SWOT analysis themselves and summarized weaknesses and potential improvements in the CRFS network, drawing conclusions from these findings for potential improvements, solutions or even risks in the future. Table 4 presents the results for the city of Dortmund for illustration. In this case, the analysis was developed by the researchers together with key persons from the CRFS in a group discussion.
The results for Dortmund show that activities in the network were primarily person-centered. The network exhibited a certain instability that could be remedied by stronger institutionalization. The person-based activities in the food network resulted in information being transmitted over a short distance and exchanges being based on personal, trust-building relationships. If individual key figures were to disappear, the network could be weakened or even collapse. Solutions for institutionalization were mentioned in the group discussion.
For example, the food-relevant civil society and food economy in Dortmund lacked the bundling of interests and the visualization of their goals and challenges. The Food Policy Council was the actor that was supposed to work out this bundling. Due to its form of a voluntary initiative and due to the workload involved in establishing the association, there were deficiencies in time, personnel, and financial resources.
The results of the SWOT analysis generated insights and showed what solutions are crucial for the development of the CRFS in each case study (Table 5).
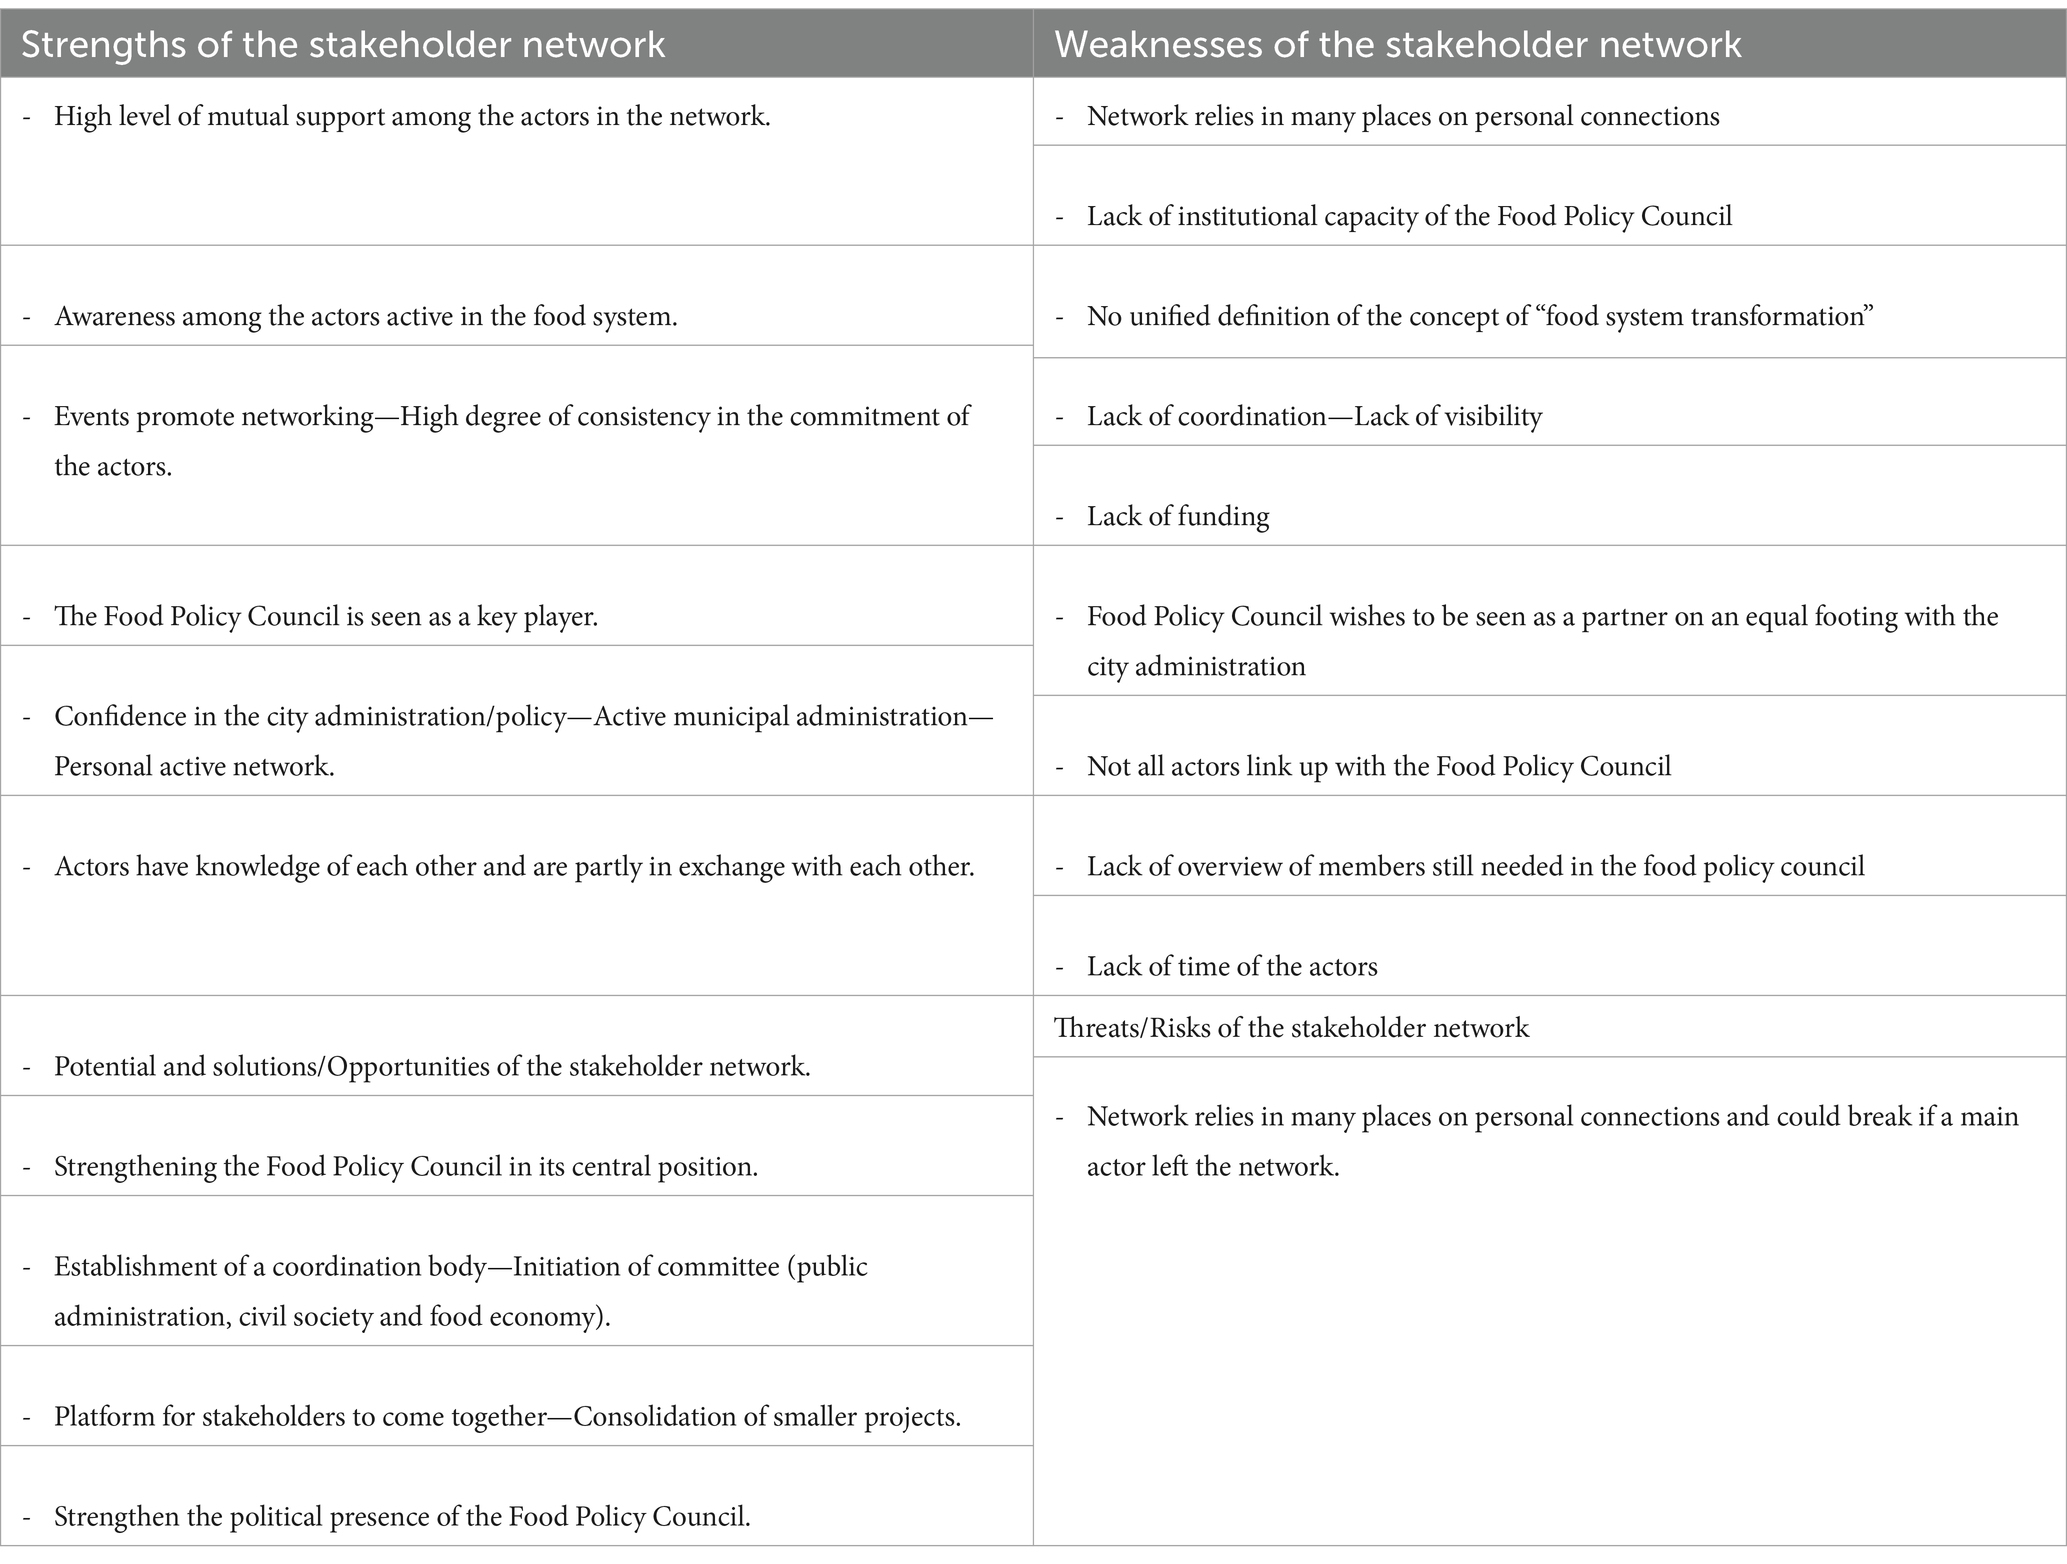
Table 5. Example of a SWOT analysis generated from the Net-Map results in the Dortmund case study (ILS/FoodE).
4 Discussion and recommendations
The Net-Map tool provides a snapshot of an actor network identifying the roles, relationship patterns, and influences of the individual actors. This reveals dynamics between actors that are not based on physical infrastructures but are hidden in social networks (Hauck, 2012). The tool made it possible to show how actors were perceived in the CRFSs of the seven European cities. It also identified who was noticed as being present in the network and how these actors related to each other. When analyzing the interview data and the perceptions conveyed by the interview participants during the Net-Map interviews, we were able to contextualize an understanding of the dynamics and roles of the actors within the network within the specific situations in which these network participants were engaged. This allowed complex relationships to be understood with the addition of SWOT analysis. It also allowed weak points in the CRFS network to be identified.
4.1 Benefits of the Net-map tool for social network analysis in CRFS transformation/strengthening in European cities
The Net-Map tool allows a certain flexibility in the choice of formats and interview forms, which have already been implemented differently in other research (Lelong et al., 2016; Sattler et al., 2022; Schröter, 2022a). Considering individual factors such as the size of the study area, the number of interview partners, and their time resources and financial expenditures (for example, travel to the interview location), the flexibility justifies a high implementation tolerance of this methodological tool (Sattler et al., 2022). This flexibility was advantageous in this study because each city was able to act individually with its time and personnel capacities and implement the method with the resources it had available. Additionally, the situation of the COVID-19 pandemic could be weighed individually, and an implementation option could be chosen on that basis.
A familiar atmosphere was created in the interviews, and the open-ended questions placed the focus on the opinions and perceptions of the interviewees, who could simultaneously follow their spoken words visually via network drawings. Thus, learning effects occurred immediately (Schröter et al., 2018). This also led to participants’ understanding of the current situation of their CRFS, and on this basis, shared visions for sustainable CRFSs were developed. During the interview process, the interviewees could qualitatively evaluate what they had said, visualize it, and reflect on it together with the researcher (Lelong et al., 2016). Therefore, connection between the researchers and the actors could be established, as the encounters took place in an informal way and insights into individual thoughts about the network could be revealed.
4.2 Limitations of the Net-map tool for analyzing CRFSs and limitations of the study in general
A disadvantage of the method is that it is time-consuming. The reason is the time needed for the individual Net-Map interviews as well as the further processing of the network maps and the interview material. The subsequent transfer of the data into an SNA and visualization program as well as the preparation, implementation, and analysis take considerable time. As a result, the interviewees’ concentration sometimes waned toward the end of the interviews, and the answers became shorter, which meant that less information could be gathered in the final steps.
Another obstacle regarding the collection of scientific data is the strict categorization of relationship types, which reduces complexity and does not reflect the nuanced nature of human interactions. Nevertheless, this specification ensured that each case study could depict the same relationships and also made it possible to create a clear time and evaluation framework. Furthermore, the participants did not encompass all perceptions within the network and lacked complete knowledge of individual characteristics. Achieving this level of information would theoretically entail conducting interviews with every individual involved in the CRFS network. To address this challenge, we grouped the actors into three actor categories: food economy, civil society and public administration. Another limitation of the tool is that the results are subjective and show the perceptions of the participants. Therefore, some information could have been omitted because some participants did not know every specific relationship to other actors, which also influenced the results of the Net-Maps. The study area was also limited due to time constraints. The scope of the investigation was limited primarily to the city itself, and as a result, several relevant actors from surrounding areas were not included. The method may not capture all relevant stakeholders, especially those who are marginalized or have limited involvement in the CRFS. Furthermore, the actors in the network were defined differently in different cases. In some cases, general actors were used, such as schools or city administration, which included several institutions or specialized offices, or specific actors were named, such as “Frau Lose” (a café in Dortmund) or environmental department. In addition, the interviewees sometimes misattributed relationships or roles to higher-level actors, leading to potential data inaccuracies.
4.3 Practical uses of the tool in policy making
The CRFS approach is designed not only to ameliorate the food system within urban locales but also to extend its impact into neighboring rural regions. This approach carefully considers various pivotal facets, including infrastructure, logistics, public procurement, licensing, and land-use planning. Equally crucial is the active engagement of governmental bodies at different levels alongside participants from civil society and the private sector (RUAF, 2017).
To gain a comprehensive understanding of the complexity of the entire food system and craft effective solutions, it is prudent to build upon existing knowledge and incorporate rural areas into the examination.
The Net-Map tool made it possible to address the complexity of CRFSs. It facilitates an all-encompassing analysis and the involvement of additional pertinent stakeholders. Consequently, it fosters a holistic strategy for enhancing food security, sustainability, and food system quality in both urban and rural settings. The results of different situations in the specific networks show that completely different actors act as key figures and that specific challenges exist. The tool is well suited for a truly deep dive into these individual structures and for visibly presenting them in the context of each network as demanded by Brinkley et al. (2021), Christensen and O’Sullivan (2015), and Levkoe et al. (2021). It provided information on the effectiveness of existing governance structures, resource management practices, and marketing channels. Deconstructing relationships with regional and local stakeholders makes it possible to assess which resources are currently being leveraged and identify opportunities for collaboration that have yet to be explored.
This information can inform decision-making processes to transform and strengthen CRFSs as they “determine which personnel or departments are engaging in local food activities, what those activities are, and how the personnel or departments are interacting.” (Christensen & O’Sullivan, 2015, 126). All type of actors that want to implement or improve a CRFs and use SNA results as a kind of consultancy how to proceed.
In addition, the visual results can be used for discussion (Christensen and O’Sullivan, 2015) and increase motivation to drive the transformation of a CRFS. Showing processes and relationships that are already operating well or that are having less of an impact can improve the understanding the needs of each actor and actor group, resulting in increased clarity among all the actors involved and promoting appropriate developments and actions from within the network itself. This is important both for the participants themselves, who gain a better understanding of the stakeholders whom they are connected with, and for policymakers, who can implement specific policies.
The results of the Net-Map interviews can be integrated into policy debates and influence future decisions on food in the city. The network maps can motivate members of civil society to participate in the network. They can create awareness of the topic in the city, bring actor groups closer together, and offer a structured basis for further steps that can be carried out with further participatory processes on site. For this purpose, it was important in the study to present the results to the stakeholders in the CRFS network. Based on the results, further moderated discussion rounds and workshops can be used to define common goals and guide visions. On this basis, a strategy can then be developed to record the goals, plans and projects for sustainable CRFSs.
The Net-Map tool complements other tools for gathering data on food systems. For instance, the visual aspect of the maps and the involvement of various stakeholders in their development will enhance stakeholders’ engagement in discussions of the current situation, in contrast to traditional long-term fieldwork techniques. While it may not introduce a significant amount of new information after extensive on-site research, this tool can contribute to the collective development of plans for change.
For a whole participatory learning process, a group discussion is helpful, or at the presentation with a final discussion of the Net-Maps in each case study with all relevant actors. The case of the city of Dortmund showed that the group discussion had an effective impact on further solutions and local participants.
The results are very specific to each CRFS and offer the possibility of addressing individual factors and specific situations of networks in both geographical and socioeconomic contexts in the CRFS. This is particularly advantageous for the complexity of food systems and the diversity of urban structures in Europe. The tool shows highly transferable implementation for the analysis of CRFSs in different contexts. As it can be implemented so flexibly, this article will serve as inspiration to show the usefulness of analyzing CRFS networks in their specific contexts to determine the gaps and potential improvements and to develop sustainable CRFSs.
5 Conclusion
Local actors with their relationships, dynamics, roles, and motivations hidden within the operating network are the drivers of the transformation of CRFSs. To uncover this information, identify barriers and potential improvements, and develop solutions on this basis, it is essential to make the network visible. This is made possible through the Net-Map tool, with learning processes for both local actors and researchers, generating visualizations of relationships, roles, influences, and motivations within the network and capturing individual perceptions through qualitative interviews. The tool therefore overcomes limitations of existing SNA of food systems.
The research demonstrates the relevance of using the Net-Map tool to understand local food networks, allowing local actors to be seen and understood, promoting mutual understanding among them and providing visibility into the dynamics of their operation. Equipped with this knowledge, actors in these networks can better connect, particularly when facing similar situations. Additionally, local city administrations can gain a better understanding of how to approach the topic of food within the city by integrating economic and civil actors with knowledge of how best to engage and support them and what their needs are.
As the study only presents a snapshot of the CRFS networks at a certain point of time, future research may conduct longitudinal social network to understand changes in actors’ constellations and shifts in their relations (Christensen and O’Sullivan, 2015; Brinkley et al., 2021). The evaluation of these results could show the actors the extent to which the stabilization of the goals has progressed and what has changed in the network structures over time.
Furthermore, in addition to evaluating the availability and accessibility of resources such as land, water, seeds, and financial support for farmers, future research could analyze the transport infrastructure for food distribution from rural to urban centers as well as food processing and distribution mechanisms. An additional salient aspect is the potential challenges and opportunities associated with social integration and the engagement of rural communities in decision-making processes and initiatives aimed at enhancing the food system. The Net-Map Tool could be a valuable visualization tool for illuminating these aspects and in this way advance the transformation of urban food systems into sustainable and resilient CRFS.
Data availability statement
The raw data supporting the conclusions of this article will be made available by the authors, without undue reservation.
Author contributions
ML: Conceptualization, Data curation, Formal analysis, Investigation, Methodology, Resources, Validation, Visualization, Writing – original draft, Writing – review & editing. KS: Conceptualization, Data curation, Formal analysis, Investigation, Methodology, Project administration, Resources, Supervision, Validation, Writing – review & editing, Funding acquisition, Writing – original draft. BS: Conceptualization, Data curation, Methodology, Supervision, Writing – review & editing, Writing – original draft. AW: Conceptualization, Investigation, Writing – review & editing, Formal analysis, Methodology. CI: Conceptualization, Writing – review & editing, Formal analysis, Investigation. RF-K: Conceptualization, Supervision, Writing – review & editing, Funding acquisition, Project administration. A-KS: Conceptualization, Visualization, Writing – review & editing. FM: Conceptualization, Writing – review & editing, Formal analysis, Investigation. AS: Conceptualization, Writing – review & editing, Formal analysis, Investigation. GM: Conceptualization, Writing – review & editing, Formal analysis, Investigation. LR-D: Conceptualization, Writing – review & editing, Formal analysis, Investigation. AC: Conceptualization, Writing – review & editing, Formal Analysis, Investigation. IR: Conceptualization, Writing – review & editing, Formal analysis, Investigation. MD’O: Conceptualization, Writing – review & editing, Formal analysis, Investigation. JR: Conceptualization, Writing – review & editing, Formal analysis, Investigation. SA: Conceptualization, Data curation, Writing – review & editing. JP-F: Conceptualization, Data curation, Writing – review & editing, Investigation.
Funding
The author(s) declare that financial support was received for the research, authorship, and/or publication of this article. This work has received funding from the European Union’s Horizon 2020 research and innovation program (grant agreement no. 862663). The Open Access Costs are provided by the Research Institute for Regional and Urban Development in Dortmund, Germany.
Acknowledgments
The authors would like to thank all local stakeholders who participated in the Net-Map interviews, as well as two reviewers for the suitable comments on a previous version of this paper.
Conflict of interest
The authors declare that the research was conducted in the absence of any commercial or financial relationships that could be construed as a potential conflict of interest.
Publisher’s note
All claims expressed in this article are solely those of the authors and do not necessarily represent those of their affiliated organizations, or those of the publisher, the editors and the reviewers. Any product that may be evaluated in this article, or claim that may be made by its manufacturer, is not guaranteed or endorsed by the publisher.
Supplementary material
The Supplementary material for this article can be found online at: https://www.frontiersin.org/articles/10.3389/fsufs.2024.1315399/full#supplementary-material
Footnotes
1. ^More information at https://netmap.wordpress.com/about/
References
Baldy, J, Eckardt, T, and Kruse, S (2020). "Wie lassen sich Beteiligungsprozesse organisieren, um eine nachhaltige Gestaltung des kommunalen Ernährungssystems zu befördern?" DStGBDokumentation (153), pp. 18–19. Available at: https://d-nb.info/120525692X/34 (Accessed January 1, 2022).
Baldy, J., and Kruse, S. (2019). Food democracy from the top down? State-driven participation processes for local food system transformations towards sustainability. Politics Govern. 7:2019. doi: 10.17645/pag.v7i4.2089
Bassarab, K., Clark, J. K., Santo, R., and Palmer, A. (2019). Finding our way to food democracy: Lessons from US food policy council governance. Politics Govern. 7, 32–47. doi: 10.17645/pag.v7i4.2092
Blay-Palmer, A., Santini, G., Dubbeling, M., Renting, H., Taguchi, M., and Giordano, T. (2018). Validating the City region food system approach: enacting inclusive, Transformational City region food systems. Sustain. For. 10:1680. doi: 10.3390/su10051680
Borgatti, S. P., Mehra, A., Brass, D. J., and Labianca, G. (2018). Network analysis in the social sciences. Science 323, 892–895. doi: 10.1126/science.1165821
Brinkley, C., Manser, G. M., and Pesci, S. (2021). Growing pains in local food systems: a longitudinal social network analysis on local food marketing in Baltimore County, Maryland and Chester County, Pennsylvania. Agric. Hum. Values 38, 911–927. doi: 10.1007/s10460-021-10199-w
Bruce, A., Jackson, C., and Lamprinopoulou, C. (2021). Social networks and farming resilience. Outlook Agri. 50, 196–205. doi: 10.1177/0030727020984812
Carey, J., and Cook, B. (2021). "The Milan Urban Food Policy Pact monitoring framework." Available at: https://www.fao.org/3/cb4181en/cb4181en.pdf (Accessed December 7, 2023).
Cassaniti, J. (2021). Influence networks relating to health knowledge among Nairobi’s Micro-retailers and their clients. EJKM 18, 302–324. doi: 10.34190/ejkm.18.3.2068
Cherven, K (2015). "Mastering Gephi network visualization: produce advanced network graphs in Gephi and gain valuable insights into your network datasets." Birmingham. Available at: https://learning.oreilly.com/library/view/mastering-gephi-network/9781783987344/ch01s02.html (Accessed October 30, 2022).
Christensen, L. O., and O’Sullivan, R. (2015). Using social network analysis to measure changes in regional food systems collaboration: a methodological framework. J. Agric. Food Syst. Commun. Dev. 5, 113–129. doi: 10.5304/jafscd.2015.053.013
Clapp, J. (2015). Distant agricultural landscapes. Sustain. Sci. 10, 305–316. doi: 10.1007/s11625-014-0278-0
David, S., and Heine, S. (2019). “Nachhaltige Stadtentwicklung über kommunale Ernährungssysteme: Marktakteursnetzwerke als Ansatzpunkte zur Gestaltung und Steuerung,” Zeitschrift für Wirtschaftsgeographie, 63, 1–22. doi: 10.1515/zfw-2018-0024
Doernberg, A., Horn, P., Zasada, I., and Piorr, A. (2019). Urban food policies in German city regions: an overview of key players and policy instruments. Food Policy 89:101782. doi: 10.1016/j.foodpol.2019.101782
EIT Food (2020). "EcoFoodMap Leuven mapping the food system in and around Leuven." Available at: https://www.eitfood.eu/projects/ecofoodmap-leuven-mapping-the-food-system-in-and-around-leuven
FAO (2022). "The CRFS approach | Food for the cities programme | Food and Agriculture Organization of the United Nations." Available at https://www.fao.org/in-action/food-for-cities-programme/overview/crfs/en/ (Accessed November 28, 2022).
Feagan, R. (2007). The place of food: mapping out the ‘local’ in local food systems. Progress Hum. Geography 31, 23–42. doi: 10.1177/0309132507073527
Flick, U. (2021). Qualitative Sozialforschung. Eine Einführung. 10. Auflage, Originalausgabe. Reinbek bei Hamburg: rowohlts enzyklopädie im Rowohlt Taschenbuch Verlag (Rororo Rowohlts Enzyklopädie, 55694).
Freedman, D. A., and Bess, K. D. (2011). Food systems change and the environment: local and global connections. Am. J. Commun. Psychol. 47, 397–409. doi: 10.1007/s10464-010-9392-z
Fuhse, J (2018). "Soziale Netzwerke. Konzepte und Forschungsmethoden." 2., überarbeitete Auflage. Konstanz, München: UVK Verlagsgesellschaft mbH; UVK/Lucius (UTB Sozialwissenschaften, 4563). Available at http://www.blickinsbuch.de/item/5e5aaa998e5cd8cc3bdd31c1e69cad6a (Accessed November 11, 2022).
Gephi (2022). "Gephi—The Open Graph Viz Platform." Available at: https://gephi.org/ (Accessed October 30, 2022).
Hauck, J (2012). "Between Intuition and Indicators—Using Net-Map for Visual and Qualitative Social Network Analysis ”. doi: 10.14361/transcript.9783839419274.231
Heuser, A, Pohl, C, Urhahn, J, and Buron, S (2017). "Unser Essen Mitgestalten. Ein Handbuch zum Ernährungsrat." Berlin: INKOTA-netzwerk e.V.
IPBES (2019). "Global assessment report on biodiversity and ecosystem services of the Intergovernmental Science-Policy Platform on Biodiversity and Ecosystem Services (Version 1)." Zenodo.
Jacomy, M., Venturini, T., Heymann, S., and Bastian, M. (2014). ForceAtlas2, a continuous graph layout algorithm for handy network visualization designed for the Gephi software. PLoS One 9:e98679. doi: 10.1371/journal.pone.0098679
Kropp, C, and Da Ros, C (2021): "Alternative Food Politics." (eds.) I Antoni-Komar and C Cropp, Sage, C . doi: 10.4324/9781003131304-4.
Kuckartz, U. (2014). Mixed Methods. Methodologie, Forschungsdesigns und Analyseverfahren Wiesbaden: Springer Fachmedien Wiesbaden.
Küsters, I (2009). "Narrative Interviews: Grundlagen und Anwendungen " 2. Aufl. Wiesbaden: VS, Verlag für Sozialwissenschaften (Lehrbuch)
Lelong, B (2015). "Durchsetzungsprozesse in der Stadtentwicklungspolitik." Wiesbaden: Springer Fachmedien Wiesbaden
Lelong, B, Stark, M, Hauck, J, Leuenberger, T, and Thronicker, I (2016). "A visual network perspective on social interaction and space: using net-map and wennmaker in participatory social-spatial research." Europa Regional 23.2015, pp. 5–19. Available at https://nbn-resolving.org/urn:nbn:de:0168-ssoar-51684-3 (Accessed October 15, 2022).
Levkoe, C. Z., Schiff, R., Arnold, K., Wilkinson, A., and Kerk, K. (2021). Mapping food policy groups: understanding cross-sectoral network building through social network analysis. Canad. Food Stud. Rev. 8, 48–79. doi: 10.15353/cfs-rcea.v8i2.443
Li, Y., Si, Z., Miao, Y., and Zhou, L. (2022). How does the concept of Guanxi-circle contribute to community building in alternative food networks? Six case studies from China. Behav. Sci. 12:432. doi: 10.3390/bs12110432
Lohest, F., Bauler, T., Sureau, S., van Mol, J., and Achten, W. M. J. (2019). Linking food democracy and sustainability on the ground: learnings from the study of three alternative food networks in Brussels. Politics Govern. 7, 21–31. doi: 10.17645/pag.v7i4.2023
Mastronardi, L., Marino, D., Giaccio, V., Giannelli, A., Palmieri, M., and Mazzocchi, G. (2019). Analyzing alternative food networks sustainability in Italy: a proposal for an assessment framework. Agric. Econ. 7:21. doi: 10.1186/s40100-019-0142-8
Michel, S., Wiek, A., Bloemertz, L., Bornemann, B., Granchamp, L., Villet, C., et al. (2022). Opportunities and challenges of food policy councils in pursuit of food system sustainability and food democracy–a comparative case study from the upper-Rhine region. Front. Sustain. Food Syst 6:916178. doi: 10.3389/fsufs.2022.916178
Milan Urban Food Policy Pact (ed.) (2021). "Milan Urban Food Policy Pact." Available at https://www.milanurbanfoodpolicypact.org/, updated on 7/19/2021 (Accessed November 30, 2022).
Morgan, K. (2015). Nourishing the city: the rise of the urban food question in the global north. Urban Stud. 52, 1379–1394. doi: 10.1177/0042098014534902
Mural (ed.) (2022). "Work better. Work anywhere." Available at: https://www.mural.co/ (Accessed October 1, 2023).
Reed, M., Graves, A. R., Dandy, N., Posthumus, H., Klaus, H., Morris, J., et al. (2009). Whos In and Why? a typology of stakeholder analysis methods for natural resource management. Journal of Environmental Management. 90. 1933–49. doi: 10.1016/j.jenvman.2009.01.001
RUAF (2017). City region food systems. Waht and why. Available at: https://ruaf.org/document/city-region-food-systems-what-and-why/
Sattler, C., Rommel, J., Chen, C., García-Llorente, M., Gutiérrez-Briceño, I., Prager, K., et al. (2022). Participatory research in times of COVID-19 and beyond: adjusting your methodological toolkits. One Earth 5, 62–73. doi: 10.1016/j.oneear.2021.12.006
Säumel, I., Reddy, S., Wachtel, T., Schlecht, M., and Ramos-Jiliberto, R. (2022). How to feed the cities? Co-creating inclusive, healthy and sustainable city region food systems. Front. Sustain. Food Syst. 6:909899. doi: 10.3389/fsufs.2022.909899
Schanz, H, Pregering, M, and Kruse, S (2020). "Warum sollten sich Kommunen mit dem Thema Ernährungsräte beschäftigen? Umfassende Nachhaltigkeits- und Stadtentwicklung." DStGB Dokumentation (153), 8–9. Available at: https://www.dstgb.de/aktuelles/archiv/archiv-2020/Kommunen%20gestalten%20Ern%C3%A4hrung/Doku_153_FINAL_Web.pdf?cid=5yr (Accessed March 8, 2022).
Schiffer, E. (2007). "Net-Map toolbox: Influence Mapping of Social Networks." Available at: https://netmap.files.wordpress.com/2008/04/netmap_manual.pdf
Schiffer, E., and Hauck, J. (2010). Net-map: collecting social network data and facilitating network learning through participatory influence network mapping. Field Methods 22, 231–249. doi: 10.1177/1525822X10374798
Schmied, D. (2018). Nahrungsgeographie. Druck A1. Braunschweig: Westermann (Das geographische Seminar). Online available at: https://elibrary.utb.de/doi/book/10.5555/9783141603866.
Schröter, B (2022a). "Workshop 2: Einführung in die Net-Map-Methode." Workshop zur Net-Map-Methode. Zoom (online). Accessed September 9, 2022.
Schröter, B (2022b). "Workshop 2: Einführung in die Visualisierungstechniken." Workshop zur Net-Map-Methode. Zoom (online). Accessed October 10, 2022.
Schönhuth, M., Gamper, M., Kronenwett, M., and Stark, M. (2013). Visuelle Netzwerkforschung: Qualitative, quantitative und partizipative Zugänge, Bielefeld: transcript Verlag. doi: 10.1515/transcript.9783839422571
Schröter, B., Sattler, C., Graef, F., Chen, C., Delgadillo, E., Hackenberg, I., et al. (2018). Strengths and weaknesses of the Net-Map tool for participatory social network analysis in resource management: experience from case studies conducted on four continents, in Methodological Innovations 11, 205979911878775. doi: 10.1177/2059799118787754
Sipple, D., and Schanz, H. (2019). “Nachhaltige Stadtentwicklungüber kommunale Ernährungssysteme: Marktakteursnetzwerke als Ansatzpunkte zur Gestaltung und Steuerung” Zeitschrift für Wirtschaftsgeographie, 63, 1–22.
Steinbrink, M., Zigmann, F., Ehebrecht, D., Westholt, F., Schmidt, Jan-B., Stockmann, A., et al. (2012). Netzwerk(analys)e in der deutschen Humangeographie Berichte zur deutschen Landeskunde 86, 309–358.
Sonnino, R., and Marsden, T. (2006). Beyond the divide: rethinking relationships between alternative and conventional food networks in Europe. Journal of Economic Geography, 6, 181–199, doi: 10.1093/jeg/lbi006
Trivette, S. (2019). The importance of food retailers: applying network analysis techniques to the study of local food systems. Agric. Hum. Values 36, 77–90. doi: 10.1007/s10460-018-9885-1
Tucci, G (2020). “From the global food system to the local dimension: the urban food strategies”. (eds.) J. Schröder, E. Sommariva, and S. Sposito. Hannover: Gottfried Wilhelm Leibniz Universität Hannover
UBA—Umweltbundesamt (2019). “Transformation des Ernährungssystems: Grundlagen und Perspektiven”. Texte 84/2019, Dessau-Roßlau: Umweltbundesamt. Available at: https://www.umweltbundesamt.de/publikationen/transformation-des-ernaehrungssystems-grundlagen
Keywords: city region food system, Net-map tool, social network analysis, food system, food network
Citation: Leimkühler M, Specht K, Schröter B, Wissmann A, Iodice C, Fox-Kämper R, Steines A-K, Monticone F, Samoggia A, Modarelli GC, Reynaud-Desmet L, Curtis A, Righini I, D’Ostuni M, Ramón J, Amghar S and Pascual-Fernández JJ (2024) Using the Net-Map tool to analyze stakeholder networks in the city region food systems of seven European cities. Front. Sustain. Food Syst. 8:1315399. doi: 10.3389/fsufs.2024.1315399
Edited by:
Tapan Kumar Nath, University of Nottingham Malaysia Campus, MalaysiaReviewed by:
Shalander Kumar, International Crops Research Institute for the Semi-Arid Tropics (ICRISAT), IndiaMario Chong, University of the Pacific (Peru), Peru
Copyright © 2024 Leimkühler, Specht, Schröter, Wissmann, Iodice, Fox-Kämper, Steines, Monticone, Samoggia, Modarelli, Reynaud-Desmet, Curtis, Righini, D’Ostuni, Ramón, Amghar and Pascual-Fernández. This is an open-access article distributed under the terms of the Creative Commons Attribution License (CC BY). The use, distribution or reproduction in other forums is permitted, provided the original author(s) and the copyright owner(s) are credited and that the original publication in this journal is cited, in accordance with accepted academic practice. No use, distribution or reproduction is permitted which does not comply with these terms.
*Correspondence: Melissa Leimkühler, melissa.leimkuehler@ils-forschung.de; Barbara Schröter, barbara.schroeter@zalf.de