Localized nitrogen supply facilitates rice yield and nitrogen use efficiency by enabling root-zone nitrogen distribution and root growth
 Ren Hu
 Zijuan Ding1
  Jun Hou
 Xuexia Wang
- 1College of Agriculture, Yangtze University, Engineering Research Center of Ecology and Agricultural Use of Wet Land, Ministry of Education, Jingzhou, China
- 2College of Life Science, Yangtze University, Jingzhou, China
- 3Institute of Plant Nutrition, Resources and Environment, Beijing Agricultural Forestry Academy Sciences, Beijing, China
Introduction: Localized nitrogen (N) supply affects rice N uptake by influencing N release, and few studies have examined the effects of root zone N distribution and root growth on rice yield under localized N supply (LNS).
Methods: A two-year field experiment was conducted with six treatments: no N application, farmers’ fertilizer practice (FFP), and four LNS treatments, including two types of N fertilizer with urea (U) and controlled release urea (CRU) were mechanically side deep fertilized (SDF) or root zone fertilized (RZF) at 10 cm soil depth (US, UR, CRUS and CRUR treatments, respectively).
Results: Compared with FFP, the dry matter accumulation, N uptake, and yield of LNS increased by 27%, 21%, and 17%, respectively. For N fertilizer type, compared with U, the NH4+-N concentration, total root surface area, volume, average diameter, and root biomass of CRU were significantly increased by 50%, 43%, 53%, and 23%, respectively, which resulted in a significant increase in yield by 12%. Regarding the N application methods, the total surface area, volume, average diameter, and root biomass of SDF were significantly increased by 32%, 24%, 10%, and 25% compared with RZF, respectively. However, the NH4+-N under RZF was more stable and lasted longer, with a significant increase in NH4+-N concentration of 21% compared to the SDF. Moreover, CRUR increased yield, N agronomic use efficiency, and gross return by 3.15%, 5.62%, and 2.81%, respectively, compared to CRUS.
Conclusion: CRU should be selected as the recommended N fertilizer types, and the combination of CRU and RZF was the most effective choice for rice production.
1 Introduction
Rice (Oryza sativa L.) is the dominant staple food for more than 50% of the world’s population (Yuan et al., 2021). China produces 28% of the global rice supply and still needs to further increase its rice production to close the gap with the target yield (Deng et al., 2019). Chemical fertilizers, especially N fertilizers, have been extensively applied in paddy fields to maintain high rice yields (Zhuang et al., 2022). Excessive N fertilizer inputs with lower N use efficiency (NUE) lead to environmental pollution such as air pollution (Menegat et al., 2022), water eutrophication (Wang et al., 2021), and soil degradation (Jin et al., 2021), thus increasing yields and NUE while reducing environmental pollution has become one of the primary objectives of modern agriculture (Waqas et al., 2023). Extensive studies have been conducted to assess the effects of different fertilization methods on NUE and yield. Localized N supply (LNS) is a method of placing N fertilizer near the root system that allows the localized release of N fertilizer, which increases N uptake by the crop and mainly consists of band or hole applications. Compared to broadcast or mixed, LNS can increase grain yield and NUE (Zhu et al., 2019; Chen et al., 2023).
Mechanical side deep fertilization (SDF) and root zone fertilization (RZF), as two primary fertilization methods for LNS, have received widespread attention in recent decades for their effectiveness in reducing greenhouse gas emissions and achieving increased rice yields (Li et al., 2022). Some studies believe that this is because fertilizer can be delivered precisely to the rice root zone under SDF and RZF, and the concentration of ammonium N (NH4+-N) in the root zone increases, while rice is an ammonia-loving crop, so it promotes N uptake by rice root and increases the aboveground biomass of rice, thus obtaining high yields (Zhu et al., 2019; Ding et al., 2022). However, it has also been suggested that the increase in rice yield under SDF and RZF is due to the root system. The root system plays a crucial role in obtaining water and nutrients. Root development and trait distribution strongly influence rice’s nutrient uptake and growth (Ma et al., 2021). Moreover, Cheng et al. (2020) reported that higher N supply can improve the spatial structure of the root system and thus promote plant growth (Cheng et al., 2020). Thus, for SDF and RZF, does the concentration of NH4+-N affect the growth of rice or roots more? Alternatively, both work together to affect rice growth, which needs further exploration.
Although SDF and RZF are preferable for one-time applications, there is a lack of exploration of corresponding complementary N fertilizer products and mechanisms. Urea (U) and controlled release urea (CRU) are the two main types of N fertilizers being promoted for application in the market today and play a vital role in sustaining rice production (Yang et al., 2021). For U, due to its rapid release of nutrients, a single local application can expose the rice root system to the risk of poisoning and affect rice growth. Hu et al. (2022) showed that applying CRU near the rice root system does not harm the root system but rather is more favorable to root growth (Hu et al., 2022). Moreover, CRU has been reported to promote photosynthesis by increasing the effective N in the soil and seedlings. In addition, a single application of CRU can meet the N requirements of rice throughout the growth stage (Ding et al., 2022). A key question is whether CRU improves N distribution and root growth to promote yield compared with U. It is critical to explore the combination of agricultural machinery and agronomy.
This study examined two types of N fertilizer (U and CRU) and two N application methods (SDF and RZF) with 2-year field experiments to investigate the mechanism of rice yield and NUE. The aims were the following: (1) to compare the effects of different types of N fertilizers on rice N supply and root growth on rice yield and NUE under LNS; (2) to analyze the mechanism of yield increase from N supply and root growth under SDF and RZF; and (3) to provide both theoretical and data support for simplified fertilization and nutrient management by choosing a suitable type of N under LNS.
2 Materials and methods
2.1 Experiment site
A 2-year field experiment was conducted in the Meteorological Bureau of Jingzhou City, Hubei Province, China. The experimental site was located at the Jianghan Plain (N 29° 26′-31° 37′, E 111° 14′-114° 36′). The study site is in a subtropical humid monsoon climate zone. Weather data were obtained from the Jingzhou Weather Bureau. In 2020/2021, the average temperature and total precipitation in the rice season were 23.2/23.8°C and 2,130/1,385 mm, respectively (Figure 1). The region has planted rice for years, and the soil is classified as a silty medium loam, which developed from the deposition of islands and lacustrine. The initial soil test results for the site were pH 7.90, soil bulk density 1.40 g/cm3 in the 0–20 cm soil layer, organic carbon 26.88 g/kg, total N 1.09 g/kg, Olsen-P 9.4 mg/kg, and available K 56.30 mg/kg. Soil total N, Olsen-P, and available K content were measured using Kjeldahl, Mo-Sb colorimetric, and flame photometer methods, respectively (Qin et al., 2015). Soil organic matter was determined by the wet combustion method.
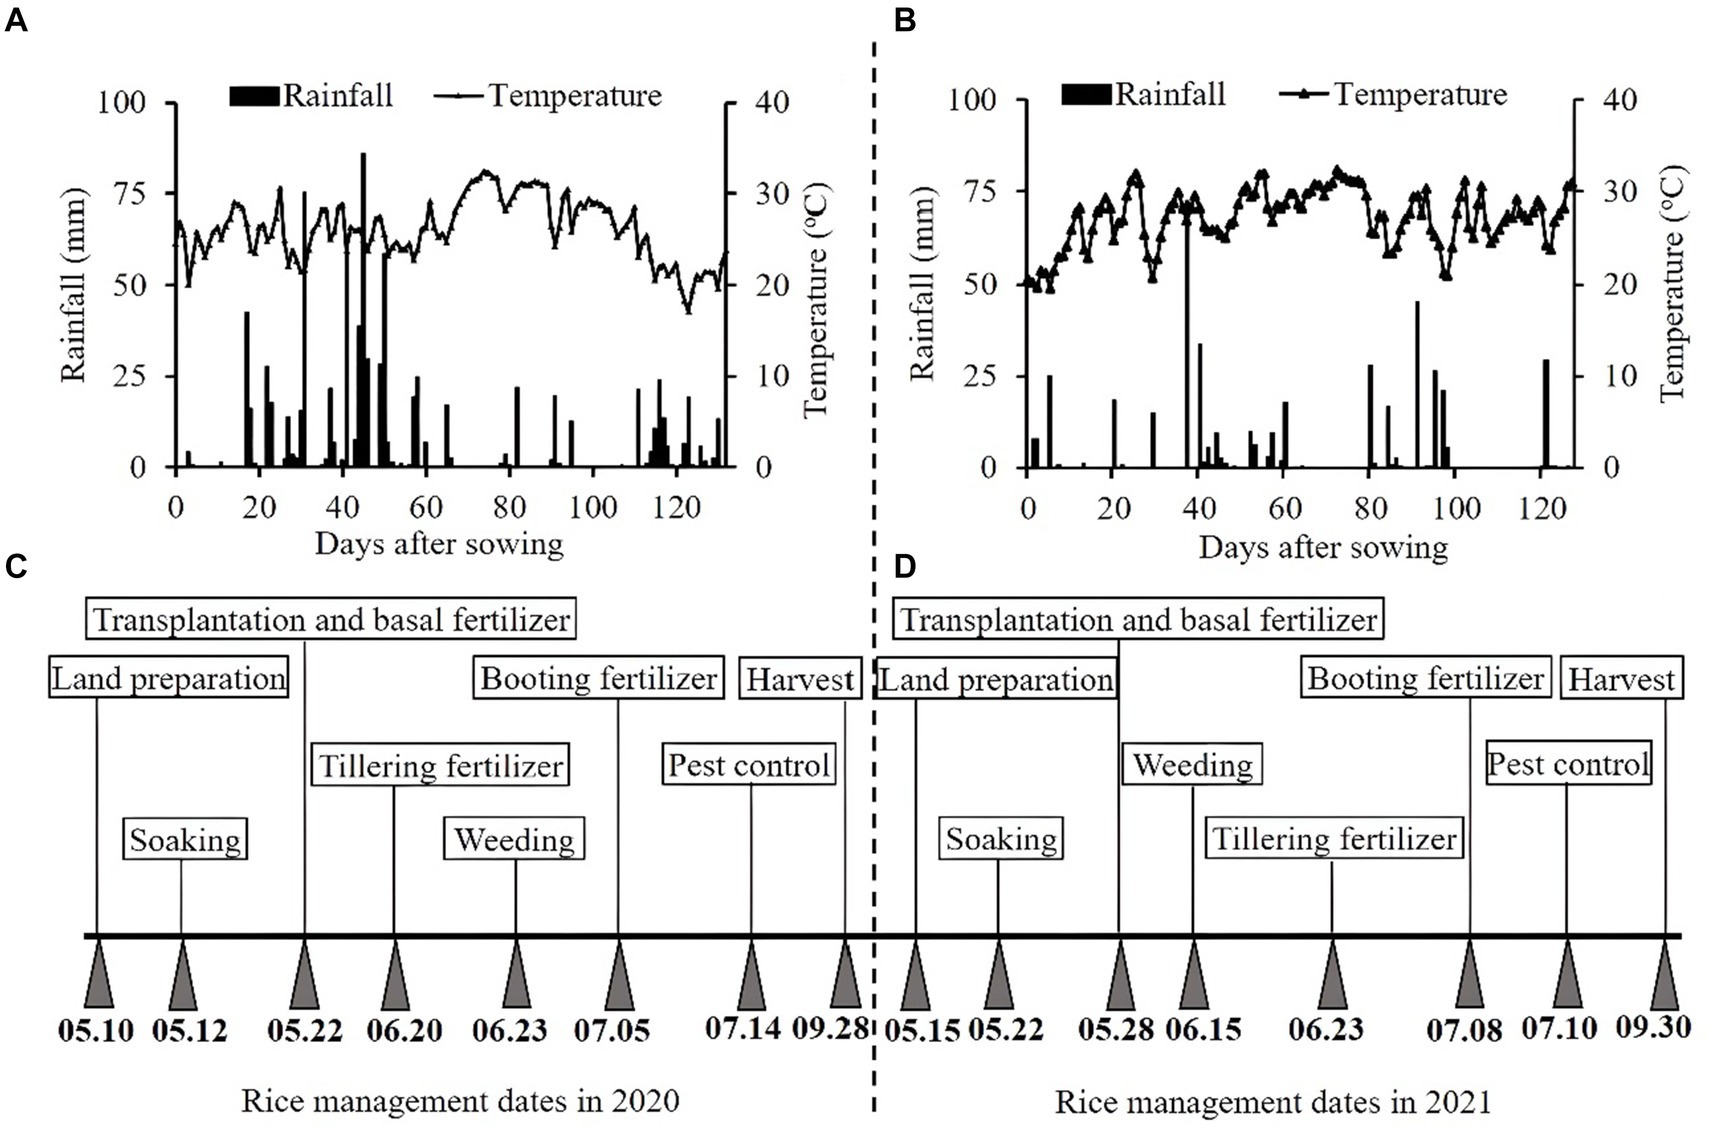
Figure 1. The rainfall, average temperatures, and rice management dates. (A,B) Represent rainfall and average temperatures in 2020 and 2021, respectively. (C,D) Represent rice management dates in 2020 and 2021, respectively.
2.2 Experimental material
YangLiangYou No.6, a widely grown rice cultivar., was transplanted in late May and harvested in September 2020 and 2021. Two types of N fertilizer that were utilized included U (46% N) and CRU (43% N), and CRU had a release longevity of 120 days (d), which was manufactured by the National Engineering Technology Research Center for CRF (Shandong, China) (Supplementary Figure S1).
2.3 Experimental treatments
The field plot experiment was conducted with six treatments: (i) CK: a control test without N fertilizer; (ii) FFP: farmers’ fertilizer practice, U was applied three times, 50% as basal fertilizer, 30% as tillering fertilizer, and 20% as booting fertilizer. After the basal fertilizer is applied, the soil is covered and buried, and the tillering fertilizer and booting fertilizer are spread on the surface of the soil; (iii) US: U was applied by SDF; (iv) UR: U was applied by RZF; (v) CRUS: CRU was applied by SDF; and (vi) CRUR: CRU applied by RZF. A map of SDF and RZF is shown in Figure 2. For SDF, a wooden stick was used to cut a 10-cm deep trench, which is 5 cm from the rice root, and then U and CRU were scattered evenly inside the trench, respectively, and finally covered with soil immediately. For RZF, a hollow pipe with an inner diameter of 2 cm was used 5 cm from the root side, and after being pressed vertically into the soil for 10 cm. U and CRU along the inner wall into the bottom of the pipe. The pipe was immediately removed, and the hole was full of mud to cover the applied U and CRU. Fertilizer is applied on the same side of the rice row, and the distance between the two application points is equal to the row spacing (18 cm). The U and CRU were applied deeply as a basal fertilizer at one time after transplanting (1.76 g/hill for US and UR and 1.88 g/hill for CRUS and CRUR).
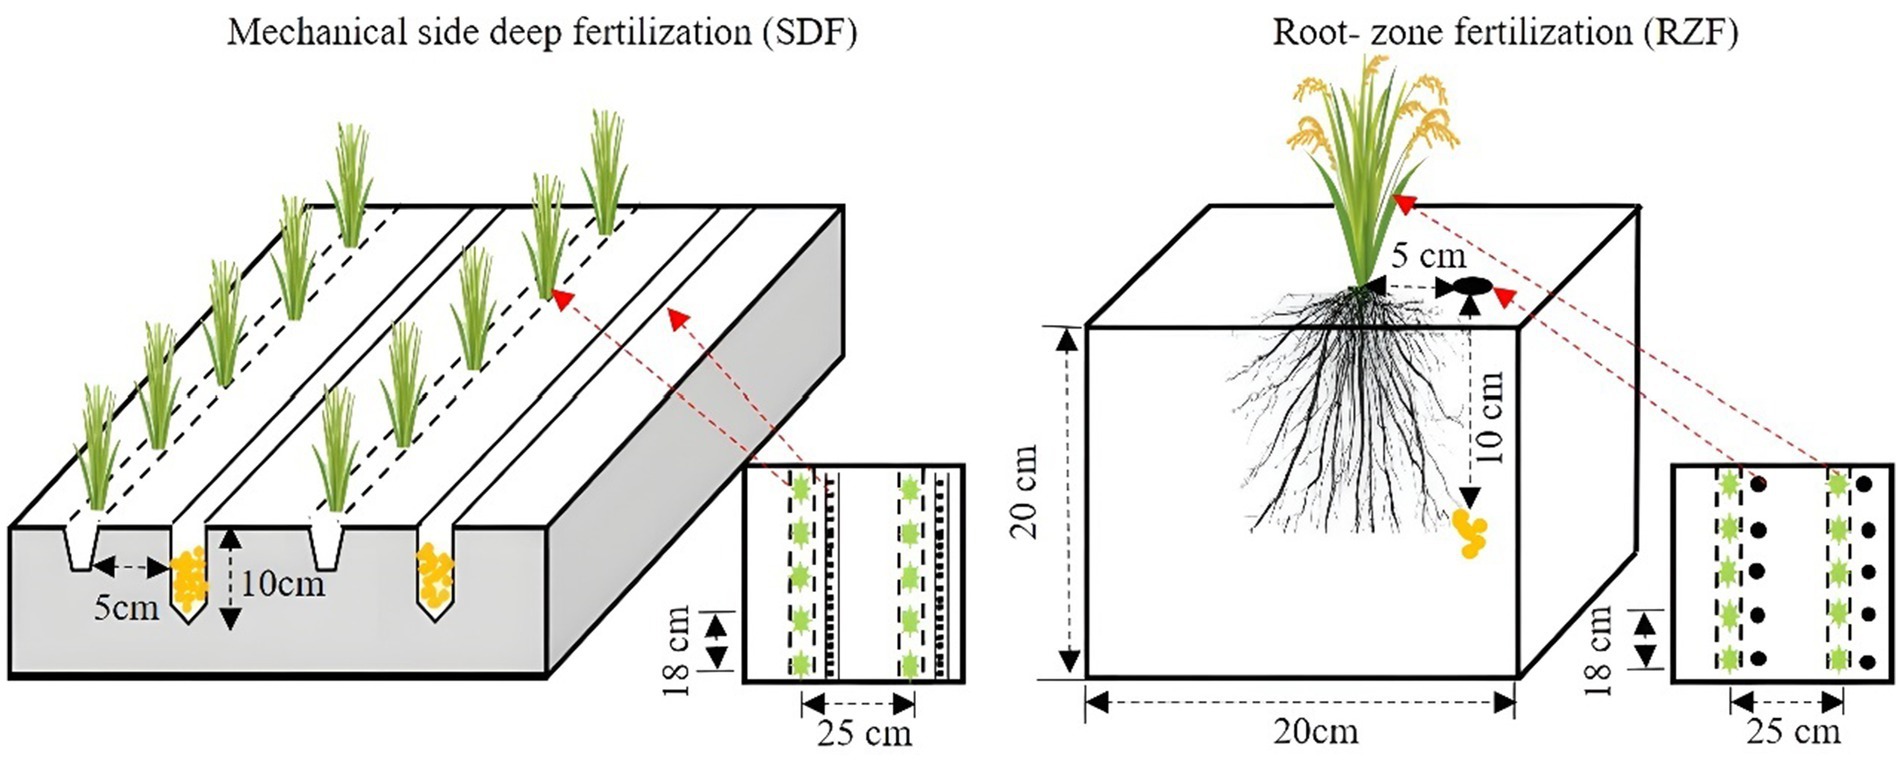
Figure 2. The sketch map of SDF and RZF.
The six treatments were randomly arranged, and each was replicated three times. The plot dimensions were 5 m × 5 m, and each plot was separated by a 30 cm-wide earth bank covered with plastic film to prevent the lateral flow of water and nutrients. The LNS treatment plot (US, UR, CRUS, and CRUR) was divided into three plots, one of which was used to calculate N uptake and yield at the harvest stage without any disturbance, and the remaining two were used for destructive sampling to study N diffusion and root growth experiments, respectively. PVC plastic frames were placed in 20 cm deep soil and protruded 10 cm from the soil surface to prevent N fertilizer removal or addition due to runoff or water runoff. Water pipes were placed in the frames to ensure synchronization of irrigation.
The N rate was 180 kg/ha for all the treatments except the CK. The amounts of phosphorus (P2O5) and potassium fertilizer (K2O) were established for each treatment, and the rates were 90 kg/ha and 120 kg/ha, respectively. Superphosphate (5.24% P) was used as phosphorus fertilizer, and potassium chloride (49.59% K) was used as potassium fertilizer. All phosphorus and potassium fertilizers were applied at one time, and the field was then irrigated with a small amount of water to mix the soil and fertilizer before transplanting. The transplanting density was 25 cm × 18 cm for each plot, with 3–5 seedlings in each hole. The field water depth of all plots was maintained between 10 and 80 mm until it was drained approximately 10 d before harvest. All irrigation events were coordinated with precipitation events, and the same irrigation pattern was utilized in 2020 and 2021. Applications of pesticides and herbicides in all the treatments were consistent with the management of local farmers.
2.3.1 Monitoring of ammonium N (NH4+-N) and nitrate N (NO3−-N) diffusion dynamics under LNS
Fresh soil samples were collected from the US, UR, CRUS, and CRUR plots at 30, 60, and 90 d after transplanting in 2020 and 2021. The water was drained before sampling. Four fresh soil samples were then collected in four directions (up, down, left, and right) of the U and CRU placement positions at an interval of 3 cm with a soil sampler that was 3 cm in diameter (Yao et al., 2017). For the CK and FFP, three soil samples were collected from a 0–20 cm soil depth and thoroughly mixed to calculate the NH4+-N and NO3−-N concentrations. The soil samples that had been collected were extracted with two mol/L KCl solution (50 mL) to extract the mineral N using 5 g of field moist soil. The soil mixture was then shaken at 200 rpm for 1 h in an oscillating incubator and filtered with filter paper (Yao et al., 2017). AUV spectrophotometer (UV-5300PC, Shanghai Metash Instruments Co., Ltd., Shanghai, China) was used to measure the concentration of NH4+-N and NO3−-N.
2.3.2 Root sample collection and the measurement of root traits
Bottomless plastic buckets 20 cm long, comprehensive, and 30 cm high were buried in the US, UR, CRUS, and CRUR plots before the rice was transplanted. The roots were collected during different rice growth periods (60 d and 90 d after transplanting in 2020 and 30 d and 60 d after transplanting in 2021) by destructive sampling. The aboveground parts of rice were cut flush by digging the bucket out of the soil and keeping the roots as intact as possible when separating the root system from the soil in the bucket. The roots obtained were immediately rinsed with tap water, and then part of the roots was scanned at 300 dpi (Epson Perfection C700 Photo Scanner, Los Alamitos, CA, United States). After scanning, 0.5 g of root apices were sampled to test the root activity (RA) using triphenyl tetrazolium chloride (TTC). The rest of the unscanned roots continued to be scanned, then analyzed with WinRHIZO PRO 2009 software (Regent Instruments, Inc., Quebec, Canada) to obtain the morphological indices of rice root systems, total surface area (TRS), total root volume (TRV), and root average diameter (RAD). Finally, the roots were oven-dried at 105°C for 30 min to deactivate enzymes, and they were then dried to constant weight at 75°C and weighed.
2.3.3 Plant height and tiller number
A total of 15 representative hills of rice were selected in each plot to measure the plant height and tiller number per hill at the tillering, booting, and heading stages. The plant height was considered the distance between the soil surface and the top of the highest leaf within one hole. In addition, the main stem or mother tiller was counted as a tiller and included in the total tillers.
2.4 Sampling and analyses
2.4.1 Dry matter accumulation
Three hills of plants were sampled from each plot to calculate the dry matter accumulation at the tillering, booting, and maturity stages. First, the stems, leaves, and panicles were separated, and the fresh samples were dried at 105°C for 30 min to deactivate the enzymes and then dried at 75°C to constant weight, considering the dry matter accumulation. The weighed samples were milled and sieved to calculate their total N content using the Kjeldahl method.
The dry matter exportation from vegetative-organs (DME, t/ha) and transportation rate of dry matter from vegetative-organs (TRDV, %) was calculated using the following formulae (Liu et al., 2017):
Where DMH represents the amount of dry matter for vegetative organs at the heading stage, and DMM represents the amount for vegetative organs at the maturity stage.
2.4.2 N uptake and N use efficiency
The N uptake (kg/ha) was calculated using the following equation (Zhu et al., 2019):
Where TDM represents the total dry matter accumulation of panicles, leaves, and stems with leaf sheaths. NC represents the content of N in the panicles, leaves, and stems with leaf sheaths.
NUE: N recovery efficiency (NRE, %), N agronomic use efficiency (NAE, kg/kg), the N partial factor productivity (PFPN, kg/kg), N dry matter production efficiency (NDMPE, kg/kg), and N grain production efficiency (NGPE, kg/kg) were calculated using the following formulae (Zhu et al., 2019):
Where GY and GY0 represent the grain yield in the N application and CK plots, respectively, Nup and N0up represent the total N uptake of aboveground in the N application and CK plots, respectively. FN represents the total N application rate, and TBup and TNup represent the total dry matter accumulation of the aboveground and the uptake of N in the aboveground, respectively.
2.4.3 Yield and its components
Six hills of rice from each plot were collected to investigate the yield components at the maturity stage. Manual threshing separated each grain from the rachis and immersed in tap water to separate the filled grains. Floating grains were determined to be unfilled grains. All the spikelets of the panicle were taken off to weigh the total weight. Then 30 g of them were manually separated the filled and unfilled spikelets, and the filled and unfilled spikelets was to measured. Finally, the number of filled and unfilled spikelets from total weight wan calculated by the weight conversion, and the grain-filling percentage (100 × filled spikelets number/total spikelets number) can be calculated. The rice plants were harvested from each plot, and the moisture content of grain yield was adjusted to 14%.
2.4.4 Economic benefits
The gross return (GR, $/ha), gross margin (GM, $/ha), and benefit-to-cost ratio (BCR, %) were calculated as follows (Yang et al., 2020):
Where the average rice price was 0.42 $/kg in 2020 and 2021. The cost of cultivation was added by all the inputs, including urea (374.51, $/t), controlled release urea (494.35, $/t), superphosphate (179.76, $/t), potassium chloride (479.37, $/t), labor fertilization for FFP and LNS (17.98, 29.96, $/ha, respectively), and seedling (202.24, $/ha), all price was provided by local market.
2.5 Data analysis
Microsoft Excel 2010 (Microsoft, Redmond, WA, United States) was used for data processing.
The pairwise means among treatments were compared using the Tukey’s test at the 0.05 level of probability (SAS 9.3, SAS Institute Inc., Cary, NC, United States), and SPSS 26.0 (IBM, Inc., Armonk, NY, USA) was used for path coefficient of the indicators affecting yield. The NH4+-N and NO3−-N diffusion dynamics were described by Surfer 8.0 (Golden Software, Inc., Golden, CO, USA), and the graphs were drawn with Origin 8.5 (Origin Lab, Northampton, MA, USA).
3 Results
3.1 Analysis of variance of the concentration of NH4+-N, root traits, and yield
There were significant differences between different types of N fertilizer and N supply methods on the concentration of NH4+-N, root traits, yield, NRE, and GM in 2020 and 2021. The interaction of different types of N fertilizer and N supply methods significantly affects the concentration of NH4+-N (p < 0.01) (Table 1).
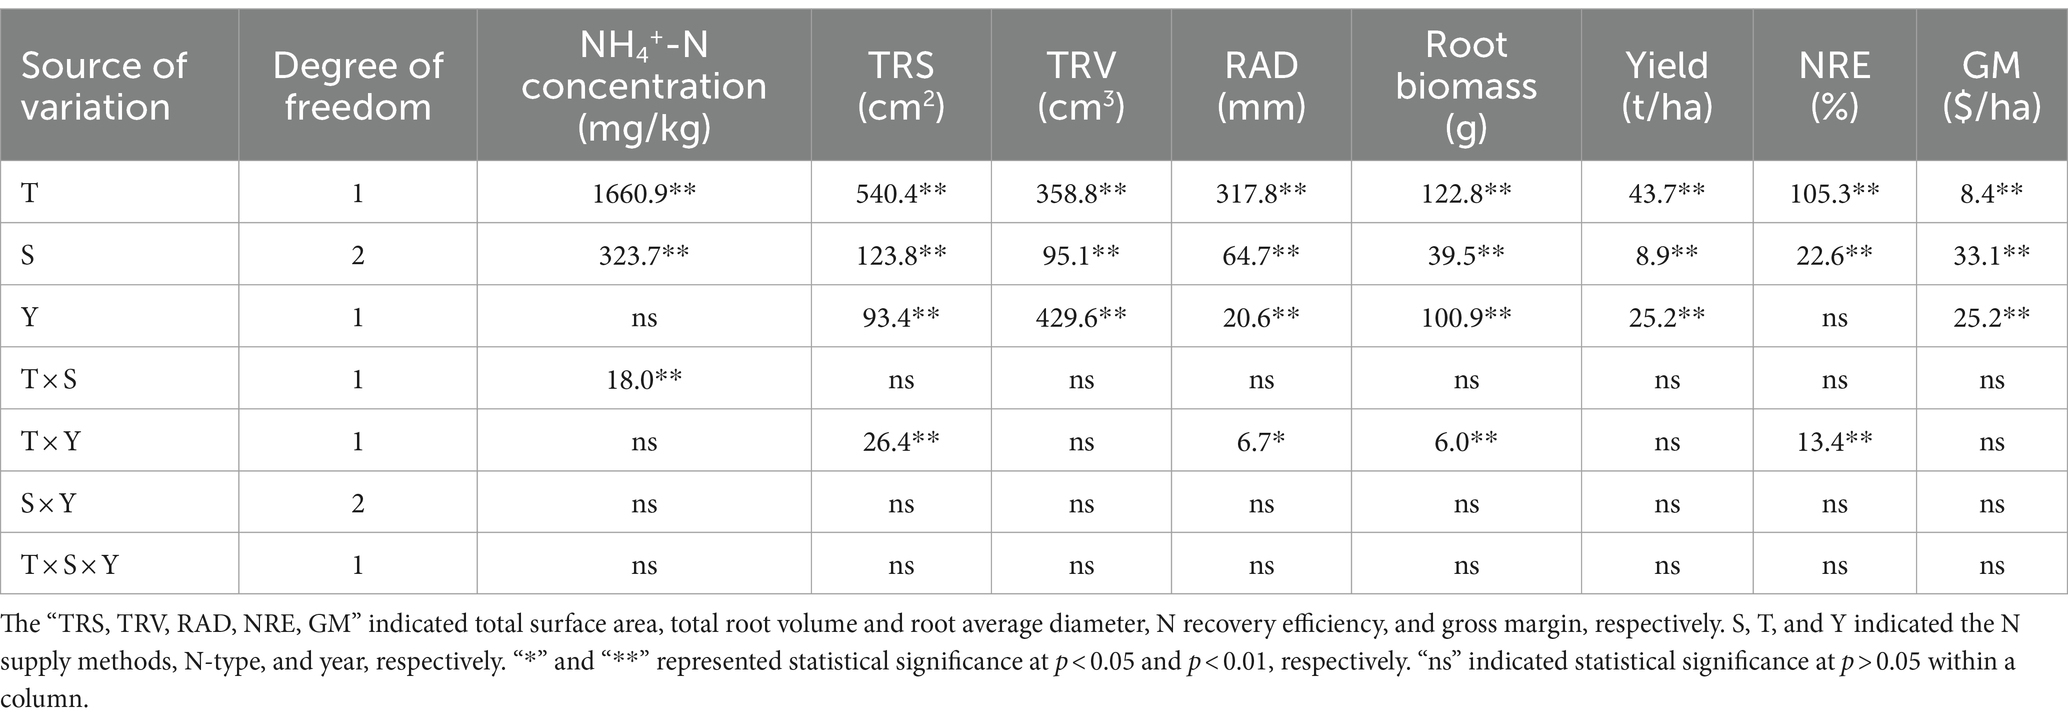
Table 1. Analysis of variance of NH4+-N concentration, root characteristic, and yield under different N fertilization treatments.
3.2 NH4+-N diffusion dynamics under LNS treatments
The movement of NH4+-N was slow under LNS, and it primarily occurred 4–13 cm below the soil surface. The N primarily moved downward from the placement site (Figures 3A,B). The distribution of NH4+-N diffusion was strip for US and CRUS and punctiform for UR and CRUR. CRUS and CRUR provided higher NH4+-N concentrations at different stages compared with US and UR, and the release of NH4+-N under CRUS and CRUR was relatively stable and lasted longer. The highest concentration of NH4+-N occurred at 9–12 cm around the placement site of CRUR, with 229.46 mg/kg for 30 d, 165.83 mg/kg for 60 d, 127.83 mg/kg for 90 d in 2020, and 258.41 mg/kg for 30 d, 217.89 mg/kg for 60 d, 145.31 mg/kg for 90 d in 2021. There were no significant differences in NO3−-N diffusion dynamics under LNS on different days in 2020 and 2021 (Figure S3).
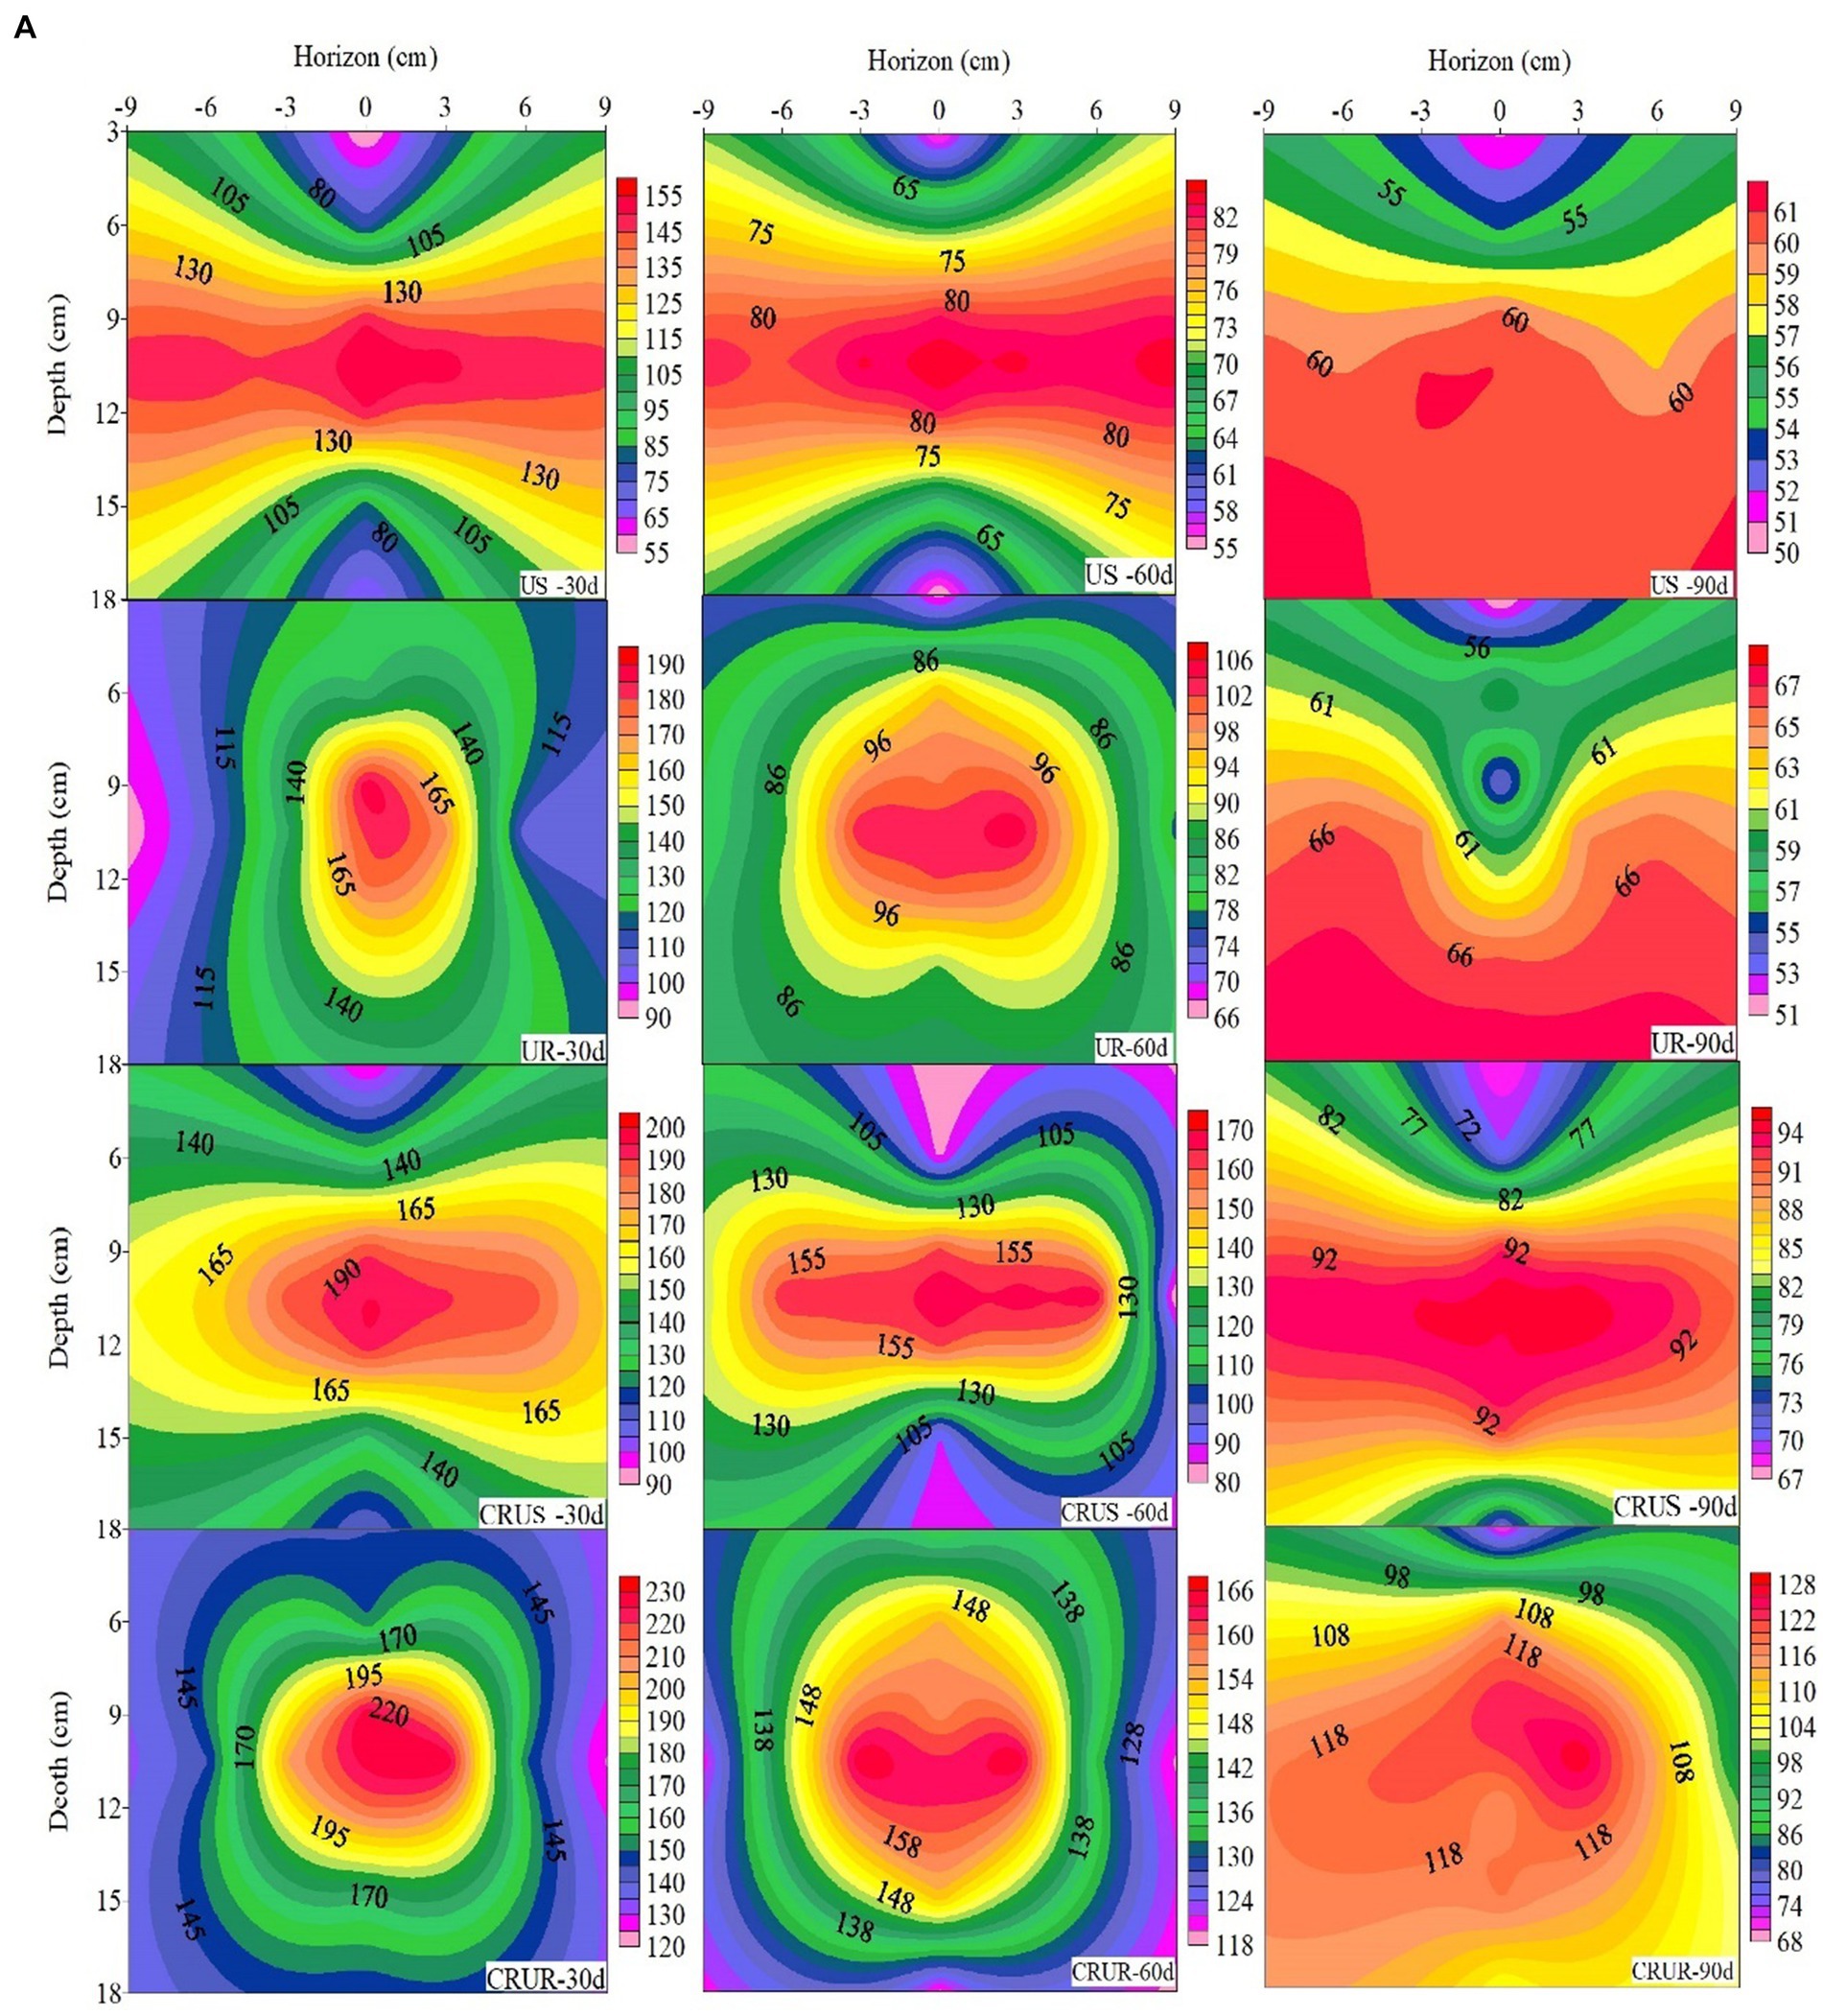
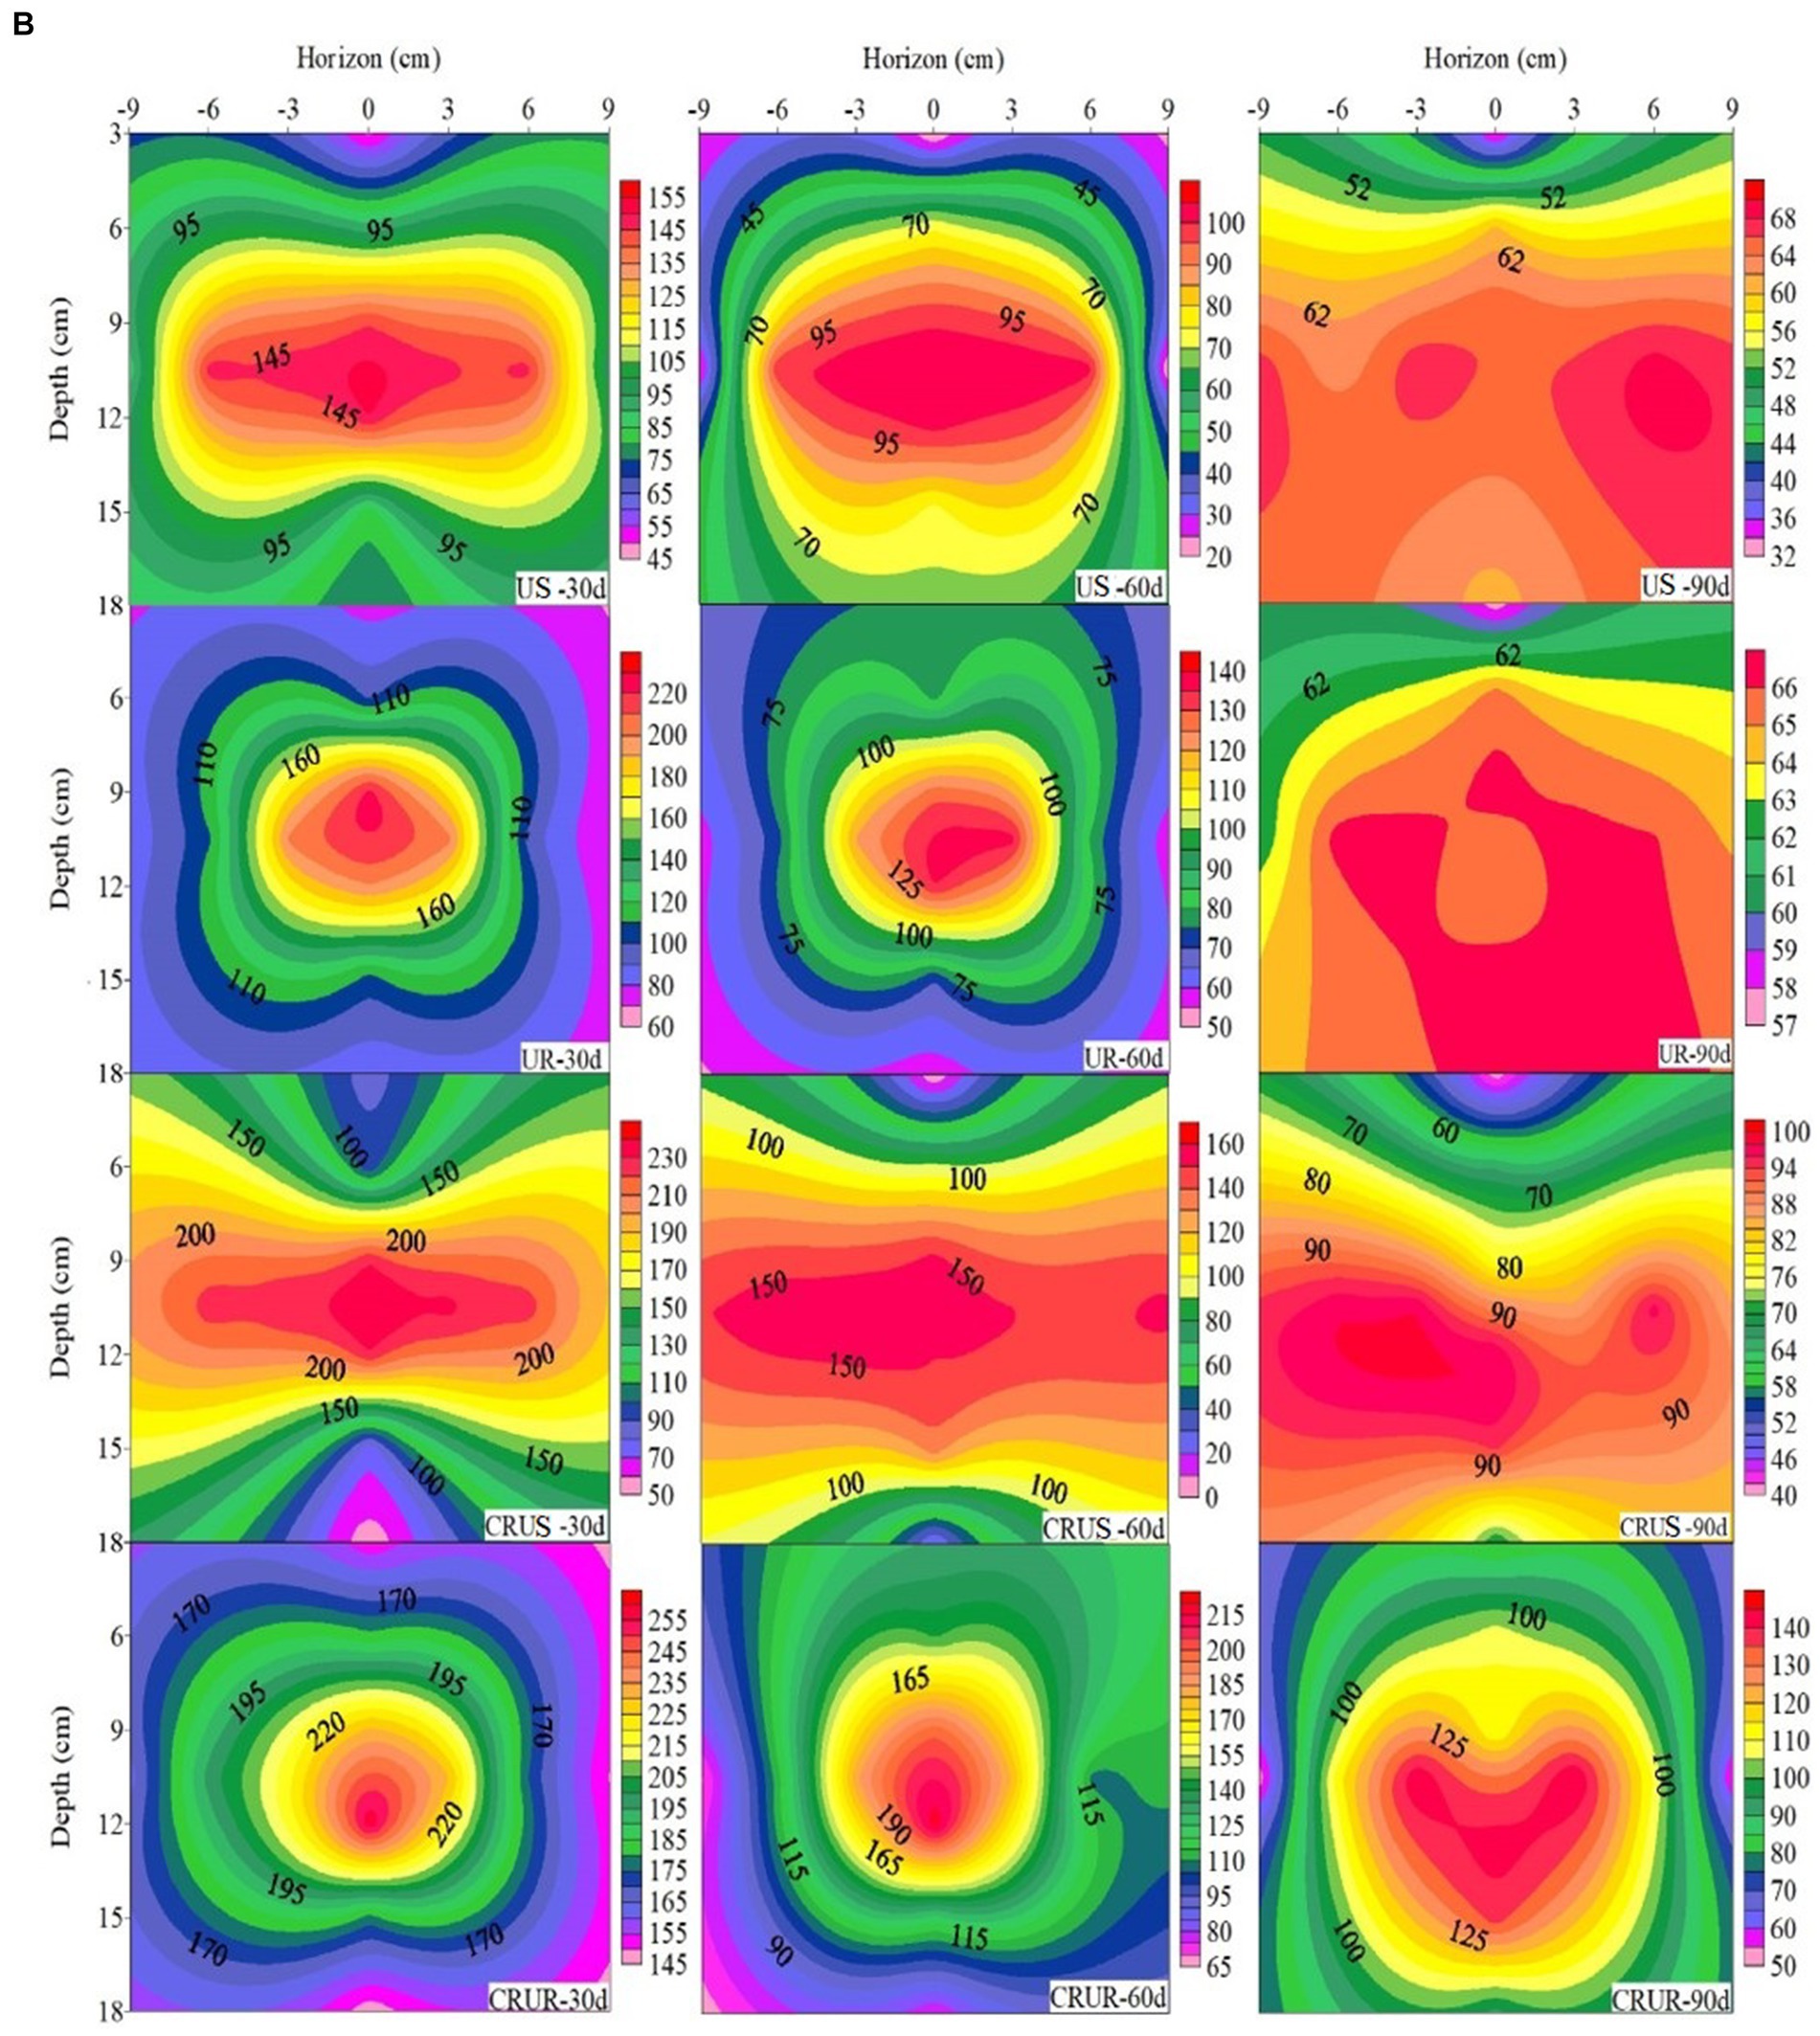
Figure 3. The NH4+-N diffusion dynamics of LNS in 2020 (A) and 2021 (B) rice season. NH4+-N concentration of the different soil layers at 30 d, 60 d, and 90 d after transplanting, respectively. For US and CRUS treatment, the U and CRU were applied once into a 10-cm deep ditch that were positioned 5 cm from the rice roots as basal fertilizer. For UR and CRUR treatment, the U and CRU were applied once into 10 cm deep holes positioned 5 cm from the rice roots as basal fertilizer.
3.3 NH4+-N and NO3−-N concentrations in soil
As shown in Figure 4A, the N application treatment significantly increased the concentration of NH4+-N by 33.01% ~ 203.86% compared with the CK (p < 0.05). Compared with FFP, the concentrations of NH4+-N under the LNS treatment at 30 and 60 d significantly increased by 59.60% ~ 148.27 and 26.11% ~ 140.48% on average of 2 years (p < 0.05), respectively, indicating that LNS was beneficial to increasing the concentration of NH4+-N in the soil at different periods. Under the LNS, the concentration of NH4+-N significantly increased by 48.14% (2020) and 47.65% (2021) under the CRU (p < 0.05), respectively, compared with the U. This indicated that the CRU is more favorable to promote the concentration of soil NH4+-N. When the same type of N fertilizer was applied, the concentration of NH4+-N significantly increased by 13.09% (2020) and 13.19% (2021) under RZF (p < 0.05), respectively, compared with SDF.
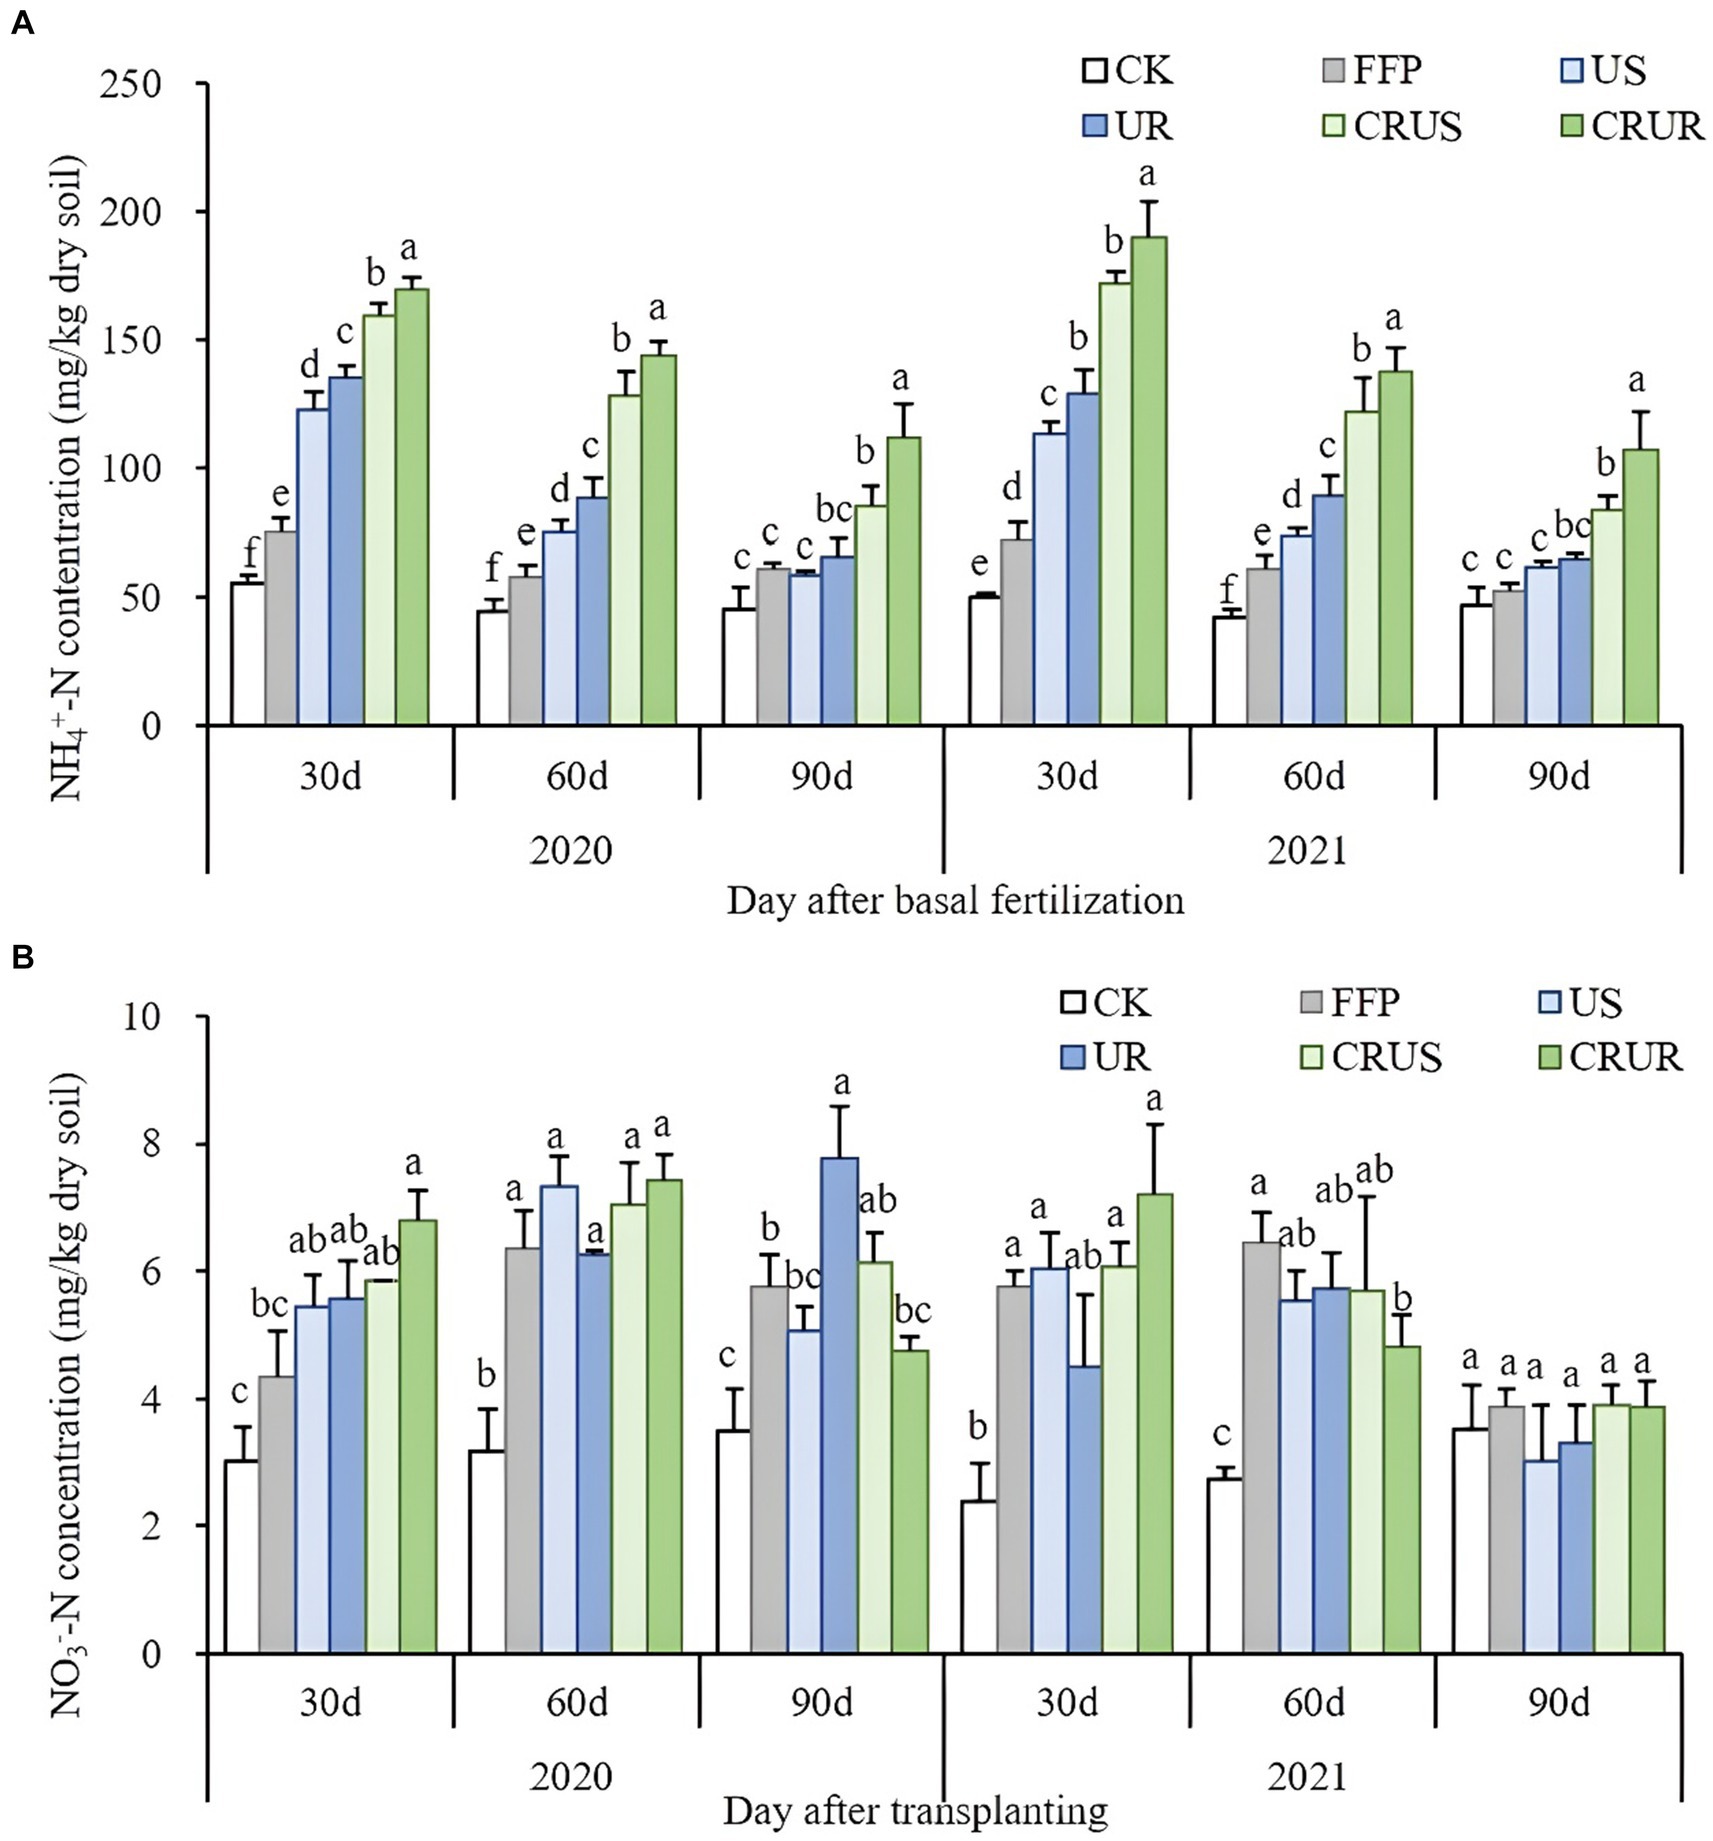
Figure 4. Different N fertilization treatments affect NH4+-N (A) and NO3−-N (B) concentration in soil. Values are means ± SD of three replicates. Different lowercase letters on bars indicate differences by the Tukey test at the 5% significance level; 30 d, 60 d, and 90 d indicate the days after transplanting.
The NO3−-N concentration was also significantly affected by the N application treatment at 30 d and 60 d (Figure 4B). The NO3−-N concentration of the FFP, US, UR, CRUS, and CRUR at 60 d significantly increased by 49.01% ~ 56.95% in 2020 and 43.15% ~ 57.43% in 2021 compared with that in the CK (p < 0.05). There were no significant differences in the concentration of NO3−-N between the N application treatments at 90 d in either year.
3.4 Root traits indices, biomass, root activity, and root/shoot ratio under LNS
The root trait indices under different N application treatments at LNS are shown in Figure 5. Significant differences were observed for TRS, TRV RAD, and root biomass, and compared with U, the TRS, TRV RAD, and root biomass of CRU significantly increased by 42.59, 52.68, 22.63, and 47.08% (p < 0.05), respectively. This indicated that CRU was beneficial to promote the growth of rice roots. In addition, when the same N fertilizer was applied, compared with RZF, the TRS, TRV RAD, and root biomass of SDF significantly increased by 22.08, 23.33, 22.63, and 24.45% (p < 0.05), respectively, which indicated that SDF was more conducive to construct good root morphology.
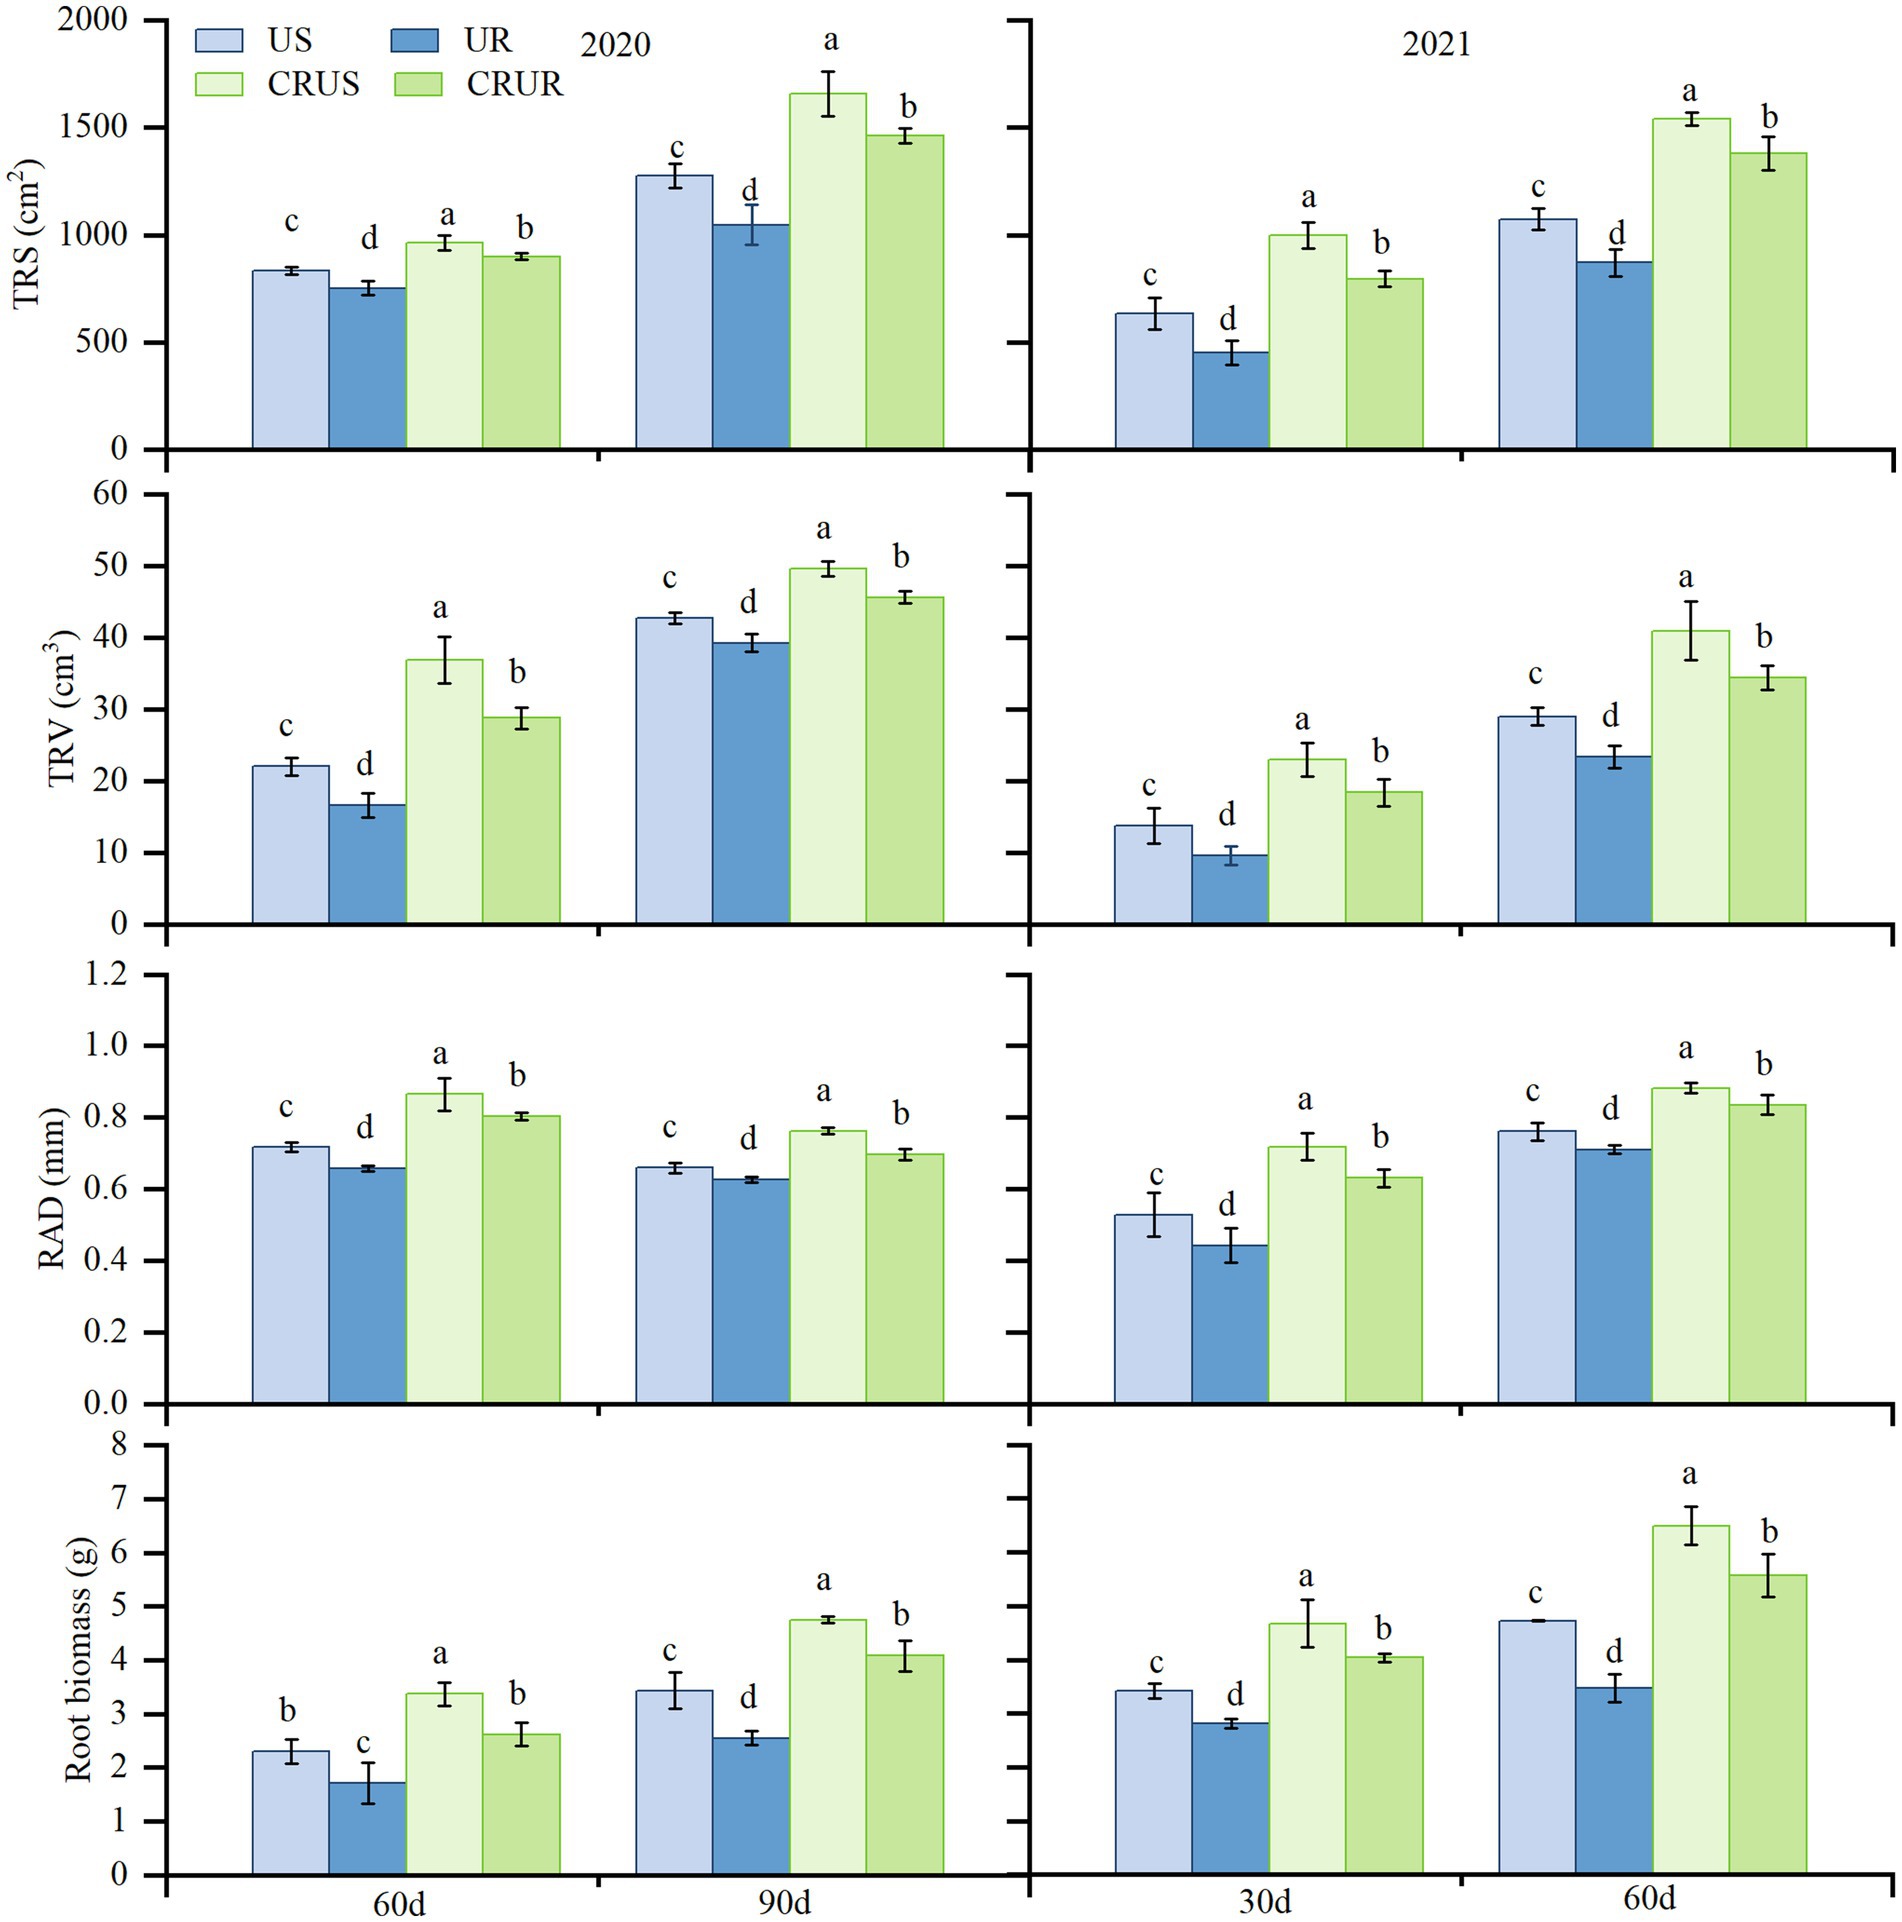
Figure 5. Different N fertilization treatments affect root trait indices and biomass at different stages in 2020 and 2021. TRS, TRV, and RAD indicated total surface area, total root volume, and root average diameter, respectively. Values are means ± SD of three replicates. Different lowercase letters on bars indicate differences by the Tukey test at the 5% significance level.
The RA and RSR are shown in Table 2. Compared with U at 30 d and 60 d, CRU increased RA by 35.87 and 34.61%, respectively, which indicated that CRU facilitates RA. For RSR, CRU was significantly higher than that of U. Moreover, the RSR under CRUS significantly increased by 28.06 and 22.63% at 60 d and 90 d in 2020, and by 33.33 and 20.00% at 30 d and 60 d in 2021, compared with CRUR, respectively (p < 0.05).
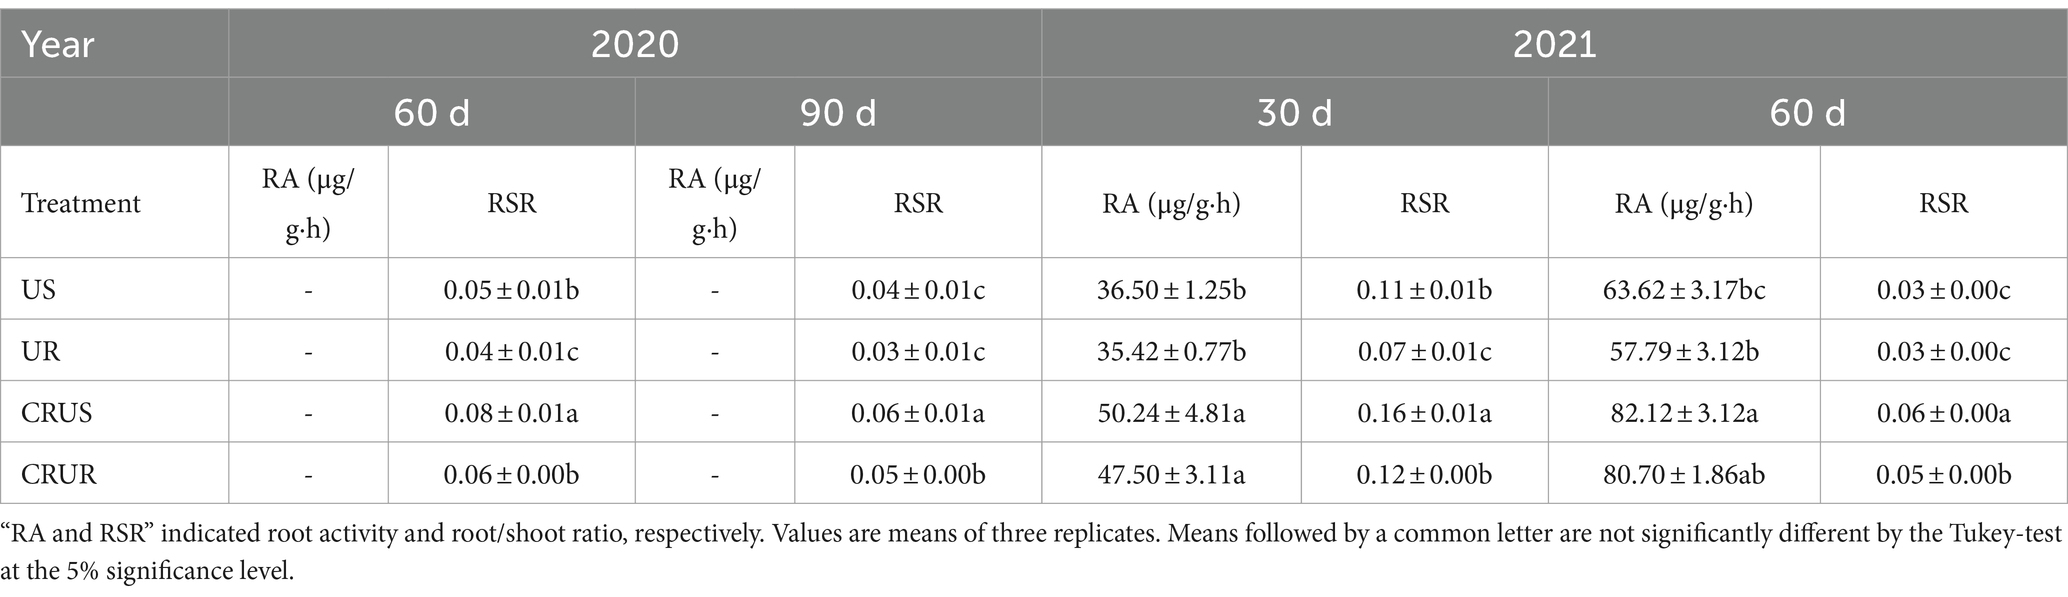
Table 2. Effects of different N fertilization treatments on RA and RSR of rice in 2021.
3.5 Plant height and tiller number
As shown in Figure 6A, the plant height of rice increases with time. Compared with the CK, the N application treatments (FFP, US, UR, CRUS, and CRUR) increased the plant height by 9.57% ~ 15.17% (2020) and 8.74% ~ 15.41% (2021). The highest plant height was observed of FFP at the tillering stage in 2020 and 2021, but the plant height of CRUS and CRUR exceeded that of FFP, US, and UR at the heading stage. This indicated that CRU is the most efficient fertilizer in the rice’s later stages.
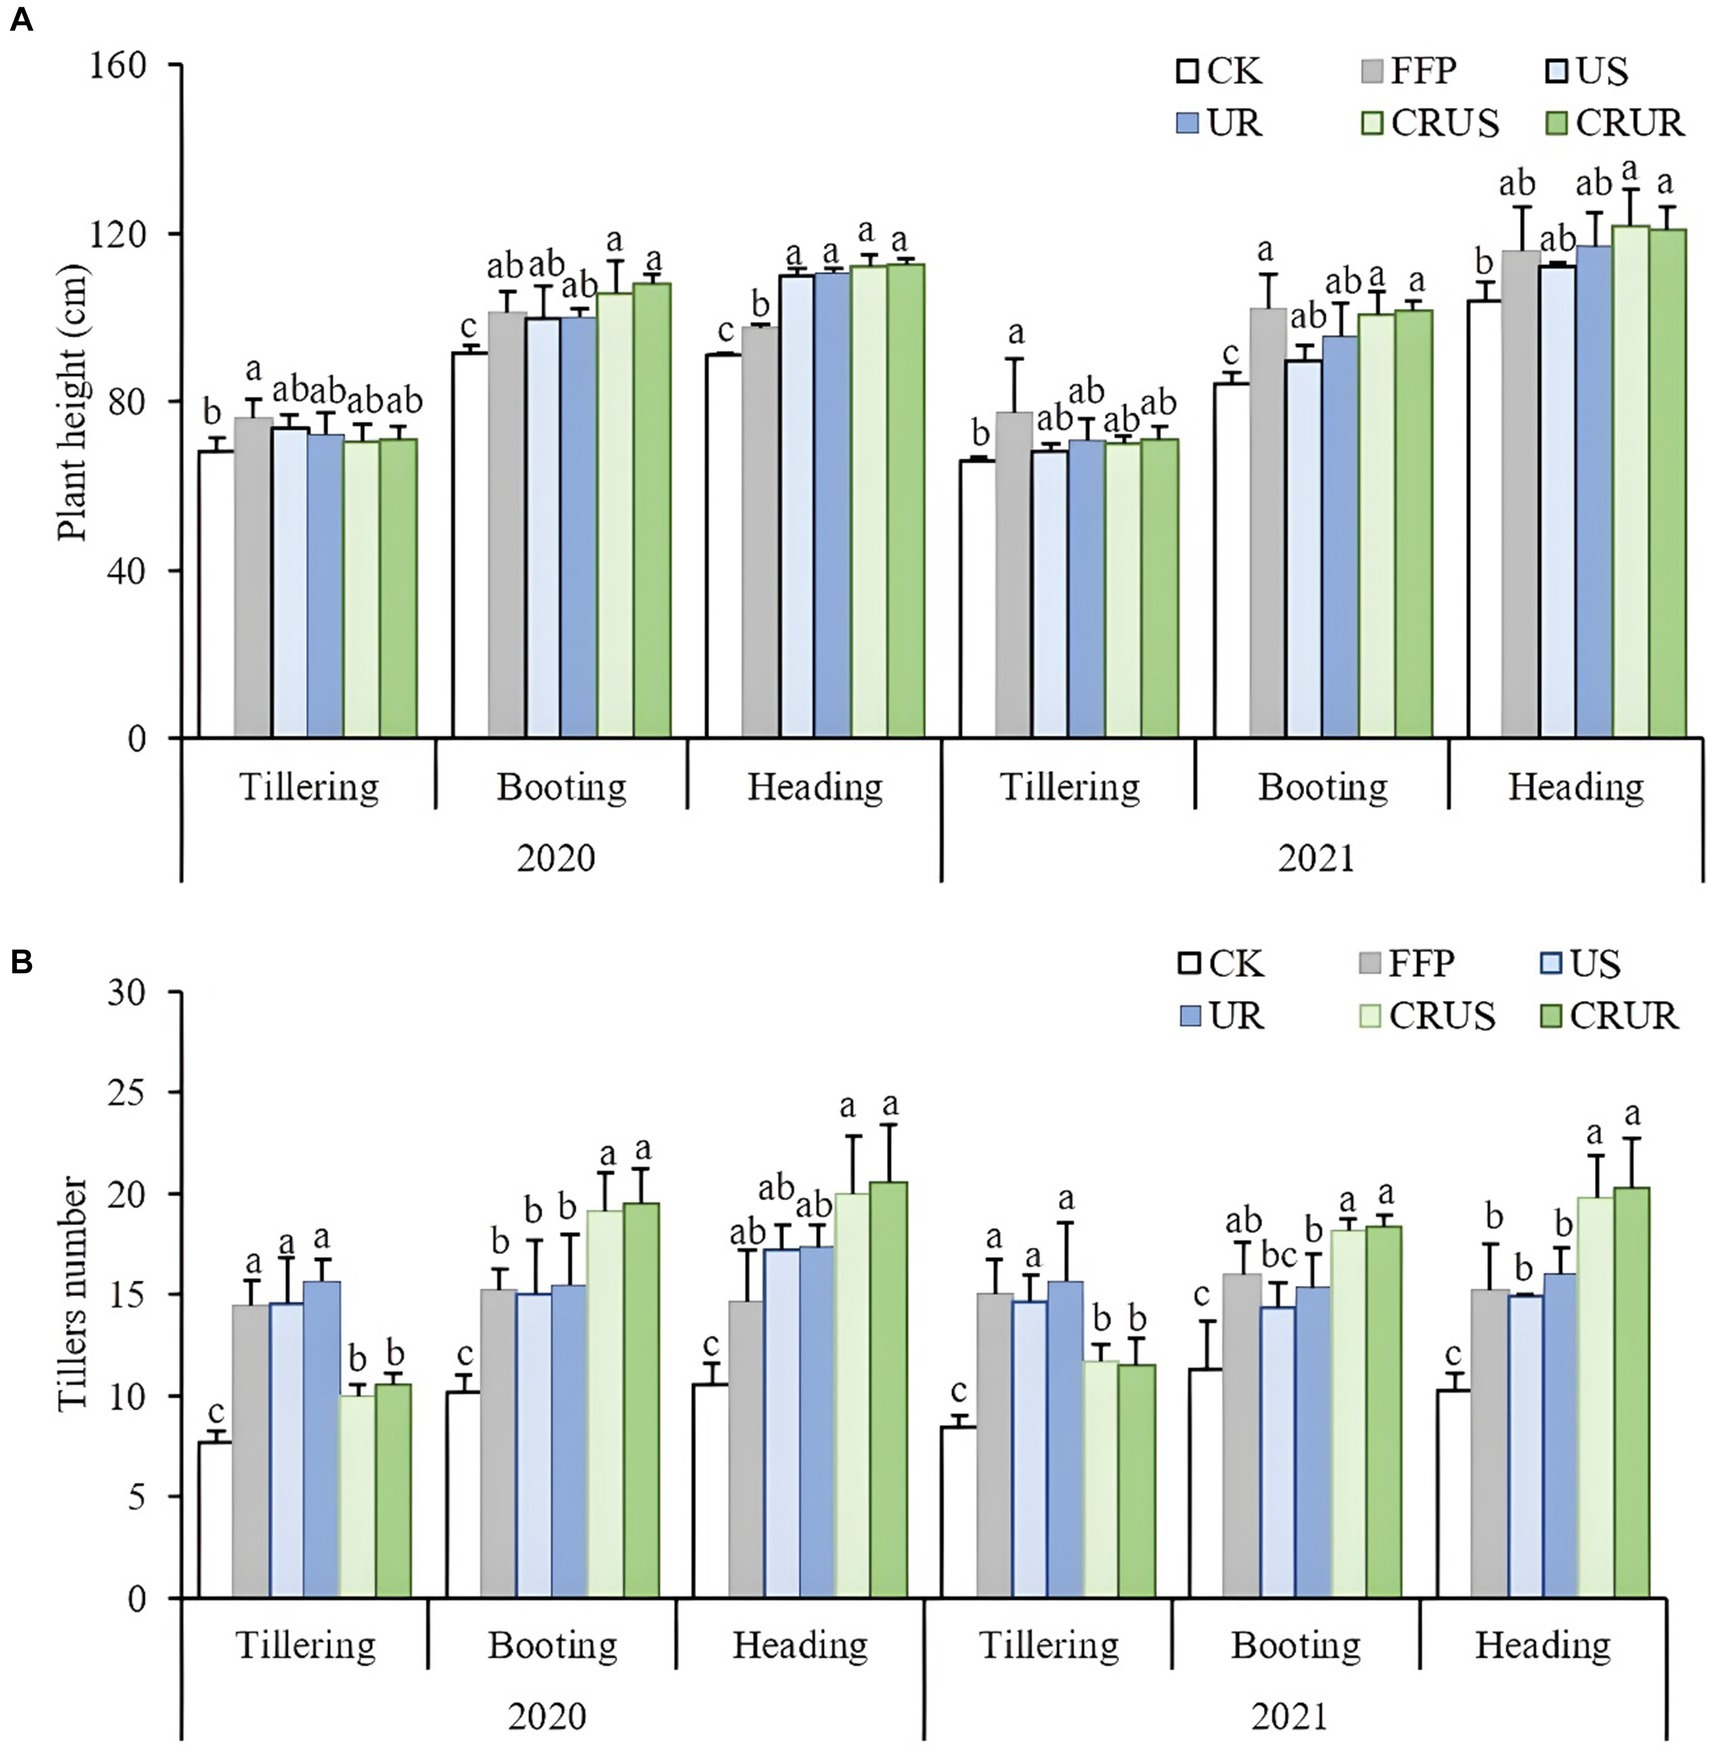
Figure 6. Different N fertilization treatments affect plant height (A) and tiller number (B) at different stages in 2020 and 2021. Values are means ± SD of three replicates. Different lowercase letters on bars indicate differences by the Tukey test at the 5% significance level.
The application of N significantly increased the number of tillers, as shown in Figure 6B, and different N application methods and types resulted in significant differences at different stages. In 2020 and 2021, the number of tillers of U was significantly higher than that of CRU at the tillering stage but was lower than that of CRU at the booting and heading stages. Compared with the US at the booting and heading stages in 2021, CRUS caused a significant increase in the number of tillers by 26.51 and 20.0% (p < 0.05). Compared with UR, CRUR significantly increased the number of tillers by 32.74% (p < 0.05).
3.6 The dry matter accumulation, N uptake, grain yield, NUE, and economic benefits
The dry matter accumulation of the aboveground was affected by N application methods and types of N fertilizer in 2020 and 2021 (Table 3). The amount of dry matter increased with time. The dry matter accumulation increased by 24.88% ~ 75.70% (2020) and 49.16% ~ 95.66% (2021) under N application treatments in 2020 and 2021 compared with the CK, and dry matter accumulation increased by 6.12% ~ 38.49% of LNS in 2020 compared with the FFP. For LNS, compared with U, the dry matter accumulation of HTM, MS, DME, and TRDV under the CRU treatment increased by 25.08, 17.90, 55.89, and 30.30%, respectively. These results indicate that CRU effectively promotes dry matter accumulation and the translocation of dry matter nutrients in organs compared with U.
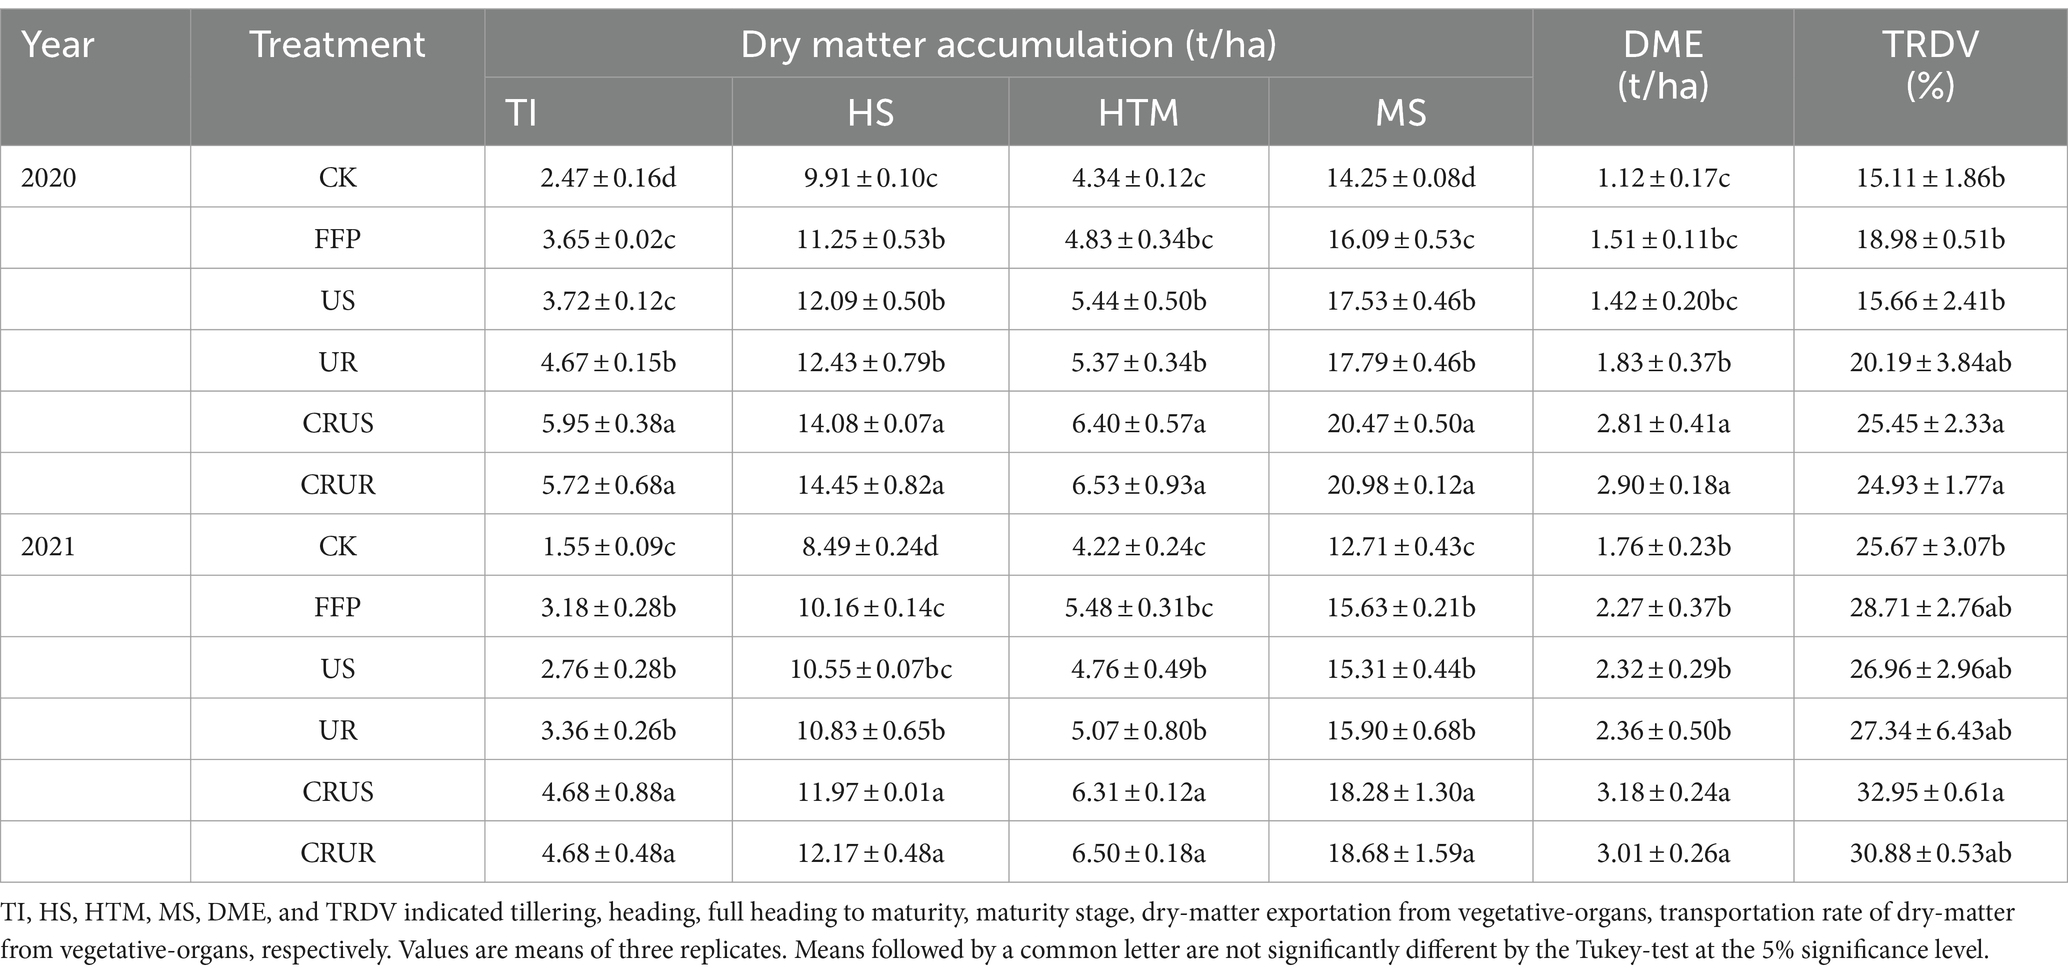
Table 3. Effects of different N fertilization treatments on dry matter accumulation and transportation.
The effects of N application methods and N fertilizer types on the total N uptake at different stages are shown in Figure 7. Compared with CK, the total N uptake under FFP significantly increased by 23.26% (2020) and 24.48% (2021). Compared with FFP, the total N uptake of LNS at the maturity stage in 2020 and 2021 increased by 14.06% ~ 29.93 and 7.99% ~ 29.51%, respectively. Compared with the US, the total N uptake of CRUS at different stages significantly increased by 12.66% ~ 28.09% (2020) and 16.98% ~ 38.45% (2021), respectively (p < 0.05). Compared with UR, the total N uptake of CRUR at different stages significantly increased by 13.91% ~ 18.99% (2020) and 12.74% ~ 31.84% (2021), respectively (p < 0.05). Compared with CRUS, the total uptake in CRUR at maturity stages increased by 1.42% (2020) and 3.36% (2021), respectively.
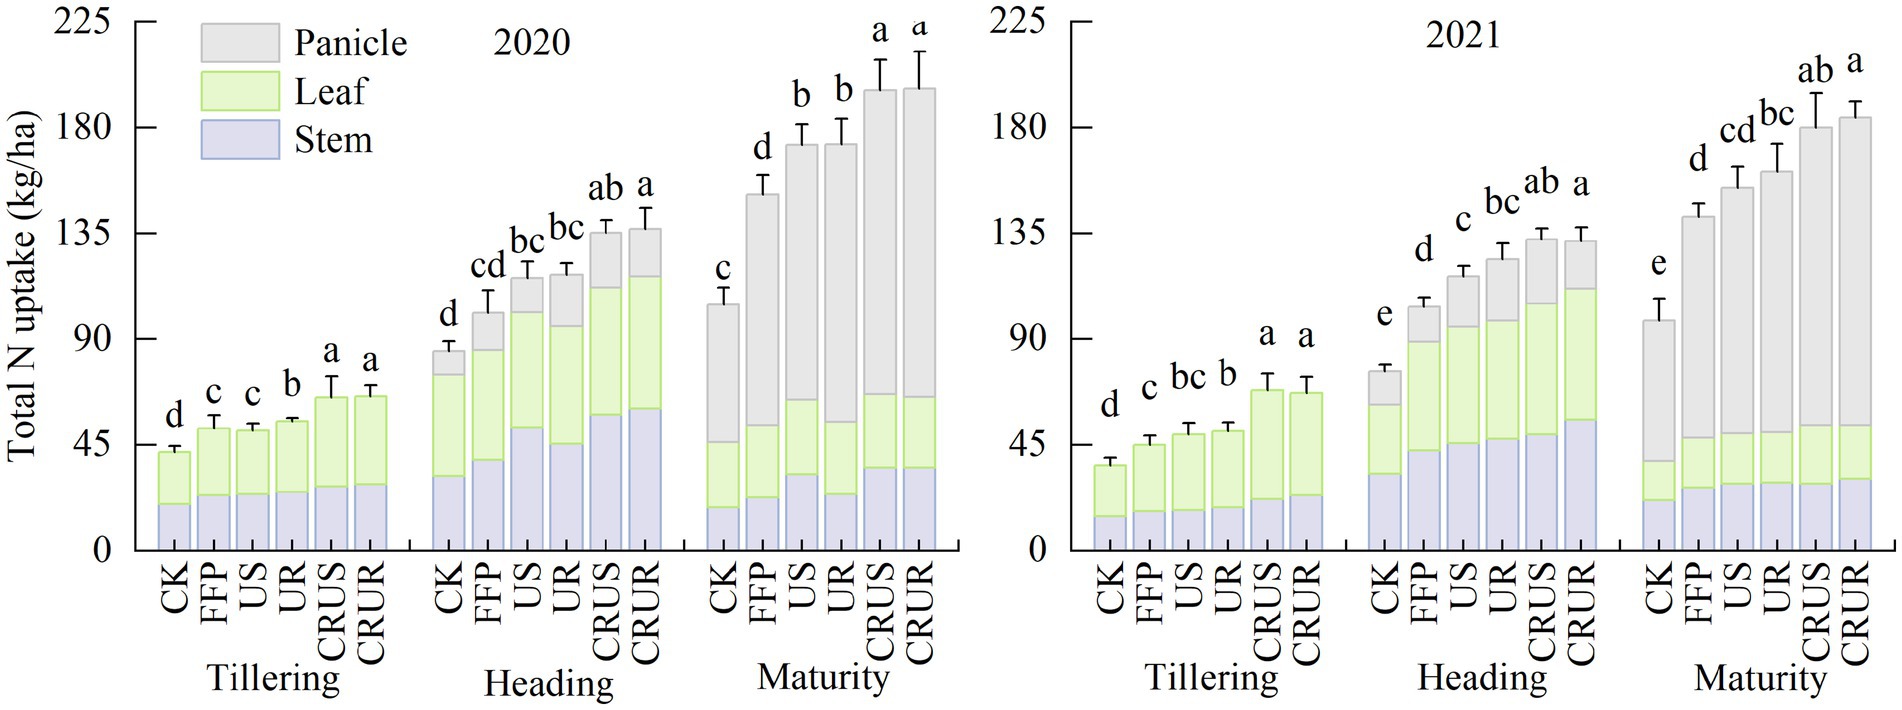
Figure 7. Effects of different N fertilization treatments on total N uptake of rice at tillering, heading, and maturity stages in 2020 and 2021. Values are the means ± SD of three replicates. Different lowercase letters on bars indicate differences by the Tukey test at the 5% significance level.
As shown in Table 4, the N application significantly increased rice yield in 2020 and 2021. Compared with CK, yield under FFP significantly increased by 21.43% (2020) and 24.19% (2021). Compared with FFP, the yield of LNS increased by 7.03% ~ 23.09% and 8.56 ~ 26.72% in 2020 and 2021 (p < 0.05), respectively. For CRU under LNS in 2020 and 2021, compared with the US, CRUS significantly increased yield by 12.81 and 13.62%, respectively (p < 0.05). Compared with UR, CRUR significantly increased yield by 10.88 and 11.91%, respectively (p < 0.05). The effective number of spikes and the total number of spikelets of CRU significantly increased by 13.25 and 18.41%, respectively, compared with those of U. There were no significant differences in the number of filled grains per panicle, seed-setting rate, and 1,000-grain weight between U and CRU. This indicated that the effective number of spikes and total number of spikelets caused the increase in yield. For SDF and RDF under LNS in 2020 and 2021, compared with the US, UR increased yield by 3.72 and 4.30%, respectively, and compared with CRUS, CRUR increased yield by 1.35 and 2.73%, respectively.
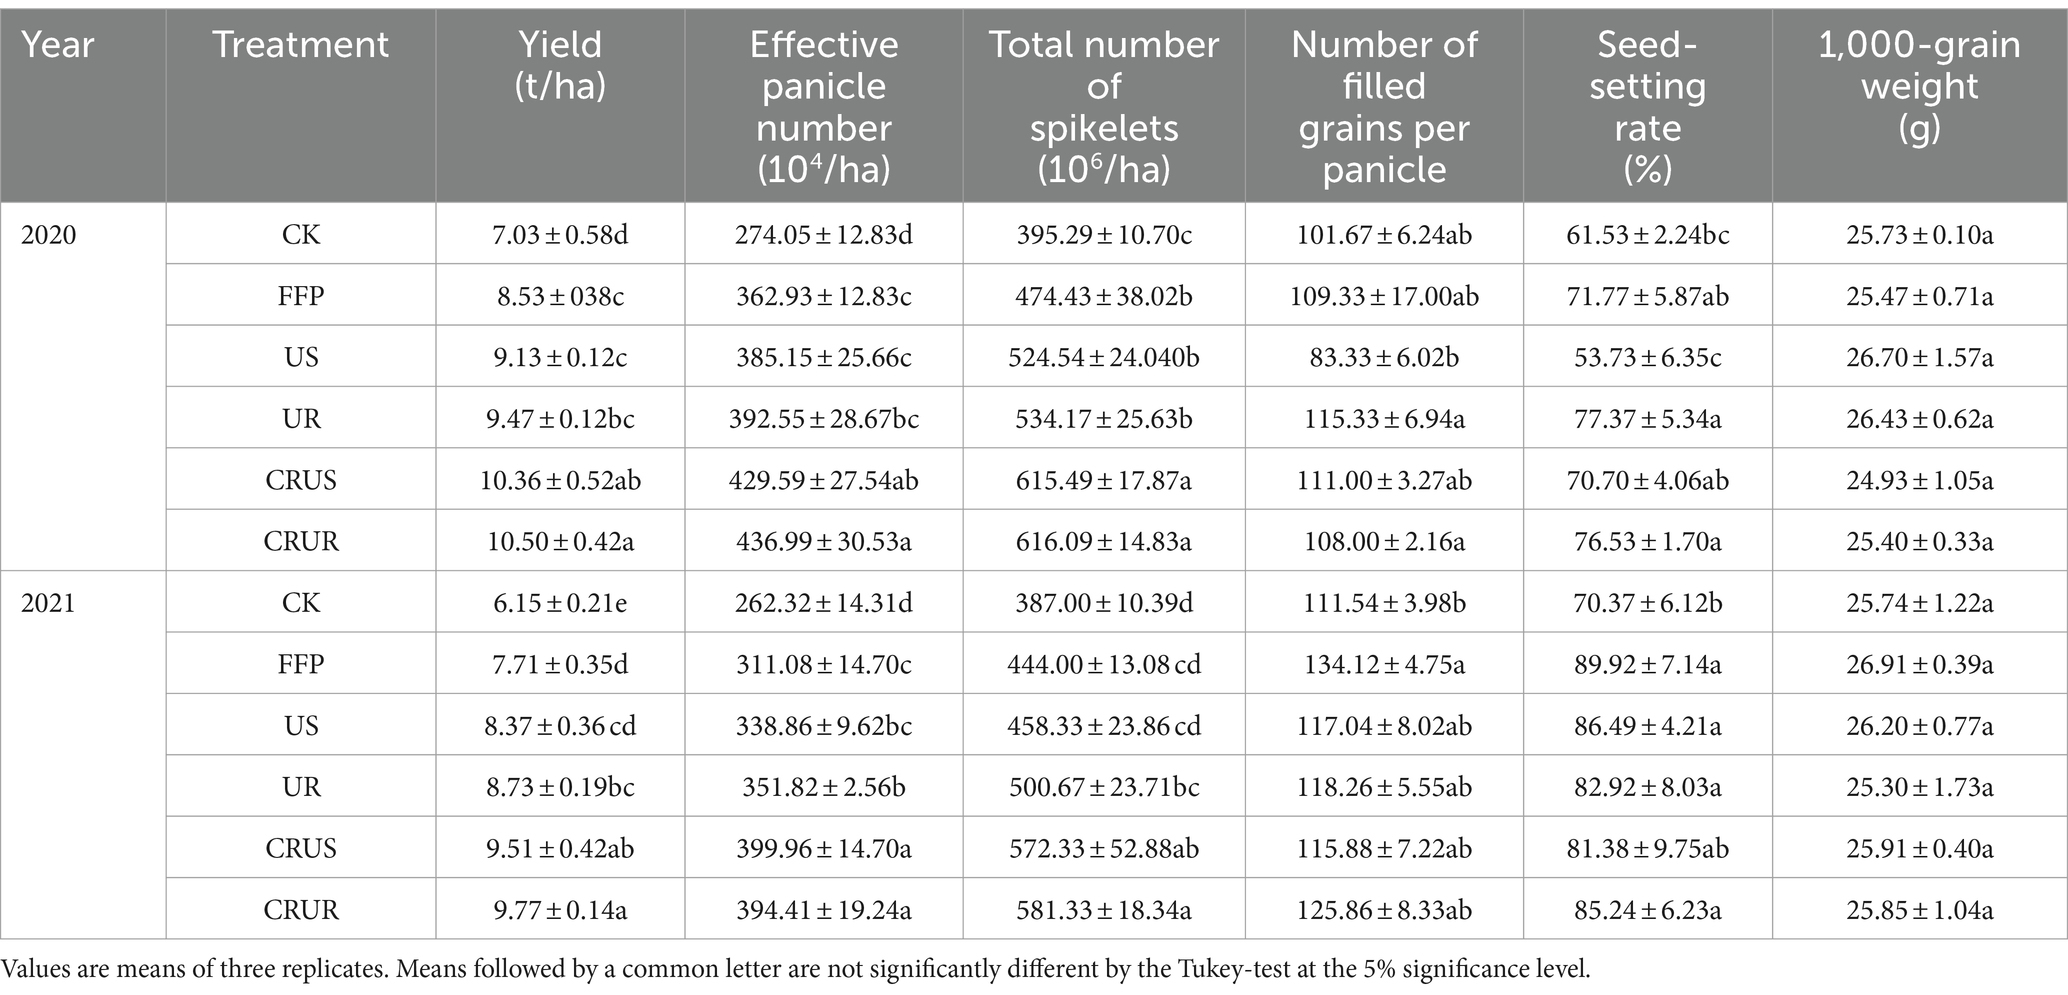
Table 4. Effects of different N fertilization treatments on yield and yield components in 2020 and 2021.
NRE, NAE, and PFPN were affected by the methods and type of N fertilizer (Table 5). Compared with FFP in 2020 and 2021, LNS increased NRE by 44.43% ~ 96.60 and 26.80% ~ 96.01%, NAE by 40.31 ~ 131.84 and 41.53% ~ 131.00%, PFPN by 7.06% ~ 23.02 and 8.47% ~ 26.72%, respectively. For CRU under LNS in 2020 and 2021, compared with U, CRU significantly increased NRE, NAE, and PFPN by 34.02% ~ 46.54, 40.50% ~ 60.14, and 10.67% ~ 13.74%, respectively (p < 0.05). For SDF and RZF under LNS in 2020 and 2021, compared with SDF, RZF increased NRE, NAE, and PFPN by 0.59% ~ 12.51, 3.18% ~ 16.82, and 1.02% ~ 4.30%, respectively.
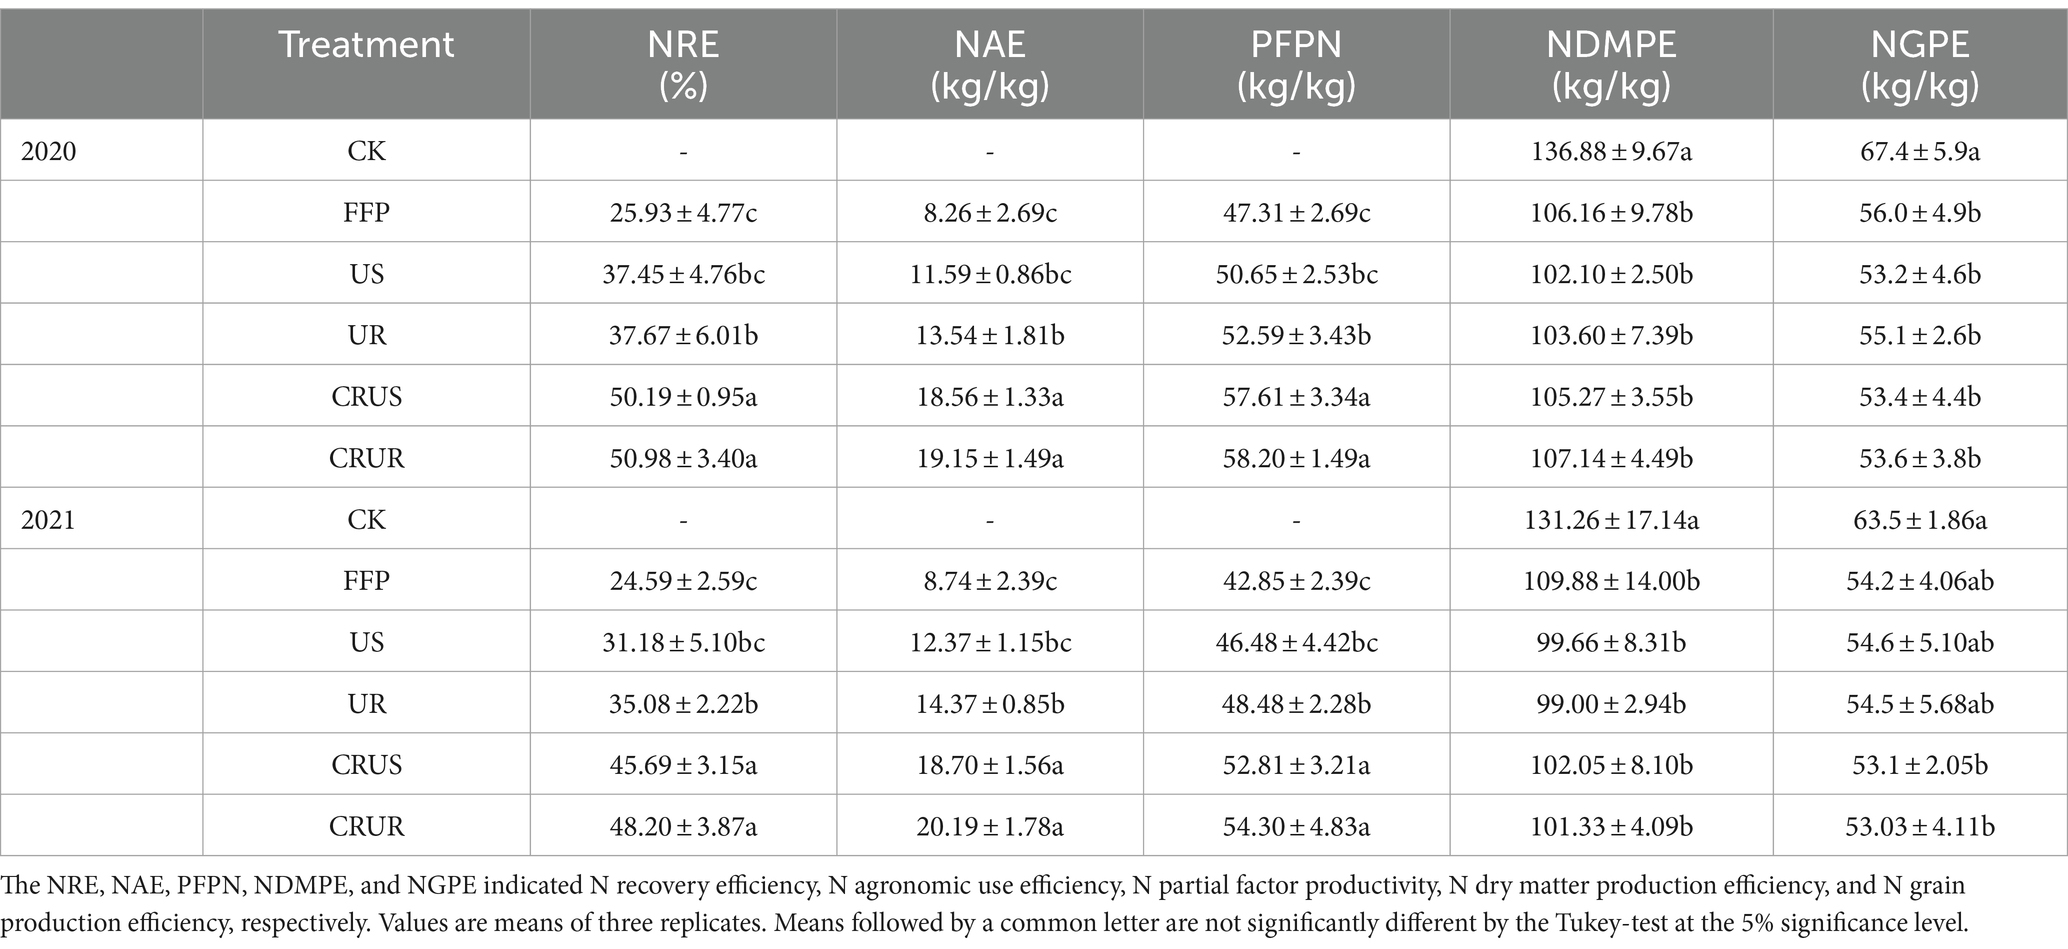
Table 5. Effects of different N fertilization treatments on NUE in 2020 and 2021.
As shown in Table 6, the N application treatments increased significantly by 23.26% ~ 53.94 and 20.21% ~ 53.01% (p < 0.05), respectively, compared to CK. Compared with FFP in 2020 and 2021, LNS increased GR by 7.05% ~ 23.01 and 8.47% ~ 26.71% and GM by 7.96 ~ 24.89 and 9.79% ~ 29.59%. For CRU under LNS in 2020 and 2021, compared with the US, CRUS significantly increased GR by 12.61 and 13.63% and GM by 14.31 and 14.22%, respectively (p < 0.05). Compared with UR, CRUR significantly increased GR by 10.67 and 11.58%, respectively (p < 0.05). For SDF and RZF under LNS in 2020 and 2021, compared with SDF, RZF increased GR by 10.67% ~ 13.75 and 11.99% ~ 13.63% and GM by 10.69% ~ 14.31 and 12.26% ~ 14.22%, respectively.
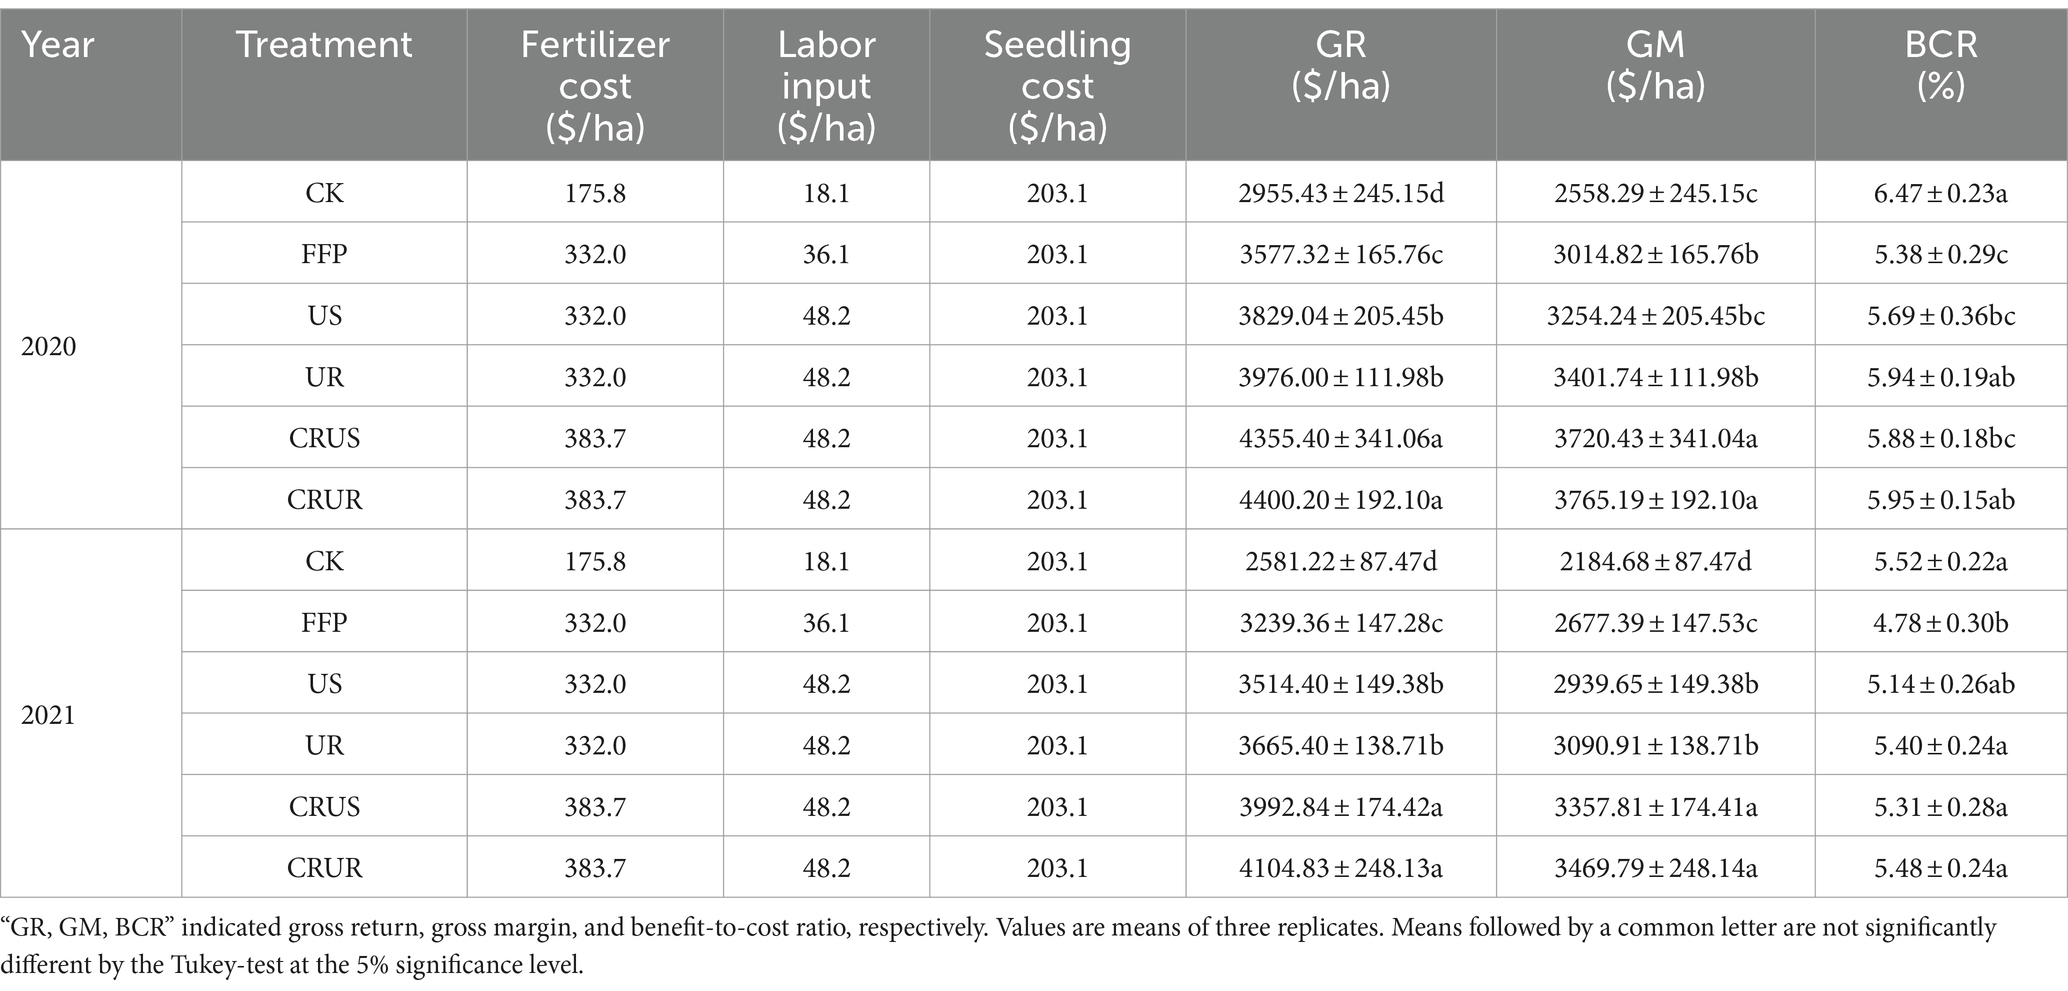
Table 6. Effects of different N fertilization treatments on economic benefits in 2020 and 2021.
3.7 Relationship between NH4+-N concentration, root traits, and yield
The path coefficient structural model describes the essential relationships among selected traits (Figure 8). The N uptake in rice shoots directly and positively affected NUE and yield. Moreover, NH4+-N concentration directly and positively affects N uptake and acts indirectly by promoting root growth, and root traits positively affect N uptake.
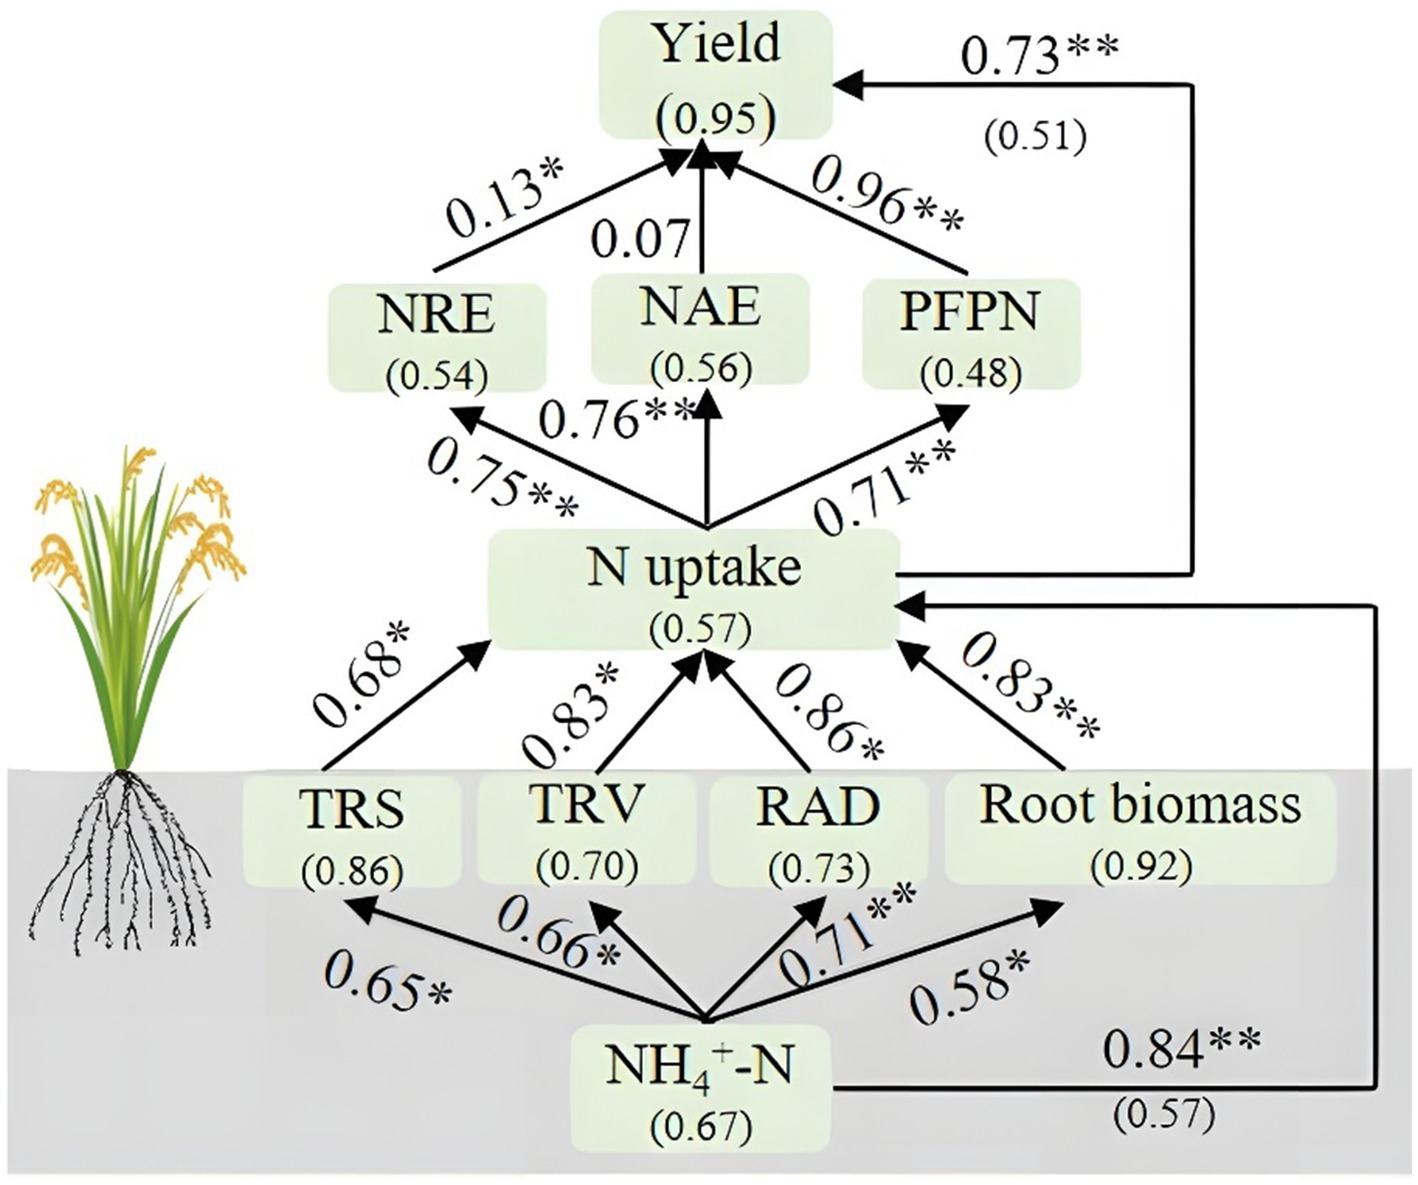
Figure 8. Path coefficient structural model of rice yield and the variables. Boxes indicate the variable name, and the numbers in parentheses indicate the variance explained by the model (R2). The numbers adjacent to the arrows are standardized path coefficients and indicative of the effect size of the relationship. A line with an arrowhead indicates a causal link between the cause (base of the arrow) and effect (end of error). “* and **” represented the significance level of p < 0.05 and p < 0.01, respectively. “NRE, NAE, and PFPN” indicated N recovery efficiency, N agronomic use efficiency, and N partial factor productivity, respectively. “TRS, TRV, and RAD” indicated total surface area, total root volume, and root average diameter, respectively.
4 Discussion
4.1 Yield and NUE under LNS treatments
LNS was reported to increase rice yield by a significant 44.0% compared to conventional broadcasting (Wu et al., 2017); similar results were acquired in this study, especially for UR, CRUS, and CRUR. On the one hand, this is related to the N application methods. The N application of tillering and booting fertilizer under FFP is spread on the soil’s surface, which results in being too far away from the rice root. Most fertilizers were not absorbed by the rice root, which undergoes denitrification to produce greenhouse gases that diffuse into the air and cause environmental pollution (Jain, 2023). On the other hand, it was also related to the N fertilizer types. The application of CRU significantly increased the soil NH4+-N concentration in the root zone with a duration of 120 d (Figure S1). Moreover, the LNS resulted in a more reasonable distribution of NH4+-N in the soil, which satisfied the nutrient needs of rice during the entire growth period (Figure 4) and thus significantly increased rice yield. Ding et al. (2022) also found that a one-time application of CRU under LNS increased the ratoon rice yield (Ding et al., 2022).
4.2 NH4+-N concentration and root traits under U and CRU
In this study, U and CRU applications under LNS increased the concentration of NH4+-N in the soil. For US and UR under LNS treatment, this was owing to the rapid conversion of U to NH4+-N by microbial urease. Rice roots took up part of it, and the rest was fixed by soil adsorption. NH4+-N is not easily leached with water, which results in higher concentrations of NH4+-N in the soil under deep urea application (Shi et al., 2022). For CRUS and CRUR, the slow and continuous release of N from CRU, compared with U, helps to reduce the concentration of substrate and soil urease activity. This delays nitrification and reduces the losses of N from the soil (Ma et al., 2023). In contrast, because the ability of soil to sorb and fix NH4+-N is limited, studies have shown that the highest soil sorption of NH4+-N occurs on the first day after fertilizer application, only 34% of the amount of NH4+-N applied is taken up, and the rest that is not taken up by plants and fixed by the soil being lost as gas, runoff, or leaching pathways (Sun et al., 2020). This may explain why the concentrations of NH4+-N under CRU were consistently higher than those under the U treatment.
The mechanism of nutrient release by CRU indicates that the nutrients in its envelope are continuously released during crop growth (Liu et al., 2019), which leads to an increase in the local nutrient concentration in the soil, while the rice root system adapts to the change in soil environment through various plastic responses, including root morphological plasticity (Verma et al., 2022). In this study, the TRS, TRV, and RAD were significantly higher under the CRU treatment than the U treatment (Figure 5), which was related to root morphological plasticity. Elevated inter-root NH4+-N concentrations under CRU treatment led to changes in the root apoplastic pH and auxin levels, which induced lateral root emergence (Pélissier et al., 2021).
4.3 The NH4+-N concentration and root traits under SDF and RZF
There were significant differences in the concentration of NH4+-N and root traits under different N application methods when the same types of N fertilizer were applied. We found that the concentration of NH4+-N was significantly higher in RZF than in SDF (Figure 4). This was because the contact area between N fertilizer and soil determined the dilution and rate of release of N fertilizer; the more extensive contact area results in higher dilution and rates of release of N fertilizer. The dilution and rate of release of N fertilizer were the smallest under RZF conditions, and less inorganic N was lost (Jiang et al., 2017).
In contrast, the root traits (TRS, TRV, and RAD) were significantly higher in SDF than in RZF (Figure 5). This is related to the contact area of the fertilizer with the root. By comparing Arabidopsis at 16 different N levels, Jia et al. (2022) showed that root growth is regulated by NH4+-N and NO3−-N, with NH4+-N promoting the expression of gene AMTs in root epidermal cells and NO3−-N promoting the expression of gene AFB3 (Vidal et al., 2010), both of which induce lateral root formation through the modulation of aboveground synthesis of growth hormones in rice (Jia et al., 2022). A fertilizer strip is formed near the rice root system under SDF, whereas RZF has a spot fertilizer near the rice under RZF. For rice roots, the fertilizer strip formed under SDF has a larger contact area with the root and produces more lateral roots.
4.4 The relationship between NH4+-N concentration, root traits, and yield
The path coefficient structural model was used to explore further the causal relationship between NH4+-N concentration, root traits, N uptake, NUE, and yield (Hu et al., 2023). The results show that increased NH4+-N concentration and root traits directly stimulated N uptake, which resulted in an increased rice yield by regulating NUE (Figure 8), supported by the fact that CRU promotes root growth by increasing the soil NH4+-N concentration, which further promotes N uptake by rice root. Interestingly, the yield and NUE under CRUR were slightly higher than those under CRUR (Table 3). Slightly higher may be related to the root/shoot ratio (RSR). The RSR is the root biomass ratio to the aboveground biomass, which is the parameter that directly reflects plant biomass allocation (Qi et al., 2019). The RSR under CRUS was significantly higher than that of CRUR (Table 2). Xu et al. (2018) reported that the RSR of rice was highly significant and negatively correlated with a yield at the heading and maturity stage. Moreover, Passioura (1983) showed that root growth consumes twice as much unit mass of material as aboveground (Passioura, 1983); higher root biomass in the later stages of rice fertility can excessively consume photosynthetically synthesized products above ground, thus adversely affecting grain filling and yield (Zhu et al., 2020). Overall, there was adequate N supply and better root growth under CRUR, which can be used for recommended fertilization management in rice production practice.
5 Conclusion
These results showed that localized N supply significantly increased rice yield and controlled release urea significantly improved NH4+-N concentration and roots growth compared with urea, which contributed to nutrient acquisition and improved rice yield. Compared with mechanical side deep fertilization, root zone fertilization had a slightly higher yield. Thus, localized nitrogen supply contributes to higher rice yields, controlled release urea should be selected as the recommended N fertilizer types, and the combination of controlled release urea and root zone fertilization was the most effective choice for rice production.
Data availability statement
The raw data supporting the conclusions of this article will be made available by the authors, without undue reservation.
Author contributions
RH: Writing – original draft. ZD: Methodology, Writing – review & editing. YT: Supervision, Writing – review & editing. YC: Formal analysis, Writing – original draft. JH: Project administration, Writing – review & editing. XW: Data curation, Writing – review & editing.
Funding
The author(s) declare financial support was received for the research, authorship, and/or publication of this article. This work is supported by Beijing Academy of Agriculture and Forestry Sciences Innovation Capacity Building Special (KJCX20230304), Platform Construction of Beijing Academy of Agriculture and Forestry Sciences (PT2024-47), the Engineering Research Center of Ecology and Agricultural Use of Wetland, Ministry of Education (KF202109), and Hubei special fund for agricultural science and technology innovation (2018skjcx01).
Conflict of interest
The authors declare that the research was conducted in the absence of any commercial or financial relationships that could be construed as a potential conflict of interest.
Publisher’s note
All claims expressed in this article are solely those of the authors and do not necessarily represent those of their affiliated organizations, or those of the publisher, the editors and the reviewers. Any product that may be evaluated in this article, or claim that may be made by its manufacturer, is not guaranteed or endorsed by the publisher.
Supplementary material
The Supplementary material for this article can be found online at: https://www.frontiersin.org/articles/10.3389/fsufs.2024.1326311/full#supplementary-material
References
Chen, G. Z., Wu, P., Wang, J. Y., Zhou, Y. D., Ren, L. Q., Cai, T., et al. (2023). How do different fertilization depths affect the growth, yield, and nitrogen use efficiency in rain-fed summer maize? Field Crop Res. 290:108759. doi: 10.1016/j.fcr.2022.108759
Cheng, Y., Wang, H. Q., Liu, P., Dong, S. T., Zhang, J. W., Zhao, B., et al. (2020). Nitrogen placement at sowing affects root growth, grain yield formation, N use efficiency in maize. Plant Soil 457, 355–373. doi: 10.1007/s11104-020-04747-2
Deng, N. Y., Grassini, P., Yang, H. S., Huang, J. L., Cassman, K. G., and Peng, S. B. (2019). Closing yield gaps for rice self-sufficiency in China. Nat. Commun. 10:1725. doi: 10.1038/s41467-019-09447-9
Ding, Z. J., Li, J. T., Hu, R., Xiao, D. K., Huang, F., Peng, S. B., et al. (2022). Root-zone fertilization of controlled-release urea reduces nitrous oxide emissions and ammonia volatilization under two irrigation practices in a ratoon rice field. Field Crop Res. 287:108673. doi: 10.1016/j.fcr.2022.108673
Hu, K. B., Zhao, P., Wu, K. X., Yang, H. L., Yang, Q. X., Fan, M. P., et al. (2023). Reduced and deep application of controlled-release urea-maintained yield and improved nitrogen-use efficiency. Field Crop Res. 295:108876. doi: 10.1016/j.fcr.2023.108876
Hu, R., Xiao, D. K., Ding, Z. J., Yang, S., Li, J. T., Huang, F., et al. (2022). Effect of nitrogen application in the root zone on root growth and distribution in rice seedlings. Jiang Agric. Sci. 50, 93–99. doi: 10.15889/j.issn.1002-1302.2022.22.013
Jain, A. K. (2023). Greenhouse gas emissions from nitrogen fertilizers. Nat. Food 4, 139–140. doi: 10.1038/s43016-023-00706-z
Jia, Z. T., Giehl, R. F. H., and Wirén, N. X. (2022). Nutrient-hormone relations: driving root plasticity in plants. Mol. Plant 15, 86–103. doi: 10.1016/j.molp.2021.12.004
Jiang, C. Q., Wang, H. Y., Lu, D. J., Zhou, J. M., Li, D. C., and Zu, C. L. (2017). Effects of fertilizer placement and nitrogen forms on soil nitrogen diffusion and migration of red-yellow soil in China. J. Agric. Sci. 8, 1227–1238. doi: 10.4236/as.2017.811088
Jin, Q., Wang, C., Sardans, J., Vancov, T., Fang, Y. Y., Wu, L. Q., et al. (2021). Effect of soil degradation on the carbon concentration and retention of nitrogen and phosphorus across Chinese rice paddy fields. Catena 209:105810. doi: 10.1016/j.catena.2021.105810
Li, L., Wu, T. Y., Li, Y. S., Hu, X., Wang, Z. X., Liu, J. F., et al. (2022). Deep fertilization improves rice productivity and reduces ammonia emissions from rice fields in China; a meta-analysis. Field Crop Res. 289:108704. doi: 10.1016/j.fcr.2022.108704
Liu, J. L., Yang, Y. C., Gao, B., Li, Y. C., and Xie, J. (2019). Bio-based elastic polyurethane for controlled-release urea fertilizer: fabrication, properties, swelling and nitrogen release characteristics. J. Clean. Prod. 209, 528–537. doi: 10.1016/j.jclepro.2018.10.263
Liu, X., Xu, G. C., Wang, Q. S., and Hang, Y. H. (2017). Effects of insect–proof net cultivation, rice–duck farming, and organic matter return on rice dry matter accumulation and nitrogen utilization. Front. Plant Sci. 8:47. doi: 10.3389/fpls.2017.00047
Ma, Q., Qian, Y. S., Yu, Q. Q., Cao, Y. F., Tao, R. G., Zhu, M., et al. (2023). Controlled-release nitrogen fertilizer application mitigated N losses and modified microbial community while improving wheat yield and N use efficiency. Agric. Ecosyst. Environ. 349:108445. doi: 10.1016/j.agee.2023.108445
Ma, Q. H., Sun, L. F., Tian, H., Rengel, Z., and Shen, J. B. (2021). Deep banding of phosphorus and nitrogen enhances Rosa multiflora growth and nutrient accumulation by improving root spatial distribution. Sci. Hortic. 277:109800. doi: 10.1016/j.scienta.2020.109800
Menegat, S., Ledo, A., and Tirado, R. (2022). Greenhouse gas emissions from global production and use of nitrogen synthetic fertilisers in agriculture. Sci. Rep. 12:14490. doi: 10.1038/s41598-022-18773-w
Passioura, J. B. (1983). Roots and drought resistance. Agric. Water Manag. 7, 265–280. doi: 10.1016/0378-3774(83)90089-6
Pélissier, P. M., Motte, H., and Beeckman, T. (2021). Lateral root formation and nutrients: nitrogen in the spotlight. Plant Physiol. 187, 1104–1116. doi: 10.1093/plphys/kiab145
Qi, Y. L., Wei, W., Chen, C. G., and Chen, L. D. (2019). Plant root-shoot biomass allocation over diverse biomes: a global synthesis. Glob. Ecol. Conserv. 18:e00606. doi: 10.1016/j.gecco.2019.e00606
Qin, W., Wang, D., Guo, X., Yang, T., and Oenema, O. (2015). Productivity and sustainability of rainfed wheat-soybean system in the North China Plain: results from a long-term experiment and crop modelling. Sci Rep. 5:17514. doi: 10.1038/srep1751
Shi, W. X., Zhang, Q., Li, L. T., Tan, J. F., Xie, R. H., and Wang, Y. L. (2022). Hole fertilization in the root zone facilitates maize yield and nitrogen utilization by mitigating potential N loss and improving mineral N accumulation. J. Integr. Agric. 22, 1184–1198. doi: 10.1016/j.jia.2022.09.018
Sun, X., Liang, B., Wang, J., Cheng, Y., Chang, S. X., Cai, Z. C., et al. (2020). Soil N transformation rates are not linked to fertilizer N losses in vegetable soils with high N input. Soil Till. Res. 202:104651. doi: 10.1016/j.still.2020.104651
Verma, P. K., Verma, S., and Pandey, N. (2022). Root system architecture in rice: impacts of genes, phytohormones and root microbiota. 3 Biotech 12:239. doi: 10.1007/s13205-022-03299-9
Vidal, E. A., Araus, V., Lu, C., Parry, G., Green, P. J., Coruzzi, G. M., et al. (2010). Nitrate-responsive miR393/AFB3 regulatory module controls root system architecture in Arabidopsis thaliana. Proc Natl Acad Sci. 107, 4477–4482. doi: 10.1073/pnas.0909571107
Wang, Y. J., Liu, D. Y., Xiao, W. P., Zhou, P., Tian, C. G., Zhang, C. S., et al. (2021). Coastal eutrophication in China: trend, sources, and ecological effects. Harmful Algae 107:102058. doi: 10.1016/j.hal.2021.102058
Waqas, M., Hawkesford, M. J., and Geilfus, C. M. (2023). Feeding the world sustainably: efficient nitrogen use. Trends Plant Sci. 28, 505–508. doi: 10.1016/j.tplants.2023.02.010
Wu, M., Li, G. L., Li, W. T., Liu, J., Jiang, C. Y., and Li, Z. P. (2017). Nitrogen fertilizer deep placement for increased grain yield and nitrogen recovery efficiency in rice grown in subtropical China. Front. Plant Sci. 8:1227. doi: 10.3389/fpls.2017.01227
Xu, G. W., Lu, D. K., Wang, H. Z., and Li, Y. J. (2018). Morphological and physiological traits of rice roots and their relationships to yield and nitrogen utilization as influenced by irrigation regime and nitrogen rate. Agric. Water Manag. 203, 385–394. doi: 10.1016/j.agwat.2018.02.033
Yang, G. Y., Ji, H. T., Liu, H. J., Zhang, Y. F., Chen, L. G., Zheng, J. C., et al. (2020). Assessment of productivity, nutrient uptake and economic benefits of rice under different nitrogen management strategies. Peer J. 8:e9596. doi: 10.7717/peerj.9596
Yang, X. Y., Geng, J. B., Liu, Q. J., Zhang, H. Y., Hao, X. D., Sun, Y., et al. (2021). Controlled-release urea improved rice yields by providing nitrogen in synchrony with the nitrogen requirements of plants. J. Sci. Food Agric. 101, 4183–4192. doi: 10.1002/jsfa.11056
Yao, Y. L., Zhang, M., Tian, Y. H., Zhao, M., Zhang, B., Zhao, M., et al. (2017). Urea deep placement for minimizing NH3 loss in an intensive rice cropping system. Field Crop Res. 218, 254–266. doi: 10.1016/j.fcr.2017.03.013
Yuan, S., Linquist, B. A., Wilson, L. T., Cassman, K. G., Stuart, A. M., Pede, V., et al. (2021). Sustainable intensification for a larger global rice bowl. Nat. Commun. 12:7163. doi: 10.1038/s41467-021-27424-z
Zhu, A., Gao, J., Huang, J., Wang, H., Chen, Y., and Liu, L. J. (2020). Advances in morphology and physiology of root and their relationships with grain quality in rice. Crops 2, 1–8. doi: 10.16035/j.issn.1001-7283.2020.02.001
Zhu, C. H., Xiang, J., Zhang, Y. P., Zhang, Y. K., Zhu, D. F., and Chen, H. Z. (2019). Mechanized transplanting with side deep fertilization increases yield and nitrogen use efficiency of rice in eastern China. Sci. Rep. 9:5653. doi: 10.1038/s41598-019-42039-7
Keywords: rice, yield, controlled release urea, mechanical side deep fertilization, root zone fertilization
Citation: Hu R, Ding Z, Tian Y, Cao Y, Hou J and Wang X (2024) Localized nitrogen supply facilitates rice yield and nitrogen use efficiency by enabling root-zone nitrogen distribution and root growth. Front. Sustain. Food Syst. 8:1326311. doi: 10.3389/fsufs.2024.1326311
Edited by:
Rubab Zahra Naqvi, National Institute for Biotechnology and Genetic Engineering, PakistanReviewed by:
Liantao Liu, College of Agronomy, Hebei Agricultural University, ChinaDamodhara Rao Mailapalli, Indian Institute of Technology Kharagpur, India
Hafiz Athar Hussain, Institute of Environment and Sustainable Development in Agriculture, Chinese Academy of Agricultural Sciences, China
Copyright © 2024 Hu, Ding, Tian, Cao, Hou and Wang. This is an open-access article distributed under the terms of the Creative Commons Attribution License (CC BY). The use, distribution or reproduction in other forums is permitted, provided the original author(s) and the copyright owner(s) are credited and that the original publication in this journal is cited, in accordance with accepted academic practice. No use, distribution or reproduction is permitted which does not comply with these terms.
*Correspondence: Jun Hou, houjungoodluck1@163.com; Xuexia Wang, wxx0427@163.com