Baseline socioeconomic characterization and resource use of the community in the Mefakiya watershed
 Mekin Mohammed
 Demsew Bekele
  Melkamu Bazie
- Ethiopian Institute of Agricultural Research (EIAR), Fogera National Rice Research and Training Center, Bahir Dar, Ethiopia
Baseline characterization is used during the project to show progress toward the goal and objectives and after the project to measure the amount of change. The main objective of the study was to investigate the socio-economic characterization and natural resource use in the Mefakiya learning watershed. Both qualitative and quantitative data were collected. Quantitative data were collected using a structured questionnaire through face-to-face interviews with households at the intervention site. Sixty representative households were selected randomly and interviewed. Constraints and potentials were identified via focus group discussions. Descriptive statistics were used to analyze the quantitative data. The majority of the sample households (90%) were male-headed. Agriculture (crop and livestock production) is the principal (98.3%) occupation of the sample households in the Mefakiya watershed. Maize, finger millet, and teff, the major crops cultivated in the watershed, are produced by 98, 92, and 68% of the households, respectively. The study area is characterized by high natural resource degradation that is interconnected in nature. Therefore, an integrated approach is more important and necessary for the sustainable use of watershed resources and further development in all aspects of the watershed in the study area.
1 Introduction
1.1 Background and justification
A watershed is not only a hydrological unit but also a social, political, and ecological entity that plays a crucial role in determining food, social, and economical security by providing life support services to rural people (Wani, 2008). The Learning Watershed is an approach where community watersheds are used as a live learning platform for implementing integrated watershed management practices and systematic introduction of improved agricultural technologies, such as improved crop varieties, horticultural crops, improved livestock breeds and management techniques, and improved farm machinery. Moreover, this method emphasizes the scientific documentation of experiences and lessons to facilitate scaling up these practices (Desta, 2015).
Previous studies have investigated the community impacts of various development practices, including conservation project (Agol et al., 2014; Rasoolimanesh et al., 2017) community-based tourism (Goodwin and Santilli, 2009; Sebele, 2010; Lucchetti and Font, 2013; Nitikasetsoontorn, 2014), food for work interventions (Nega et al., 2010; Chen et al., 2018), and community wind power development (Lantz and Tegen, 2009; Okkonen and Lehtonen, 2016). However, most studies conducted on community development and the impact of practices have focused on community participation and the effects of these practices (Nitikasetsoontorn, 2014; Gamo et al., 2021). Many of these studies have also emphasized the aggregate economic, sociocultural, and environmental sustainability achievements (Palanisami and Kumar, 2009; Singh et al., 2010; Agol et al., 2014). Furthermore, these studies have focused on project achievements rather than the socioeconomic characteristics of the watershed. It is important to establish a baseline characterization to measure project performance before implementing any changes to project processes (Anantha et al., 2009). Without the baseline data, there is no way to evaluate whether a change is making a difference in the watershed. It is used during the project to show progress toward the goal and objectives and after the project to measure the amount of change. It allows those involved in the project to understand the primary livelihood conditions of the people and identify the necessary actions to reach the goal of improving the livelihoods of the poor. Thus, baseline characterization establishes the essential foundation for the plan and obtains essential information for effective planning, implementation, and monitoring (Desta, 2015). Various tools such as satellite data, GIS, and GPS in addition to conventional ones such as field survey, topographical and cadastral maps, along with traditional multi-disciplinary methods (PRA, soil and water analysis, socioeconomic survey, etc.) can be employed to provide information about the socioeconomic aspects of the watershed (Anantha et al., 2009).
Learning watersheds are mainly established to address the problem of soil degradation, low vegetation cover, and depletion of soil water on degraded lands, soil erosion in the form of gullies, sheet and rill erosion on cultivated lands, low crop and livestock productivity, and inadequate coordination mechanisms among actors (Desta, 2015). The Mefakiya learning watershed was established by Fogera National Rice Research and Training Center in 2021. It was established as a learning watershed through the participation of different stockholders to perform different activities.
The Mefakiya learning watershed intervention is proposed to address land degradation, soil fertility depletion, and agricultural productivity decrement of the watershed. Thus, the baseline study is important before the implementation of the project. Performing the socioeconomic characterization, identifying, and prioritizing major constraints and potentials contribute and build upon on the available database to help identify the highest priority on socioeconomic aspects in the Mefakiya learning watershed. It also contributes to further interventions for improving livelihoods, conserving natural resources for the sustainability of the Lake Tana and promoting agricultural development as a whole. Specifically, the objectives of the current study were to document baseline information on socioeconomic aspects which is used as a benchmark for planning and impact monitoring and to identify major natural resource use in the learning watershed. The study also aimed to answer the following research questions: Which household socioeconomic variables are associated with the watershed interventions? Does watershed community affect natural resource? Which constraints have more impact on the watershed community?
2 Methodology
2.1 Study area description
2.1.1 Geographic location
The Mefakiya watershed, located in the South Gondar Zone, Dera district, approximately lies between 11045′50” N-11050′30” N and 34034′30” E-37036′0′E latitude and longitude, respectively (Figure 1) and covers a catchment area of 645.8 ha. Its elevation ranges between 1794 and 1878 m above the sea level. It is situated in the upper part of Lake Tana.
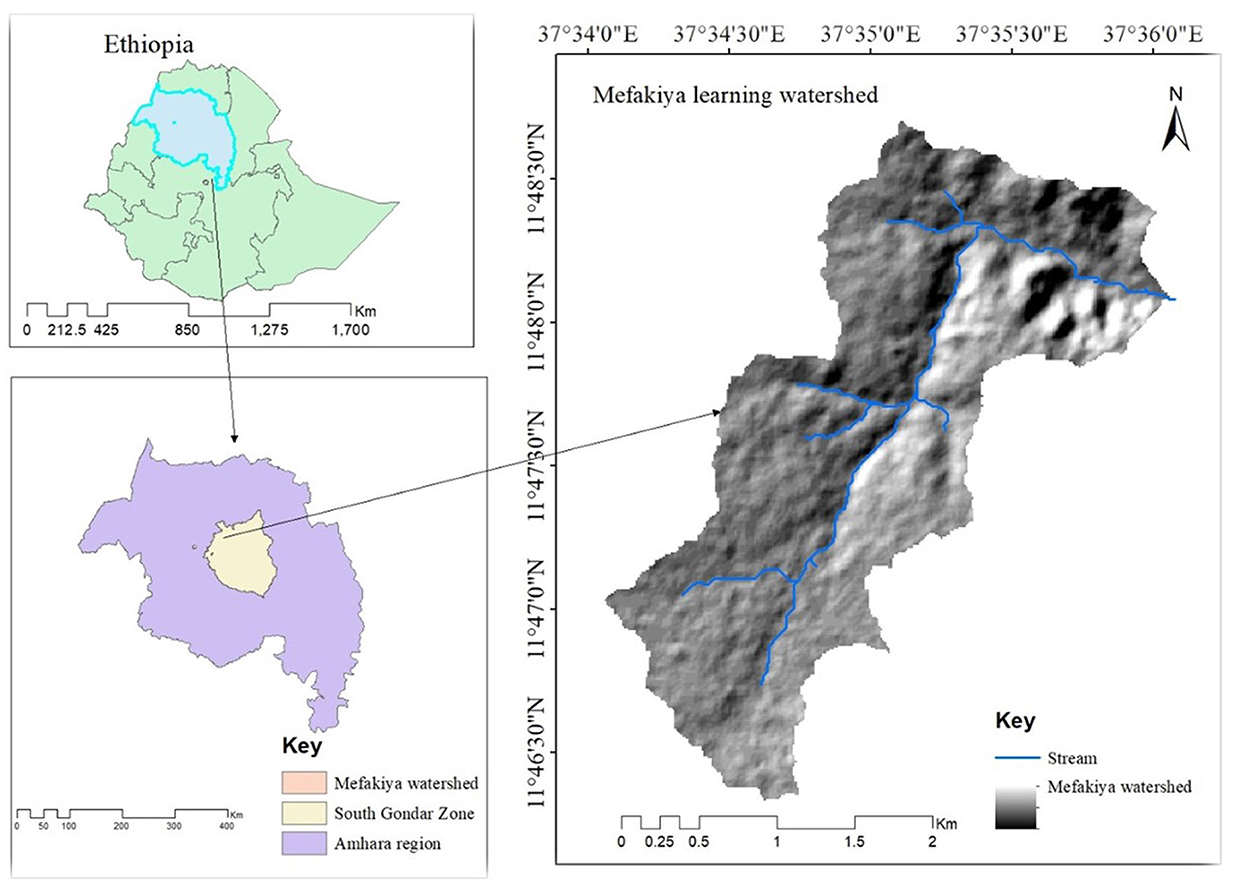
Figure 1. Location of the Mefakiya watershed.
2.1.2 Soil
The major soil group classified in the study area (Figure 2) were Dystric gleysols and Dystric nitisols covering an area of 73.5 and 26.5%, respectively (FAO, 2006).
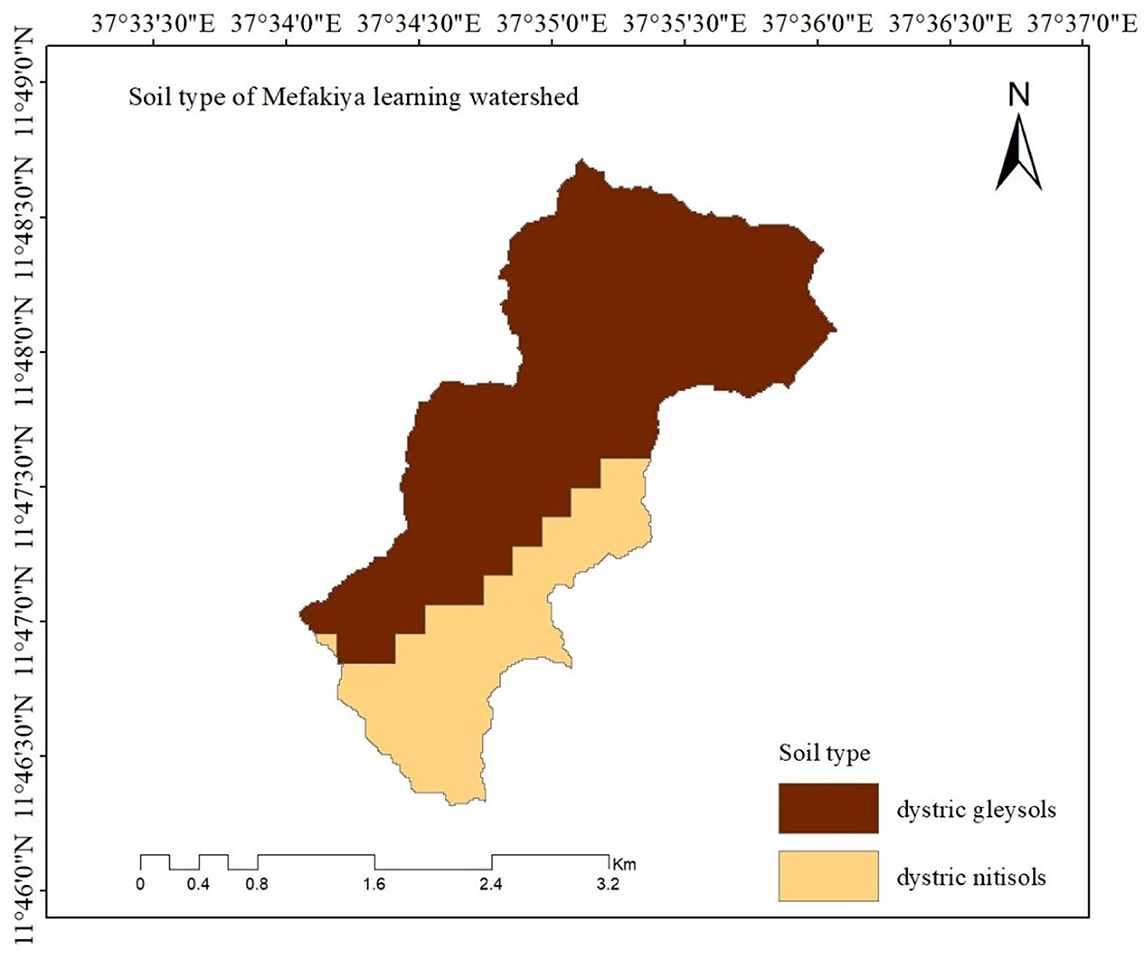
Figure 2. Soil types of the Mefakiya watershed. Source: FAO, 2006, soil shapefile.
2.1.3 Slope
The results, as shown in Figure 3, indicate that the dominant slope class is 5–10%, which covers 36.4% of the total area of the watershed, followed by 2–5%, which covers 19.8% of the total area of the watershed. Based on the FAO classification, the distribution of slopes is as follows: the 15–30% category which covers 16.9% of the area, the 0–3% category covers 7.2% of the area, and the remaining 2.9% is included in the >30% slope class. The slope gradients of 3–8 and 8–15% cover the largest area, representing 296.5 and 174.3 ha, respectively (FAO, 2006).
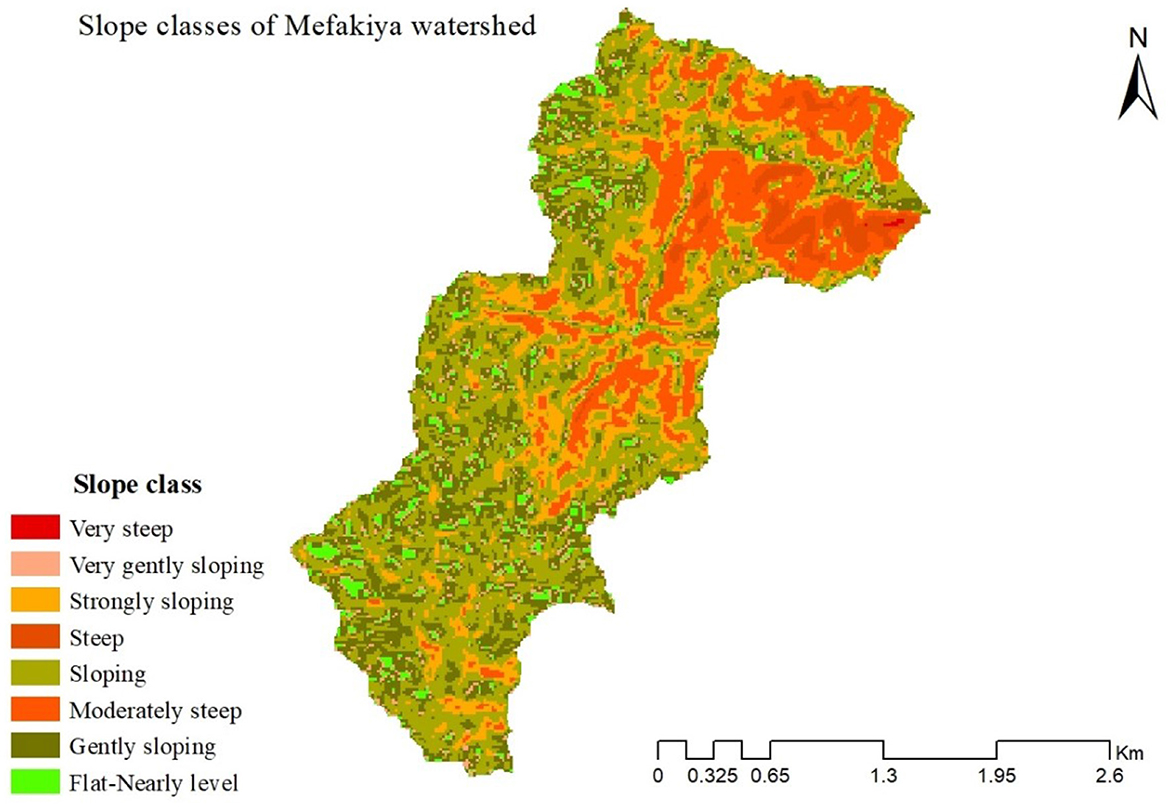
Figure 3. The slope class of the Mefakiya watershed.
2.2 The type and method of data collection
Both qualitative and quantitative data were collected mainly using the semi-structured checklist and the structured questionnaire through interviews of randomly selected households in the Mefakiya watershed. The questionnaire comprised different sections, including information about the area, household demographics and socioeconomic details, farming practices (such as crops, livestock, and natural resource management), credit and extension services, income, marketing, as well as gender roles and labor contributions. The data were collected using CSPro7.1 statistical software and were then exported to SPSS and Stata for data analysis. Additionally, two focus group discussions (FGD) were conducted with the communities in the vicinity of the watershed.
Moreover, secondary data sources like CSA, district agricultural office, published sources, and internet was used.
2.3 Sampling techniques and the sample size
A random sampling technique was employed in this study. First, the responses of all household heads in the watershed were recorded. There are a total of 306 households (population) expected to be benefited from the watershed, with 90.8% being male-headed and the remaining 9.2% female-headed. The sample size can be determined through many ways; it could be fixed by researchers, using the sample size formula by considering the degree of variability in the population, budget, and time. According to Anantha et al. (2009), the ideal sample should cover 20–25% of the households in the baseline study of the watershed. Based on this suggestion, this study selected 20% of the population of the watershed which make up a sample size of 60 households that are selected through simple random sampling techniques, and the randomization was carried out using Excel. This sampling provides the better estimate of parameters in the studies in comparison to purposive sampling (Singh and Masuku, 2014).
2.4 Method of data analysis
Descriptive analysis was used to analyze the collected data. The study used measures of central tendency and dispersion such as mean, frequency, percentage, minimum, maximum, standard deviation, and graphs for describing the variables. We used Stata-15 statistical software for data analysis. The qualitative data were analyzed by using appropriate words and content analysis. Finally, the pairwise matrix was used for ranking and analyzing the major constraints.
3 Results and discussion
3.1 Results
3.1.1 Household characteristics
3.1.1.1 Demographic characteristics in the watershed
The socioeconomic characteristics of households are helpful in exploring the communities' infrastructure and resources need for planning future interventions of watershed management. Out of the sample households, 92% were male-headed and the remaining 8% households were female-headed (Table 1). As shown in Table 1, most of the households consisted of married couples (88.3%), with divorced (6.7%), single (3.3%), and widowed (1.7%) individuals.
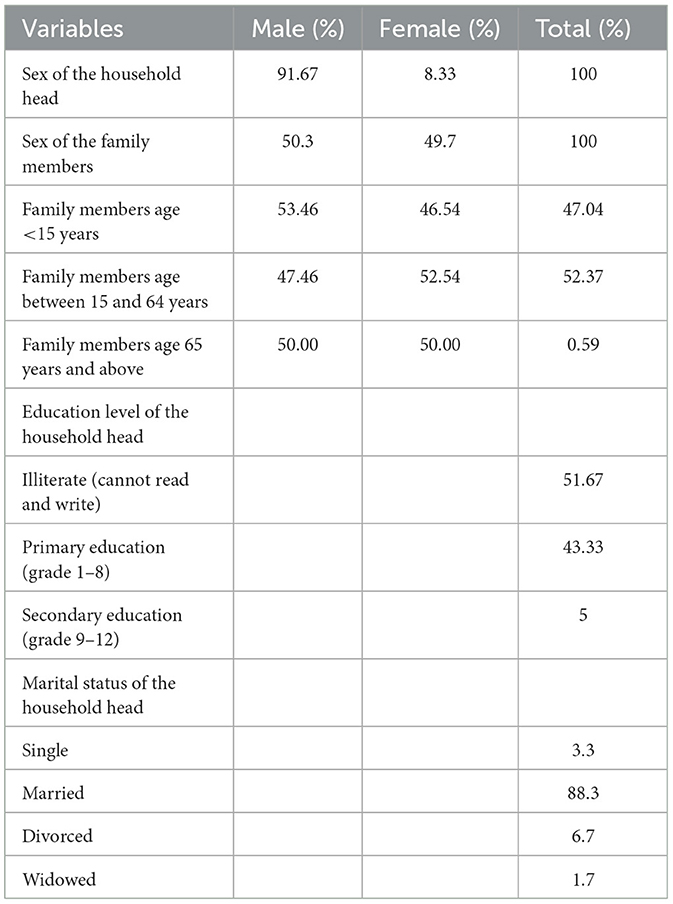
Table 1. Household characteristics.
More than half (52%) of the interviewed household heads were found to be illiterate (unable to read and write), 43.3% had attended primary school, and the remaining 5% had secondary school education. The mean farming experience among the households was 24 years.
The results on Table 2 indicate that the average family size of the sample households was five persons, with a range of 1–10 persons, which is slightly higher than the average household size reported in the Ethiopia Socioeconomic Survey 2015/2016.
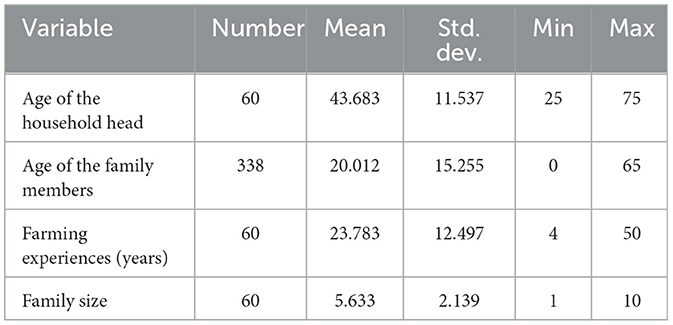
Table 2. Household characteristics.
3.1.2 Access to infrastructures and institutions
Service providers play a crucial role in enabling farmers to increase technology adoption, efficiency, profitability, and sustainability of agricultural production. The mean distance to the nearest market from the household residence was 3.6 km. On average, farmers traveled an average distance of 1.12 km to access drinking water, 3.1 km to reach a farmer training center, and 1.4 km to get to an all-weather road (Table 3).
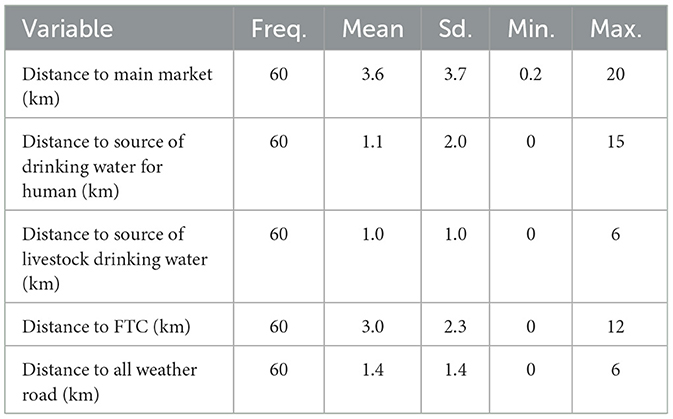
Table 3. Access to key services and infrastructures.
Membership in various associations and institutions enable farmers to access information related to agriculture, marketing, and non-agricultural information and related services. As shown in Table 4, out of the total respondents, the majority (88%) were members to farmer cooperatives. Notable proportions (35%) of the sample households were members of savings and credit groups, and 22% were part of land administration committees.
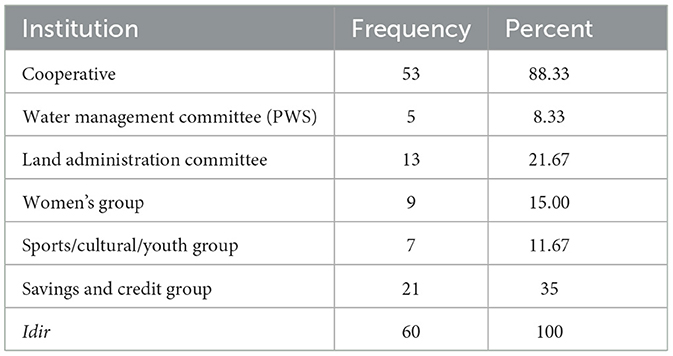
Table 4. Membership in institutions.
3.1.3 Major source of income
As indicated in Table 5, the mean overall annual income of the households was 44,663 birr with a minimum of 3,000 birr and a maximum of 218,000 birr.1 In general, all households earned income from the sale of crops, while 72% obtained income from livestock sales in the same year.
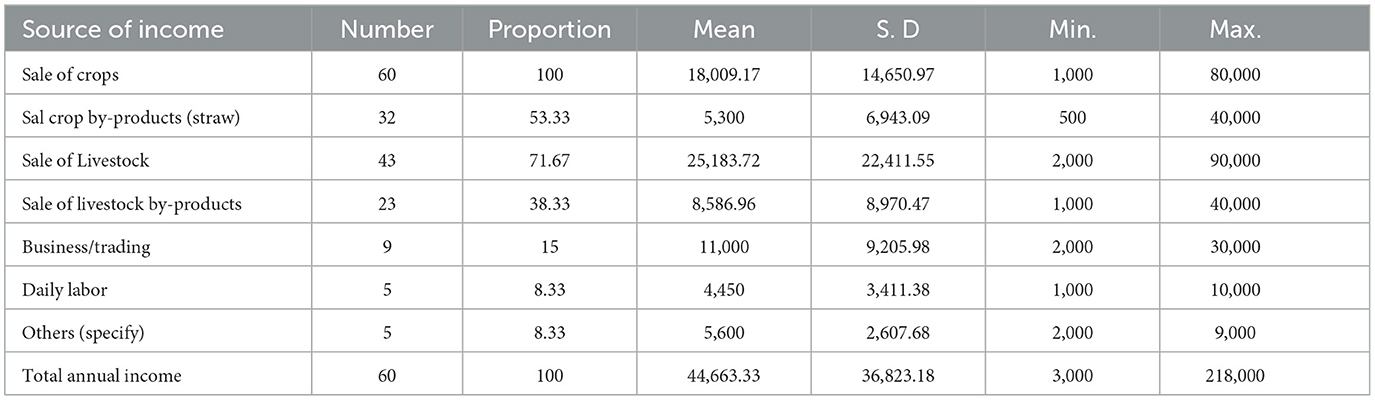
Table 5. Annual income in the year 2021/2022 (birr).
3.1.4 Major crops produced in the study area
Teff and rice were the most commercialized crops in the study area, with commercialization indices of 76% and 52%, respectively. In contrast, finger millet was primarily produced for the purpose of home consumption, with a commercialization index of 16% (Table 6).
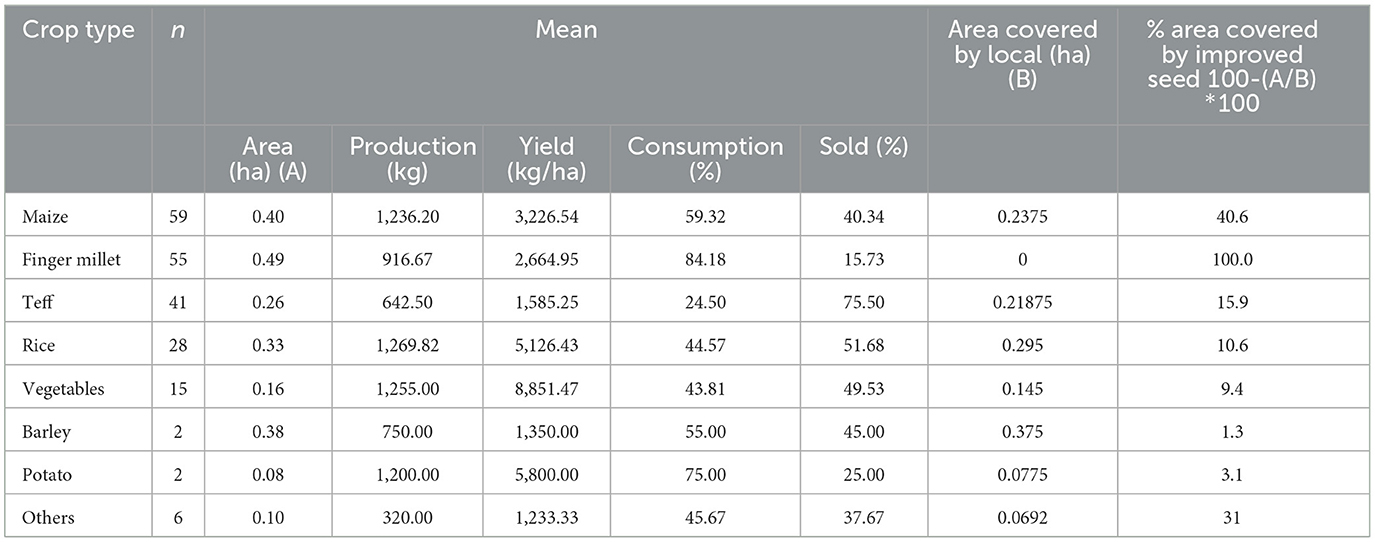
Table 6. Crop production and marketing.
Row planting was not well practiced by farmers in the watershed community except for maize and vegetable crops (Table 7). All fruits and vegetables, as well as 98% of the maize fields, were planted in rows; however, the adoption of row planting was very low for other cereals such as teff and rice. Moreover, farmers in the watershed never practiced finger millet row planting, though it is the major crop among 91% of the households.
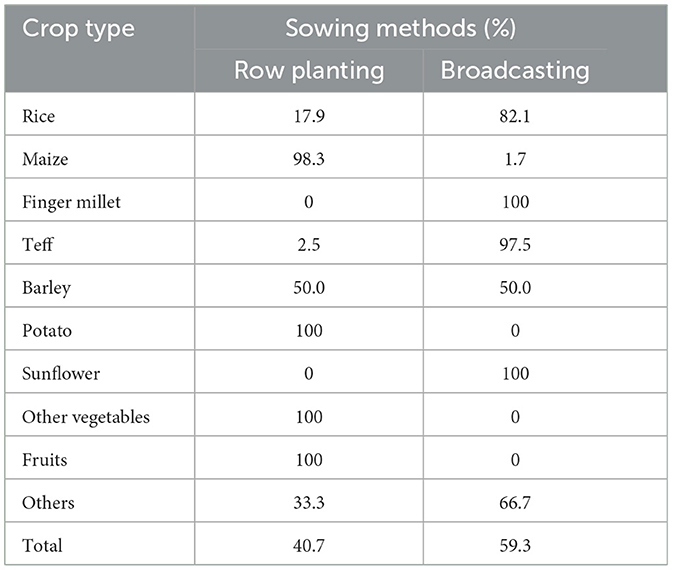
Table 7. Planting/sowing methods.
3.1.5 Land and inputs use practices
The mean landholding size of the interviewed households were 1.5 ha on which a majority of the land was devoted for cultivation of annual crops, and only a small fraction of land was devoted for perennials, trees, and grazing land (Table 8).
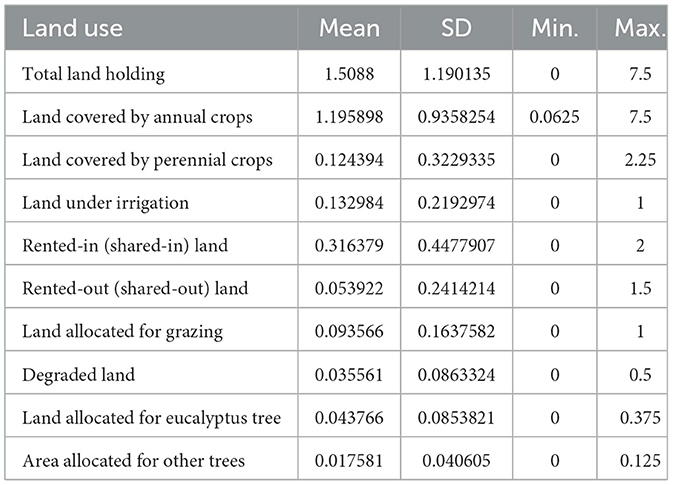
Table 8. Land allocation pattern.
As shown in Table 9, a significant number of farmers use pesticides, organic fertilizers, and improved varieties in addition to inorganic fertilizers for the production of crops. Farmers exclusively used animal draft power for tillage (plowing). Among all the crops considered, it was found that 85% of the interviewed farmers were using improved varieties. They used improved seeds of teff, maize (BH543, BH540, Lemu), and rice varieties (Shaga). The study further revealed that 78% of the households used organic fertilizers (compost and manure). The office of agriculture was the major source of improved varieties for farmers, with 59% of those using improved varieties accessed from this office, followed by cooperatives at 39% (Table 9).
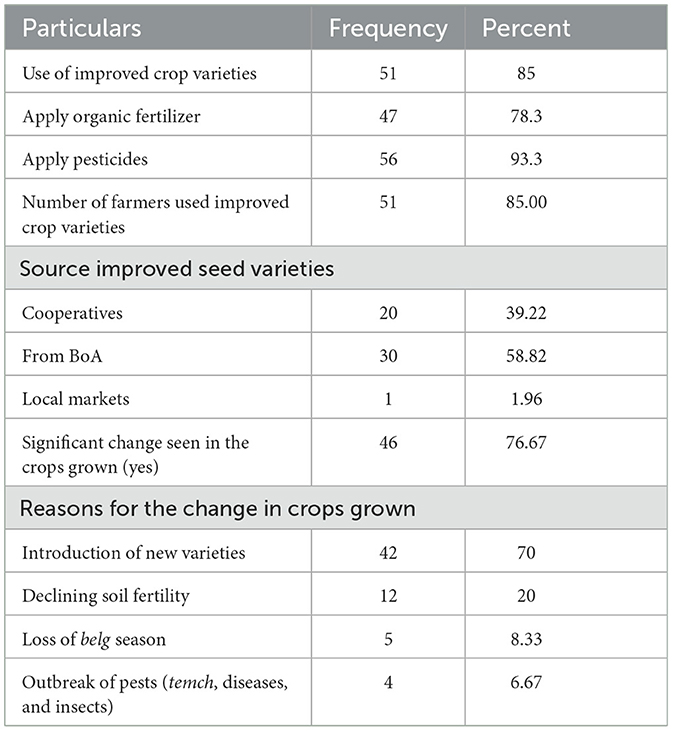
Table 9. Use of improved varieties and crop changes.
As illustrated in Table 9, among the interviewed households, 77% of them reported that they have seen significant changes in the crops grown due to the introduction of new varieties (70%), declining soil fertility, and natural factors.
3.1.6 Livestock ownership
Farmers in the watershed had low to moderate livestock population. As indicated in Table 10, cattle were the major livestock species owned by households in the watershed community. Accordingly, 90% of the households owned oxen and 83% owned cows in the watershed. A significant number of households owned donkeys (60%) and chickens (67%). The results further illustrate that the number of households accessing improved breeds was very low. Only 17% of the sample households owned crossbred cows. In contrast, 42% of the households own improved chicken breeds. This indicates that improved breeds had not been well adopted in the study area. Local breeds of heifer, bull, calf, sheep and goat accounted for 48%, 37%, 50%, 43%, and 8%, respectively. There is no improved goat and almost nothing for sheep in the watershed. The total number of livestock measured in tropical livestock units (TLU)2 owned by households was 6.1 TLU.
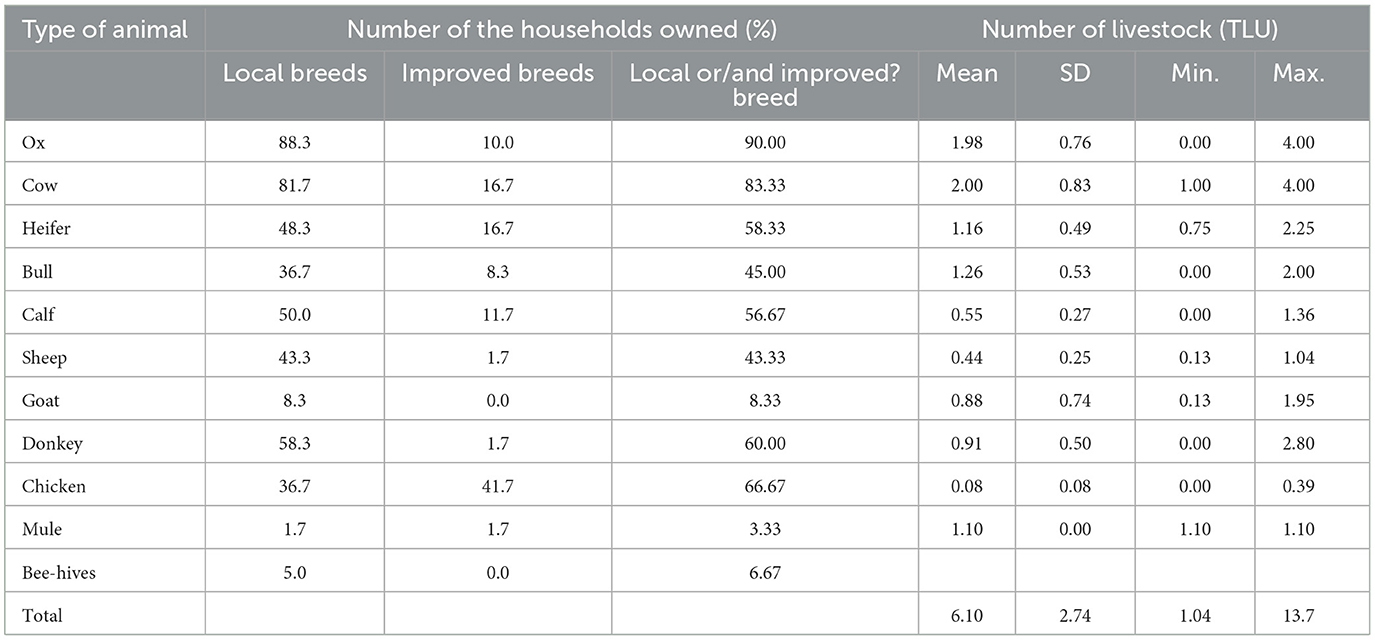
Table 10. Livestock ownership.
3.1.7 Livestock feeds, improved technology awareness, and practices
Crop residues are the primary source of animal feed, used by 68% of households, followed by grazing on their own land, with only 15% of families using improved forage (Table 11).
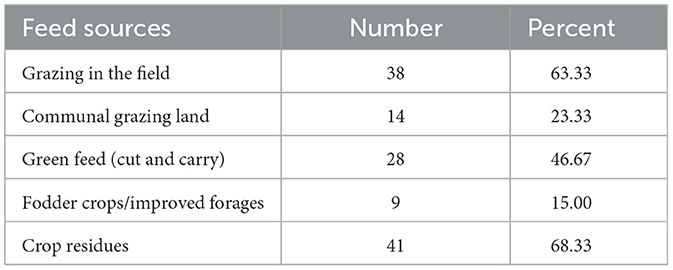
Table 11. Improved animal feed sources.
Table 12 presents awareness on improved livestock farm practices. The results revealed that awareness does not guarantee the adoption of improved livestock technologies practices. Only half of the farmers who have awareness have been practiced. For example, 48% of the households had information about improved forage but <½ of them grow it. Fattening of animals like cattle and sheep were practiced by 43% of farmers on regular basis or occasionally.

Table 12. Awareness on livestock farm practices.
3.1.8 Assets ownership in the watershed community
Asset ownership in the farm households has an effect on welfare in terms of improving food security, income, diet diversity and help them to gain better standard of living. In this study, we presented the asset in to different categories namely communication, transportation, farm implements, and power assets.
In recent years, the use of solar power is becoming a common phenomenon in rural areas for use as a source of light. In this study, 47 out of 60 (78%) of the sample households owned and used solar energy. Energy saving stove has also started to become a source of cooking energy. However, only 7% of the sample households in the study area owned and used it.
In the study area, households owned simple farm implements like knapsack sprayer, water motor pipe, spade/shovel and hoe but none of them was using improved farm machineries in the production process.
In the research area, equine carts were utilized to transport both people and agricultural inputs, outputs, and byproducts (Table 13). Additionally, it appears that one of the career prospects where young people are typically employed is in equine cart-based businesses. In the study area, about 28% of homes have equine carts.
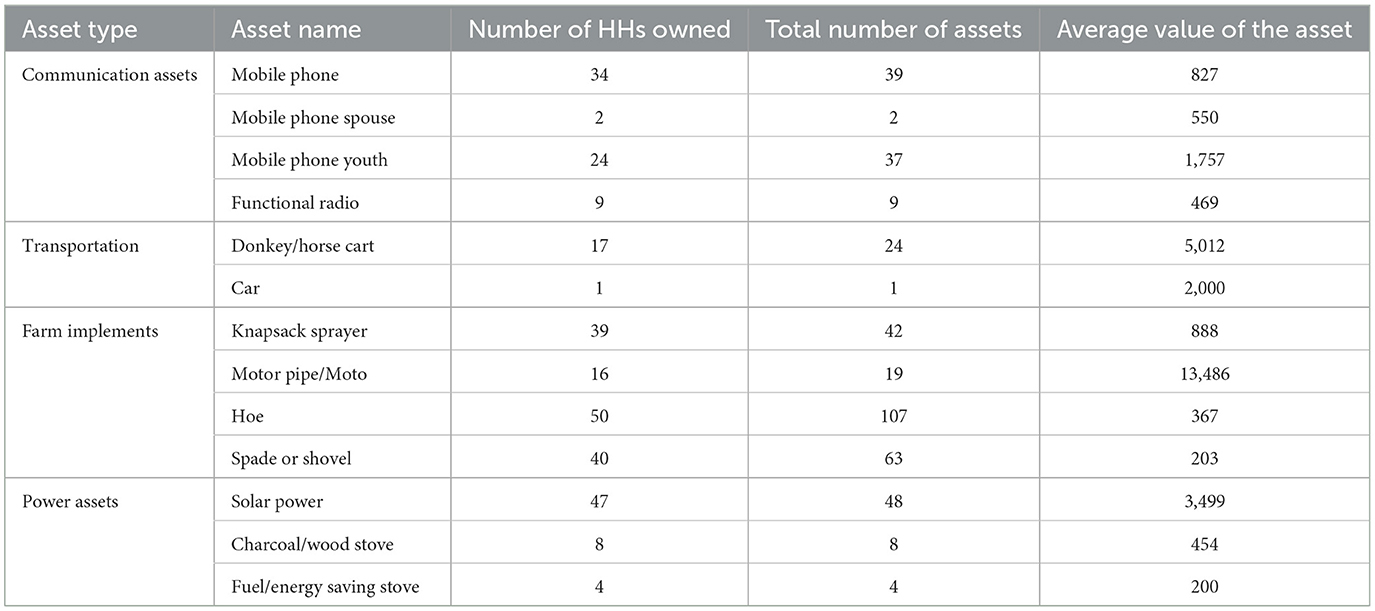
Table 13. Physical assets.
3.1.9 Extension and credit services
Level of satisfaction with extension services was rated mainly as medium level (48%), the remaining farmers 27% each confirmed that the level of satisfaction with extension services was poor and very poor (Figure 4).
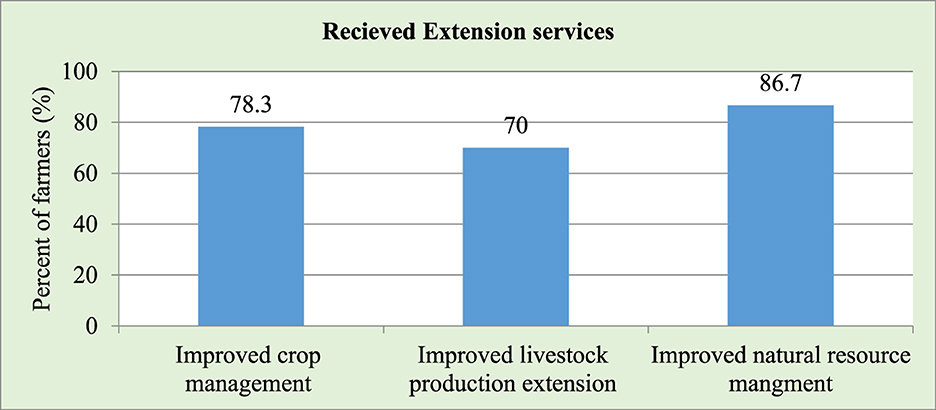
Figure 4. Agricultural extension services (%).
3.1.10 Credit services
As shown in Table 14, 52% of the sampled households have never taken out credit, while 48% have obtained credit for different purposes. The primary reasons for obtaining credit were the purchase of agricultural inputs, especially fertilizers/agro-chemicals (17%), followed by the acquisition of oxen (13%), beehives (8%), and other expenditures devoted to purchasing seeds and female cattle.
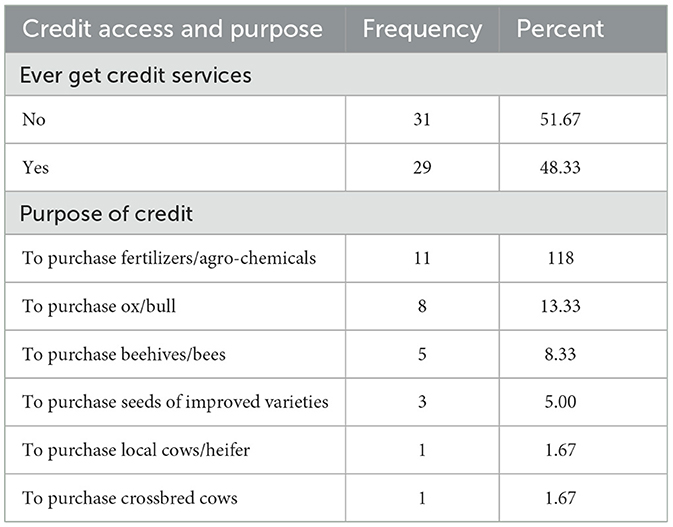
Table 14. Credit access and purpose.
Although there are different sources of credit for farmers, the only available source for households in the study area was a microfinance institution.
3.1.11 Natural resource status of the watershed
3.1.11.1 Source of water for livestock
Water is one of the most valuable natural resources on earth without which mankind and animals cannot survive. It is the main constituents of animals' body, forming 50 to 80% of live weight depending on age and degree of fatness. Without question, water is the most basic prerequisite for all forms of life and this certainly is no new wisdom. The general held adage “water is life” indicates that the entire living world is intimately associated with an unbroken lifeline of water (Nicholson, 1985). The most logical way of overcoming water scarcity problem, in the meantime, would be to turn the scarcity to an advantage as a management tool for livestock production through conservation, optimum use and efficient management of the scarce resource (Edwards et al., 1983; Duguma et al., 2011). The main source of water for livestock is stream/river, which covers 61% of the consumption (Figure 5).
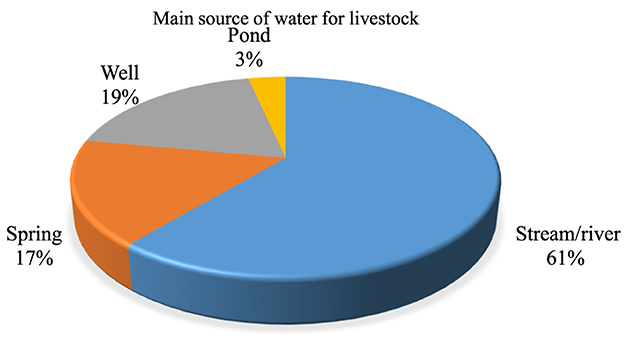
Figure 5. Source of water for livestock watering.
3.1.11.2 Water resource for irrigation
Irrigation is the controlled use of multiple water sources in a timely manner for increased or sustained crop production. Irrigation comprises of the water that is applied by an irrigation system during the growing season and also includes water applied during field preparation, pre-irrigation, weed control, harvesting, and for leaching salts (Dieter, 2018).
In the current study, the respondents reported that they have faced different challenges that discouraged them to advance and increase the sector. From the total of the household, only 35% have irrigation land but the majority of the households (65%) did not have irrigation land (Figure 6).
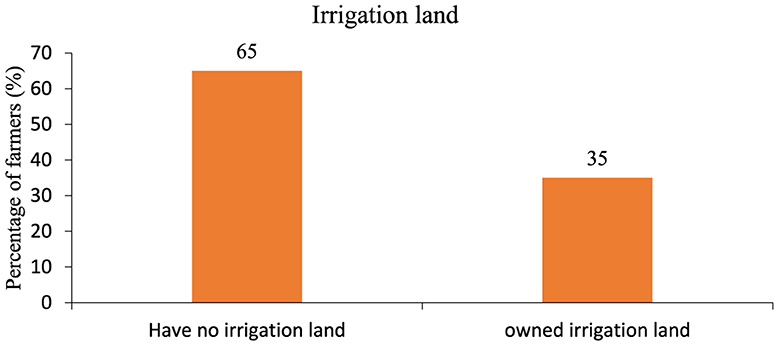
Figure 6. Irrigation water accessibility of the households in the watershed (%).
3.1.11.3 Watershed degradation
Watershed degradation is the loss of value over time, including loss of the productive potential of land and water, accompanied by significant changes in the hydrological behavior of the river system which results in the lower quality, quantity and timing of the water flow. It is the outcome of the interaction of physiographic features, climate and poor land use, as well as other human activities. Watershed degradation accelerates ecological degradation, reduces economic opportunities and increases social problems (Desta, 2015). Figure 7 shows the level of the watershed community to understand whether the watershed faces degradation or not.
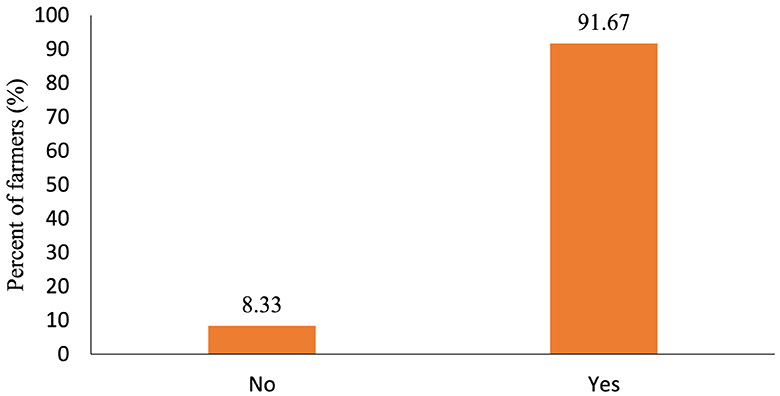
Figure 7. Understanding the degradation of natural resource in Mefakiya watershed.
3.1.11.4 Energy use in Mefakiya watershed
Cooking is the most universal residential energy saving. It is responsible for around 5% of all greenhouse gas emission worldwide, which is about 2 billion tons of CO2 equivalent emissions per year. Around three quarters of this is due to inefficient biomass or coal-based cooking in developing countries. Around 50% of energy for this solid-fuel cooking could be saved with very low costs and high net benefits. Switching to energy-efficient and low-carbon modern cooking appliances may allow even higher savings but at higher costs (Adria et al., 2013).
According to observation and understanding of the sample households, forest land was changed to crop land and grazing land. From the total of household, 93% do not use improved stoves. Only 7% of the household used improved stoves (Figure 8). This indicates the presence of high pressure on forest resource for cooking.
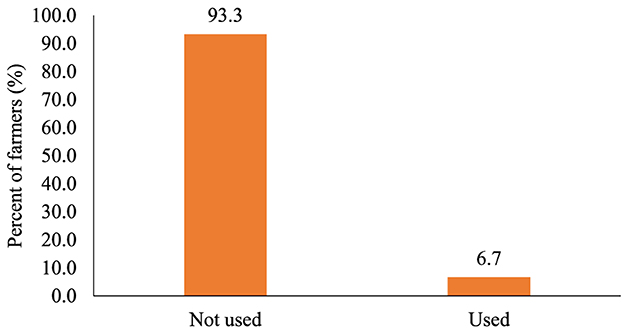
Figure 8. Use of fuel saving stoves in Mefakiya watershed (%).
3.1.11.5 Soil and water conservation practice
The majority of the households (97%) have experience in soil and water conservation practices. Among the soil and water conservation practices, soil bund was dominantly practiced structure in the study area that was practiced by 95% of the sample households. In our observation during the field visit, more than six active gullies were found in the study area. However, gully rehabilitation was not practiced in the watershed.
3.1.12 Constraints and opportunities in the watershed
3.1.12.1 Major constraints in the watershed
Problems that affect watersheds are complex and long-term in nature. Watersheds provide essential livelihoods for their watershed community, but their natural resources are finite, often under pressure and at risk of degradation. Degradation caused by unsustainable exploitation of natural resources is usually the key problem. It leads to poverty, food insecurity and social conflict. The negative socio-economic consequences of unsustainable resources use are significant.
During the study period, the watershed committee were participated during all steps of watershed development plan (Figure 9). Shortage of drinking and irrigation water, lack of electric facility, and soil erosion and decline of soil fertility were the top three constraints for Mefakiya watershed community (Table 15). In addition, the watershed community has challenged by a lack of improved agronomic practices poor crop and livestock management, unpredictable climate conditions, and land degradation.
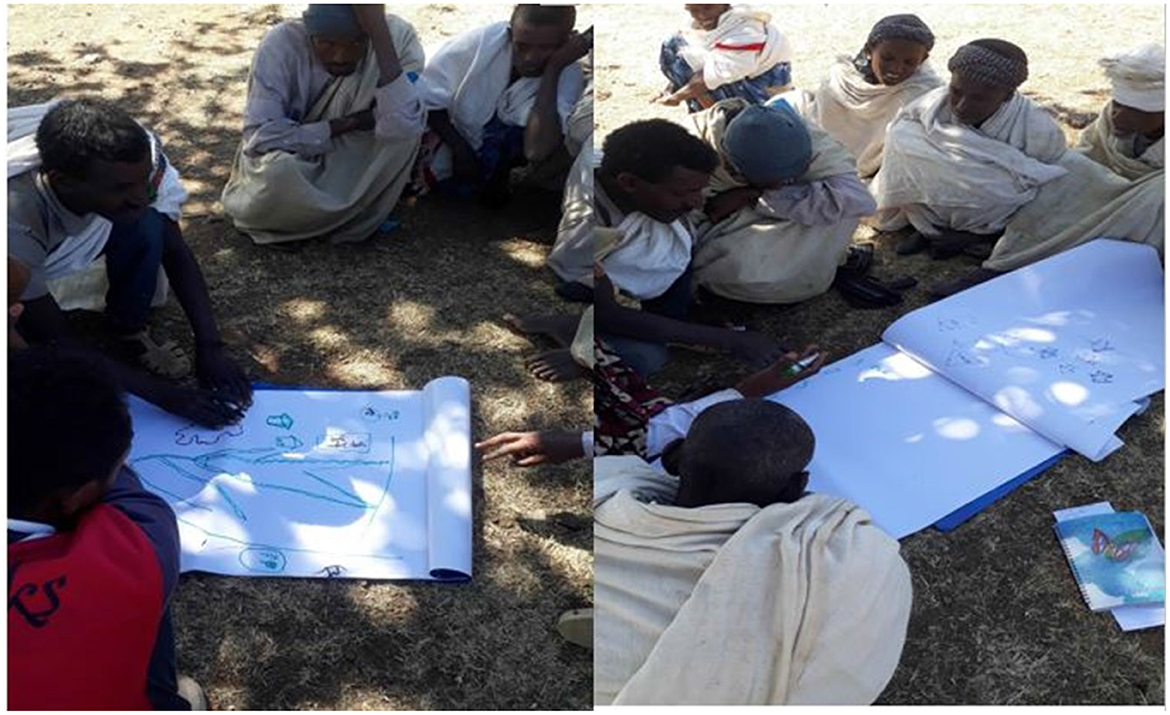
Figure 9. Watershed delineation and problem identification.
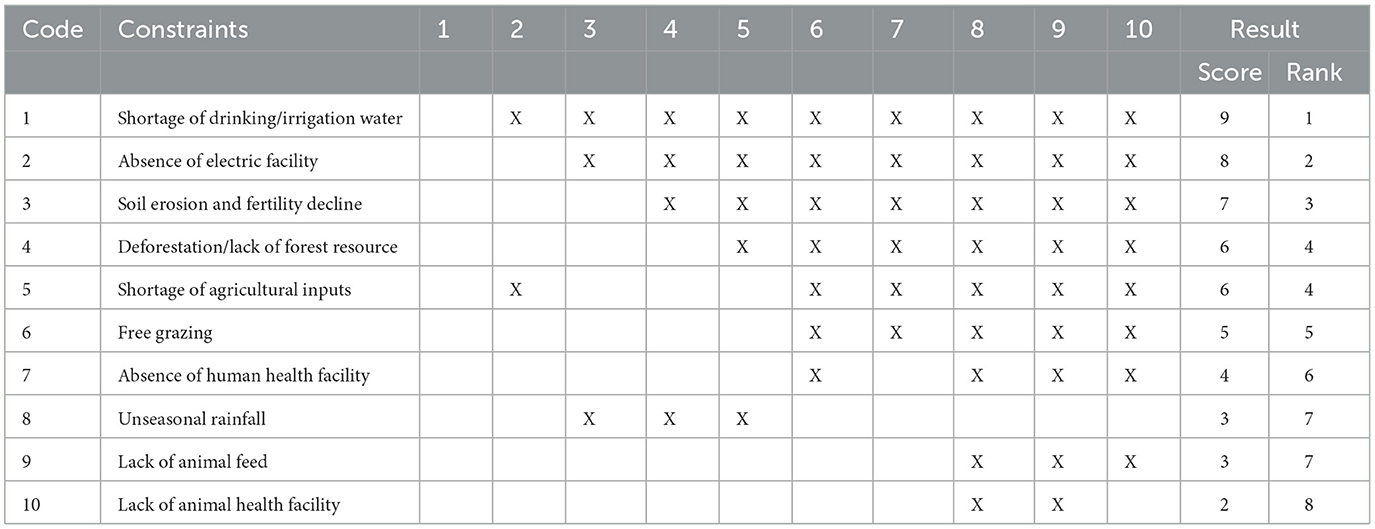
Table 15. Major constraints in Mefakiya watershed.
3.1.12.2 Opportunities in the watershed
In the current study, opportunities for the widespread adoption of watershed management technologies include improvements in socioeconomic conditions like access to roads, access to markets, and access to school (Tables 16, 17). In addition, the watershed community has good experiences with natural resource conservation, farm diversification, and understanding the complementarity of crop and livestock systems (Tesfahunegn and Ayuk, 2021).
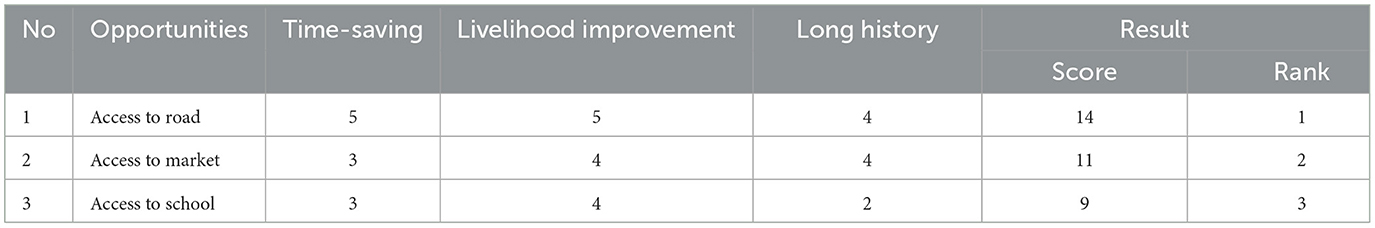
Table 16. Pairwise matrix for identified opportunities in the Mefakiya watershed.
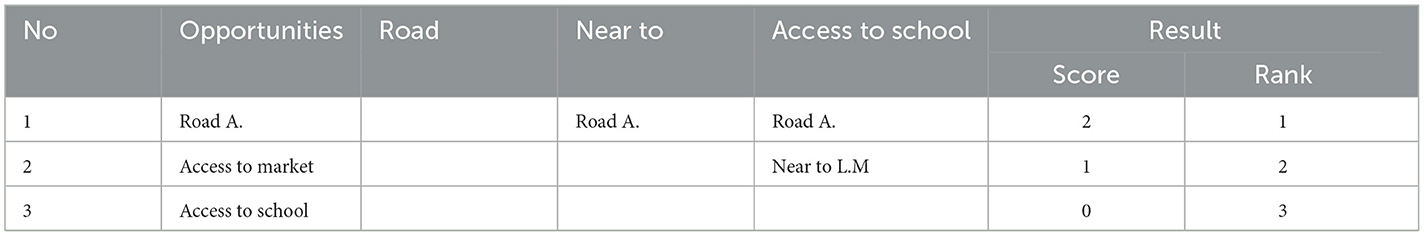
Table 17. Pairwise matrix for identified opportunities in the Mefakiya watershed.
3.2 Discussion
The average family size of the sample households were five persons, with a range of 1–10 persons, which is slightly higher than the average household size reported in the Ethiopia socioeconomic survey of 2015/2016, where the average household size for the Amhara region is 4.2. The main reason for the large average family size was the lack of family planning (Shonde, 2017; Gamo et al., 2021). In the interviewed households, male household members constitute a slightly larger portion of the household composition, representing 50.3% of the total members. The average age of the heads of the sampled household was 44 years, with a minimum age of 25 years and a maximum age of 75 years. In terms of age distribution in the household, the active labor force (15–64 years) occupied a higher proportion (52% of the total respondents).
Agriculture was the major source of income in the study area, which encompasses 98% of the households. This result consistent with the findings of Mamo (2022). They were engaged in crop farming and the rearing of the livestock. This is similar to the studies conducted by Desta et al. (2005b), Darghouth et al. (2008), Reddy (2010), and (Berhe et al., 2017) in rural Ethiopia. In addition to farming, a significant number of farm households were engaged in non/off-farm activities such as working as daily laborers and trading to supplement the income from farming activities as another livelihood source for the farmers in the watershed.
All of the sampled households obtained income from sales of crops, and the mean value of income from crop and livestock sales was 18,009 and 17,189 birr/year, respectively. A substantial proportion of the households also participated in trading (15%) and daily labor (8%) for income generation and obtained annual incomes of 11,000 and 4,450 birr, respectively. The main problem concerning the operational land size in the study area was small and fragmented land holdings, which resulted in management difficulties and ultimately less productivity. The shortage of land is a basic problem in the study area to maximize agricultural production. This is in line with the studies conducted by Singh and Masuku (2014) and Shonde (2017).
Cereal crops such as maize, finger millet, teff, and rice, the predominant crops in the Mefakiya watershed, are produced by 98, 92, 68, and 47% of the sampled households, respectively. Vegetables and other crops such as fruits and sunflowers were also produced in the study area. Among cereals, rice was the most productive crop, yielding 5,126 kg/ha, followed by maize (3,226 kg/ha) and finger millet (2,664 kg/ha), whereas teff yielded the least among cereals, which was equal to 1,585 kg/ha. The yields of maize and teff observed in this study area were lower than the South Gondar yield reported, while the yields of rice were far higher than the national average (3,145 kg/ha), and finger millet showed slightly higher yields than the national and South Gondar results of 2,504 and 2,418 kg/ha, respectively (CSA, 2021).
The major reason for not adopting row planting methods for cereals (teff, rice, and others) could be the labor-demanding nature of the practice. Studies show that there is no significant yield difference between the two sowing methods (broadcasting and row). Teff row planting is very low as compared with the previous study conducted in East Gojam, where more than half of the growers adopted the row planting method (Ayal et al., 2018).
Agricultural extension is believed to be the primary mechanism that enhances agricultural production. It is expected to contribute to improve farming, commercialization, educating farmers, conserving natural resources, promoting new technologies, promoting sustainable agriculture, and disseminating information across various settings that could be done by government and non-governmental organizations' interventions in farming households in the form of information, knowledge, and skills that can help boost the adoption of improved agricultural technologies (Gebremedhin et al., 2006). The majority of the households had access to extension services related to crop (78%), livestock (70%), and natural resource management (87%) in the study area.
In the study area, four water sources were identified (Figure 5), namely streams/rivers (61%), wells (19%), springs (17%), and ponds (3%) in terms of their occurrence and tracking from their source. Rivers and streams were the dominant sources for livestock watering. This study is in line with previous studies that reported the dominant source of water for livestock were rivers and streams (Duguma et al., 2011).
Based on our observation and satellite images, the study area has higher levels of natural resource degradation. The respondents well-understood the natural resource degradation of their environment. According to their observation and understanding, the forest land was changed to crop land and grazing land. Based on the respondents' understanding, there has been poor crop land management due to poor soil and water conservation practices. Even the croplands were cultivated without fallowing or with high removal of organic matter for many years. In the current study, 92% of the respondents believed that there was a degradation of natural resources in the Mefakiya watershed. Understanding the natural resource degradation of the Mefakiya watershed is similar to a previous study conducted in Kindo Didaye district, southern Ethiopia (Mena et al., 2018).
Based on the observation and understanding of the sampled households, forest land was changed to crop land and grazing land. Of the total households, 93% did not use improved stoves. Only 7% of the households used improved stoves. This indicates the presence of high pressure on forest resources for cooking. Stone bund, waterway, Fanya juu, terracing, and half-moon were the most commonly practiced soil and water conservation measures in the current study area, covering 57, 8, 7, 5, and 5%, respectively (Figure 10). The results obtained in this study is consistent with previous studies that reported the dominance of soil bund in the watershed (Tesfay et al., 2020). In the current study, land degradation in the form of soil erosion and declining soil fertility are also serious challenges to agricultural productivity and economic growth. This study is supported by the studies conducted by Bishaw (2001), Lemenih (2004), Desta et al. (2005a), Khajuria et al. (2014), and Agidew and Singh (2018).
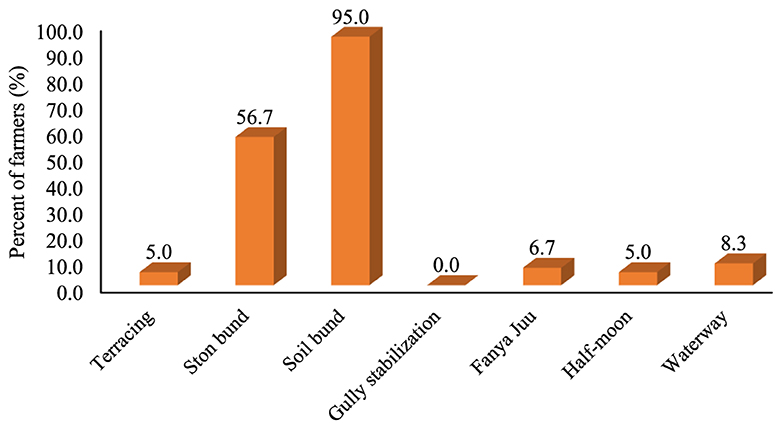
Figure 10. Soil and water conservation practice in the study area (%).
4 Conclusion and recommendation
4.1 Conclusion
This study was aimed to characterize the socioeconomic and biophysical features of the Mefakiya watershed using both qualitative and quantitative data. The total number of the household heads of the watershed was 306. The quantitative data were collected from 60 households, of which 90.2% of the households were male-headed and the remaining 9.8% of the households were female-headed. In the current study, different service providers play a key role in enabling farmers to increase profitability and sustainability of the agricultural produce. The mean distance between the household residence and the market was found to be 3.6 km. Farmers was traveling an average distance of 1.12 km to access drinking water. Maize, finger millet, teff, and rice, the predominant crops in the Mefakiya watershed, were produced by 98.3, 91.67, 68.3, and 46.67 % of the households, respectively. Row planting was not well-practiced by farmers in the watershed community, except for maize and vegetable crops. More than 70% of the sampled households have access to extension services, benefiting from improved technologies in crop production, livestock management, and natural resources management. The study area has higher natural resource degradation. The respondents well-understood the natural resource degradation of their environment. According to their observation and understanding, the forest land was changed to crop land and grazing land. Based on respondents' understanding, there have been poor crop land management due to poor soil and water conservation practices. Based on this finding, 91.6% of the respondents believed that there is a degradation of natural resources in the Mefakiya watershed.
4.2 Recommendations
In the Mefakiya learning watershed, the majority of the watershed community was active in the labor force with the ability of read and write. It is a good opportunity to solve the socioeconomic constraints and natural resource degradation in the watershed by leveraging the abundant labor force. The adoption of technologies such as row planting of crops and using improved varieties were very low in the watershed community. Therefore, extension service should be revised to effectively address the needs of the watershed community. The shortage of drinking and irrigation water, lack of electricity, and soil erosion along with declining soil fertility were identified as the top three constraints of the Mefakiya watershed community. Furthermore, the adoption of water harvesting technologies should be focused.
The study area has higher natural resource degradation. An integrated approach is very important for the sustainable use of watershed resources. Therefore, attention should be given to make the Mefakiya watershed more productive for the watershed community by improving their awareness on integrating crops, livestock, and natural resource management technologies for effective soil and water conservation measures. EIAR-CALM project is a great opportunity for the rehabilitation of degraded lands and introduction and dissemination of climate smart agricultural technologies.
This finding contributes to the available knowledge by identifying the socioeconomic factors associated with the watershed community, where there have only been limited studies. This study was highly focused on socioeconomic aspects and current natural resource use/major constraints that faced the watershed community. Our study, similar to other studies, have limitations. The study did not investigate some aspects of the watershed community such as empowerment of gender issues in participation. Furthermore, it did not consider the biophysical aspects of the watershed community. Therefore, future studies are necessary to investigate the biophysical aspects of the watershed community and to improve the impact of development works on the livelihood of the community.
Data availability statement
The original contributions presented in the study are included in the article/supplementary material, further inquiries can be directed to the corresponding author.
Ethics statement
Ethical review and approval was not required for the study on human participants in accordance with the local legislation and institutional requirements. Written informed consent from the [patients/participants OR patients/participants legal guardian/next of kin] was not required to participate in this study in accordance with the national legislation and the institutional requirements. Written informed consent was obtained from the individual(s) for the publication of any identifiable images or data included in this article.
Author contributions
MM: Conceptualization, Data curation, Investigation, Methodology, Supervision, Writing – original draft, Writing – review & editing. DB: Supervision, Writing – review & editing. MB: Software, Writing – review & editing.
Funding
The author(s) declare that no financial support was received for the research, authorship, and/or publication of this article.
Acknowledgments
The authors would like to acknowledge the EIAR-Climate Action through Landscape Management (CALM) project for financial support for this research. We also acknowledge all watershed team members and senior researchers for their valuable comments during the review forum.
Conflict of interest
The authors declare that the research was conducted in the absence of any commercial or financial relationships that could be construed as a potential conflict of interest.
Publisher's note
All claims expressed in this article are solely those of the authors and do not necessarily represent those of their affiliated organizations, or those of the publisher, the editors and the reviewers. Any product that may be evaluated in this article, or claim that may be made by its manufacturer, is not guaranteed or endorsed by the publisher.
Footnotes
1. ^1 USD is equivalent to 44.32 birr as of 2021.
2. ^Tropical livestock units, used to convert different species into comparable units. Cow/oxen/bull = 1; heifer = 0.75 calf = 0.34; donkey = 0.7; sheep/goat = 0.13; 1 chicken = 0.013; and horse/mule = 1.1.
References
Adria, O., Bethge, J., Volkmer, H., and Salow, S. (2013). What Users Can Save With Energy-Efficient Cooking Stoves and Ovens. Wuppertal: Wuppertal Institute for Climate, Environment and Energy.
Agidew, A. M. A., and Singh, K. (2018). Factors affecting farmers' participation in watershed management programs in the Northeastern highlands of Ethiopia: a case study in the Teleyayen sub-watershed. Ecol. Process. 7, 1–15. doi: 10.1186/s13717-018-0128-6
Agol, D., Latawiec, A. E., and Strassburg, B. B. (2014). Evaluating impacts of development and conservation projects using sustainability indicators: opportunities and challenges. Environ. Impact Assess. Rev. 48, 1–9. doi: 10.1016/j.eiar.2014.04.001
Anantha, K., Wani, S. P., and Sreedevi, T. (2009). Baseline Socio-economic Characterization of Watersheds. Patancheruvu.
Ayal, M., Negash, R., and Abebe, A. (2018). Determinants of adoption of teff row planting practice: the case of Baso Liben Woreda, East Gojjam Zone, Amhara Region, Ethopia. Int. J. Curr. Res. Acad. Rev. 6, 16–22. doi: 10.20546/ijcrar.2018.610.003
Berhe, M., Hoag, D., Tesfay, G., and Keske, C. (2017). Factors influencing the adoption of biogas digesters in rural Ethiopia. Energy Sustainabil. Soc. 7, 1–11. doi: 10.1186/s13705-017-0112-5
Bishaw, B. (2001). Deforestation and land degradation in the Ethiopian highlands: a strategy for physical recovery. Northeast Afri. Stud. 14, 7–25. doi: 10.1353/nas.2005.0014
Chen, B., Qiu, Z., Usio, N., and Nakamura, K. (2018). Tourism's impacts on rural livelihood in the sustainability of an aging community in Japan. Sustainability 10:2896. doi: 10.3390/su10082896
CSA (2021). Central Statistical Agency of Ethiopia. Crop Production and Productivity. Addis Ababa: CSA.
Darghouth, S., Ward, C., Gambarelli, G., Styger, E., and Roux, J. (2008). Watershed Management Approaches, Policies, and Operations: Lessons for Scaling Up. Washington, DC.
Desta (2015). Learning Watershed. An Approach for Partcipatory Integrated Land and Water Management and Livelihood Improvement. Atlanta, GA: Desta.
Desta, L., Carucci, V., Wendem-Agenehu, A., and Abebe, Y. (2005a). Community-based Participatory Watershed Development: A Guideline. Addis Ababa: Ministry of Agriculture and Rural Development.
Desta, L., Carucci, V., Wendem-Agenehu, A., and Abebe, Y. (2005b). Community Based Participatory Watershed Development. A Guideline. Addis Ababa: Ministry of Agriculture and Rural Development.
Dieter, C. A. (2018). Water Availability and Use Science Program: Estimated Use of Water in the United States in 2015. Geological Survey.
Duguma, B., Tegegne, A., and Hegde, B. (2011). An assessment of availability of livestock drinking water resources, patterns of exploitation and management strategies at Ginchi Watershed, Ethiopia. Am. Eurasian J. Agron. 4, 38–45.
Edwards, K., Classen, G., and Schroten, E. (1983). The Water Resource in Tropical Africa and Its Exploitation. Addis Ababa.
FAO (2006). Guidelines for Soil Description. Rome: Food and Agriculture Organization of the United Nations.
Gamo, B. R., Mekonnen, G. T., Habebo, T. W., and Park, D. B. (2021). Socio-economic analysis of sub-watershed development impacts: a case study from Ethiopia. J. Rural Community Dev. 16, 199–203.
Gebremedhin, B., Hoekstra, D., and Tegegne, A. (2006). Commercialization of Ethiopian Agriculture: Extension Service From Input Supplier to Knowledge Broker and Facilitator. Nairobi: International Livestock Research Institute.
Goodwin, H., and Santilli, R. (2009). Community-Based Tourism: A Success. ICRT Occasional Paper, 11:37.
Khajuria, A., Yoshikawa, S., and Kanae, S. (2014). Adaptation technology: benefits of hydrological services-watershed management in semi-arid region of India. J. Water Resour. Protect. 2014:66055. doi: 10.4236/jwarp.2014.66055
Lantz, E., and Tegen, S. (2009). Economic Development Impacts of Community Wind Projects: A Review and Empirical Evaluation.
Lemenih, M. (2004). Effects of Land Use Changes on Soil Quality and Native Flora Degradation and Restoration in the Highlands of Ethiopia, Vol. 306.
Lucchetti, V. G., and Font, X. (2013). Community Based Tourism: Critical Success Factors. ICRT Occasional Paper (OP27).
Mamo, A. A. (2022). Socio-economic Characterization of Community in Watershed Management: Case of Abaya-Chamo Sub-Basin Project Districts of Southern Ethiopia. Austria.
Mena, M. M., Madalcho, A. B., Gulfo, E., and Gismu, G. (2018). Community adoption of watershed management practices at Kindo Didaye District, Southern Ethiopia. Int. J. Environ. Sci. Nat. Resour. 14:555881. doi: 10.19080/IJESNR.2018.14.555881
Nega, F., Mathijs, E., Deckers, J., Haile, M., Nyssen, J., and Tollens, E. (2010). Rural poverty dynamics and impact of intervention programs upon chronic and transitory poverty in Northern Ethiopia. Afri. Dev. Rev. 22, 92–114. doi: 10.1111/j.1467-8268.2009.00229.x
Nicholson, M. (1985). The water requirements of livestock in Africa. Outl. Agricult. 14, 156–164. doi: 10.1177/003072708501400401
Okkonen, L., and Lehtonen, O. (2016). Socio-economic impacts of community wind power projects in Northern Scotland. Renew. Energy 85, 826–833. doi: 10.1016/j.renene.2015.07.047
Palanisami, K., and Kumar, D. S. (2009). Impacts of watershed development programmes: experiences and evidences from Tamil Nadu. Agri. Econ. Res. Rev. 22, 387–396.
Rasoolimanesh, S. M., Jaafar, M., Ahmad, A. G., and Barghi, R. (2017). Community participation in World Heritage Site conservation and tourism development. Tour. Manag. 58, 142–153. doi: 10.1016/j.tourman.2016.10.016
Sebele, L. S. (2010). Community-based tourism ventures, benefits and challenges: Khama rhino sanctuary trust, central district, Botswana. Tour. Manag. 31, 136–146. doi: 10.1016/j.tourman.2009.01.005
Shonde, Y. (2017). Livelihood contributions of Moringa tree based agroforestry practices in Konso district, southern Ethiopia. J. Resour. Dev. Manag. 36, 2422–8397.
Singh, A. S., and Masuku, M. B. (2014). Sampling techniques & determination of sample size in applied statistics research: an overview. Int. J. Econ. Commerce Manag. 2, 1–22.
Singh, P., Behera, H., and Singh, A. (2010). Impact and effectiveness of 'watershed development programmes' in India. Mussorrie India Centre Rural Stud. 29, 1–55.
Tesfahunegn, G. B., and Ayuk, E. T. (2021). Opportunities and challenges to adopting sustainable watershed management interventions: an overview of experiences from Ethiopia. A Nexus Approach for Sustainable Development: Integrated Resources Management in Resilient Cities and Multifunctional Land-use Systems, 165–183.
Tesfay, W., Assaye, Y., and Mussema, D. T. A. R. (2020). Socio-economic Characterization of Mitkie Learning Watershed of Pawe District, North Western Ethiopia. Addis Ababa.
Keywords: baseline survey, characterization, constraints, social aspect, Mefakiya watershed
Citation: Mohammed M, Bekele D and Bazie M (2024) Baseline socioeconomic characterization and resource use of the community in the Mefakiya watershed. Front. Sustain. Food Syst. 8:1347866. doi: 10.3389/fsufs.2024.1347866
Received: 01 December 2023; Accepted: 09 April 2024;
Published: 03 May 2024.
Edited by:
Sanzidur Rahman, University of Reading, United KingdomReviewed by:
Josef Abrham, Czech University of Life Sciences Prague, CzechiaJana Soukupová, Czech University of Life Sciences Prague, Czechia
Copyright © 2024 Mohammed, Bekele and Bazie. This is an open-access article distributed under the terms of the Creative Commons Attribution License (CC BY). The use, distribution or reproduction in other forums is permitted, provided the original author(s) and the copyright owner(s) are credited and that the original publication in this journal is cited, in accordance with accepted academic practice. No use, distribution or reproduction is permitted which does not comply with these terms.
*Correspondence: Mekin Mohammed, mekinmmd@gmail.com
†ORCID: Mekin Mohammed orcid.org/0000-0003-2370-4855