Analysis of drying characteristic, effective moisture diffusivity and energy, exergy and environment performance indicators during thin layer drying of tea in a convective-hot air dryer
 Zhiheng Zeng1,2†
  Chongyang Han
 Bin Li
- 1College of Intelligent and Manufacturing Engineering, Chongqing University of Arts and Sciences, Chongqing, China
- 2College of Engineering, South China Agricultural University, Guangzhou, China
- 3Chongqing College of Finance and Economics, Chongqing, China
The objective of this study is mainly to analyze the drying kinetic parameters, effective diffusivity, and thermodynamic performance indicators (energy, exergy, heat, and mass transfer coefficients) of tea under different drying conditions of different drying temperatures (DT) and thin layer thicknesses (TT). Experimental drying was conducted at drying temperatures of 70°C, 80°C, and 90°C with thin layer thicknesses of 10 mm, 15 mm, and 20 mm. The results show that a higher drying temperature and a lower thin layer thickness can increase evaporation moisture content and shorten drying time. By evaluating and comparing the fitting of five drying models adopted by the coefficient of determination (R2) and chi-square (χ2), it can be found that the logarithmic model is the best to describe drying behavior. The effective moisture diffusivity shows a positively correlated trend with the increase in DT and TT, with the value of activation energy ranging from 14.030 to 22.344 kJ mol−1 K−1. The specific moisture evaporation rate (SMER), energy efficiency, exergy efficiency, and sustainability index (SI) descend as the TT increases at all DT; the specific energy consumption (SEC) and improvement potential (IP) rate perform in an opposite manner, but the TT remains unchange. The conclusion drawn from the thermodynamic parameters is opposite to the aforementioned. As the TT increases, the heat and mass transfer coefficients show a significant decrease trend. In addition, the heat and mass transfer coefficients are given as functions of DT and TT, and further knowledge shows that the mass transfer coefficient is positively correlated with DT but the heat transfer coefficient is negatively correlated. In conclusion, this article provides new insights into the effects of drying characteristics, energy consumption characteristics and heat and mass transfer characteristics in the process of tea drying under different drying conditions, and provides certain theoretical reference bases for promoting the optimization of industrialized tea drying production machinery design and drying process optimization.
1 Introduction
As an emerging healthy green beverage, tea is gradually gaining ubiquitous popularity among the public (Yu et al., 2020). Tea is rich in many trace elements that are beneficial to human health, such as non-protein-derived amino acids, polyphenols, and proteins (Yi et al., 2019). Many researchers reported that these trace elements significantly reduce the risk of cardiovascular disease, high cholesterol, diabetes, and osteoporosis (Tang et al., 2011). China is one of the six major tea producing countries in the world, accounting for approximately 42% of the global production. According to research reports from some relevant institutions, the production of tea reached 2.97 million tons in 2020 (Jiang et al., 2023; Shu et al., 2023; Zhang et al., 2023). However, freshly harvested tea has high moisture content and needs to be dried and dehydrated through the drying process to reduce the moisture content below 5%. Drying to remove water is a traditional operation that extends food storage time. Its main function is to inhibit the activity of microorganisms and enzymes, to ensure the safety of storage quality and extend the storage time of agricultural products (Mujumdar, 2006; Khalloufi et al., 2014; Datta, 2015).
Thin-layer drying is a commonly used drying method in laboratory-level experiments, with a thickness of generally 1–3 cm (Fathi et al., 2016). Because drying is an energy-intensive behavior involving heat and mass transfer (Erbay and Icier, 2010), thin-layer drying can provide a more straightforward analysis of the drying mechanism of materials. Therefore, based on thin-layer drying, some models describing drying kinetics have been developed, which can further analyze the development of drying systems, parameter optimization, data prediction, effective moisture diffusion coefficient, and activation energy (Franco et al., 2017; Mishra et al., 2021). At present, the models commonly used to describe thin layer drying dynamics and drying characteristics include the Lewis model, the Page model, the Modified Page model, the Logarithmic model, the Henderson and Pabis model, the Exponential model, and the Modified Exponential model (Onwude et al., 2016; Duc Pham et al., 2019). The development of a thin layer drying model can help researchers to gain further knowledge and analyze the mechanisms of heat and mass transfer during the drying process and also provide more accurate prediction results for designers, which is more conducive to the design of the dryer. The findings of this study can serve as a guide for tea’s thin-layer drying technique.
The aforementioned models have been used in research on tea’s thin-layer drying technique to characterize its properties. For example, Panchariya et al. studied and determined black tea’s thin-layer drying kinetic characteristics by developing an experimental dryer in the temperature range of 80–120°C. Compared with models such as Page, the Lewis model can better describe the thin-layer drying characteristics of black tea (Panchariya et al., 2002). Weiwei et al. studied the effects of vacuum pressure and microwave power on the drying characteristics of green tea. They found that the page model is the best model to describe the microwave vacuum drying of green tea (Wei et al., 2010). Similar findings were also reported by Dutta and Baruah (2014). In addition, the thin layer model has also been applied to demonstrate and evaluate the drying characteristics of other plant-based leaves, such as Malabar spinach leaves (Kumar et al., 2023) and mint leaves (Taheri-Garavand et al., 2021). However, few literature reports explore the effects of different drying temperatures and thin layer thicknesses on drying kinetics and thermodynamic performance indicators, whether the thin layer drying of tea leaves and other plant-based leaves. Thermodynamic performance indicators, such as energy efficiency, exergy efficiency, and heat and mass transfer coefficient, play an important role in evaluating the design of drying machinery and the optimization of drying processes. According to the introduction from some reports, the energy consumption of the food drying industry, especially the industrial food drying industry, accounts for approximately 10% of the overall energy demand (Li et al., 2019; Yahya et al., 2022). Therefore, it is of great significance to analyze the effects of different drying temperatures and thin layer thickness conditions on tea’s drying characteristics and thermodynamic performance indicators during the drying process, further promoting its mechanical design optimization and drying process optimization in industrial tea drying production.
The major objectives of this study are summarized as follows: (1) exploring the effects of different drying temperatures and tea layer thickness on drying kinetic parameters, effective moisture diffusivity, and activation energy; (2) determining the best model for describing and fitting experimental data among the Lewis model, Logarithmic model, Page model, Modified Page model, and Wang & Singh model; and (3) determining the effects of different drying temperatures on thermodynamic performance indicators, including energy efficiency, exergy efficiency, heat, and mass transfer coefficient.
2 Materials and methods
2.1 Raw materials
Raw materials adopted for the present study were fresh tea leaves, one bud with two leaves, or one bud (Varieties “Fuyun No.6”), which were purchased from a local farmer in Shaoping County, Guangxi Zhuang Autonomous Region.
2.2 Sample preparation
Since the moisture content of fresh tea was commonly 72–73%, sample preparation for drying experiments required a series of pretreatments before drying. (1) Fresh tea leaves: one bud and two leaves, undamaged. (2) Withering: the tea leaves were spread on the withering board and placed in a calm and ventilated place; the ambient temperature was 8–20°C, and the withering time was 16 h. (3) Rolling: The length of the kneading operation was 60 min. (4) Fermentation: the tea leaves were placed on the fermentation board after kneading, and the pile of leaves was 5–12 cm thick. It was put in a constant-temperature and constant-humidity environment, in which the temperature was 25°C, the humidity was 90%, and the duration of the fermentation time was 10 h. Tea leaves at the end of fermentation were used for drying test.
2.3 Experimental method and equipment
The test equipment selects a laboratory-grade blast type constant temperature hot air drying oven; the model is shown in Figure 1. The working principle of the blast type constant temperature drying oven includes setting the target temperature, the blower at the bottom of the drying chamber introduces the outside natural air into the drying chamber, and heats the materials in the drying chamber, the exhaust air is discharged from the rear exhaust port at the upper end of the drying chamber, and the air velocity is 1.26 m/s, measured by the anemometer, and the parameters in the drying chamber are displayed in real time by the anemometer. A paperless recorder displays the parameters in the drying chamber in real time. The sample preparation and test procedure are shown in Figure 2. The ambient temperature of the test is 8–20°C, and the humidity of the air is 60–70%, which is in line with the working environment conditions of the blast constant temperature drying oven.
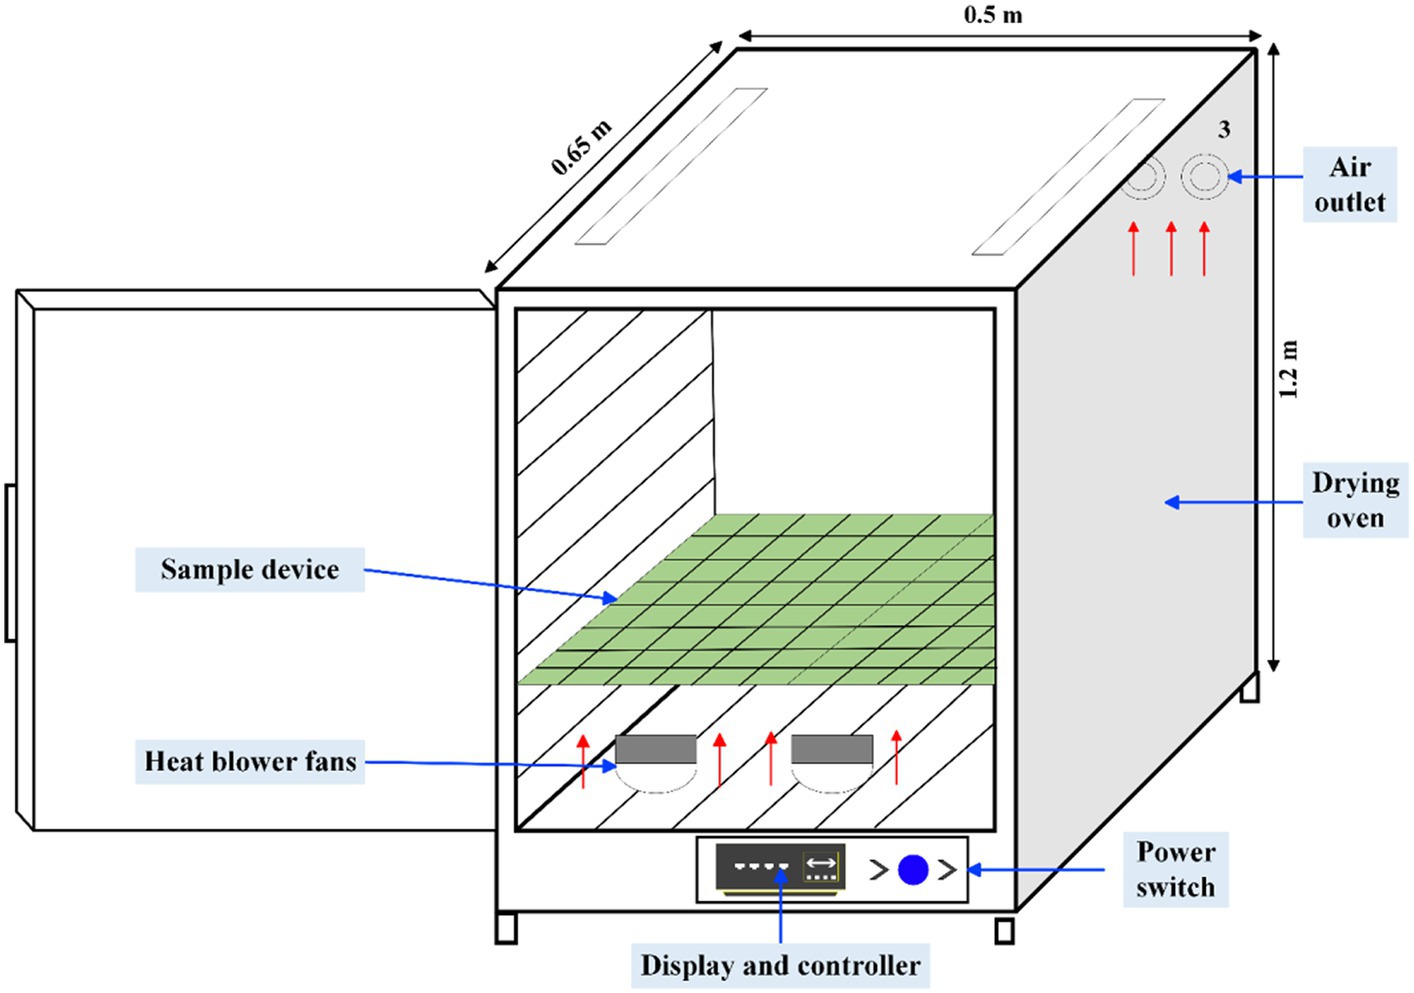
Figure 1. Model drawing of test equipment.

Figure 2. Diagram of tea drying process and test site.
Preheating the drying cabinet before conducting the drying experiment is to reduce the impact of the thermal inertia on the drying experiment (Zeng et al., 2022). A laboratory scale constant temperature hot air cabinet drier was applied to conduct the drying experiment with the hot air temperatures of 70°C, 80°C, and 90°C. The fermented tea sample was spread with the thickness of the thin layer of 10 mm, 15 mm, and 20 mm in food grade circular trays (note: diameter of trays is 200 mm) and placed on a cabinet drier for drying experiment. The initial moisture content of each experimental group was determined by adopting a halogen lamp moisture detector. An electronic precision balance was applied to measure the weight of the sample during the drying process with an interval of 5 min. Until the error between two consecutive weightings was less than 0.1 g (moisture content of less than 5%), the present group of the drying experiment was over. Each set of the above tests was repeated three times, and the recorded data were averaged. The detailed information on the relevant equipment used in the present study is shown in Table 1.
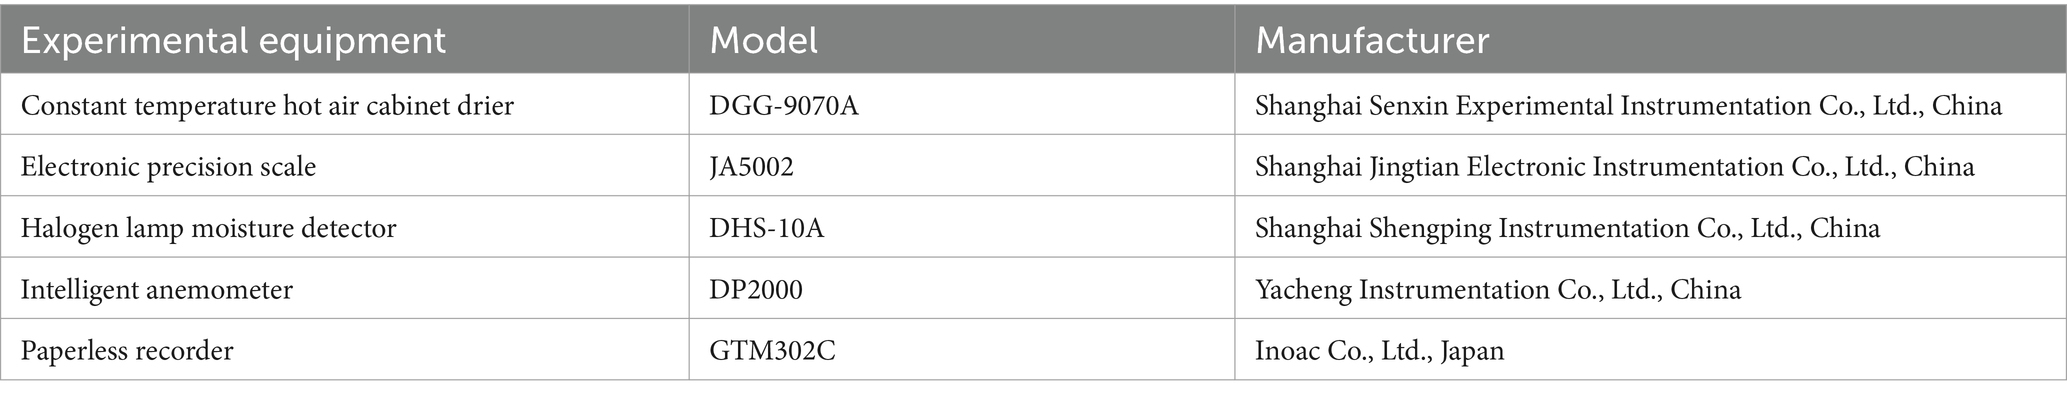
Table 1. Detail description of the relevant experimental equipment.
2.4 Drying kinetics analysis of tea drying
2.4.1 Moisture rate determination
The moisture rate (MR) was widely considered action of the thin layer drying based on Newton’s Law for cooling or heating of solids (Izadi et al., 2020). Therefore, the MR can be expressed as follows Equation (1) (Crank, 1979):
where MR is the moisture rate (%), Mt is the moisture content of tea at any time(%), M0 is the initial moisture content(%), and Me is the equilibrium moisture content(%).
In the present study, Me can be ignored under conditions of high-temperature hot air drying, owing to that its value was extremely less than M0 and Mt (Kamali et al., 2021).
2.4.2 Drying rate determination
The drying rate (DR) of sample is the characterization of the dehydration rate during the drying process. According to the definition of drying rate, the determination of drying rate can be adopted by the following Equation (2) (Ojediran et al., 2021):
where DR is the drying rate during the drying process, Mt + ∆t is the moisture content at t + ∆t, %, and ∆t is the interval time, minute.
2.5 Effective moisture diffusivity and activation energy analysis of tea drying
The calculation of MR can be adopted from a moisture diffusion model developed by Crank, (1979) based on Fick’s Second Law, which is expressed in Equation (3):
where Deff is the effective moisture diffusivity, and lt is the half thickness of thin layer (Dehghannya et al., 2018).
The drying of materials requires a longer time, the Equation (3) above can be abbreviated as Equation (4) follows:
Taking the Equation (4) to logarithm and can be simplified into linearization as shown in Equation (5), and fitting the ln (MR) with drying time (t) to obtain the slope of the linear equation and further estimate the moisture diffusivity (k), detail Equation (6) as shown in following:
where k denotes the slope.
The relationship between moisture diffusivities and drying air temperature were indicated by Arrhenius relationship as shown Equation (7), expression of following Equation (8) was linearized from Arrhenius relationship and plotted it to determine the slope and y-intercept, further to obtain the activation energy of tea and pre-exponential factor (Midilli and Kucuk, 2003).
where Ea refers to the activation energy of tea, Ra refers to the ideal gas constant, Tabs refers to the kelvin temperature, and D0 refers to the pre-exponential factor.
2.6 Energy–exergy performance indicator analysis
In the present study, energy consumption for the convective dryer includes energy of thermal and electrical, can be calculated using Equation (9):
where Pdryer indicates the power of the dryer, and ∆t means interval time for data collection.
Specific energy consumption (SEC) for drying the unit mass (1 kg) of the drying tea sample can be calculated by the following equation (Yahya et al., 2016):
Except for the parameter of SEC, specific moisture extraction rate (SMER) is also a significant parameter to depict the drying characterization, which is defined as per unit energy required to evaporate the moisture. SMER is expressed as the following equation (Ibrahim et al., 2015):
In addition, another parameter to describe the efficiency of the energy consumption of the drying system is the efficiency of the drying process, defined as the ratio of the energy utilized usefully to remove the moisture content from the materials to the total energy, which is calculated by the following equation:
where hfg refers to latent of vaporization with a value of 2.26 kJ/kg.
Unlike energy, which denoted “quantity,“exergy was defined as the “quality” of energy, indicating the most significant amount of usable work input in the drying system as the system reached equilibrium with the surrounding environment. Electricity is the primary source of energy employed in this endeavor. Since the total beneficial work of the dryer in the current study can be estimated, the Equations (13–20) utilized is shown in Table 2.
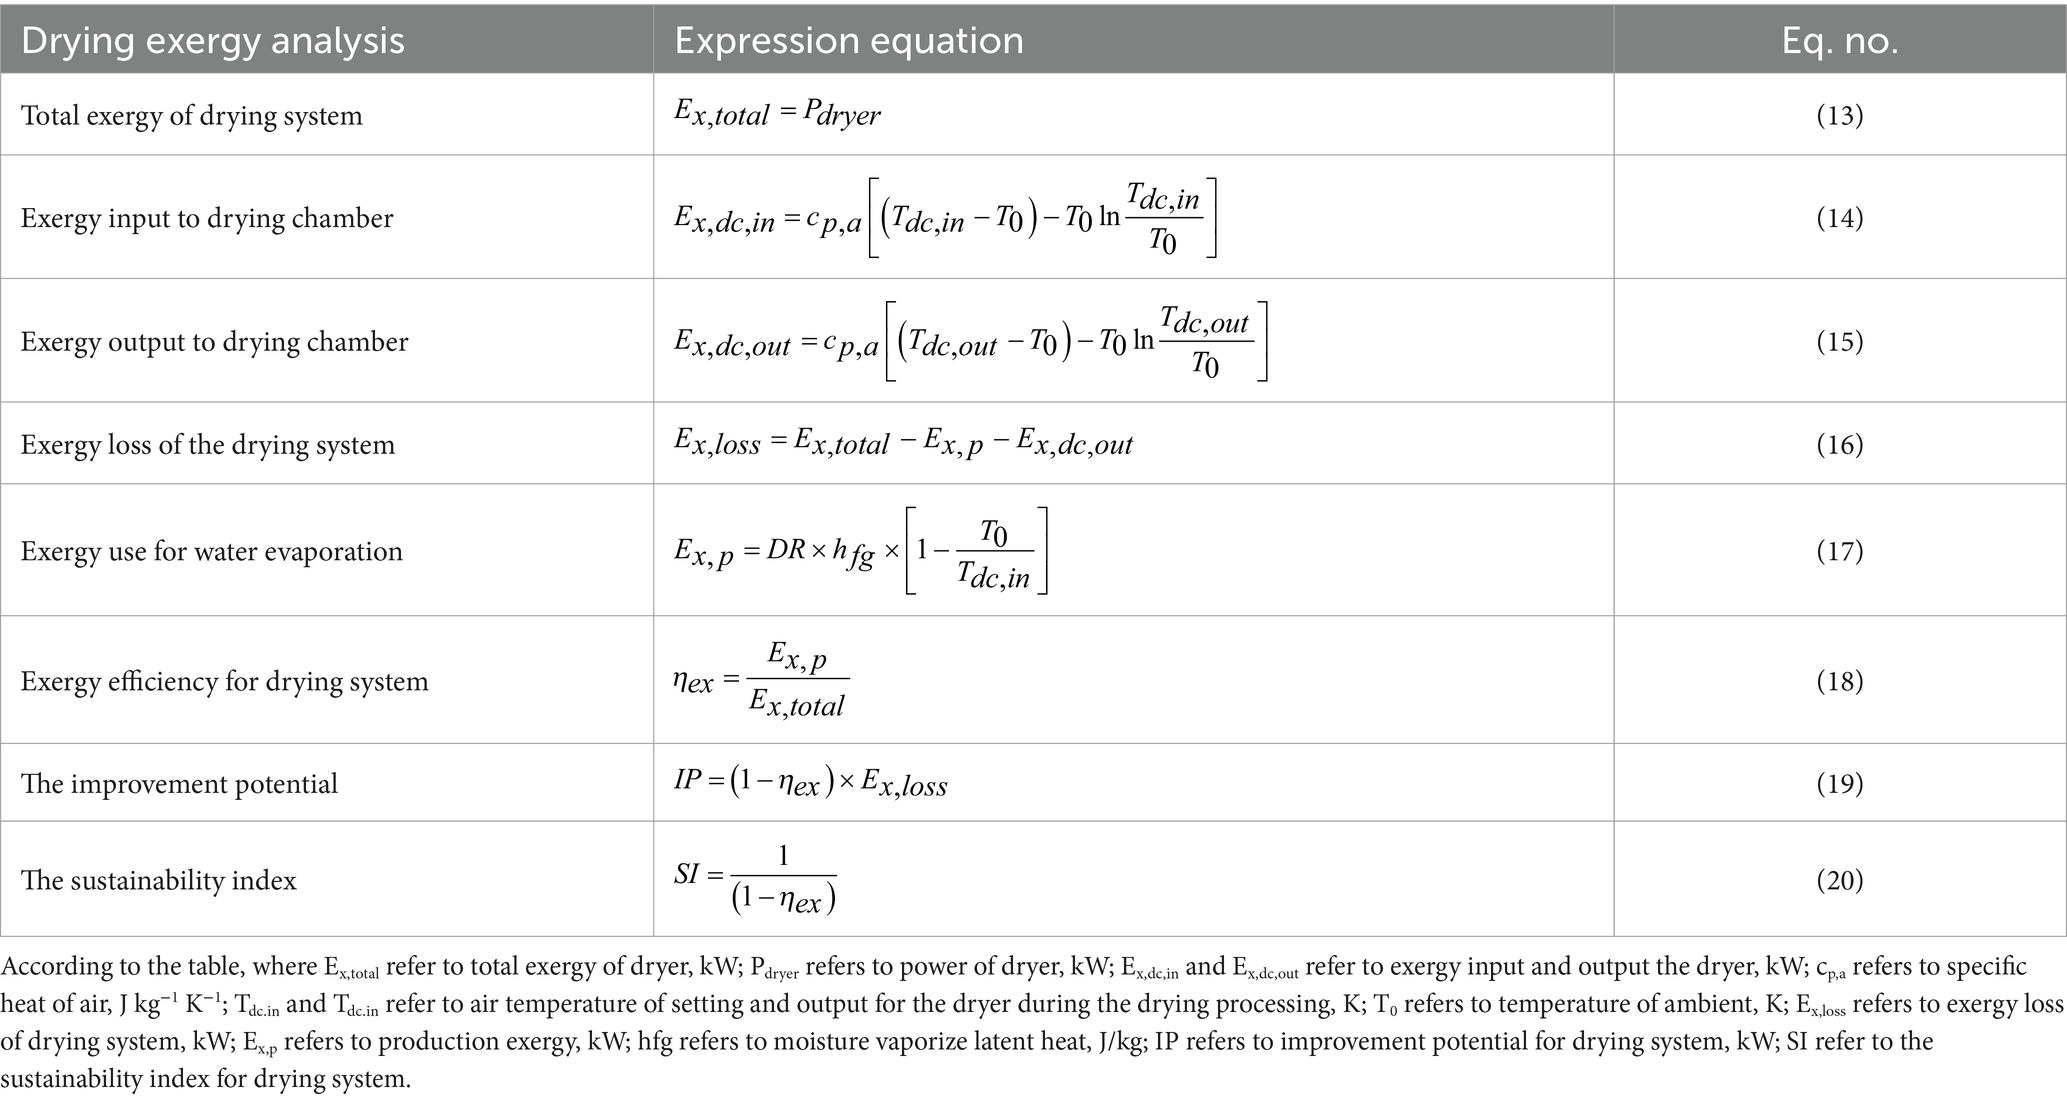
Table 2. Exergy analysis of the present study.
2.7 Heat and mass transfer performance indicator analysis
The heat and mass transfer coefficients for thin layer drying of tea can be obtained via dimensionless numbers, such as the Nusselt number, Sherwood number, and Schmidt number. Accordingly, the calculation depicted the correlations for dimensionless as following Equations (18–20) to estimate the heat and mass transfer coefficients for thin layer drying of tea.
2.8 Evaluation of model fitting to the experimental data
Thin layer drying models have been conducted in scientific studies to describe the drying characteristics of the materials during the drying process based on Fick’s Second Law of moisture content by previous researchers (Azizpour et al., 2014). In the present study, the most commonly used classic thin layer models, Equations (30-34) as shown in Table 3, were selected to fit experimental MR to depict the drying curves. Applied the data processing software of Origin 2023b (Student Free Trial Edition) to fit experimental MR with the thin layer model and adopted the coefficient of determination (R2) and Chi-Square (χ2) along with drying kinetic factors to evaluate the goodness-of-fit of the drying curve and determine the best descriptive model. Corresponding calculations of R2 and χ2 have been given as follows Equations (28-29):
where,
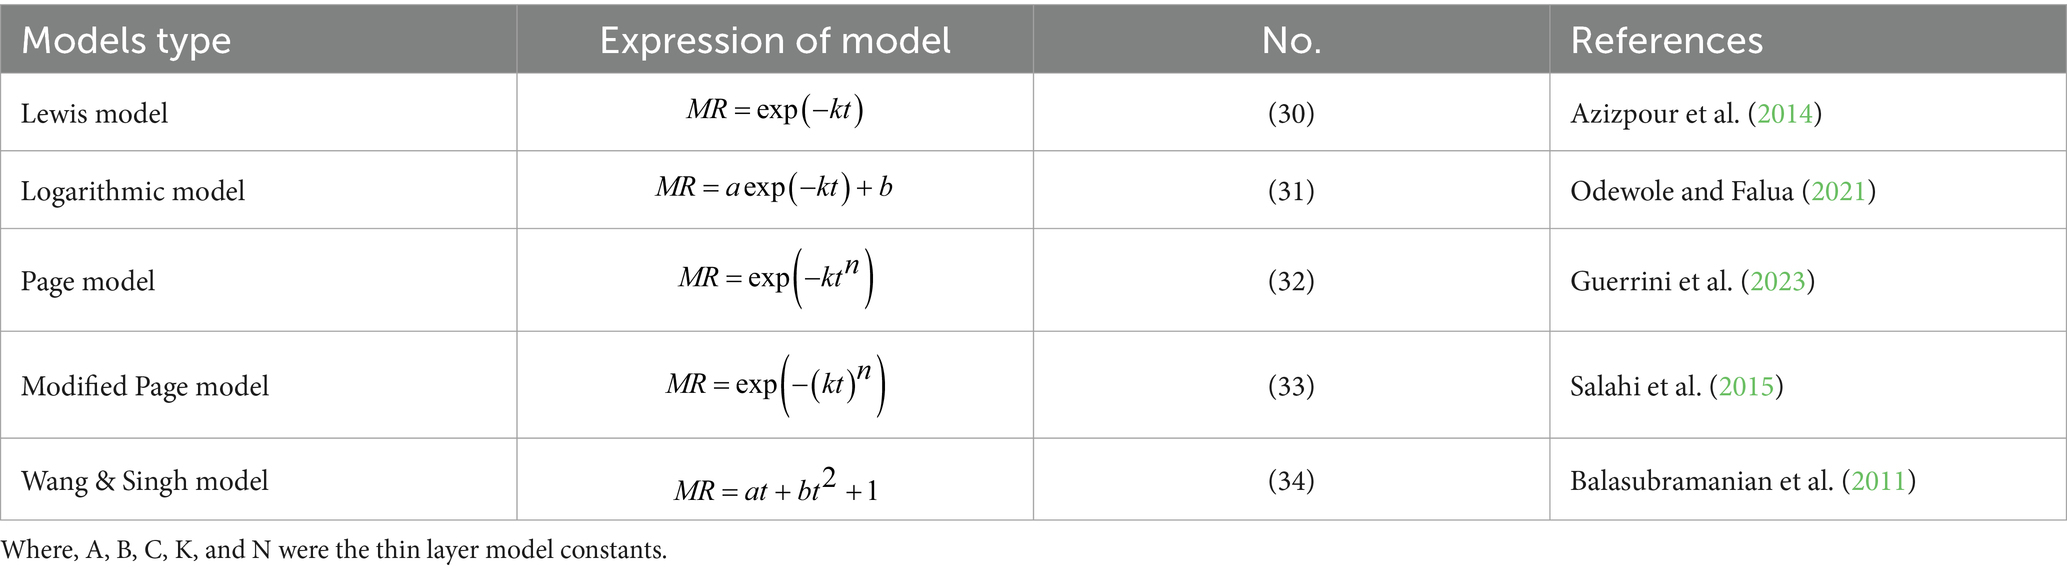
Table 3. A thin layer drying model adopted to descript drying process of the present study.
R2 is the coefficient of determination;
MRexp, i is the experimental moisture rate;
MRpre,i is the predicted moisture rate;
is the mean experimental MR;
χ2 is the chi-square;
z is the number of parameters.
3 Results and analysis
Since this investigation aims to determine how the thin layer thickness affects the drying kinetics features, there were modest variations in the initial moisture content of each experimental sample group in the study. Moisture rate was a dimensionless parameter which was mainly used to eliminate differences in initial moisture content and depict the trend of moisture content during the drying process.
3.1 Analysis of drying temperature and tea layer thickness on tea moisture rate and drying ratio
The impact of the relationship between different drying temperature and different tea layer thickness and tea moisture rate is shown in Figure 3. As the result shown that increasing drying temperature and keeping the thin layer thickness unchanged, or keeping the temperature constant decreasing the thin layer thickness can significantly to accelerate moisture transfer, decreasing drying time and improving drying efficiency simultaneously. Taking Figures 3A,B for instance, when thin layer at the same thickness of 10 mm and at the drying temperature of 90°C, 80°C, and 70°C, time required for the experimental group to complete drying was 45 min, 65 min, and 85 min, respectively. Similarly, completing the drying process need to consume 40 min and 55 min at 10 mm and 15 mm thickness under the same temperature of 80°C. Therefore, it can be also put in the other word, lower thickness thin layer and higher drying temperature may be providing an environment exist pressure difference to develop driving force of the moisture content migration to accelerate migrating rate of the moisture content result in rapid moisture content evaporation. Similar study in tobacco leaves have been reported (Chen et al., 2019).
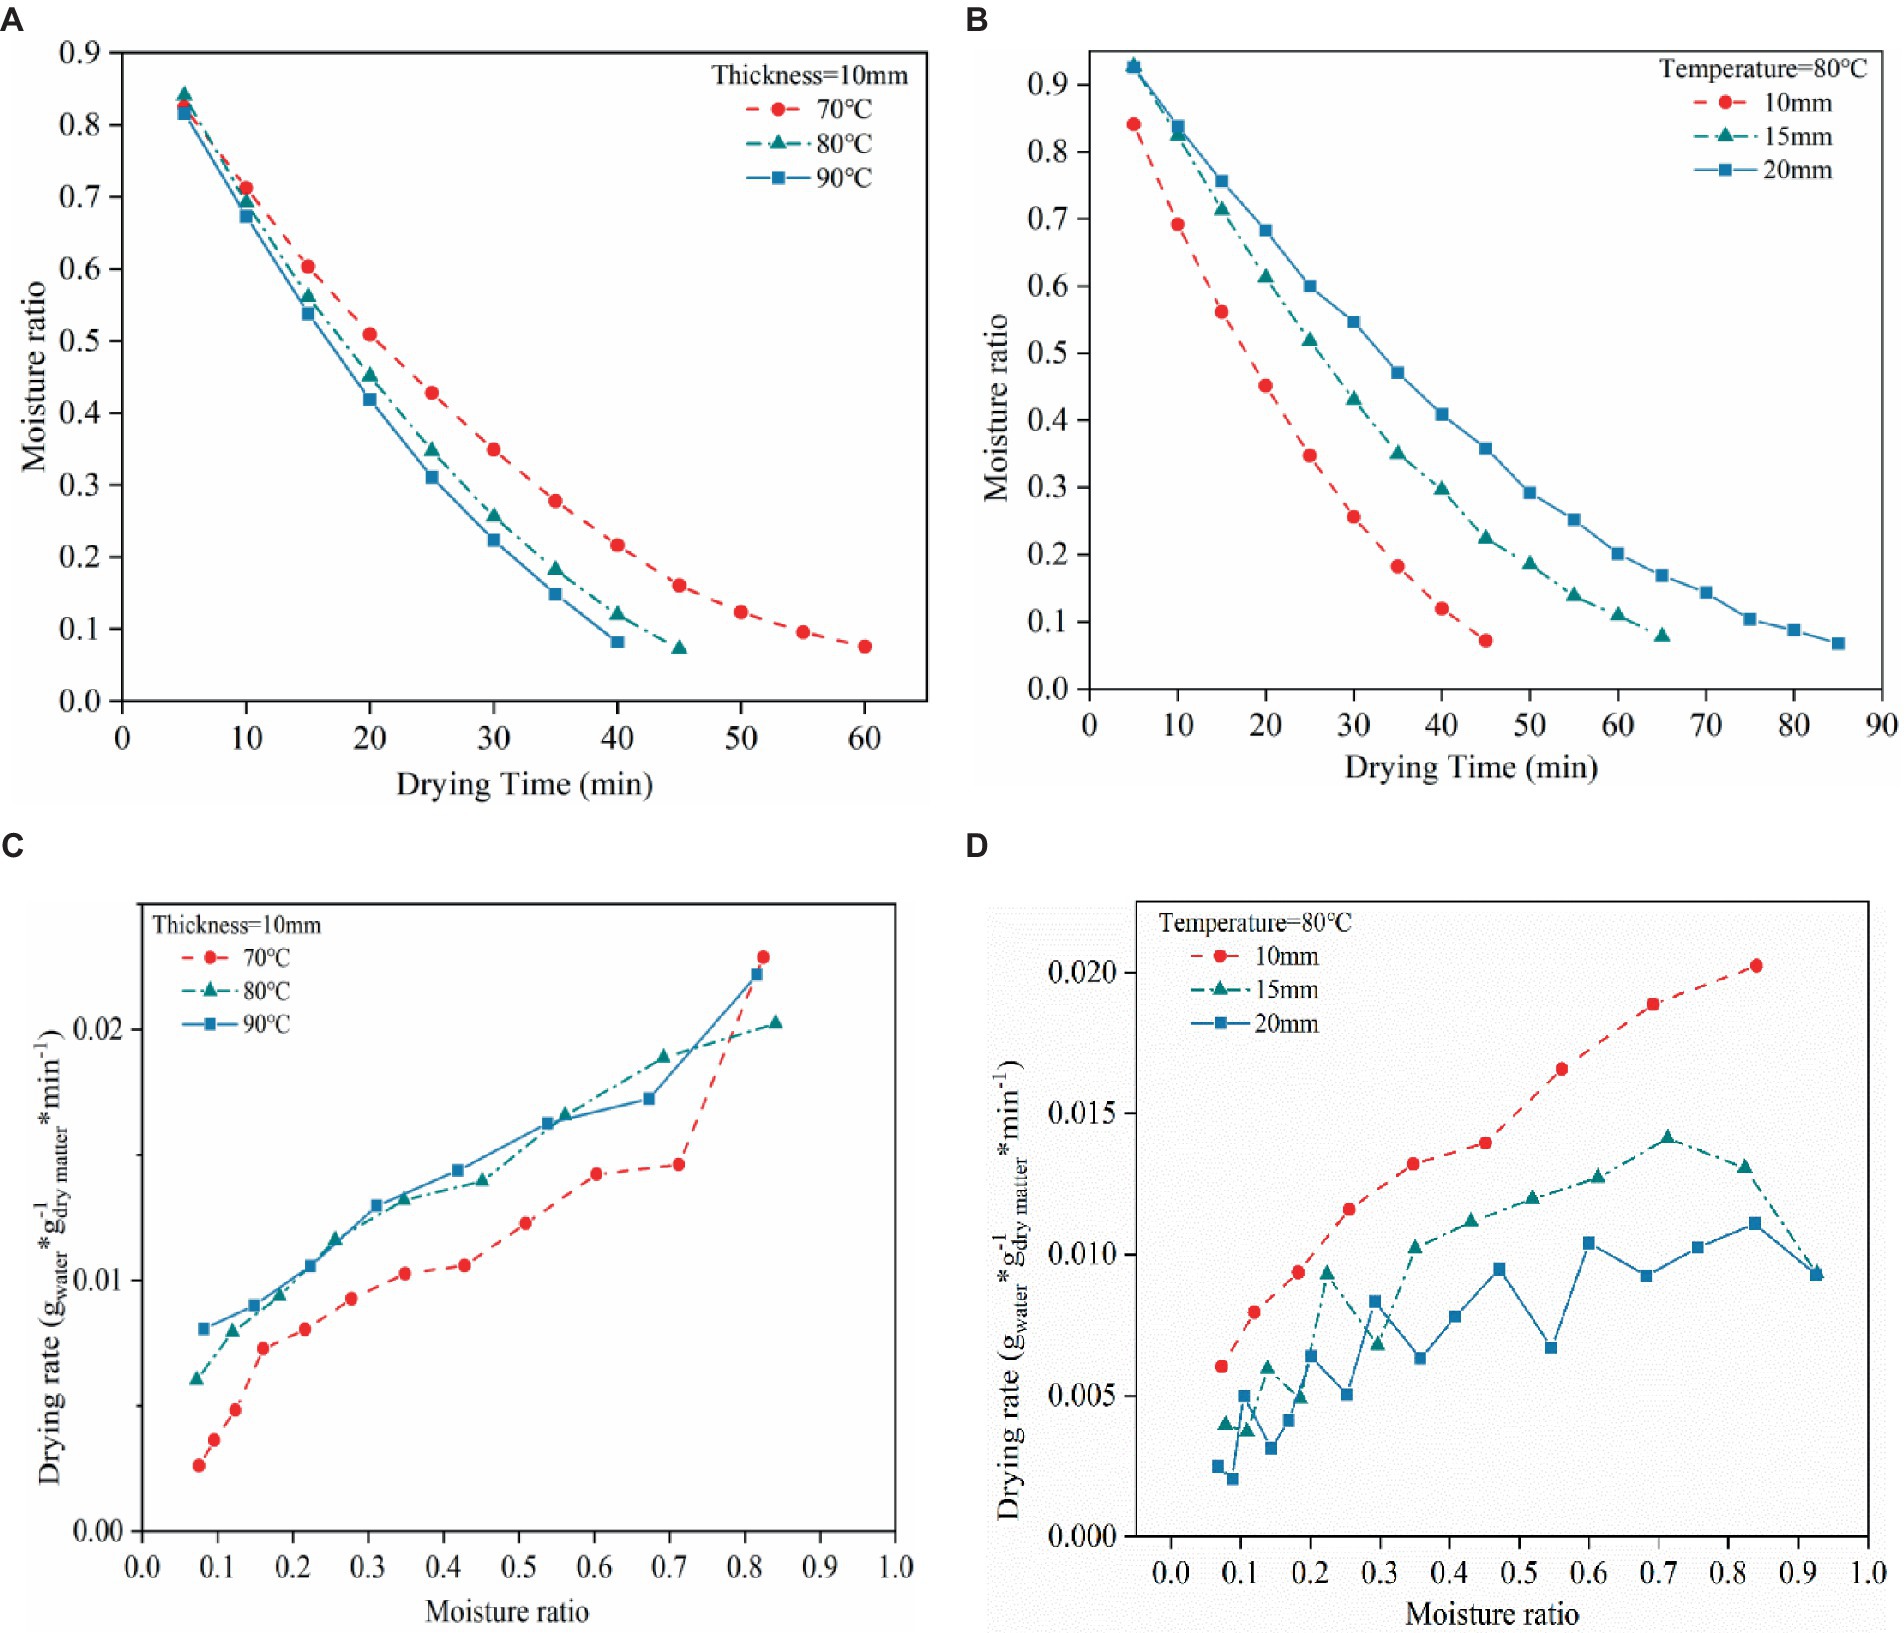
Figure 3. (A) The impact of drying temperature on moisture rate. (B) The impact of thin layer thickness on moisture rate. (C) The impact of drying temperature on drying rate. (D) The impact of thin layer thickness on drying rate.
The entire drying process under various temperatures and drying lamella thickness conditions is shown in Figures 3C,D. At the start of drying, the rate of drying stays high. On the other hand, when the drying temperature rises, or the drying layer thickness decreases, the drying rate gradually increases. Furthermore, the data shown in Figure 3D support the idea that the drying rate increases with decreasing drying layer at a given drying temperature throughout the drying process. The reason is that a higher temperature or lower thickness of the layer can encourage the migration of internal moisture to the material’s surface and accelerate the evaporation of free water from the material’s surface. As the drying process progresses, the drying rate for all drying conditions decreases as the moisture content of the material decreases. This is because most of the water in the material at the later drying stages is bound to water with a specific binding force with the internal material, which is difficult to migrate and evaporate, resulting in a lower drying rate. Similar trends in drying rate and moisture content have also been reported (Varhan et al., 2019; Khan et al., 2021).
Moreover, Figure 3D shows the variation curve of the drying rate with moisture content at 20 mm thickness. The reasons for generating the zig-zag pattern plot are as follows: First, the drying process is carried out in a constant temperature drying chamber, and the fluid inside the drying chamber is pressurized by a fan that applies pressure to pressurize the drying air to flow from the bottom to the top and out of the drying chamber, and the moisture is taken away by the hot air as it flows out. This study collected more data because the drying process is more complicated and takes longer at 20 mm thickness. The large thickness of the material, and the high drying temperature may lead to the removal of water through the material layer, there is a repeat humidification, resulting in large fluctuations in the drying rate, and the higher the moisture content of the fluctuation is more significant, in Figure 3D at the horizontal coordinate of the stage of 0.4–1.0 characterizes the stage of the higher moisture content. It can also be observed that the smaller the thickness, the less the secondary humidification, the flatter the curve, and the larger the thickness, the larger the fluctuation; this is the reason why the zig-zag plot is not generated at 10 mm thickness because it does not have the secondary humidification. Second, the moisture content in the process of tea drying is in the state of non-linear change, when the slight change in moisture content will cause the drying rate to exist an inevitable fluctuation due to the existence of systematic errors in the test process, including the measurement error of the weight of the samples and the error of the sensor. In conclusion, the overall trend of the curve is that the drying rate decreases gradually with the decrease in moisture content, which has proven the drying rate of tea in the drying process with the change in moisture content, and at the same time proved that the thickness of the tea spreading would also have a specific effect on the drying rate.
3.2 Impact of drying temperature and thin layer thickness on the parameters of tea drying kinetics model
The present study was applied five thin layer model, namely, Lewis model, Logarithmic model, Page model, Modified Page model, and Wang & Singh model, to perform non-linear fitting on the moisture content measured in the experiment. The statistical parameters, coefficient of determination (R2) and chi-square (χ2) given by the calculation Equations (7, 8), were adopted to evaluate the goodness of fit to the model curve. Since existed multiple group experiments that calculate the average value of coefficient of determination (R2) and chi-square (χ2) and selected the group with the highest average value of R2 and the lowest average value of χ2 to determine the appropriate model, detailed values of statistical parameters are presented in Table 3 (Madamba et al., 1996; Mishra et al., 2021).
As shown in Table 4, within the five models, the logarithmic model had excellent performance in fitting the experimental moisture content, with the highest average value of R2 and the lowest average value of χ2 being 0.99877 and 8.80 × 10⁻⁵, respectively. Therefore, in the following analysis of drying behavior, the logarithmic model was the best option in the present study. Results of the fitting coefficient of the Logarithmic model fitting experimental data are shown in Table 5. In addition, with the further and careful observation can clearly reveal that under the condition of low drying temperature (experimental group with 70°C), model constant act out certain assured of correlation with the drying temperature and thickness of thin layer. However, this correlation was not observed under the drying temperature of 80°C and 90°C. Similar observation has reported by previous studies for drying plant porous materials, such as vegetable and fruits (Brar et al., 2020; Mishra et al., 2021).
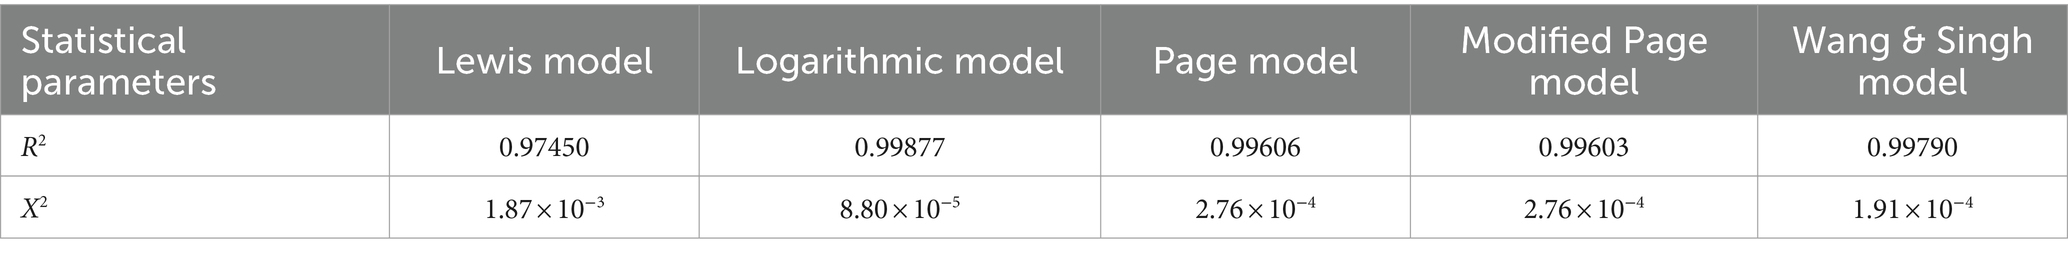
Table 4. Average value of statistical parameters of the thin layer drying model.
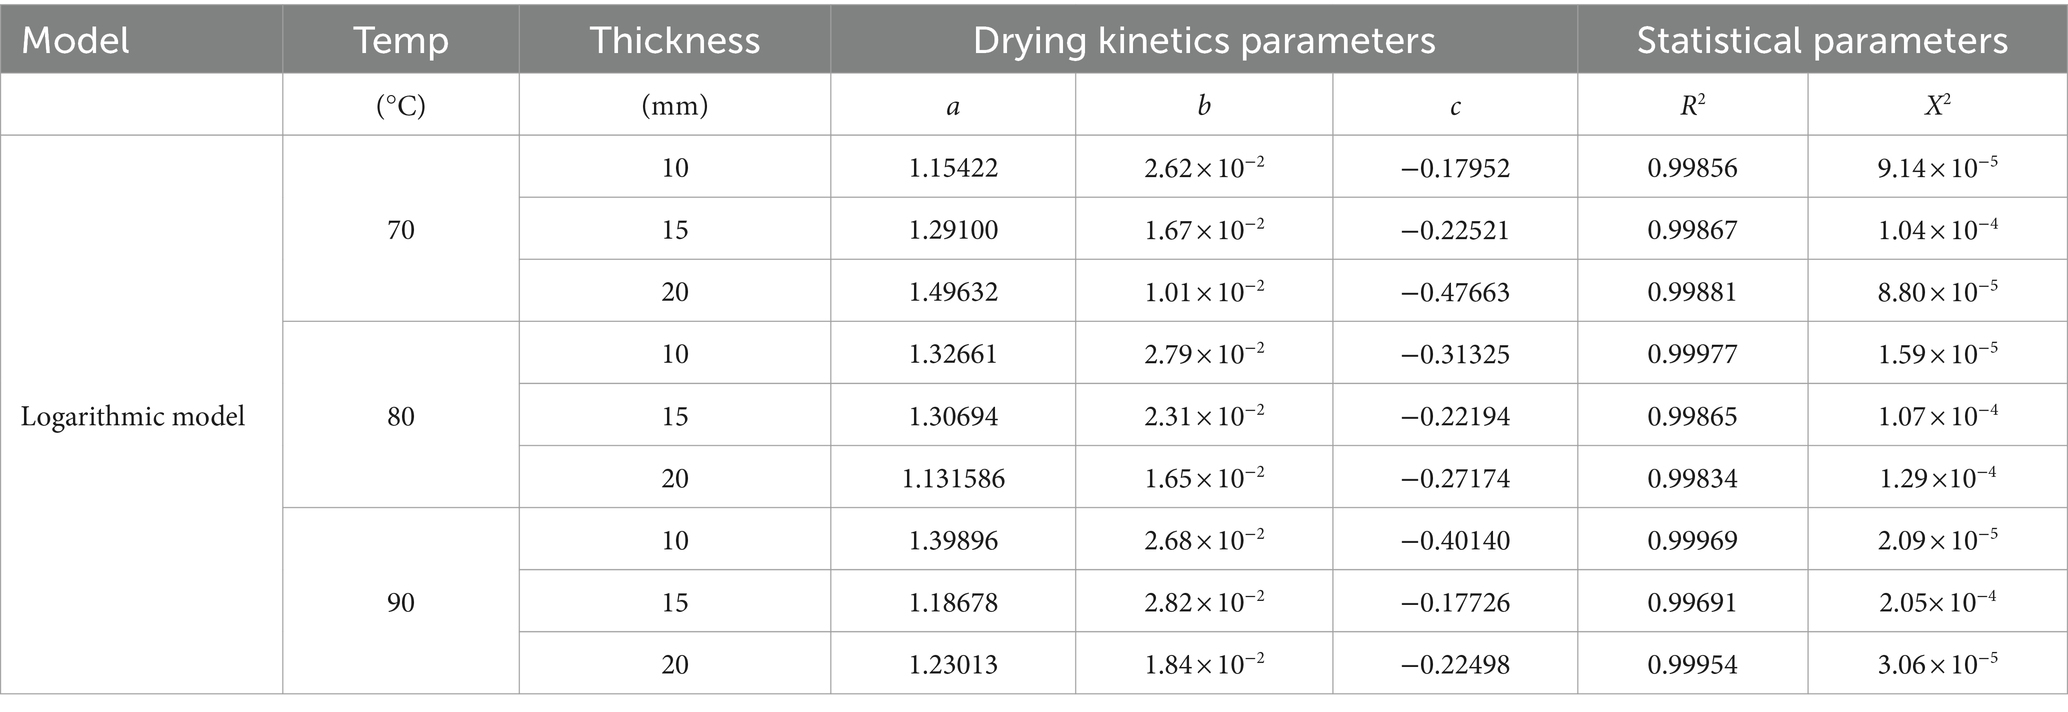
Table 5. Coefficient, statistical parameters, and constants of Logarithmic models under different temperatures and thicknesses.
To assess the accuracy of the logarithmic model, Figures 4A–C display the linear correlations between the experimental moisture content and the moisture content predicted by the model. Under the same thickness (selected 15 mm as an example to demonstrate), the coefficient of determination (R2) for drying temperature of 70°C, 80°C, and 90°C was 0.99882, 0.99872, and 0.99687, respectively. Meanwhile, the above results further indicate that the Logarithmic model was suitable for describing the drying characteristics.
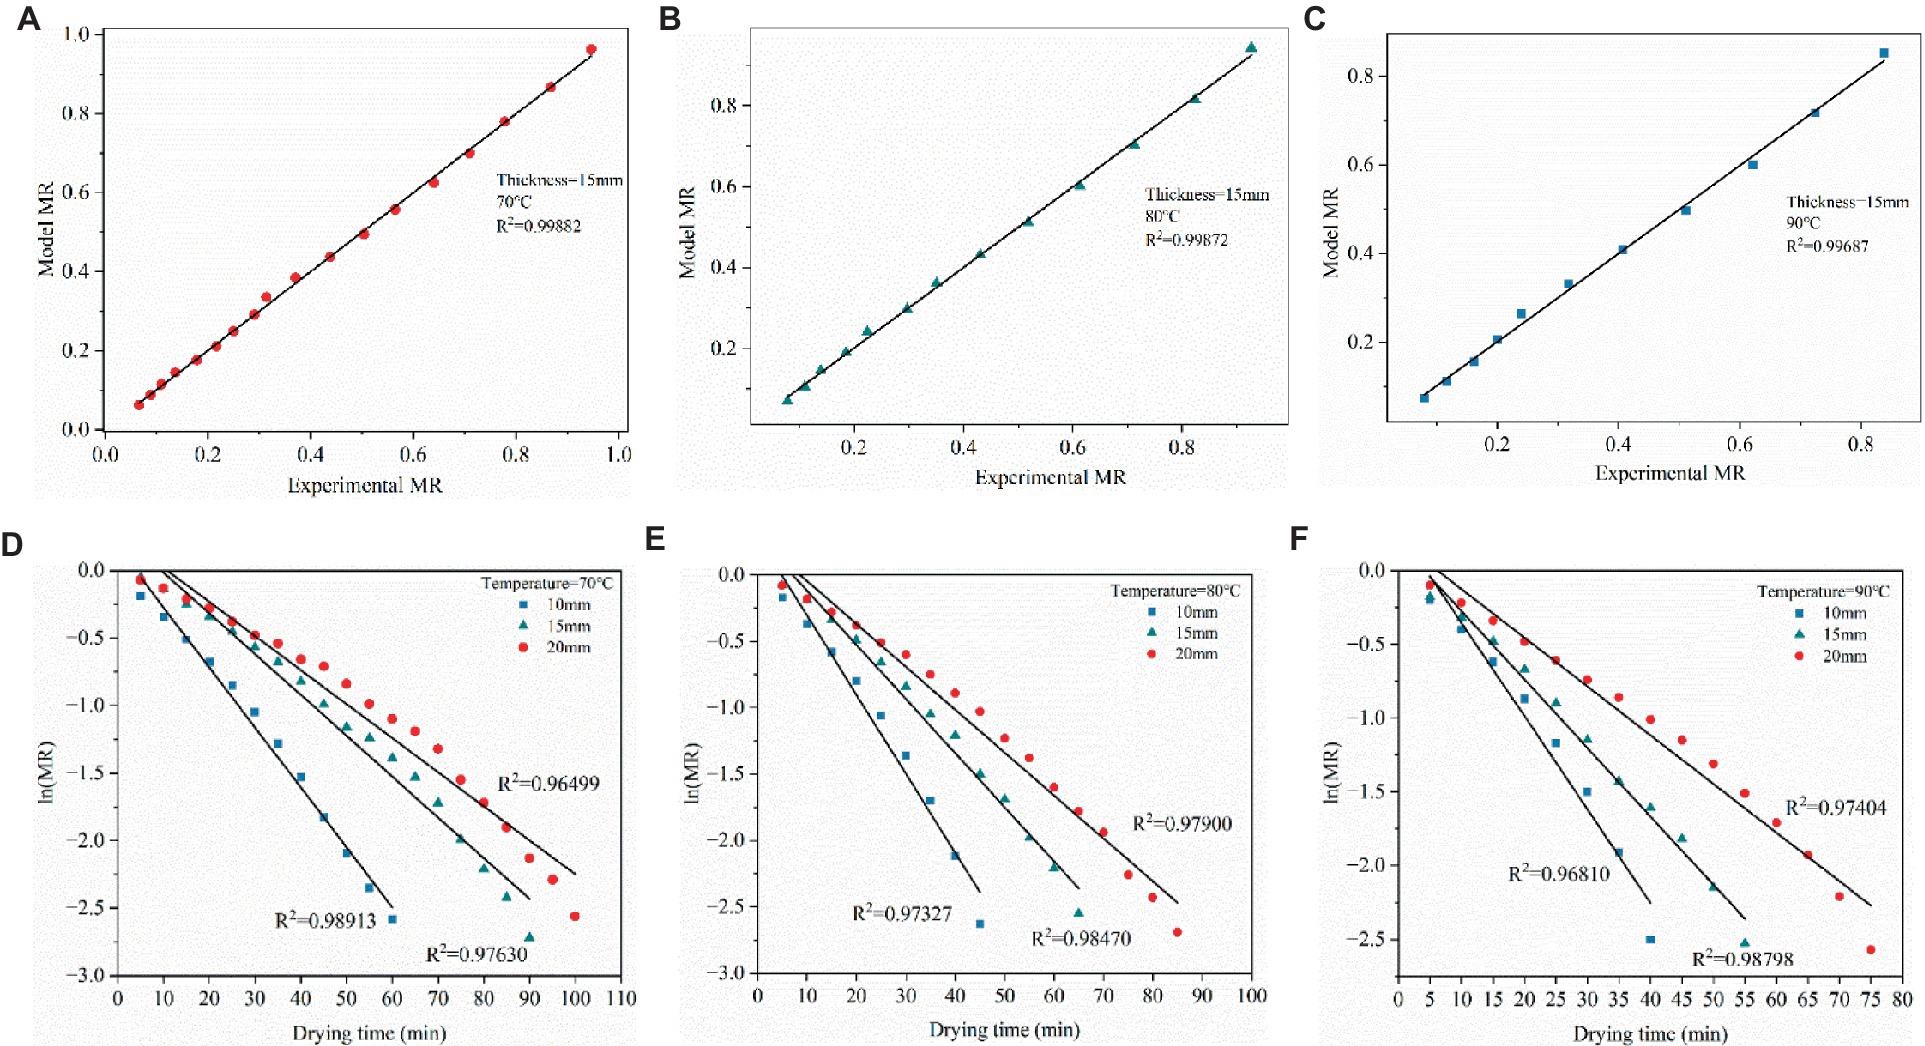
Figure 4. (A–C) Experimental and predicted moisture rate of the Logarithmic model. (D–F) Natural logarithmic of moisture rate versus drying time for estimation of the effective moisture diffusivity.
3.3 Analysis of effective moisture diffusivity and activation energy
The original intention of development of many theories of effective moisture diffusivity in drying process was to describe the phenomenon of moisture content diffusion. To obtain the effective moisture diffusivity, the slope of the line plotted by fitting the natural logarithmic of moisture rate with drying time should be obtained first. As shown in the following Figures 4D–F, the linear relationship plotted between natural logarithmic of moisture rate and drying time under conditions of drying temperatures and thin layer thickness, the value of the coefficient of determination (R2) acquired from 0.96499 to 0.98913, and the slope can be further calculated. Description in Figures 4D–F can be obvious to observe that the natural logarithmic of moisture rate was performance downward trend, especially at the same thickness higher the temperature with the faster the decrease. Similar findings also have been reported in a few studied works on drying dynamics of agricultural products (Doymaz, 2017). Immediately after, effective moisture diffusivity can be calculated based on the Equation (6) mentioned above and listed the result in Table 6. At the same level of drying temperature, the effective moisture diffusivity presented an increasing trend accompanied by the thickness of the dry thin layer increases. Similar detection was also found expression in the same level of thin layer thickness that the water diffusion coefficient increases with increasing temperature. For example, with the condition at 70°C drying temperature, the effective moisture diffusivity of the 10 mm, 15 mm, and 20 mm thin layer thicknesses was 4.4969 × 10⁻⁷ m2·s−1, 6.8875 × 10⁻⁷ m2·s−1, and 1.0222 × 10⁻⁶ m2·s−1, respectively. Similarly, at the level of thickness at 10 mm, the maximum effective moisture diffusivity was found at the level of drying temperature at 90°C, minimum effective moisture diffusivity appeared at the level of drying temperature at 70°C. Therefore, it can be taken as a deduction that increasing the thickness and drying temperature of the drying thin layer can increase the internal pressure of the drying thin layer and improve the activity of water molecules of the material contributed to increase the diffusion of moisture and further to improve the drying rate. This deduction was confirmed from previous some other similar studies reported for carrot slices (Susanti et al., 2021) and red sorghum (Dehghannya et al., 2019).
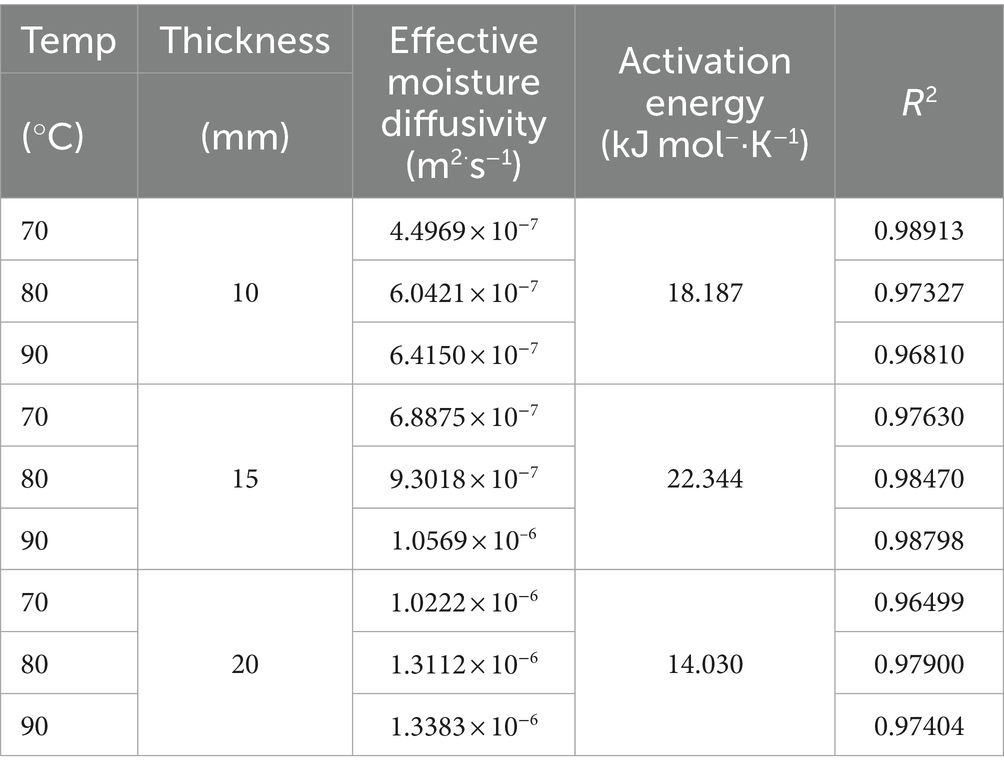
Table 6. Effective moisture diffusivity and activation energy at different drying conditions of tea.
The activation energy can also be calculated using a method similar to that used to calculate the effective moisture diffusivity. Applied the value of effective moisture diffusivity obtained above and plotted linear correlations between them against the reverse of the values of absolute drying temperature, as shown in the following Figure 5. Therefore, the activation energy value is determined by solving the slope of the linear correlations, as shown in Table 6. As shown in Table 5, in the present study, the activation energy values for the thickness of 10 mm, 15 mm, and 20 mm were 18.187 kJ mol−1·K−1, 22.344 kJ mol−1·K−1, and 14.030 kJ mol−1·K−1, respectively. The results obtained in this study can be considered reasonable due to a few relevant literature studies have cited that activation energy of vegetables and other plant-based materials ranged from 12.7 to 110 kJ mol−1·K−1. Meanwhile, Luthra and Sadaka pointed out that there is no significant correlation between the increase in grain layer thickness and activation energy, which can also explain the result where the activation energy of moisture does not show a certain correlation with drying temperature and thickness obtained in this study (Luthra and Sadaka, 2021).
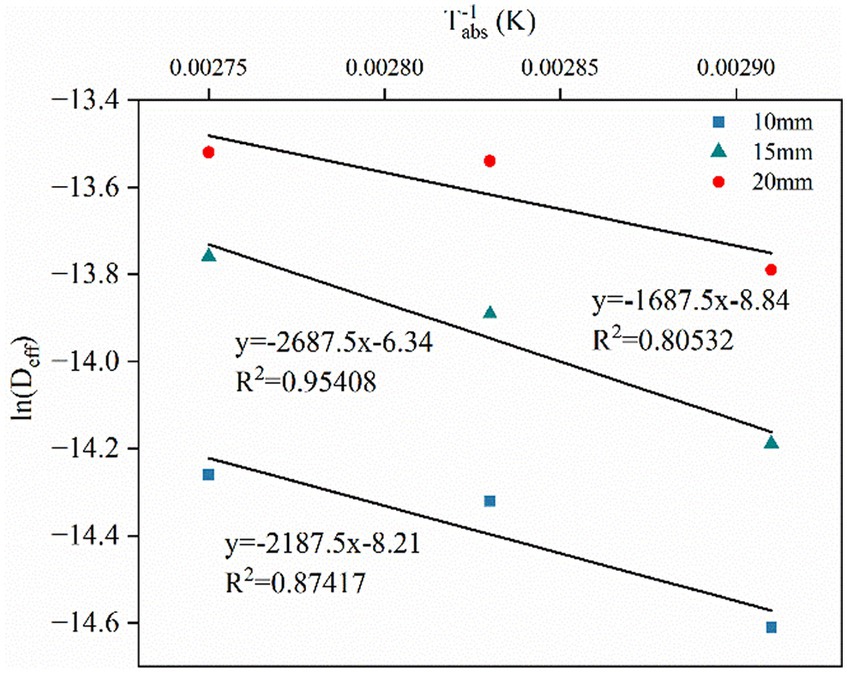
Figure 5. Natural logarithmic of effective moisture diffusivity versus inverse absolute temperature for estimation of activation energy.
3.4 Analysis of energy–exergy performance indicator
The energy–exergy performance indicators, including specific moisture evaporation rate, specific energy consumption, energy efficiency, exergy efficiency, improvement potential rate, and sustainability index during the drying process, were calculated using the equations shown in Table 2 and presented as the average value of each indicator in Table 7 for convenient analysis.
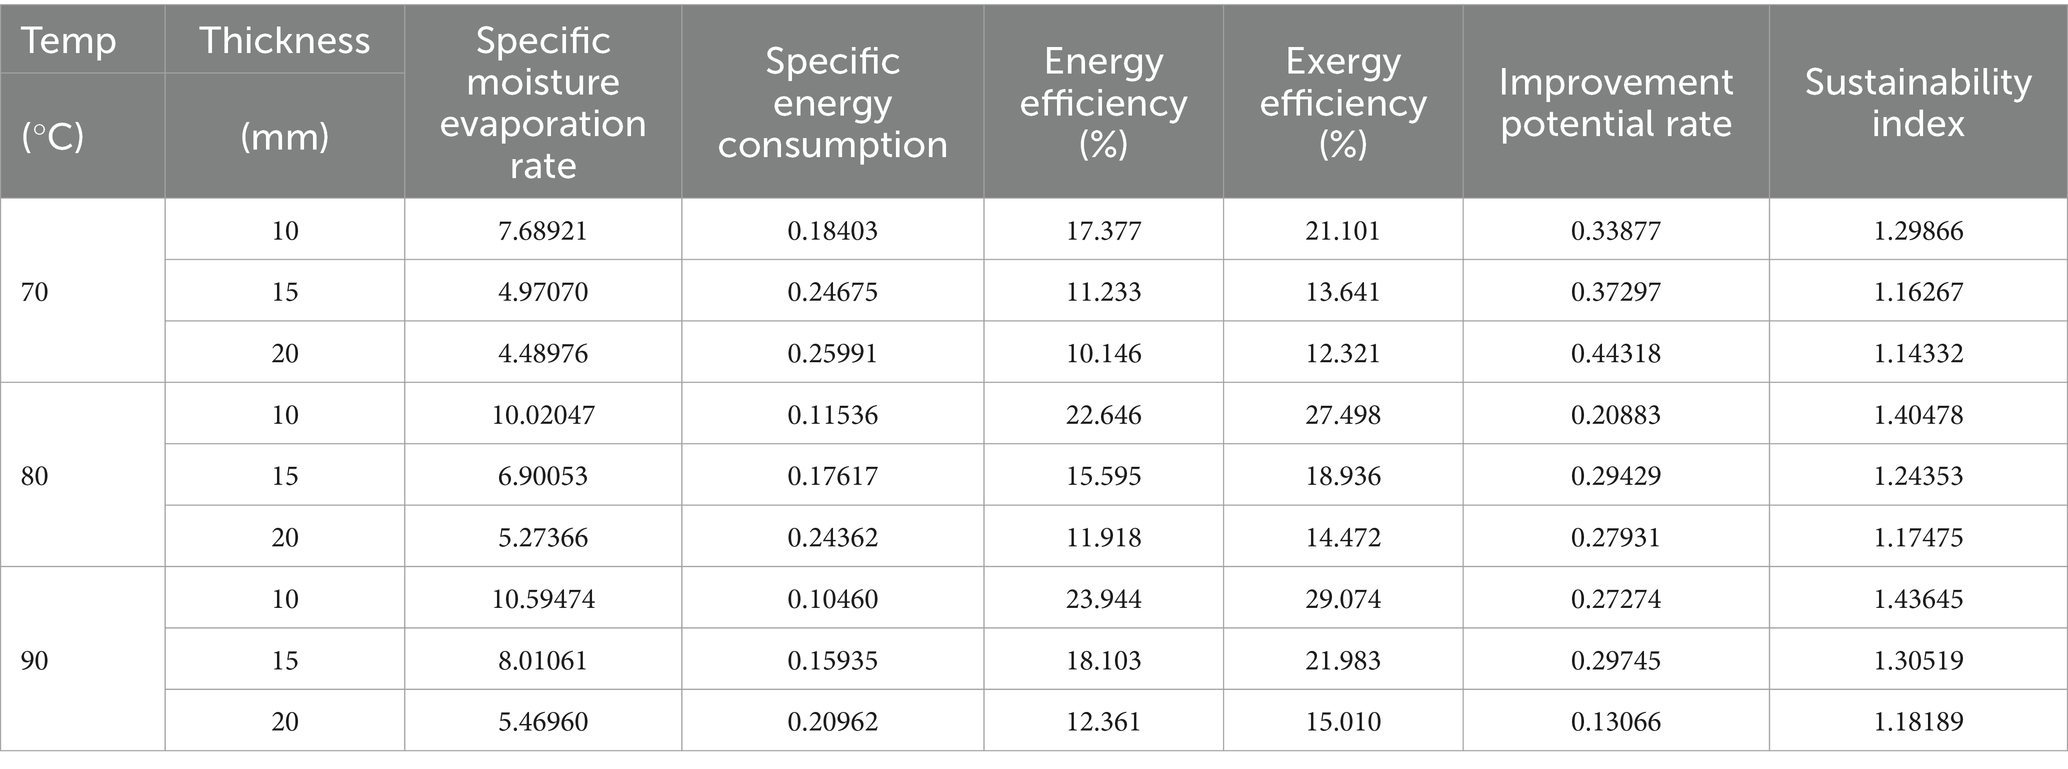
Table 7. Energy and exergy performance indicator at different drying conditions of tea.
3.4.1 Specific moisture evaporation rate and specific energy consumption
As shown in Table 7, the SEC increased obviously as the tea thin layer thickness increased when the drying temperature remain unchanged, whereas keeping the thin layer thickness remaining the SEC decreased significantly as the drying temperature increased. According to expression of the Equation (10), the growth in SEC probably owing to increase in the tea thin layer thickness while increasing the drying time to require more energy to complete the drying operation and decreasing of drying rate while in the final period during drying process. Therefore, this can also be better to illustrate the reason that SEC decreased with increasing the drying temperature under the same tea thin layer thickness. In addition, as shown in Equation (11) clearly, the SMER is the reciprocal of the SEC that the trend of changes in SEMR is exactly opposite to that of SEC. Similar findings about SMER and SEC have been reported by drying of olive pomace (Mugi and Chandramohan, 2021).
3.4.2 Energy efficiency and exergy efficiency
The results of energy efficiency and exergy efficiency are shown in Table 7. At the same temperature level, energy efficiency performance showed a descending trend as the tea thin layer thickness increased at all drying temperatures, yet performance showed an ascending trend as the drying temperature increased at the same thin layer thickness level. A similar change trend also manifested in exergy efficiency. It can be observed from Equations (12, 18) that the energy efficiency and exergy efficiency are similar to the SMER, which is directly proportional to drying rate. The reason for this change in trend may be due to the low moisture content stage in the later stage of drying, which demands for more energy and time to get rid of the water with a strong binding force. Analogous research results about the binding energy with the low moisture content causing the lower energy efficiency performance have been reported and confirmed in the literature (Fudholi et al., 2015).
3.4.3 Improvement potential rate and sustainability index
Knowledge of the improvement potential rate (IP) and sustainability index (SI) can facilitate a more intuitive understanding and evaluation of the sustainability of drying systems under different drying conditions. The results of IP and SI during the different tea thin layer drying conditions are also presented in Table 7. It can be intuitively inferred from the Table 7 that the change trend of the IP performances insignificantly correlation was observed with the thickness of the dry thin layer at same level drying temperature. However, at given thin layer, as increasing of the drying temperature, the IP has shown a slight descending trend, the most obvious manifestation is in a thin layer thickness of 20 mm with the maximum value of 0.44318 at 70°C, followed by 0.27931 at 80°C and the minimum of 0.13066 at 90°C. Different from IP, SI shows similar trend to exergy efficiency because SI is expressed as an equation of the exergy efficiency and is proportional to exergy efficiency. IP is also expressed as a formulation of the exergy efficiency and is inversely proportional to exergy efficiency but proportional to exergy loss, and this can illustrate the maximum IP value appeared at drying conditions of 70°C and a thin layer thickness of 20 mm. Applied IP and SI to evaluate the sustainability of drying systems and obtained similar results were reported by several literature studies (Atalay, 2019).
3.5 Analysis of heat and mass transfer performance indicator
In the present study, the results of dimensionless numbers, including Reynolds number, Prandtl number, Nusselt number, Schmidt number, and Sherwood number, are obtained according to Equations (21–27), as presented in Table 8. Additionally, the results of the heat and mass transfer coefficients are shown in Figure 6. As presented in Figures 6A,B, the heat transfer coefficient and mass transfer coefficient show a similar trend with changes in drying temperature and thickness. At the drying condition in the same level drying temperature, both heat and mass transfer coefficient showed a significantly opposite correlation with the thickness of the thin layer, whereas there was no significant change observed with different levels of drying temperature at the same level of drying thickness. Higher moisture content and thinner thickness in the early stages of drying process are beneficial for tea to heating up and accelerate the evaporation rate of moisture content which may be reasonably explained the above phenomenon of heat and mass coefficient. In addition, the water migration has a greater resistance reduced the drying rate and thus lowers the heat and mass transfer coefficient as the moisture content is lower at the later stage of drying process. Similar findings have also been reported in several literature studies (Kamali et al., 2021).
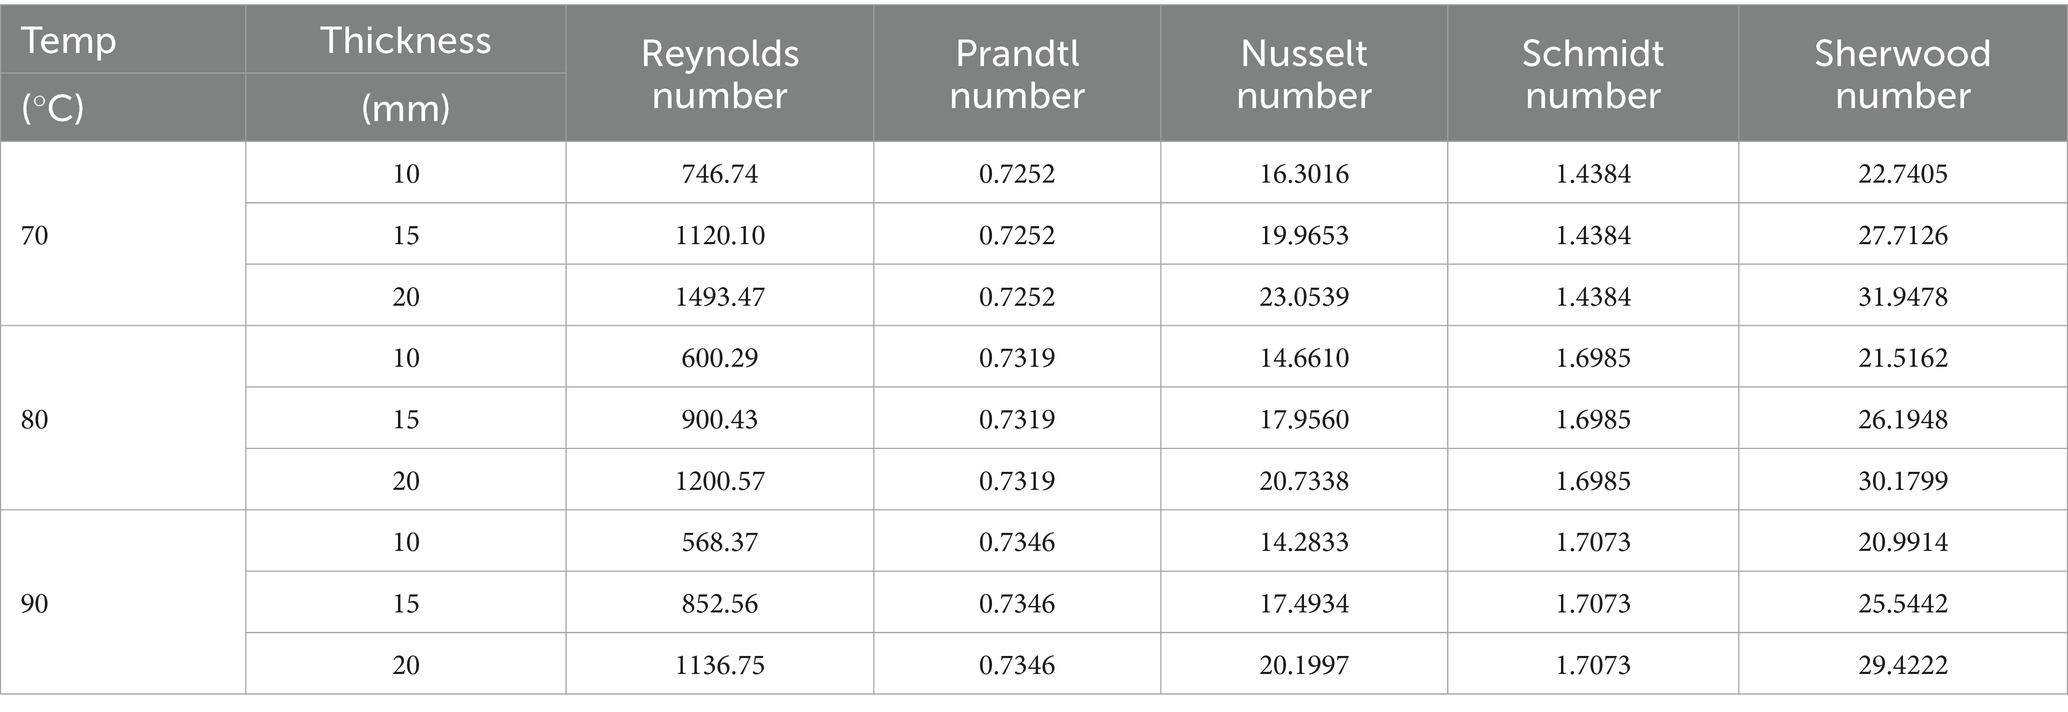
Table 8. Dimensionless number at different drying conditions of tea.
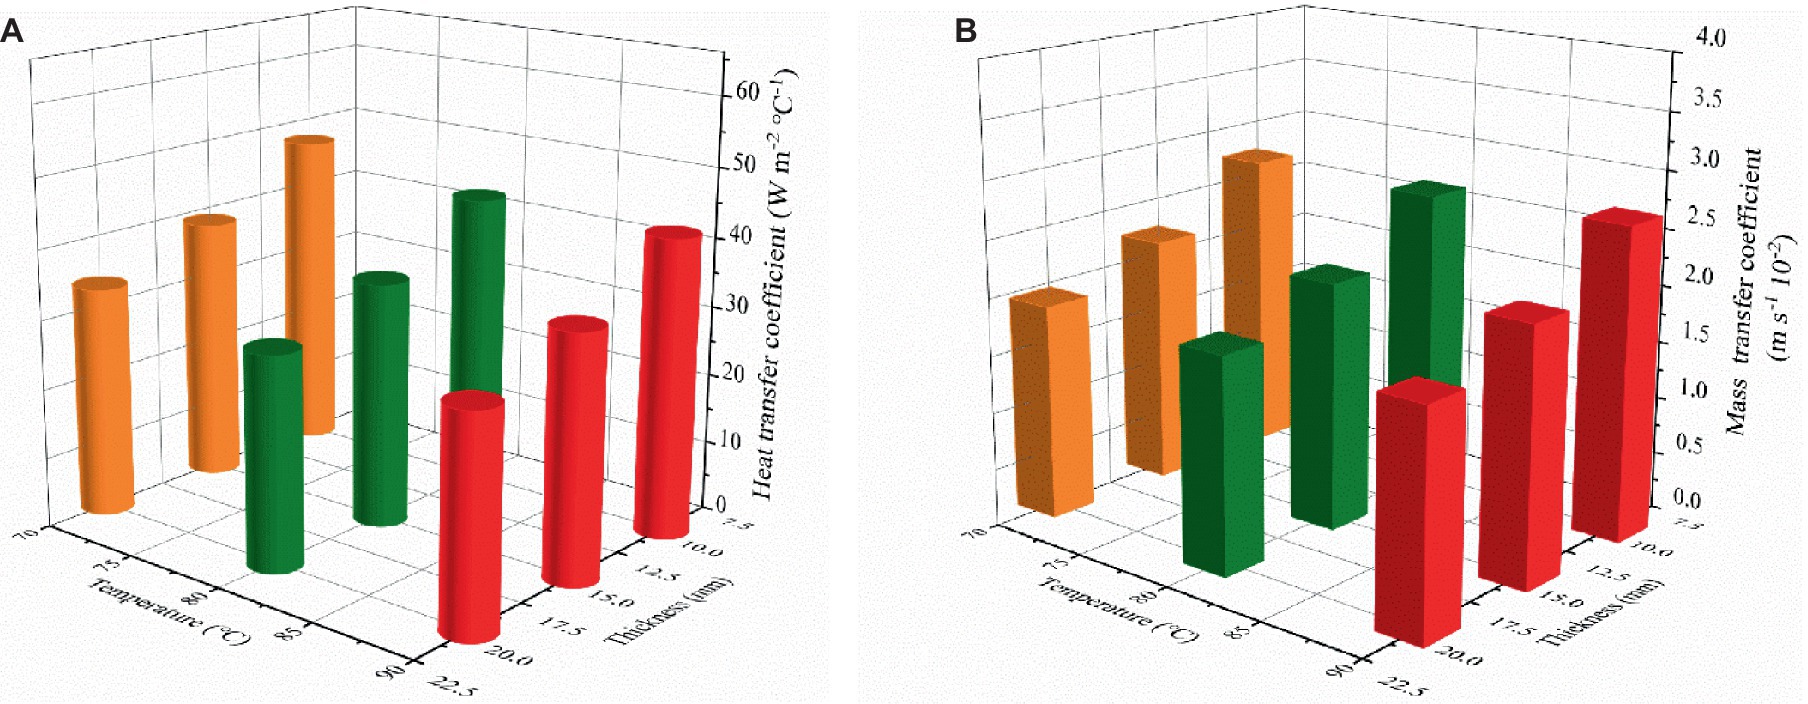
Figure 6. Heat transfer coefficients (A) and mass transfer coefficients (B) under different thin layer drying conditions for tea leaves.
Description of Figure 6 can be only observed the variation of heat and mass transfer coefficients with drying temperature and thin layer thickness from an apparent level. In an effort to take a clearer and more intuitive knowledge of relationship of the heat and mass transfer coefficient and drying temperature and thin layer thickness, the multivariate linear regression method was applied to give the functions for the relationship between mass transfer coefficient and drying temperature and thin layer thickness. The functions were written as Equations (35, 36), respectively, with corresponding R2 values of 0.967 and 0.951. The functions confirm the finding that heat and mass transfer coefficient is negatively correlated with the drying temperature and thin layer thickness. Moreover, the conclusion is drawn that the mass transfer coefficient is positively correlated with temperature and the heat transfer coefficient is negatively correlated with drying temperature. It should be noted that the heat and mass transfer coefficients in this study represent average values under a single drying process at different temperatures.
4 Conclusion
The current research examines how drying kinetic parameters, effective moisture diffusivity, and thermodynamic performance indicators were affected by drying temperature and thin layer thickness. Several conclusions can be made in light of the findings from the analysis above, including:
1. At the same drying temperature level, increasing the thickness of the thin layer will increase the drying time; similarly, at the same thin layer thickness level, increasing the drying temperature can accelerate the drying process and shorten the drying time.
2. Lewis model, Logarithmic model, Page model, Modified Page model, and Wang & Singh model were applied to describe and analyze the drying kinetic characteristics. It has been found that the performance of the Logarithmic model is the most significant fitting level, with the average values of R2 and χ2 being 0.99877 and 8.80 × 10⁻⁵.
3. The effective moisture diffusivity presented a certain correlation with the thickness of the thin layer and the drying temperature. Increasing the temperature and thickness of the thin layer can increase the effective moisture diffusion coefficient, but activation energy has no correlation between the TT and DT.
4. Energy efficiency, exergy efficiency, SMER, and SI were negatively correlated with TT at all times; DT, SEC, and IP performance decreased as TT increased, but at the same level of TT, the results regarding the above thermodynamic parameters are opposite.
5. Additionally, heat and mass transfer coefficients are written as functions of DT and TT with corresponding R2 values of 0.967 and 0.951, and we found them to have a significant decrease trend as the TT ascended, but further knowledge revealed that the mass transfer coefficient is positively correlated with DT. The heat transfer coefficient is negatively correlated.
Data availability statement
The raw data supporting the conclusions of this article will be made available by the authors, without undue reservation.
Author contributions
ZZ: Conceptualization, Methodology, Software, Validation, Writing – original draft, Writing – review & editing. CH: Conceptualization, Data curation, Formal analysis, Methodology, Writing – original draft, Writing – review & editing. QW: Conceptualization, Investigation, Methodology, Writing – original draft. HY: Formal analysis, Resources, Writing – original draft. XZ: Supervision, Writing – original draft. BL: Funding acquisition, Project administration, Writing – original draft.
Funding
The author(s) declare that financial support was received for the research, authorship, and/or publication of this article. This study was supported by the China Postdoctoral Science Foundation (2023 T160768); Special Support Project of Chongqing Postdoctoral Science Foundation (2021XM1034); Chongqing Postdoctoral Science Foundation Project (CSTB2022NSCQ-BHX0016); The Talent Introduction Projects of Chongqing University of Arts and Sciences (R2021SZZ02); The Major Cultivation Project of Chongqing University of Arts and Sciences (P2022ZZ15); Research on Dynamic Heat Transfer Characteristics and Multi potential Field Coupling Mechanism of Rice Hot Air Drying (R2023ZZ32); and National Natural Science Foundation of China (32171906).
Acknowledgments
The authors would like to thank the editors and reviewers for their valuable and constructive comments.
Conflict of interest
The authors declare that the research was conducted in the absence of any commercial or financial relationships that could be construed as a potential conflict of interest.
Publisher’s note
All claims expressed in this article are solely those of the authors and do not necessarily represent those of their affiliated organizations, or those of the publisher, the editors and the reviewers. Any product that may be evaluated in this article, or claim that may be made by its manufacturer, is not guaranteed or endorsed by the publisher.
References
Atalay, H. (2019). Performance analysis of a solar dryer integrated with the packed bed thermal energy storage (TES) system. Energy 172, 1037–1052. doi: 10.1016/j.energy.2019.02.023
Azizpour, M., Mohebbi, M., Khodaparast, M., and Varidi, M. (2014). Optimization of foaming parameters and investigating the effects of drying temperature on the foam-mat drying of shrimp (Penaeus indicus). Dry. Technol. 32, 374–384. doi: 10.1080/07373937.2013.794829
Balasubramanian, S., Sharma, R., Gupta, R. K., and Patil, R. T. (2011). Validation of drying models and rehydration characteristics of betel (Piper betel L.) leaves. J. Food Sci. Technol. 48, 685–691. doi: 10.1007/s13197-010-0188-9
Brar, A. S., Kaur, P., Kaur, G., Subramanian, J., Kumar, D., and Singh, A. (2020). Optimization of process parameters for foam-mat drying of peaches. Int. J. Fruit Sci. 20, S1495–S1518. doi: 10.1080/15538362.2020.1812017
Chen, Y., Ren, K., He, X., Gong, J., Hu, X., Su, J., et al. (2019). Dynamic changes in physiological and biochemical properties of flue-cured tobacco of different leaf ages during flue-curing and their effects on yield and quality. BMC Plant Biol. 19:555. doi: 10.1186/s12870-019-2143-x
Datta, A. K. (2015). Drying Technologies for Foods: fundamentals and Applicationsby Prabhat K. Nema, Barjinder pal Kaur, and Arun S. Mujumdar. Dry. Technol. 33:1788. doi: 10.1080/07373937.2015.1073064
Dehghannya, J., Pourahmad, M., Ghanbarzadeh, B., and Ghaffari, H. (2018). Heat and mass transfer modeling during foam-mat drying of lime juice as affected by different ovalbumin concentrations. J. Food Eng. 238, 164–177. doi: 10.1016/j.jfoodeng.2018.06.014
Dehghannya, J., Pourahmad, M., Ghanbarzadeh, B., and Ghaffari, H. (2019). Heat and mass transfer enhancement during foam-mat drying process of lime juice: impact of convective hot air temperature. Int. J. Therm. Sci. 135, 30–43. doi: 10.1016/j.ijthermalsci.2018.07.023
Doymaz, İ. (2017). Drying kinetics, rehydration and colour characteristics of convective hot-air drying of carrot slices. Heat Mass Transf. 53, 25–35. doi: 10.1007/s00231-016-1791-8
Duc Pham, N., Khan, M. I. H., Joardder, M. U. H., Rahman, M. M., Mahiuddin, M., Abesinghe, A. M. N., et al. (2019). Quality of plant-based food materials and its prediction during intermittent drying. Crit. Rev. Food Sci. Nutr. 59, 1197–1211. doi: 10.1080/10408398.2017.1399103
Dutta, P. P., and Baruah, D. C. (2014). Drying modelling and experimentation of Assam black tea (Camellia sinensis) with producer gas as a fuel. Appl. Therm. Eng. 63, 495–502. doi: 10.1016/j.applthermaleng.2013.11.035
Erbay, Z., and Icier, F. (2010). A review of thin layer drying of foods: theory, modeling, and experimental results. Crit. Rev. Food Sci. Nutr. 50, 441–464. doi: 10.1080/10408390802437063
Fathi, M., Roshanak, S., Rahimmalek, M., and Goli, S. (2016). Thin-layer drying of tea leaves: mass transfer modeling using semi-empirical and intelligent models. Int. Food Res. J. 23:40.
Franco, T. S., Perussello, C. A., Ellendersen, L. N., and Masson, M. L. (2017). Effect of process parameters on foam mat drying kinetics of Yacon (Smallanthus sonchifolius) and thin-layer drying modeling of experimental data. J. Food Process Eng. 40:e12264. doi: 10.1111/jfpe.12264
Fudholi, A., Sopian, K., Alghoul, M. A., Ruslan, M., and Othman, M. (2015). Performances and improvement potential of solar drying system for palm oil fronds. Renew. Energy 78, 561–565. doi: 10.1016/j.renene.2015.01.050
Guerrini, L., Pezzuolo, A., Ferrari, G., Pippa, G., and Marinello, F. (2023). “Intermittent drying of walnuts: evaluations of warm air consumption on a thin layer” in AIIA 2022: Biosystems engineering towards the green Deal,Lecture notes in civil engineering. 337, 625–632. doi: 10.1007/978-3-031-30329-6_64
Ibrahim, M., Sarker, M. S., Aziz, N. A., and Punan, M. (2015). Drying performances and milling quality of Rice during industrial fluidized bed drying of Paddy in Malaysia. Pertanika J. Sci. Technol. 23, 297–309.
Izadi, Z., Mohebbi, M., Shahidi, F., Varidi, M., and Salahi, M. R. (2020). Cheese powder production and characterization: a foam-mat drying approach. Food Bioprod. Process. 123, 225–237. doi: 10.1016/j.fbp.2020.06.019
Jiang, W., Su, B., and Fan, S. (2023). Spatial disequilibrium and dynamic evolution of eco-efficiency in China’s tea industry. Sustain. For. 15:9597. doi: 10.3390/su15129597
Kamali, R., Dadashi, S., Dehghannya, J., and Ghaffari, H. (2021). Production of green banana powder using foam-mat drying as influenced by drying air temperature: experimental and 3D numerical study. J. Food Process Eng. 44:e13703. doi: 10.1111/jfpe.13703
Khalloufi, S., Almeida-Rivera, C., and Mudaliar, A. V. (2014). Modern drying technology, volume 5: process intensification. Dry. Technol. 32, 2017–2020. doi: 10.1080/07373937.2014.976429
Khan, M. A., Moradipour, M., Obeidullah, M., and Quader, A. K. M. A. (2021). Heat and mass transport analysis of the drying of freshwater fishes by a forced convective air-dryer. J. Food Process Eng. 44:e13574. doi: 10.1111/jfpe.13574
Kumar, G., Joshi, J., Pavuluri, S., Rao, R., and Manchikanti, P. (2023). Effect of thin layer drying conditions on the retention of bioactive components in Malabar spinach (Basella alba) leaves. Food Chem. Adv. 3:100419. doi: 10.1016/j.focha.2023.100419
Luthra, K., and Sadaka, S. (2021). Investigation of rough rice drying in fixed and fluidized bed dryers utilizing dehumidified air as a drying agent 39, 1059–1073. doi: 10.1080/07373937.2020.1741606,
Li, B., Li, C., Li, T., Zeng, Z., Ou, W., Li, C., et al. (2019). Exergetic, energetic, and quality performance evaluation of paddy drying in a novel industrial multi-field synergistic dryer. Energies 12:4588. doi: 10.3390/en12234588
Madamba, P. S., Driscoll, R. H., and Buckle, K. A. (1996). The thin-layer drying characteristics of garlic slices. J. Food Eng. 29, 75–97. doi: 10.1016/0260-8774(95)00062-3
Midilli, A., and Kucuk, H. (2003). Energy and exergy analyses of solar drying process of pistachio. Energy 28, 539–556. doi: 10.1016/s0360-5442(02)00158-5
Mishra, M., Kandasamy, P., Shukla, R. N., and Kumar, A. (2021). Convective hot-air drying of green mango: influence of hot water blanching and chemical pretreatments on drying kinetics and physicochemical properties of dried product. Int. J. Fruit Sci. 21, 732–757. doi: 10.1080/15538362.2021.1930626
Mugi, V., and Chandramohan, V. P. (2021). Energy, exergy and economic analysis of an indirect type solar dryer using green chilli: a comparative assessment of forced and natural convection. Thermal Sci. Eng. Prog. 24:100950. doi: 10.1016/j.tsep.2021.100950
Odewole, M. M., and Falua, K. J. (2021). Modelling of thin-layer drying of Osmo-pretreated red bell pepper. Acta Technologica Agriculturae 24, 67–71. doi: 10.2478/ata-2021-0011
Ojediran, J. O., Okonkwo, C. E., Olaniran, A. F., Iranloye, Y. M., Adewumi, A. D., Erinle, O., et al. (2021). Hot air convective drying of hog plum fruit (Spondias mombin): effects of physical and edible-oil-aided chemical pretreatments on drying and quality characteristics. Heliyon 7:e08312. doi: 10.1016/j.heliyon.2021.e08312
Onwude, D. I., Hashim, N., Janius, R. B., Nawi, N. M., and Abdan, K. (2016). Modeling the thin-layer drying of fruits and vegetables: a review. Compr. Rev. Food Sci. Food Saf. 15, 599–618. doi: 10.1111/1541-4337.12196
Panchariya, P. C., Popovic, D., and Sharma, A. L. (2002). Thin-layer modelling of black tea drying process. J. Food Eng. 52, 349–357. doi: 10.1016/s0260-8774(01)00126-1
Salahi, M. R., Mohebbi, M., and Taghizadeh, M. (2015). Foam-mat drying of cantaloupe (Cucumis Melo): optimization of foaming parameters and investigating drying characteristics. J. Food Process. Preserv. 39, 1798–1808. doi: 10.1111/jfpp.12414
Shu, R., Xiao, J., and Su, Z. (2023). Spatiotemporal trends and factors influencing online attention for China’s tea industry. Front. Environ. Sci. 11:1206705. doi: 10.3389/fenvs.2023.1206705
Susanti, D. Y., Sediawan, W. B., Fahrurrozi, M., and Hidayat, M. (2021). Foam-mat drying in the encapsulation of red sorghum extract: effects of xanthan gum addition on foam properties and drying kinetics. J. Saudi Soc. Agric. Sci. 20, 270–279. doi: 10.1016/j.jssas.2021.02.007
Taheri-Garavand, A., Mumivand, H., Fatahi, S., Nasiri, A., and Omid, M. (2021). Modeling the kinetics of essential oil content and main constituents of mint (Mentha aquatica L.) leaves during thin-layer drying process using response surface methodology. J. Food Process. Preserv. 45:e15515. doi: 10.1111/jfpp.15515
Tang, W. Q., Li, D. C., Lv, Y. X., and Jiang, J. G. (2011). Concentration and drying of tea polyphenols extracted from green tea using molecular distillation and spray drying. Dry. Technol. 29, 584–590. doi: 10.1080/07373937.2010.516851
Varhan, E., Elmas, F., and Koç, M. (2019). Foam mat drying of fig fruit: optimization of foam composition and physicochemical properties of fig powder. J. Food Process Eng. 42:e13022. doi: 10.1111/jfpe.13022
Wei, W., Li, W., He, Z., and Lin, X. (2010). Drying characteristics and dynamics model of green tea by microwave vacuum drying. Trans. Chin. Soci. Agricul. Eng. 26, 367–371. doi: 10.3969/j.issn.1002-6819.2010.10.061
Yahya, M., Fudholi, A., Hafizh, H., and Sopian, K. (2016). Comparison of solar dryer and solar-assisted heat pump dryer for cassava. Sol. Energy 136, 606–613. doi: 10.1016/j.solener.2016.07.049
Yahya, M., Rachman, A., and Hasibuan, R. (2022). Performance analysis of solar-biomass hybrid heat pump batch-type horizontal fluidized bed dryer using multi-stage heat exchanger for paddy drying. Energy 254:124294. doi: 10.1016/j.energy.2022.124294
Yi, M., Wu, X., Zhuang, W., Xia, L., Chen, Y., Zhao, R., et al. (2019). Tea consumption and health outcomes: umbrella review of Meta-analyses of observational studies in humans. Mol. Nutr. Food Res. 63:e1900389. doi: 10.1002/mnfr.201900389
Yu, X., Sun, D., and He, Y. (2020). Emerging techniques for determining the quality and safety of tea products: a review. Compr. Rev. Food Sci. Food Saf. 19, 2613–2638. doi: 10.1111/1541-4337.12611
Zeng, Z., Li, B., Han, C., Wu, W., Wang, X., Xu, J., et al. (2022). An Exergoeconomic analysis of a gas-type industrial drying system of black tea. Entropy 24:655. doi: 10.3390/e24050655
Keywords: tea, drying kinetics, thin layer thickness, drying temperature, effective moisture diffusivity, thermodynamic
Citation: Zeng Z, Han C, Wang Q, Yuan H, Zhang X and Li B (2024) Analysis of drying characteristic, effective moisture diffusivity and energy, exergy and environment performance indicators during thin layer drying of tea in a convective-hot air dryer. Front. Sustain. Food Syst. 8:1371696. doi: 10.3389/fsufs.2024.1371696
Edited by:
Poonam Rani, Teagasc Food Research Centre, IrelandReviewed by:
Rahul Kumar Rout, Indian Institute of Technology Kharagpur, IndiaSadoth Sandoval Torres, National Polytechnic Institute (IPN), Mexico
Copyright © 2024 Zeng, Han, Wang, Yuan, Zhang and Li. This is an open-access article distributed under the terms of the Creative Commons Attribution License (CC BY). The use, distribution or reproduction in other forums is permitted, provided the original author(s) and the copyright owner(s) are credited and that the original publication in this journal is cited, in accordance with accepted academic practice. No use, distribution or reproduction is permitted which does not comply with these terms.
*Correspondence: Xuefeng Zhang, mangeler@cqwu.edu.cn; Bin Li, cncqlibin@163.com
†These authors have contributed equally to this work and share first authorship