Push or Pull? Cell Proliferation and Migration During Wound Healing
 Adriana Zanca
 Jennifer A. Flegg
 James M. Osborne
- School of Mathematics and Statistics, The University of Melbourne, Parkville, VIC, Australia
Wound healing of the skin is a complex process that is still not well-understood. Wound management is expensive for both individuals and the health system overall, and can reduce quality of life for patients. Given these significant socio-economic impacts, wound healing has long been a focus of scientific research. Recent in vivo mouse studies have identified two key regions in wounded skin tissue: A non-proliferative leading edge that actively migrates into wounded space, and a proliferative hub in which cells have enhanced mitotic properties. This work uses mathematical and computational modelling to investigate the effect of changing the mechanical characteristics of cells in these two key regions. In this paper we explore what characteristics are sufficient for wound healing, particularly focusing on cell proliferation, since wounds are not able to repair successfully without sufficient levels of cell division. By considering contact inhibited proliferation, where small cells are unable to divide, we find that a quiescent region develops if the proliferative hub is able to grow over time, essentially limiting the number of cells that are able to divide. In contrast, if the size of the proliferative hub is kept below some threshold, then contact inhibition has a less significant role in wound repair. This work builds upon existing cell-based computational studies of wound healing and could be modified to investigate different stages of wound healing, impaired healing and wound treatments.
1 Introduction
The skin is a barrier between the body and the external environment. Wounds represent a breakdown of that barrier, leaving the body exposed to pathogens that may lead to infection. Such injuries affect millions of people and costs the United States’ healthcare system billions of dollars annually (Sen, 2009; Nussbaum et al., 2018). For patients living with wounds, especially deeper and longer-term wounds, quality of life can be reduced and the financial costs can be an increasing burden (Kapp et al., 2018; Woo et al., 2018). Furthermore, older people and those with comorbidities, such as diabetes or obesity, are more likely to experience wound healing complications (Brem et al., 2007; Fuchs et al., 2021). Given the ageing demographics and increasing incidence of health conditions in many countries (United Nations, 2015; World Health Organization, 2020), improving wound healing outcomes will be increasingly important moving forward.
In light of the substantial socio-economic effects of wounds, investigations into wound healing have been ongoing throughout human history (Murray, 2003). Still, skin wound healing is a complex process that is not well-understood. Wound healing can be characterised by three overlapping stages: inflammation, proliferation and remodelling (Gonzalez et al., 2016; Han and Ceilley, 2017; Rousselle et al., 2019). [Other characterisations are also used; such as including haemostasis, the cessation of bleeding, as the first stage of healing (Enoch and Leaper, 2008; Dekoninck and Blanpain, 2019; Rodrigues et al., 2019; Fuchs et al., 2021)] The inflammation phase typically lasts days, during which time white blood cells are recruited to the wound site to remove damaged cells and bacteria (Han and Ceilley, 2017). The proliferation phase begins within days of injury and can continue for weeks. This phase includes processes such as the formation of new blood vessels and re-epitheliasation (Enoch and Leaper, 2008). Remodelling is the final and longest stage of wound healing, taking months or years. During the remodelling phase, the skin increases in tensile strength, but will only reach approximately 80% of the original tissue’s strength (Schultz et al., 2011).
The skin consists of three layers: the epidermis, dermis and hypodermis (also referred to as the subcutaneous layer), shown in Figure 1A. Blood vessels and immune cells recruited during wound healing are found in the deeper, less densely packed, dermal and hypodermal layers. The re-epitheliasation stage of wound healing includes the repair of the epidermis, the most superficial layer of skin and first line of defense against the external environment. Compared to the dermis and hypodermis, the structure of the epidermis is relatively simple, comprising mainly of one type of cell organised in layers according to structure and function. In healthy skin and acute wound healing, proliferative cells are all located in the deepest layer of the epidermis, called the stratum basale or basal layer, seen in Figure 1A. This deepest epidermal layer is a confluent layer of cells consisting predominantly of skin cells known as keratinocytes (Honari, 2017; Burns et al., 2008). Other cells that make up a small proportion of the stratum basale are sensory cells and cells that give skin its pigment. Pigment and sensory cells may play a role in scar formation, but are not believed to appear in newly formed epidermis until several days after re-epitheliasation commences (Snell, 1963; Gao et al., 2013). How the epidermis recovers during re-epitheliasation is still not completely understood. It is accepted that the suprabasal layers of skin, located above the stratum basale as demonstrated in Figure 1A, migrate towards the wound subsequently to the stratum basale (Aragona et al., 2017; Park et al., 2017). While it has previously been hypothesised that keratinocytes in the suprabasal layers of the epidermis roll over cells in deeper layers (Krawczyk, 1971; Bereiter-Hahn, 1984), and hence become the cells in the stratum basale adjacent to the wound, more recent studies have suggested that suprabasal cells do not migrate deeper into the epidermis in mice (Aragona et al., 2017; Park et al., 2017).
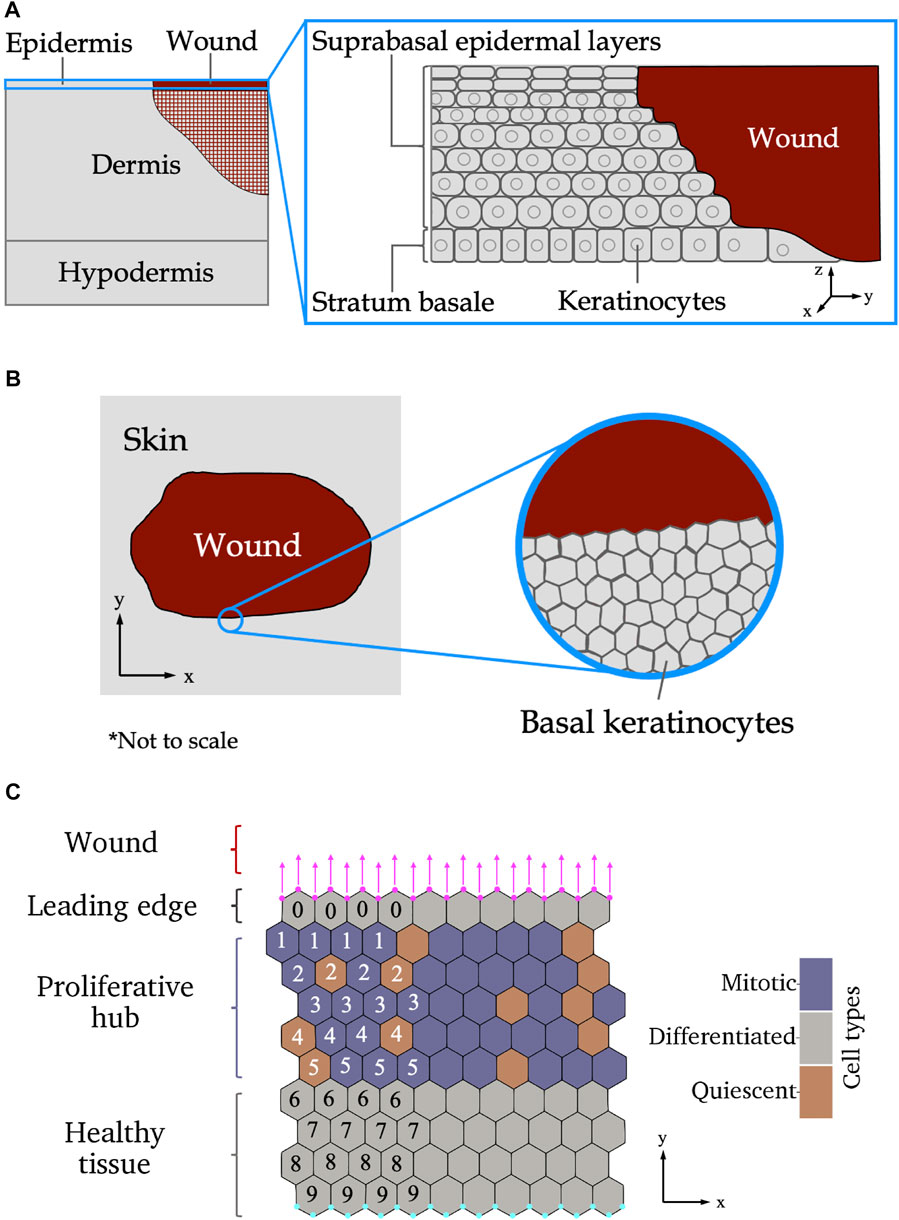
FIGURE 1. (A) Side-on view of wounded skin as the epidermis begins re-epitheliasation. Left: The different layers of the skin. The cross-hatched region in the dermis shows where other aspects of wound repair (such as extracellular matrix reformation) are occurring simultaneously to re-epitheliasation. Inset: layers of the epidermis. (B) Top-down view of wounded epidermal skin. Left: Tissue-scale view of the wound. Inset: cellular-level scale view of the stratum basale. (C) Schematic of the different wound regions of the stratum basale relevant to the modelling presented in this paper. The leading edge contains one row of keratinocytes adjacent to the wound edge. An additional force, shown by magenta arrows, is applied to the vertices on the wound boundary, shown as magenta circles. The proliferative hub contains cells that are able to divide, shown in purple. Cells coloured orange are not able to divide. Below the proliferative hub is healthy tissue—over the scale of our experiments, healthy tissue will have roughly the same structure throughout, therefore, no proliferative cell dynamics are included in the healthy tissue. The cyan coloured nodes at the bottom of the domain have their locations in the y-direction fixed. The numbers show how many cells are between the labelled cell and the wound (only a subset is shown here for illustrative purposes), and are used to define the size of the proliferative hub in the model. Axes indicate directions used throughout the paper.
Biological studies of the re-epitheliasation stage of wound healing at a cellular scale have determined that keratinocytes near the edge of a wound have migratory behaviours that are not present in homeostatic tissue (Liang et al., 2007; Clark et al., 2007). The cells in the region closest to the wound edge, known as the leading edge, are non-proliferative and actively migrate into the wounded space to promote wound closure (Safferling et al., 2013). Behind the leading edge, there is a band of proliferative cells, referred to as the proliferative hub (Coulombe, 2003). Stem cells from various niches in the skin are recruited to the proliferative hub, and then undergo mitosis to supply new cells to replace those lost during wounding (Gonzales and Fuchs, 2017; Ito et al., 2005; Levy et al., 2007). A top-down schematic of an epidermal wound at the tissue and cellular scales is given in Figure 1B. A schematic of the wound regions on a cellular scale is shown in Figure 1C. Different theories about the behaviour of cells in wounded tissue have emerged over the years (Rousselle et al., 2019). A recent in vivo experiment on wounded mouse tail skin, conducted by Aragona et al. (2017), defined the genetic and molecular markers of the leading edge and proliferative hub and tracked their size over time. In particular, Aragona et al. (2017) found that genes that code for multiple metalloproteinases (MMPs) that control cell migration were upregulated in the leading edge during wound healing. Another experiment on wounded mouse ear skin, performed by Park et al. (2017), used live imaging to show that the proliferative hub and leading edge overlap and captured the cellular behaviours of these two regions. However, it remains to be understood how varying the amounts of migration and proliferation in each region affects wound healing outcomes.
While technologies have advanced, there are still physical and ethical limitations to biological experiments. The research space between what is possible and what is unknown, can at least partially be filled by mathematical modelling and computational experiments. Historically, many mathematical models of wound healing have been formulated at a tissue level scale using continuum models (Flegg et al., 2015; Jorgensen and Sanders, 2016). One of the earliest mathematical model of wound healing, by Murray et al. (1988), was a mechanochemical continuum model of dermal wound contraction involving cell and extracellular matrix densities. The works of Sherratt and Murray (1990) and Tranquillo and Murray (1992) are other early, yet seminal, continuum models of wound healing. Later continuum models have modelled multiple cell and substance types in wounded skin across different wound stages to attempt to elucidate the mechanisms promoting healing (Jorgensen and Sanders, 2016; Flegg et al., 2020; Menon and Flegg, 2021). Oxygen availability within wounded and surrounding space is crucial to wound healing success, hence oxygen is commonly included in continuum mathematical models of wound healing (Knighton et al., 1981; Gordillo and Sen, 2003). Blood vessels provide oxygen and other nutrients to the wound. Therefore, the process of angiogenesis, the formation of new blood vessels, has been extensively studied (Flegg et al., 2015, 2020). Continuum models describe wound healing at a tissue scale well, but are unable to capture how individual cell behaviours affect healing outcomes.
One of the first models of wound healing to consider cells as discrete entities was by Dallon et al. (1999). In this model, fibroblast cells are represented by points that interact with the underlying extracellular matrix, which is represented by a continuum model. By using a discrete model for fibroblast cells, Dallon et al. (1999) were able to show the relationship between cell movement and the extracellular matrix during scar formation. Further cell-based models of wound healing have used more complicated geometries and relationships between subcellular molecules to investigate aspects of wound healing (Walker et al., 2004; Sun et al., 2009; Mosaffa et al., 2020). Sun et al. (2009) developed a multi-scale model to investigate the influence of regulatory factor TGF-β1 on keratinocyte migration and proliferation. Using computational and in vitro experiments (Walker et al., 2004), explored the effects of varying environmental calcium concentrations on cell behaviour and wound closure. Nagai and Honda (2006) have also used their off-lattice description of tissues to model wound healing. Their model of a small wound assumes that cells in healthy tissue are compressed, and when a wound is introduced, the compressed cells relax to fill the wounded space. Nagai and Honda (2009) later used their model to investigate different wound shapes and found that elliptical wounds heal quicker than circular wounds. We build upon Nagai and Honda’s model in this work to consider the effects of changing cell behaviours in the leading edge and proliferative hub, which are known to be important to re-epitheliasation during wound healing.
In this study we use a multi-cellular vertex dynamics model of keratinocytes in the stratum basale to explore the influence of the leading edge and proliferative hub on the growth of wounded tissue during 2 days of the re-epithlisation stage of wound healing. The remainder of this paper is structured as follows: We begin by introducing the mathematical model and defining the cellular characteristics of each wound region, we then present the key findings of the model and close by discussing the limitations of the model and avenues for future work.
2 Methods
In this section we present our model for wound healing of a small tissue (initially 10 cells high and 10 cells across) over 2 days of re-epitheliasation. Since the length and width of the tissue is much larger than the depth, and keratinocytes in the stratum basale have a columnar shape (Figures 1A,B) we approximate the monolayer by a two-dimensional model. We furthermore assume that the tissue is homogeneous so that periodic boundaries in the x-direction can be used, to represent a larger tissue (Figure 1C). Our model is an extension of the vertex model developed by Nagai and Honda (2001), Nagai and Honda (2006). We begin this section by summarising the existing cell vertex model and explaining the modifications developed for this work. The initial conditions and boundary conditions are described next. We then formally define the cellular characteristics of the leading edge and proliferative hub regions in the model. The concept of a “free tissue,” which will be used to qualitatively define different types of wound healing, is also introduced. Finally, we detail the numerical implementation of the model and provide links to the source code.
2.1 Vertex Model
The vertex model (or cell vertex model) developed by Nagai and Honda (2001), Nagai and Honda (2006) is used to model keratinocytes in the basal layer of the epidermis. In this model, each cell is represented by a polygon defined by its vertices, as shown in Figure 1C. Let {r1(t), …, rn(t)} be the set of n vertices contained in the system at time t, with
The vertices move according to deterministic mechanical forces. It is assumed that the motion of the vertices is overdamped and inertial terms are significantly smaller than dissipative terms (Purcell, 1977; Drasdo, 2000). Balancing forces on each vertex gives a first-order ordinary differential equation describing the motion of vertex ri(t):
where η denotes a drag coefficient and Fi(t) (with components
where
2.2 Boundary Conditions
We impose periodic boundary conditions in the x-direction, corresponding to simulating a small sub-section of a large, homogeneous wound (Christley et al., 2010). The periodic width is Lx = 10CDs. Vertices on the bottom boundary of the simulation (the cyan vertices in Figure 1C) are fixed in the y-direction, but free to move in the x-direction. The wounded boundary (shown by magenta vertices in Figure 1C) is a free boundary subject to the condition that all vertices on the boundary have the same y-velocity. By ensuring that all vertices on the free boundary have the same y-velocity, we prevent the wound edge from deforming in unrealistic ways and prevent cells detaching from the tissue (Section 2.4).
2.3 Initial Conditions
To define our initial conditions, we first generate a tissue ten cells wide and ten cells long. The cells are arranged in a “honeycomb” structure, where all cells are hexagonally shaped, with side lengths equal to 3−1/2 CDs. The boundary conditions are as described in Section 2.2. The simulation is then run until t = 5 h, when the tissue has reached an equilibrium1. This equilibrium configuration is used as the initial condition for the wound healing simulations. Note that increasing the width of the initial condition has a negligible effect on the results. In contrast, increasing the height of the tissue would allow the tissue to stretch further however qualitative behaviour is the same. For computational efficiency purposes, we restrict our initial conditions to ten cells high, noting that increasing the initial height of the tissue will quantitatively impact the results, however the qualitative observations will remain the same. We also note that this is a “static” equilibrium configuration, however, skin tissue has continual turnover and therefore such an equilibrium is not representative of the physical reality. Nevertheless, this initial condition is a reasonable approximation for the purposes of this investigation, since any cell turnover prior to re-epitheliasation involves cells being born into higher layers of the epidermis, and minimal structural change, on a tissue scale, in the basal layer of cells (Blanpain and Fuchs, 2009; Lai-Cheong and McGrath, 2013).
2.4 Leading Edge
Our model of the leading edge consists of a layer of non-proliferative (differentiated) cells adjacent to the wound, as shown in Figure 1C. These cells on the boundary of the wound-tissue interface are assigned an active force to promote migration into the wounded space. This force may represent mechanisms such as chemotaxis, where cells move in response to chemical stimuli, or durotaxis, cells moving in the direction of greater stiffness of the extracellular matrix (Zarkoob et al., 2018). The mean of the y-component of the forces on the vertices located on the wound-tissue boundary can be defined as:
where
where Factive is a parameter to be varied. The x-component of the force on the vertices is as described in Eq. 1. Here we have made the simplifying assumption that all cells along the wound-tissue boundary experience the same force to move into the wounded space. Specifying a leading edge one cell deep simulates a scenario with the quickest wound repair—if the leading edge were deeper, it would take longer for the migratory force to propagate through the tissue and influence the proliferative hub.
2.5 Proliferative hub
In the proliferative hub (Figure 1C), cells are able to undergo mitosis. Evidence suggests that keratinocytes in the basal layer of the epidermis progress through the cell cycle much more quickly during wound healing, with estimates of total cell cycle duration approximately 11 h in mice (compared to several days in healthy tissue) (Morris and Argyris, 1983). Our model assumes that the cells in the proliferative hub have a cell cycle duration drawn from a uniform distribution over [6, 16] hours, unless they are too small, in which case the cell becomes quiescent (the cell cycle is suspended). Choosing a wide support for the cell cycle duration distribution ensures that the simulations do not experience “pulsing,” where many cells proliferate at the same time (Slaymaker et al., 2012).
Allowing cells to become quiescent when they are too small is representative of a contact inhibited cell cycle model (Hirata et al., 2017; Pavel et al., 2018). At birth, each cell k is assigned a quiescent volume fraction, QVF(k), drawn from a uniform distribution over [μQVF − 0.025, μQVF + 0.025], where μQVF is the mean quiescent volume fraction of the tissue, to be varied. Recall that A(k)(t) is the area of cell k at time t and
then the cell becomes quiescent and the cell cycle is arrested. The cell cycle will resume when the cell’s area is larger than or equal to
We make the simplifying assumption that cells undergo symmetric division during wound healing. In other words, when a cell divides, the two daughter cells are of the same proliferative type. We note that while there are competing hypotheses pertaining to keratinocyte division during wound healing (Pastar et al., 2014; Rodrigues et al., 2019), the symmetric model used in this work examines the most extreme effects of cell division, where maximal numbers of cells can divide. Cell death is not incorporated into this model given cells at wound margins are unlikely to die within 2 days of re-epitheliasation, in the absence of further injury.
Experiments have shown that, for acute wounds, the proliferative hub grows in the first few days after wounding, and begins to shrink from approximately 4 days post-wounding until the wound has healed (Aragona et al., 2017). Here we consider two models of the proliferative hub over 2 days: Continual growth and bounded growth. In the continual growth model, the proliferative hub is able to grow over time as the tissue grows. In this model, all new cells in the system are born into the proliferative hub. The growth model would represent the most effective type of wound healing, however, it is physically unrealistic to assume that the proliferative hub can continue to grow without bound. In contrast, the bounded growth model assigns a maximum size of the proliferative hub at the start of the simulation. The proliferative hub is either initialised to its maximum assigned size, if the initial conditions are large enough, or grows to its maximal size through cell division events, after which its size remains constant.
To determine the proliferative hub size, we begin by defining the cell distance to the wound. Cells at the wound-tissue boundary (the leading edge cells) have a cell distance to the wound, dwound, of 0—in other words, the cells in the leading edge are at the wound boundary. Neighbours of the cells in the leading edge that are not themselves in the leading edge are defined to have dwound = 1 (they are one cell away from the wound edge). Then neighbours of the cells with dwound = 1 who do not have dwound ≤ 1 are defined to have dwound = 2, and so on. An example of this distance labelling is given in Figure 1C. In the bounded model, the top boundary of the proliferative hub is always defined to be the cells with dwound = 1. The bottom boundary of the proliferative hub is then defined as cells with dwound = dmax, where dmax is the size of the proliferative hub, which varies. For a proliferative hub of size dmax, cells with 1 ≤ dwound ≤ dmax are in the proliferative hub and are able to divide if they are large enough and old enough (recall that cells are assigned a cell cycle duration at birth, that may be paused due to quiescence). We have chosen to use cell distance to the wound, rather than absolute distance to the wound, to define the proliferative hub size so that the number of cells in a bounded proliferative hub is roughly constant for all values of the active migratory force.
2.6 Free Tissue
To determine whether a tissue is healing “effectively” or not, we introduce the concept of a free tissue. A free tissue is one in which cells do not divide (i.e., there is no proliferative hub), and where the vertices on the bottom of the tissue are not fixed in the y-direction (the cyan vertices in Figure 1C are not subject to boundary conditions, and can leave the bottom of the domain). Free tissues still contain a leading edge, where vertices on the top boundary of the tissue (magenta vertices in Figure 1C) are subject to the migratory force defined in Eq. 5. The free tissue represents an unconstrained tissue moving, through mechanisms such as chemotaxis or durotaxis, into wounded space. An example of the free tissue is given in the background of Figures 2A,C.
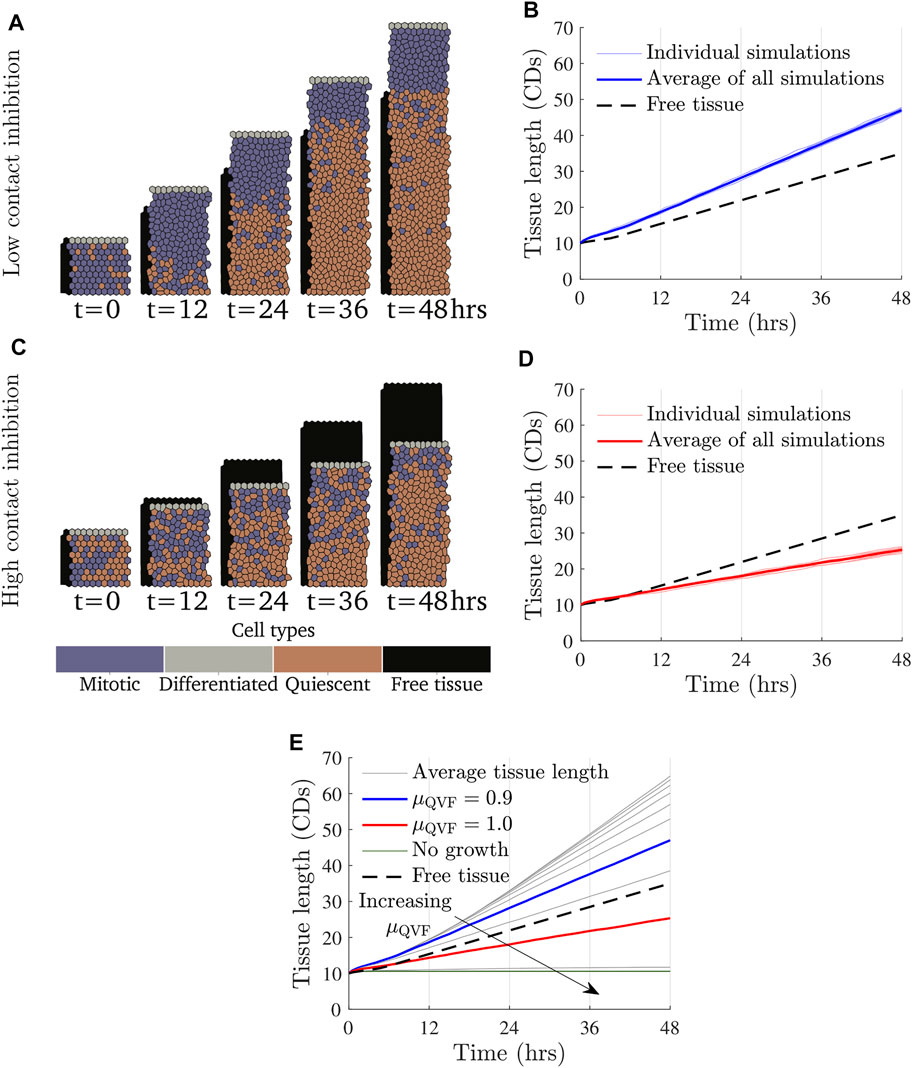
FIGURE 2. Tissue growth for a fixed value of the migratory force and varying values of μQVF, or equivalently, varying the amount of contact inhibition under the continual growth proliferative hub model. Simulation snapshots with Factive = 3 kg CDs/h2 and (A) μQVF = 0.9 (Supplementary Video S1) and (C) μQVF = 1.0 (Supplementary Video S2), with a free tissue with Factive = 3 kg CDs/h2 shown behind in black. (B,D) show tissue length over time for μQVF = 0.9 and μQVF = 1.0, respectively, with vertical grid lines corresponding to the times of the simulation snapshots in (A,C). Different random seeds are shown in thin, light lines, with the average represented with a thick coloured line. The tissue length for the free tissue is shown with a black dashed line. (E) Average tissue length against time for μQVF = 0.6, 0.65, …, 1.05, in grey, and μQVF = 1.1, 1.15, 1.2 in green and horizontal, with an arrow indicating increasing μQVF. The blue line is the same as in (B) and the red line is as in (D).
2.7 Implementation
The simulations in this work were implemented in Chaste, on open source software package for computational modelling of biological problems, implemented in C++ (Pitt-Francis et al., 2009; Mirams et al., 2013; Cooper et al., 2020). The code for this project is available via https://github.com/zancaa/WoundHealingPushVsPull. The time step in Eq. 3 was chosen such that any smaller choice of time step yields qualitatively similar results, so our results have converged. All other parameters in the model were selected by surveying the literature or are explored in this work. Unless stated otherwise, the parameter values we use are given in Table 1. There is a numerically imposed lower bound for μQVF of 0.6, as smaller values result in such high levels of cell division that the cells deform into unrealistic shapes and the simulations quickly become unrealistic. The simulations conclude after 48 h (2 days). However, if the simulated tissue size reaches 2,500 cells, the simulation is terminated to ensure that computational costs and run time remain reasonable.
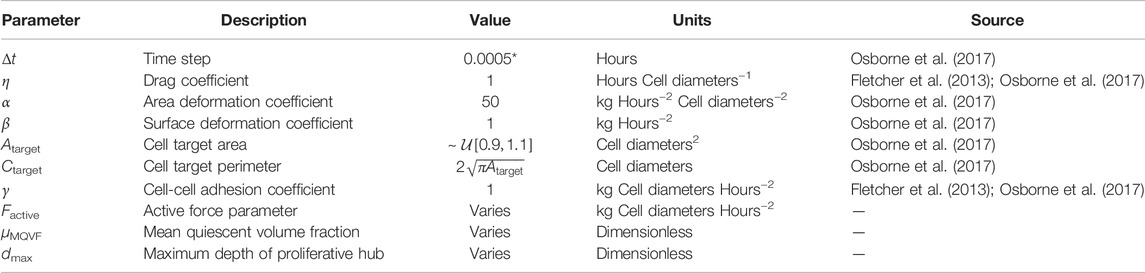
TABLE 1. Parameter values for simulations. Atarget is distributed uniformly on an interval centred on the target area from previous works (Osborne et al., 2017). *A smaller time step than Osborne et al. (2017) was used to account for forces of larger magnitude used in this work.
3 Results
By running and analysing multiple simulations of our model we are able to identify behaviours relevant to wound healing of the skin. We present our findings below.
3.1 Contact Inhibition Slows the Rate of Wound Healing
In the continual growth proliferative hub model, where the proliferative hub size grows with the tissue, we find that the rate of wound repair is driven primarily by contact inhibited cell proliferation. The effect of changing the amount of contact inhibition, in other words, varying μQVF, and therefore cell proliferation, is demonstrated in Figure 2. Figures 2A,B show how a wounded tissue with low levels of contact inhibition grows over time. Supplementary Video S1 shows additional frames of the simulation. In this case, the tissue grows more quickly than a free tissue (Section 2.6) moving into wounded space. In contrast, Figures 2C,D (Supplementary Video S2) illustrate how a wounded tissue with high levels of contact inhibition grows, or rather, does not grow as much as the free tissue or the tissue with low contact inhibition. We also find that a largely quiescent region develops over time. This can be seen in Figure 2A, where there is an area of mostly quiescent (orange) cells after t = 24 h. The development of a quiescent region occurs independently of the strength of the force (qualitative results omitted for brevity). For simulations where there is little contact inhibition, all tissues grow at a similar rate until a quiescent region develops, when tissue growth becomes linear. Figure 2E shows that tissues with distinct, low levels of contact inhibition grow at the same rate until around t = 12 h, when tissues with higher, but still small, amounts of contact inhibition start to develop quiescent regions. This result suggests that allowing the proliferative hub to undergo continual growth may have a limited impact if the cells in the leading edge cannot migrate into the wounded space fast enough to prevent overcrowding in the proliferative hub. Figure 2E also illustrates that if too few cells are able to divide (μQVF > 1.05, the green, horizontal lines in Figure 2E), the wounded tissue grows very little, or not at all.
Observing the tissue velocity, as in Figures 3A,B, we note that while the instantaneous velocity of the wound edge in the simulations varies due to cell division events, the average velocity for the last 12 h of the simulation (after the quiescent region has emerged) is approximately constant, corresponding to linear tissue growth. The velocity of the free tissue is constant, by definition. Using the average of the wound edge velocity over the last 12 h of the simulation, we can compare the rate of wound repair to free tissue, as seen in Figure 3C. Wound repair can be split into three regions based on the amount of contact inhibition. The proliferation enhanced region, shaded blue in Figure 3C, corresponds to the contact inhibition levels being low enough that the wound can repair faster than the free tissue with the same migratory force. The proliferation inhibited region, shaded red in Figure 3C, is where the contact inhibition levels are so high that there is not enough cell division for the wound to repair as fast as the free tissue. Finally, there is a region of no growth, shaded grey in Figure 3C, where contact inhibition levels are very high and a negligible amount of repair occurs—specifically, when the average tissue velocity over the last 12 h is less than 0.0025 CDs/h. In the case of Factive = 3 kg CDs/h2, as in Figure 3C, the boundary between the proliferative enhanced and inhibited regions is μQVF ≈ 0.955, and if μQVF ≳ 1.075, then there is no tissue growth. Figure 3C also demonstrates that for a fixed force acting on the leading edge, increasing the level of contact inhibition decreases the rate of wound repair in a non-linear fashion.
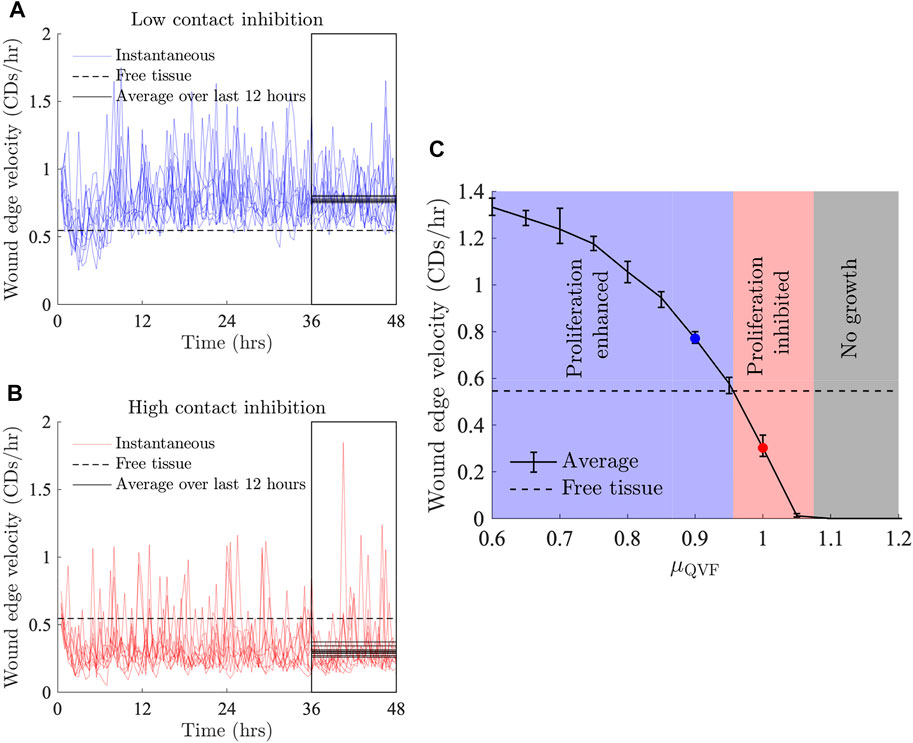
FIGURE 3. Wound edge velocity against time for Factive = 3 kg CDs/h2 and (A) μQVF = 0.9, and (B) μQVF = 1. The instantaneous velocity for individual seeds are shown in light thin lines and the velocity of a free tissue with Factive = 3 kg CDs/h2 is shown with a black dashed line. The average wound edge velocity for each set of parameter values is taken to be the average wound edge velocity of the last 12 h of the simulations, indicated by the boxed area. Average wound edge velocities for individual simulations are shown in solid black lines over the last 12 h, representing a point estimate for the rate of wound healing for each simulation. (C) Average wound edge velocity against μQVF. The blue shaded region shows the proliferation enhanced region, where the average wound edge velocity is greater than the free tissue velocity, as in (A), for example. The red shaded region indicates the proliferation inhibited region, of which (B) is an example. The grey shaded region shows where there is no tissue growth. The blue and red markers correspond to the average of the black solid lines in (A,B), respectively. Error bars show the 10th and 90th quantiles.
3.2 Contact Inhibition Controls Rate of Healing for all Levels of Migratory Force
In Figure 4 we present the three tissue growth regions for a range of migratory forces, along with example tissues in each region over time. For small values of migratory force, even small amounts of cell division will allow the wounded tissue to outpace the free tissue. Therefore, the boundary between the proliferation enhanced and proliferation inhibited regions for small forces occur at a high level of contact inhibition. For example, if Factive = 1 kg CD/h2, then the boundary between the proliferation enhanced and inhibited regions is μQVF ≈ 0.96. As the force increases, more cell division is needed for the wounded tissue to repair more quickly than the free tissue, thus the threshold between the proliferation enhanced and inhibited regions shifts to lower levels of contact inhibition. For example, when Factive = 8 kg CDs/h2, then the boundary between the proliferation enhanced and inhibited regions is μQVF ≈ 0.7. If Factive ≳ 8.5 kg CDs/h2, then there will never be sufficient amounts of cell division (for μQVF ≥ 0.6) to allow a tissue of this size to heal faster than the free tissue for our choice of baseline parameters (Table 1).
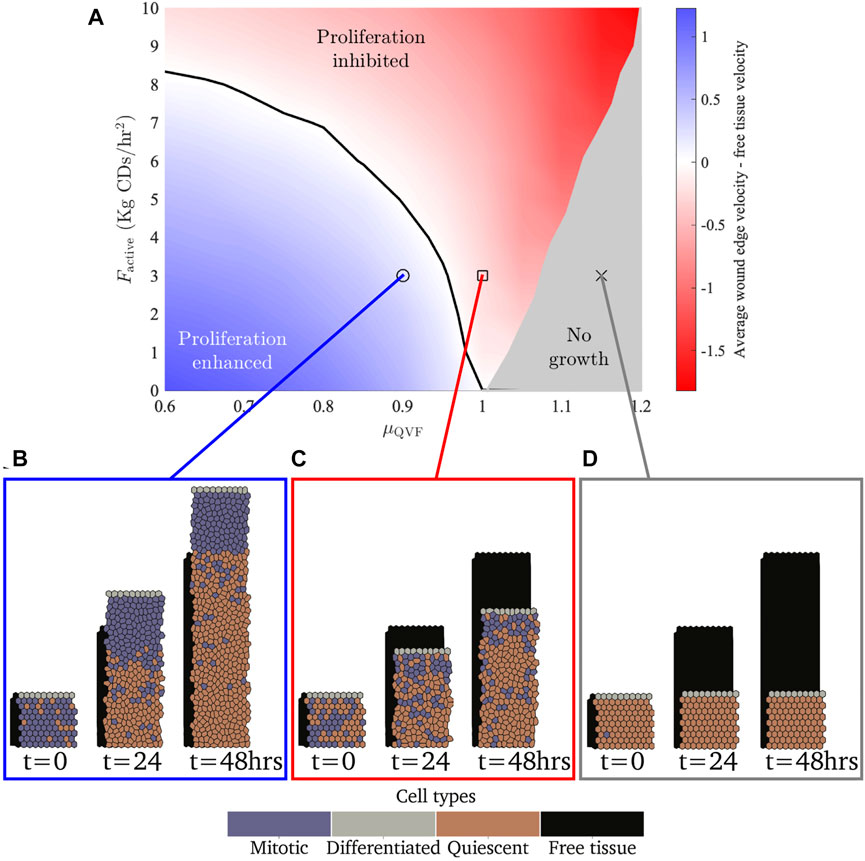
FIGURE 4. (A) Parameter space showing the difference between the average wound edge velocity and free tissue edge velocity for different active forces and quiescence thresholds. The blue region shows where the amount of proliferation allows the tissue to move more than a free tissue with the same force applied. The red region shows where there is not sufficient cell division for the tissue to move faster than the free tissue. The black contour shows where the tissue moves at the same velocity as the free tissue. The grey region shows where there is no tissue growth. (B–D) Example simulation snapshots for the different regions, with a free tissue with Factive = 3 kg CDs/h2 shown behind in black. Note that (B,C) are extractions from Figures 2A,C, respectively.
While these larger forces do not attain a proliferation enhanced region, they do cause cells to stretch and increase their area, leading to cells being less likely to be quiescent (Eq. 6). Consequently, the no growth region for larger forces requires higher levels of contact inhibition. The boundary between tissue growth and no growth for a tissue with Factive = 10 kg CDs/h2 is μQVF ≈ 1.2, in contrast with Factive = 0, where the boundary is μQVF ≈ 1. for We observe that for high levels of contact inhibition, μQVF ≥ 1.2, where no cell division occurs for any level of migratory force (0 ≤ Factive ≤ 10 kg CDs/h2), all tissues will exhibit the same behaviour as Figure 4D, with cells stretched to various degrees depending on the applied force. This suggests that effective wound repair for large wounds cannot occur without cell proliferation. However, the strength of the migratory force at the leading edge, while on its own is not sufficient to enable wound closure, is important to prevent overcrowding in the proliferative hub so that cells are able to divide.
3.3 Proliferative Hub Size is an Alternative Mediator for Wound Healing Rate
If we instead enforce an upper bound on the size of the proliferative hub—representing a scenario where the proliferative hub size is controlled by chemical signalling, for example—wounded tissue growth is, naturally, limited in comparison to tissues in which the proliferative hub is able to grow continually. Figures 5A,B (Supplementary Video S3) illustrate how restricting the size of the proliferative hub slows tissue growth. Unlike the continual growth case, the proliferative hub in the bounded growth scenario does not develop a quiescent region for hub sizes less than ten, as there is always enough space in the bounded proliferative hub for cells to grow and divide. Furthermore, the sections of the tissue below the proliferative hub at the start of the simulation (if any) remain largely fixed over time, in line with the assumption that the structure of the healthy tissue behind the proliferative hub is relatively unaffected by the wound healing process.
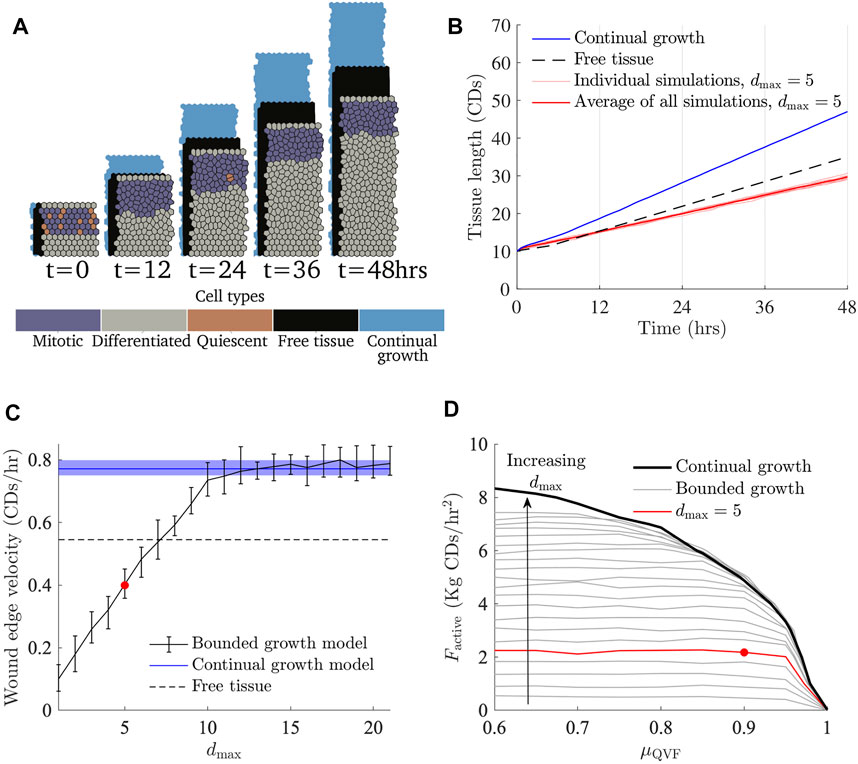
FIGURE 5. The effects of restricting the size of the proliferative hub. (A) Simulation snapshots with Factive = 3 kg CDs/h2, μQVF = 0.9 and a proliferative hub size five cells deep (Supplementary Video S3), with the corresponding free tissue shown behind in black and tissue under the continual growth model of the proliferative hub shown behind in blue (Figure 2A). (B) Tissue length over time, with different seeds are shown in thin red lines, and the average represented with a thick red line. The tissue length for the continual growth model (Figure 2B) is represented by a solid blue line and free tissue is shown with a dashed black line. (C) Wound edge velocity against proliferative hub size with Factive = 3 Kg CDs/h2 and μQVF = 0.9. The wound edge velocity of a tissue under the continual growth model is indicated by a blue solid line, with the shaded blue region showing the area between the 10th and 90th quantiles. The black solid line with error bars shows the average and 10th and 90th percentiles for the bounded growth model. The black dashed line shows the free tissue velocity and the red marker indicates the average velocity for the simulations shown in (A,B). (D) Curves showing where the wound edge velocity is equal to free tissue for different proliferative hub sizes, shown in grey. The arrow indicates increasing hub size. The red curve shows the free tissue contour with a hub size five cells deep, corresponding to (A,B). The black curve is the free tissue contour under the continual growth model of the proliferative hub (Figure 4A). The red marker shows the parameters for the simulations in (A,B).
The average wound edge velocity grows linearly until the hub size is ten, then asymptotes to the velocity of a tissue under the continual growth model. For a proliferative hub size larger than 12 cells deep, quiescent regions start to develop within the hub and the behaviour matches the continual growth proliferative hub case, as can be seen in Figure 5C. For bounded proliferative hubs that do not develop quiescent regions, the boundary between the proliferation enhanced and proliferation restricted regions is independent of the levels of contact inhibition when μQVF ≤ 0.85, as Figure 5D shows. For each maximum proliferative hub size, there is a maximum free tissue speed that the wound cannot outpace. For example, a tissue with a proliferative hub of size five can never outpace a free tissue with a migratory force of approximately 2.2 kg CDs/h2. The flatter part of the contours in Figure 5D correspond to the maximum free tissue force speed that simulations with the corresponding hub size can reach. For low levels of contact inhibition, μQVF ≲ 0.85, the boundary between the proliferation inhibited and enhanced regions grows linearly with the proliferative hub size. However, as the level of contact inhibition increases between μQVF ≈ 0.9 and μQVF ≈ 0.99, the boundary between the two regions increases at a slower rate. At μQVF = 1, the boundary is the same for all proliferative hub sizes, reflecting that there is not enough cell division at this level of contact inhibition for the wounded tissue to grow faster than the free tissue. Provided that the contact inhibition levels are not too high, specifically μQVF < 0.9, then in the bounded growth proliferative hub size model, the maximum size of the proliferative hub is the most important factor driving wound healing, rather than the level of contact inhibition.
4 Discussion
This work has used a two-dimensional vertex model to investigate the effects of keratinocyte division and migration in the deepest layer of the epidermis during wound healing. We find that cell migration, due to cells migrating into the wounded space, has a negligible impact on wound repair without sufficient cell proliferation. Under the assumption of contact inhibited symmetric cell division and a proliferative hub that experiences continual growth, a quiescent region will develop that will restrict the amount of cell division that can occur (Figure 2A). If the size of the proliferative hub is bounded, we find that wounded tissues behave similarly for a range of contact inhibition levels and the size of the proliferative hub is the primary driver of tissue repair. Both mechanisms for limiting the proliferative hub size—contact inhibited or distance to wound limited—also restrict tissue repair. However, this model makes simplifying assumptions that could be improved upon.
This simplified model could be expanded on by including a more nuanced migratory force that does not act only on the vertices at the wound edge. For example, a graded force that is stronger near the wound edge and which decreases in magnitude further away from the edge could allow for overlapping proliferative hub and leading edge regions, as proposed by Park et al. (2017). Moreover, it is understood that keratinocytes in wounded epidermis loosen their adhesion to each other during healing, and therefore a more realistic model could also consider modifying the forces along cell edges depending on the distance to the wound. The migratory forces used in this work also assume that all cells along the wound boundary experience the same force, and therefore migrate into the wounded space at the same speed, resulting in the shape of the wound edge being constant over time. In reality, wound edges can be highly irregular, and any investigations into wound shape should be able to account for such edge shape irregularities.
An additional simplification of this work is that cell division is symmetric and that the average cell cycle duration remains constant over time unless it is affected by contact inhibition. Experiments have shown that average keratinocyte cell cycle durations and the proliferative hub size both increase over time during wound healing (Morris and Argyris, 1983; Aragona et al., 2017). The biological literature suggests that of the basal keratinocytes that divide in healthy tissue, 8% generate two proliferative daughter cells, 84% undergo asymmetric division, where one daughter cell is proliferative and one is differentiated, and 8% produce only differentiated daughter cells (Clayton et al., 2007; Jones et al., 2007). In wounded skin, additional proliferative cells are recruited from various stem cell niches found in skin (Taylor et al., 2000; Sada et al., 2016; Ito et al., 2004). These proliferative cells behave differently in wounded skin compared to homeostasis, however, how the cells change their phenotype is an ongoing area of research (Dekoninck and Blanpain, 2019). Regardless of the mode of division, not all daughter cells resulting from cell division will be located in the xy-plane, but some daughter cells will also be born into the layer of the epidermis above the one modelled in this work (the suprabasal layers in Figure 1A). A three-dimensional model of wound healing could capture these cell division dynamics, and investigate other aspects of wound healing not covered here, such as the impacts of suprabasal cell division in chronic wounds, or cell migration in the upper layers of the epidermis during acute wound healing (Mannik et al., 2010; Rousselle et al., 2019).
Our model only includes cellular level contributions to wound repair. There are multiple avenues for extending the model to include interactions with other spatial scales. On the subcellular scale, signalling pathways, such as the transforming growth factor β1 and mitogen activated protein kinase pathways, could be included using continuum models to control cell proliferation and motility (Chigurupati et al., 2007; Van Leeuwen et al., 2009; Posta and Chou, 2010). Alternatively, at a tissue scale, a hybrid model could be developed where cells are modelled as discrete entities and their behaviour is related to the underlying extracellular matrix, or other nutrients, whose density may be described using a continuum model (Wang et al., 2019). A different approach is to convert the existing discrete model to a continuum model, that can then be related to wound healing processes in the deeper layers of skin (Tambyah et al., 2020; Murphy et al., 2021).
5 Conclusion
We use a multi-cellular, two-dimensional vertex model of the basal layer of the epidermis to explore the influence of the leading edge and proliferative hub in the re-epitheliasation stage of wound healing. We find that the leading edge cannot significantly contribute to tissue repair without cell division in the proliferative hub, and thus cell proliferation characteristics are crucial to successful wound healing. We investigate two hypotheses for mediating cell proliferation: Contact inhibition only and contact inhibition in conjunction with a bounded proliferative hub size. If the proliferative hub is able to continually increase in size with the growth of new tissue, a quiescent region will develop due to contact inhibition, that will impose a threshold on the amount of cell division, and therefore tissue repair, that can occur. In contrast, if an upper bound is imposed on the size of the proliferative hub, then cell overcrowding is less likely to occur and the value of the upper bound has a greater influence on the rate of wound closure than contact inhibition. Although the bounded proliferative hub size model is more realistic, both models demonstrate the importance of the leading edge in allowing space for cell division events. Hence the coordination of the leading edge and proliferative hub is necessary for effective wound closure. This work only considers early re-epitheliasation, but lays a foundation for exploring later stages of healing, where the leading edge and proliferative hub shrink, or could be expanded on to investigate alternative mechanisms to control tissue growth in early wound healing, such as asymmetric cell division or signalling pathways promoting cell migration and proliferation. Furthermore, alterations to the cellular dynamics could be used to understand the mechanics of impaired wound healing.
Data Availability Statement
The original contributions presented in the study are included in the article/Supplementary Material, further inquiries can be directed to the corresponding author.
Author Contributions
AZ, JO, and JF conceived the study. AZ conducted the simulations and drafted the manuscript. All authors reviewed the manuscript and gave final approval for publication.
Funding
Australian Government Research Training Program scholarship to AZ. JF’s research is supported by the Australian Research Council (DE160100227, DP200100747).
Conflict of Interest
The authors declare that the research was conducted in the absence of any commercial or financial relationships that could be construed as a potential conflict of interest.
Publisher’s Note
All claims expressed in this article are solely those of the authors and do not necessarily represent those of their affiliated organizations, or those of the publisher, the editors and the reviewers. Any product that may be evaluated in this article, or claim that may be made by its manufacturer, is not guaranteed or endorsed by the publisher.
Supplementary Material
The Supplementary Material for this article can be found online at: https://www.frontiersin.org/articles/10.3389/fsysb.2022.876075/full#supplementary-material
Supplementary Video S1 | Simulation with Factive = 3, μQVF = 0.9, using the continual growth model of the proliferative hub. The legend labels for Supplementary Videos S1, S2 are: “M” denotes mitotic cells, “D” denotes differentiated cells, “Q” denotes quiescent cells, and “FT” denotes the free tissue outline in the background. Refer to Figure 2A.
Supplementary Video S2 | Simulation with Factive = 3, μQVF = 1.0, using the continual growth model of the proliferative hub. Refer to Figure 2C.
Supplementary Video S3 | Simulation with Factive = 3, μQVF = 0.9 and dmax = 5, using the bounded growth model of the proliferative hub. The legend is the same as Supplementary Videos S1, S2 with the addition of “CM” denoting the continual growth model outline in the background. Refer to Figure 5A.
Footnotes
1If all target areas were set to the same value of
References
Aragona, M., Dekoninck, S., Rulands, S., Lenglez, S., Mascré, G., Simons, B. D., et al. (2017). Defining Stem Cell Dynamics and Migration during Wound Healing in Mouse Skin Epidermis. Nat. Commun. 8, 14684. doi:10.1038/ncomms14684
Bereiter-Hahn, J. (1984). “Epidermal Cell Migration and Wound Repair,” in Biology of the Integument (Berlin and Heidelberg: Springer-Verlag), 443–471. doi:10.1007/978-3-662-00989-5_23
Blanpain, C., and Fuchs, E. (2009). Epidermal Homeostasis: a Balancing Act of Stem Cells in the Skin. Nat. Rev. Mol. Cel Biol 10, 207–217. doi:10.1038/nrm2636
Brem, H., Stojadinovic, O., Diegelmann, R. F., Entero, H., Lee, B., Pastar, I., et al. (2007). Molecular Markers in Patients with Chronic Wounds to Guide Surgical Debridement. Mol. Med. 13, 30–39. doi:10.2119/2006-00054.brem
Burns, T., Breathnach, S. M., Cox, N., and Griffiths, C. (2008). Rook’s Textbook of Dermatology. Oxford: John Wiley & Sons.
Chigurupati, S., Arumugam, T. V., Son, T. G., Lathia, J. D., Jameel, S., Mughal, M. R., et al. (2007). Involvement of Notch Signaling in Wound Healing. PLoS One 2, e1167. doi:10.1371/journal.pone.0001167
Christley, S., Lee, B., Dai, X., and Nie, Q. (2010). Integrative Multicellular Biological Modeling: a Case Study of 3D Epidermal Development Using Gpu Algorithms. BMC Syst. Biol. 4, 107. doi:10.1186/1752-0509-4-107
Clark, R. A. F., Ghosh, K., and Tonnesen, M. G. (2007). Tissue Engineering for Cutaneous Wounds. J. Invest. Dermatol. 127, 1018–1029. doi:10.1038/sj.jid.5700715
Clayton, E., Doupé, D. P., Klein, A. M., Winton, D. J., Simons, B. D., and Jones, P. H. (2007). A Single Type of Progenitor Cell Maintains normal Epidermis. Nature 446, 185–189. doi:10.1038/nature05574
Cooper, F. R., Baker, R. E., Bernabeu, M. O., Bordas, R., Bowler, L., Bueno-Orovio, A., et al. (2020). Chaste: Cancer, Heart and Soft Tissue Environment. J. Open Source Softw. 5 (47), 1848. doi:10.21105/joss.01848
Coulombe, P. A. (2003). Wound Epithelialization: Accelerationg the Pace of Discovery. J. Invest. Dermatol. 121, 219–230. doi:10.1046/j.1523-1747.2003.12387.x
Dallon, J. C., Sherratt, J. A., and Maini, P. K. (1999). Mathematical Modelling of Extracellular Matrix Dynamics Using Discrete Cells: Fiber Orientation and Tissue Regeneration. J. Theor. Biol. 199, 449–471. doi:10.1006/jtbi.1999.0971
Dekoninck, S., and Blanpain, C. (2019). Stem Cell Dynamics, Migration and Plasticity during Wound Healing. Nat. Cel Biol 21, 18–24. doi:10.1038/s41556-018-0237-6
Drasdo, D. (2000). Buckling Instabilities of One-Layered Growing Tissues. Phys. Rev. Lett. 84, 4244–4247. doi:10.1103/physrevlett.84.4244
Enoch, S., and Leaper, D. J. (2008). Basic Science of Wound Healing. Surgery (Oxford) 26, 31–37. doi:10.1016/j.mpsur.2007.11.005
Flegg, J. A., Menon, S. N., Maini, P. K., and McElwain, D. L. (2015). On the Mathematical Modeling of Wound Healing Angiogenesis in Skin as a Reaction-Transport Process. Front. Physiol. 6, 262. doi:10.3389/fphys.2015.00262
Flegg, J. A., Menon, S. N., Byrne, H. M., and McElwain, D. L. S. (2020). A Current Perspective on Wound Healing and Tumour-Induced Angiogenesis. Bull. Math. Biol. 82, 23. doi:10.1007/s11538-020-00696-0
Fletcher, A. G., Osborne, J. M., Maini, P. K., and Gavaghan, D. J. (2013). Implementing Vertex Dynamics Models of Cell Populations in Biology within a Consistent Computational Framework. Prog. Biophys. Mol. Biol. 113, 299–326. doi:10.1016/j.pbiomolbio.2013.09.003
Fuchs, C., Pham, L., Henderson, J., Stalnaker, K. J., Anderson, R. R., and Tam, J. (2021). Multi-faceted Enhancement of Full-Thickness Skin Wound Healing by Treatment with Autologous Micro Skin Tissue Columns. Sci. Rep. 11, 1–13. doi:10.1038/s41598-021-81179-7
Gao, F. L., Jin, R., Zhang, L., and Zhang, Y. G. (2013). The Contribution of Melanocytes to Pathological Scar Formation during Wound Healing. Int. J. Clin. Exp. Med. 6, 609–613.
Gonzales, K. A. U., and Fuchs, E. (2017). Skin and its Regenerative powers: an alliance between Stem Cells and Their Niche. Develop. Cel 43, 387–401. doi:10.1016/j.devcel.2017.10.001
Gonzalez, A. C. d. O., Costa, T. F., Andrade, Z. d. A., and Medrado, A. R. A. P. (2016). Wound Healing - A Literature Review. Bras. Dermatol. 91, 614–620. doi:10.1590/abd1806-4841.20164741
Gordillo, G. M., and Sen, C. K. (2003). Revisiting the Essential Role of Oxygen in Wound Healing. Am. J. Surg. 186, 259–263. doi:10.1016/s0002-9610(03)00211-3
Han, G., and Ceilley, R. (2017). Chronic Wound Healing: a Review of Current Management and Treatments. Adv. Ther. 34, 599–610. doi:10.1007/s12325-017-0478-y
Hirata, H., Samsonov, M., and Sokabe, M. (2017). Actomyosin Contractility Provokes Contact Inhibition in E-Cadherin-Ligated Keratinocytes. Sci. Rep. 7, 1–11. doi:10.1038/srep46326
Honari, G. (2017). “Skin Structure and Function,” in Sensitive Skin Syndrome (Boca Raton, FL: CRC Press), 16–22. doi:10.1201/9781315121048-3
Honda, H. (1978). Description of Cellular Patterns by Dirichlet Domains: the Two-Dimensional Case. J. Theor. Biol. 72, 523–543. doi:10.1016/0022-5193(78)90315-6
Ito, M., Cotsarelis, G., Kizawa, K., and Hamada, K. (2004). Hair Follicle Stem Cells in the Lower Bulge Form the Secondary Germ, a Biochemically Distinct but Functionally Equivalent Progenitor Cell Population, at the Termination of Catagen. Differentiation 72, 548–557. doi:10.1111/j.1432-0436.2004.07209008.x
Ito, M., Liu, Y., Yang, Z., Nguyen, J., Liang, F., Morris, R. J., et al. (2005). Stem Cells in the Hair Follicle Bulge Contribute to Wound Repair but Not to Homeostasis of the Epidermis. Nat. Med. 11, 1351–1354. doi:10.1038/nm1328
Jones, P. H., Simons, B. D., and Watt, F. M. (2007). Sic Transit Gloria: Farewell to the Epidermal Transit Amplifying Cell? Cell Stem Cell 1, 371–381. doi:10.1016/j.stem.2007.09.014
Jorgensen, S. N., and Sanders, J. R. (2016). Mathematical Models of Wound Healing and Closure: a Comprehensive Review. Med. Biol. Eng. Comput. 54, 1297–1316. doi:10.1007/s11517-015-1435-z
Kapp, S., Miller, C., and Santamaria, N. (2018). The Quality of Life of People Who Have Chronic Wounds and Who Self-Treat. J. Clin. Nurs. 27, 182–192. doi:10.1111/jocn.13870
Knighton, D. R., Silver, I. A., and Hunt, T. K. (1981). Regulation of Wound-Healing Angiogenesis-Effect of Oxygen Gradients and Inspired Oxygen Concentration. Surgery 90, 262–270.
Krawczyk, W. S. (1971). A Pattern of Epidermal Cell Migration during Wound Healing. J. Cel Biol. 49, 247–263. doi:10.1083/jcb.49.2.247
Lai-Cheong, J. E., and McGrath, J. A. (2013). Structure and Function of Skin, Hair and Nails. Medicine 41, 317–320. doi:10.1016/j.mpmed.2013.04.017
Levy, V., Lindon, C., Zheng, Y., Harfe, B. D., and Morgan, B. A. (2007). Epidermal Stem Cells Arise from the Hair Follicle after Wounding. FASEB j. 21, 1358–1366. doi:10.1096/fj.06-6926com
Liang, C.-C., Park, A. Y., and Guan, J.-L. (2007). In Vitro scratch Assay: a Convenient and Inexpensive Method for Analysis of Cell Migration In Vitro. Nat. Protoc. 2, 329–333. doi:10.1038/nprot.2007.30
Mannik, J., Alzayady, K., and Ghazizadeh, S. (2010). Regeneration of Multilineage Skin Epithelia by Differentiated Keratinocytes. J. Invest. Dermatol. 130, 388–397. doi:10.1038/jid.2009.244
Menon, S. N., and Flegg, J. A. (2021). Mathematical Modeling Can advance Wound Healing Research. Adv. Wound Care 10, 328–344. doi:10.1089/wound.2019.1132
Mirams, G. R., Arthurs, C. J., Bernabeu, M. O., Bordas, R., Cooper, J., Corrias, A., et al. (2013). Chaste: an Open Source C++ Library for Computational Physiology and Biology. Plos Comput. Biol. 9, e1002970. doi:10.1371/journal.pcbi.1002970
Morris, R., and Argyris, T. S. (1983). Epidermal Cell Cycle and Transit Times during Hyperplastic Growth Induced by Abrasion or Treatment with 12-O-Tetradecanoylphorbol-13-Acetate. Cancer Res. 43, 4935–4942.
Mosaffa, P., Tetley, R. J., Rodríguez-Ferran, A., Mao, Y., and Muñoz, J. J. (2020). Junctional and Cytoplasmic Contributions in Wound Healing. J. R. Soc. Interf. 17, 20200264. doi:10.1098/rsif.2020.0264
Murphy, R. J., Buenzli, P. R., Tambyah, T. A., Thompson, E. W., Hugo, H. J., Baker, R. E., et al. (2021). The Role of Mechanical Interactions in Emt. Phys. Biol. 18, 046001. doi:10.1088/1478-3975/abf425
Murray, J. D., Maini, P. K., and Tranquillo, R. T. (1988). Mechanochemical Models for Generating Biological Pattern and Form in Development. Phys. Rep. 171, 59–84. doi:10.1016/0370-1573(88)90003-8
Murray, J. (2003). Mathematical Biology II: Spatial Models and Biomedical Applications. Berlin and Heidelberg: Springer.
Nagai, T., and Honda, H. (2009). Computer Simulation of Wound Closure in Epithelial Tissues: Cell-Basal-Lamina Adhesion. Phys. Rev. E Stat. Nonlin Soft Matter Phys. 80, 061903. doi:10.1103/PhysRevE.80.061903
Nagai, T., and Honda, H. (2001). A Dynamic Cell Model for the Formation of Epithelial Tissues. Philosophical Mag. B 81, 699–719. doi:10.1080/13642810108205772
Nagai, T., and Honda, H. (2006). Wound Healing Mechanism in Epithelial Tissues Cell Adhesion to Basal Lamina. WSEAS Trans. Biol. Biomed. 3, 389.
Nussbaum, S. R., Carter, M. J., Fife, C. E., DaVanzo, J., Haught, R., Nusgart, M., et al. (2018). An Economic Evaluation of the Impact, Cost, and Medicare Policy Implications of Chronic Nonhealing Wounds. Value in Health 21, 27–32. doi:10.1016/j.jval.2017.07.007
Osborne, J. M., Fletcher, A. G., Pitt-Francis, J. M., Maini, P. K., and Gavaghan, D. J. (2017). Comparing Individual-Based Approaches to Modelling the Self-Organization of Multicellular Tissues. Plos Comput. Biol. 13, e1005387. doi:10.1371/journal.pcbi.1005387
Park, S., Gonzalez, D. G., Guirao, B., Boucher, J. D., Cockburn, K., Marsh, E. D., et al. (2017). Tissue-scale Coordination of Cellular Behaviour Promotes Epidermal Wound Repair in Live Mice. Nat. Cel Biol 19, 155–163. doi:10.1038/ncb3472
Pastar, I., Stojadinovic, O., Yin, N. C., Ramirez, H., Nusbaum, A. G., Sawaya, A., et al. (2014). Epithelialization in Wound Healing: a Comprehensive Review. Adv. Wound Care 3, 445–464. doi:10.1089/wound.2013.0473
Pavel, M., Renna, M., Park, S. J., Menzies, F. M., Ricketts, T., Füllgrabe, J., et al. (2018). Contact Inhibition Controls Cell Survival and Proliferation via YAP/TAZ-autophagy axis. Nat. Commun. 9, 1–18. doi:10.1038/s41467-018-05388-x
Pitt-Francis, J., Pathmanathan, P., Bernabeu, M. O., Bordas, R., Cooper, J., Fletcher, A. G., et al. (2009). Chaste: a Test-Driven Approach to Software Development for Biological Modelling. Comput. Phys. Commun. 180, 2452–2471. doi:10.1016/j.cpc.2009.07.019
Posta, F., and Chou, T. (2010). A Mathematical Model of Intercellular Signaling during Epithelial Wound Healing. J. Theor. Biol. 266, 70–78. doi:10.1016/j.jtbi.2010.05.029
Rodrigues, M., Kosaric, N., Bonham, C. A., and Gurtner, G. C. (2019). Wound Healing: a Cellular Perspective. Physiol. Rev. 99, 665–706. doi:10.1152/physrev.00067.2017
Rousselle, P., Braye, F., and Dayan, G. (2019). Re-epithelialization of Adult Skin Wounds: Cellular Mechanisms and Therapeutic Strategies. Adv. Drug Deliv. Rev. 146, 344–365. doi:10.1016/j.addr.2018.06.019
Sada, A., Jacob, F., Leung, E., Wang, S., White, B. S., Shalloway, D., et al. (2016). Defining the Cellular Lineage Hierarchy in the Interfollicular Epidermis of Adult Skin. Nat. Cel Biol 18, 619–631. doi:10.1038/ncb3359
Safferling, K., Sütterlin, T., Westphal, K., Ernst, C., Breuhahn, K., James, M., et al. (2013). Wound Healing Revised: a Novel Reepithelialization Mechanism Revealed by In Vitro and In Silico Models. J. Cel Biol. 203, 691–709. doi:10.1083/jcb.201212020
Schultz, G. S., Chin, G. A., Moldawer, L., and Diegelmann, R. F. (2011). Mechanisms of Vascular Disease: A Reference Book for Vascular Specialists. Adelaide: University of Adelaide Press, 423. chap. Principles of Wound Healing.
Sen, C. K. (2009). Wound Healing Essentials: Let There Be Oxygen. Wound Repair Regen. 17, 1–18. doi:10.1111/j.1524-475x.2008.00436.x
Sherratt, J. A., and Murray, J. D. (1990). Models of Epidermal Wound Healing. Proc. R. Soc. Lond. Ser. B: Biol. Sci. 241, 29–36.
Slaymaker, M., Osborne, J., Simpson, A., and Gavaghan, D. (2012). On an Infrastructure to Support Sharing and Aggregating Pre-and post-publication Systems Biology Research Data. Syst. Synth. Biol. 6, 35–49. doi:10.1007/s11693-012-9095-x
Sun, T.-T., and Green, H. (1976). Differentiation of the Epidermal Keratinocyte in Cell Culture: Formation of the Cornified Envelope. Cell 9, 511–521. doi:10.1016/0092-8674(76)90033-7
Sun, T., Adra, S., Smallwood, R., Holcombe, M., and MacNeil, S. (2009). Exploring Hypotheses of the Actions of TGF-Β1 in Epidermal Wound Healing Using a 3d Computational Multiscale Model of the Human Epidermis. PLoS One 4, e8515. doi:10.1371/journal.pone.0008515
Tambyah, T. A., Murphy, R. J., Buenzli, P. R., and Simpson, M. J. (2020). A Free Boundary Mechanobiological Model of Epithelial Tissues. Proc. R. Soc. A. 476, 20200528. doi:10.1098/rspa.2020.0528
Taylor, G., Lehrer, M. S., Jensen, P. J., Sun, T.-T., and Lavker, R. M. (2000). Involvement of Follicular Stem Cells in Forming Not Only the Follicle but Also the Epidermis. Cell 102, 451–461. doi:10.1016/s0092-8674(00)00050-7
Tranquillo, R. T., and Murray, J. D. (1992). Continuum Model of Fibroblast-Driven Wound Contraction: Inflammation-Mediation. J. Theor. Biol. 158, 135–172. doi:10.1016/s0022-5193(05)80715-5
United Nations (2015). “World Population Prospects: the 2015 Revision,” in United Nations Economic and Social Affairs (New York, NY: United Nations), 33, 1–66.
Van Leeuwen, I. M. M., Mirams, G. R., Walter, A., Fletcher, A., Murray, P., Osborne, J., et al. (2009). An Integrative Computational Model for Intestinal Tissue Renewal. Cel Prolif. 42, 617–636. doi:10.1111/j.1365-2184.2009.00627.x
Walker, D. C., Hill, G., Wood, S. M., Smallwood, R. H., and Southgate, J. (2004). Agent-based Computational Modeling of Wounded Epithelial Cell Monolayers. IEEE Trans.on Nanobioscience 3, 153–163. doi:10.1109/tnb.2004.833680
Wang, Y., Guerrero‐Juarez, C. F., Qiu, Y., Du, H., Chen, W., Figueroa, S., et al. (2019). A Multiscale Hybrid Mathematical Model of Epidermal‐dermal Interactions during Skin Wound Healing. Exp. Dermatol. 28, 493–502. doi:10.1111/exd.13909
Woo, K., Santos, V. d. G., and Alam, T. (2018). Optimising Quality of Life for People with Non-healing Wounds. Wounds Int. 9, 6–14.
World Health Organization (2020). Health at a Glance: Asia/Pacific 2020 Measuring Progress towards Universal Health Coverage: Measuring Progress towards Universal Health Coverage. Paris: OECD Publishing.
Keywords: wound healing, individual-based model, cell proliferation, cell migration, multi-cellular simulation
Citation: Zanca A, Flegg JA and Osborne JM (2022) Push or Pull? Cell Proliferation and Migration During Wound Healing. Front. Syst. Biol. 2:876075. doi: 10.3389/fsysb.2022.876075
Received: 15 February 2022; Accepted: 30 March 2022;
Published: 29 April 2022.
Edited by:
Juilee Thakar, University of Rochester, United StatesReviewed by:
Nathan Weinstein, National Autonomous University of Mexico, MexicoSean McGinty, University of Glasgow, United Kingdom
Copyright © 2022 Zanca, Flegg and Osborne. This is an open-access article distributed under the terms of the Creative Commons Attribution License (CC BY). The use, distribution or reproduction in other forums is permitted, provided the original author(s) and the copyright owner(s) are credited and that the original publication in this journal is cited, in accordance with accepted academic practice. No use, distribution or reproduction is permitted which does not comply with these terms.
*Correspondence: James M. Osborne, jmosborne@unimelb.edu.au