Numerical assessment of thermal management on the capacity fade of lithium-ion batteries in electric vehicles
 Andrew Carnovale
  Xianguo Li*
- Department of Mechanical and Mechatronics Engineering, University of Waterloo, Waterloo, ON, Canada
Electric vehicles, as a major strategy for climate change mitigation, uses lithium-ion batteries extensively as the power source. However, the operation, performance and lifetime of lithium-ion batteries depend on the battery temperature, which can have a wide range due to heat generation within the battery and significant variations in the ambient conditions due to changes in seasons and geographical locations where electric vehicles are operated. In the present study, thermal management methods/strategies on the capacity fade of lithium-ion batteries are assessed through a validated capacity fade model for lithium-ion batteries along with a thermal model for the heat generation in the battery and dissipation over battery surface, represented by various thermal management methods. The driving conditions are simulated through a constant and various standard drive cycles. It is shown that battery temperature has the predominant impact on the capacity fade, and it can be controlled through effective thermal management. A much more significant spread in battery capacity fade occurs with various thermal management methods for a lower initial battery temperature (20°C) compared to the higher temperatures (35°C and 50°C), hence, thermal management is much more effective in reducing capacity fade at battery temperatures close to 20°C, which is considered the optimum operating temperature for lithium-ion batteries. Further, the results indicate that using a lower charge voltage can result in slightly less capacity fade over cycling. Regenerative braking makes it more realistic to use lower charge voltages, since the battery can be recharged during operation, thereby increasing driving range, while preventing increased capacity fade. Effective thermal management is more imperative for realistic intense and aggressive driving behaviors.
1 Introduction
Electrification of mobility sectors has been fueled by the strategies for climate change mitigation and post-pandemic economic recovery, and lithium-ion batteries have been a dominant choice of battery for electric and hybrid vehicles due to their superior energy and power densities compared to other batteries such as nickel-cadmium or lead-acid (Tarascon and Armand, 2001; Dunn et al., 2011). However, their high energy and power densities require effective methods and strategies for their thermal management to avoid thermal runaway for safety consideration in the extreme situations (Chombo and Laoonual, 2020), and more importantly for the normal operation, performance and lifetime of the lithium-ion batteries used in electric and hybrid vehicles, because battery operation, performance and lifetime are strongly influenced by their thermal conditions.
Thermal management systems of lithium-ion batteries have always been seen as an area of importance due to the possibility of thermal runaway, which can lead to catastrophe (Wang et al., 2012). Significant effort has been directed toward the area of battery cooling systems, and the effect of cooling systems on battery performance. Early effort involves the application of Bernardi et al.‘s work (Bernardi et al., 1985) to characterize battery heat generation. Chen and Evans (1994) developed an early two-dimensional thermal model to describe lithium-ion batteries. They studied the effect of cell geometry, dimensions of different stack components, and different cooling rates on battery temperature (and temperature profile). Chen and Evans (1996) continued mathematical modelling on battery performance; they reported heat generation in the battery for a variety of discharge (C-) rates, as well as further temperature results showing the effect of different cooling rates at different discharge rates. It was shown that at normal discharge rates, high heat transfer rates are effective at removing heat from the entire battery. At the same time, with high discharge rates, internal battery temperature remains high even with high cooling rates, instead resulting in much steeper temperature gradients at the battery boundaries. Hallaj et al. (1999) has also used a thermal model to simulate battery performance; they have studied the onset of thermal runaway for batteries at different OCVs, as well as the rise of battery temperature under different C-rates. Similar to Chen and Evans (1996), they also concluded that enhanced cooling provides the capability to lower overall battery temperature, but also increases temperature gradients in the cell. Generation of heat in large prismatic Li-ion batteries has been measured experimentally (Chen et al., 2014), and the impact of battery temperature control (or cooling) methods on battery discharge characteristics has also been experimentally measured (Chen and Li, 2014), indicating the effectiveness in battery temperature control through convective cooling with liquid coolants.
Wu et al. developed a model to study different methods of thermal management and the resultant temperature distributions (Wu et al., 2002). They concluded that effective thermal management is crucial to avoid thermal runaway; they deemed that natural convection is not sufficient to cool a large pack, and while forced convection cooling is effective, temperature gradients will still arise throughout the battery (Wu et al., 2002). Mahamud and Park employed a reciprocating air flow to limit temperature gradients (Mahamud and Park, 2011). Through CFD analysis they were able to show that a reciprocating air flow is effective, and that both the maximum battery temperature and the temperature difference across the battery reduced with a shorter reciprocating time (Mahamud and Park, 2011). Rao et al. investigated the use of heat pipes to control the maximum temperature and temperature difference of the battery (Rao et al., 2013).
While the previously mentioned studies considered heat generation from the battery, Maleki and Shamsuri (2002) developed a thermal model of a notebook computer battery pack, including heat generation from electrical components for battery management. They were able to show that heat production is dominated by battery heat generation during discharge, while it is governed by heat dissipation from electronics during charge periods (Maleki and Shamsuri, 2002).
Pesaran studied the problem of battery thermal management as it pertains specifically to electric (and hybrid) vehicles (Pesaran, 2001). They presented the designs of multiple thermal management systems employing both air and liquid as the active fluid, and compared the different methods (Pesaran, 2001). They concluded that air-based systems can be sufficient for hybrid vehicles; however, liquid-based systems should be preferred for fully electric vehicles (Pesaran, 2001). Similarly, Mi et al. performed thermal analysis of a 48-cell pack for hybrid vehicle applications (Mi et al., 2007).
On top of these modelling efforts to understand heat generation in batteries and the resultant thermal effects, efforts have been directed towards the development of different thermal management methods and strategies. Al-Hallaj and Selman first discussed using a phase change material (PCM) thermal management system in electric vehicles as an alternative to active cooling (Al-Hallaj and Selman, 2002). Khateeb et al. (2004) designed a thermal management system employing a PCM to manage the heat generated in an electric scooter. They found that while PCM alone is not an effective cooling system due to low thermal conductivity, with the addition of aluminum foam, and aluminum fins, using a PCM is a promising method of battery thermal management. Mills and Al-Hallaj, (2005), using experimental heat generation data, further simulated a battery thermal management system using a PCM composite material. For a given battery pack they were able to determine the required volume of PCM needed to keep the battery pack below their maximum allowable temperature of 55°C. They also showed that using a PCM with ideal yet realistic properties attained by advanced manufacturing methods, this required volume of PCM can be greatly reduced. To further study the use of a PCM thermal management system, Sabbah et al. (2008) performed simulations to compare a passive thermal management system employing a PCM to an active thermal management system using blown air. It was shown that even compared to high velocity airflow, a PCM based thermal management system can provide superior cooling, and temperature uniformity throughout the batteries.
Karimi and Li (2013) investigated the thermal management of a battery pack for electric vehicle applications. They simulated a battery pack with cooling ducts on either side and investigated the use of different cooling methods to manage temperature and voltage variation between batteries in the pack; natural convective cooling, forced convective cooling (with air and liquid), and a PCM were all used (Karimi and Li, 2013). It was found that enhanced cooling will cause large variation in temperature and voltage between batteries in the pack; the temperature of batteries at the centre of the stack was unaffected by changes in the cooling strategy (Karimi and Li, 2013). It was concluded that a more effective cooling strategy should employ multiple cooling ducts with smaller channels (oppose to just cooling ducts at the ends of the pack) to be distributed throughout the pack (Karimi and Li, 2013). Recently, Gan and his group analyzed the battery capacity fade for a variety of battery operating conditions such as current rates and ambient temperatures, and the performance of thermal management methods involving heat pipes in different arrangements, via first-principles based and equivalent circuit models (Liang et al., 2018; Wang et al., 2019; Gan et al., 2020a; Gan et al., 2020b; Liang et al., 2021). Houshafar and his co-workers investigated thermal management systems with nanofluids and phase change materials, under high discharge rate with nanofluid and copper sheath, and a hybrid system involving nanofluid, metal foam and phase change material (Kiani et al., 2020a; Kiani et al., 2020b; Ashkboos et al., 2021; Tousi et al., 2021). A number of good reviews are available on thermal management systems that have been considered for lithium-ion batteries (Zichen and Changqing, 2021; Zhang X. et al., 2022; Zhang Y. et al., 2022).
As mentioned earlier, the methods and strategies for the thermal management of lithium-ion batteries have significant impact on the operating temperature of batteries, which impact considerably the performance and degradation (or capacity fade) of the batteries. A more recent study (Carnovale and Li, 2020) indicates that battery capacity fade increases significantly with the number of discharge/charge cycles over the operation time of the batteries, and with the battery operation temperature; accelerated degradation of battery performance occurs at elevated operation temperatures, suggesting the importance of battery thermal management in the control of battery operation temperature, hence the performance and durability of battery for practical applications such as electric vehicles.
Therefore, the objective of the present study is to investigate the effect of thermal management methods and strategies on the capacity fade of lithium-ion batteries used in electric vehicles under both constant and variable driving cycles. In this study, how battery degradation occurs for different thermal management methods employed is evaluated and characterized under different operating temperatures, operational voltages, and loads (C-rates and drives cycles, and with and without regenerative braking). This information is useful for industrial design of vehicle battery thermal management systems. The first-principles based predictive model for the performance loss of lithium-ion battery used in this study follows our recent study (Carnovale and Li, 2020), which describes in detail the development of the first-principles based model and the comparison against experimental results for both discharging/charging characteristics and battery degradation. The model incorporates all the essential chemical and physical processes involved, including both chemical kinetics and transport phenomena of heat and species at the electrodes. The mechanism for battery capacity fade considered includes SEI (solid-electrolyte interface) film growth at the negative electrode, which is the largest contributing factor to the capacity fade, and the active material isolation at the negative electrode, which is the second largest influencing ageing factor (Carnovale and Li, 2020). A thermal model is developed for the battery temperature considering the generation of heat within the battery and heat removal over the external surface of the battery according to the method of thermal management. The capacity fade is then analyzed under various constant and driving cycles typical for electric vehicles. The results highlight the importance of the thermal management methods and strategies in the operation, performance and durability of lithium-ion batteries used in electric vehicles under practical driving conditions.
2 Model formulation
The performance loss (capacity fade) of lithium-ion batteries over discharge/charge cycling is investigated for different battery operation temperatures that are determined by a thermal model under the specific driving conditions for electric vehicles. Therefore, the predictive model involves three sub-models: 1) performance model for a lithium-ion battery at a specified battery operation temperature, 2) a model for the degradation of battery performance under a given operation temperature, and 3) a thermal model for the battery temperature under the driving conditions (cycles) for electric vehicles. The physical domain modeled in the present study includes the negative and positive electrode and the separator separating the electrodes with the battery electrode surfaces exposed to a specified thermal condition, as described in detail below.
The battery performance sub-model describes the physical (transport) and chemical processes occurring within the modeled domain, includes the solid- and electrolyte-phase conservation of charge in the electrodes, electrolyte-phase Li+ species concentration, the active material Li species conservation, and the Butler-Volmer equation for the electrode reactions at each of the electrodes. The transport of electric charges is considered fast, so that quasi-steady assumption is employed. The model equations have been developed in our previous study (Carnovale and Li, 2020), and they are summarized below:
where
It should be noted that jLi is the volumetric current density in the electrode from all reactions occurring at the electrodes, that is,
due to the intercalation reactions at the electrodes, and due to the side reactions at the electrodes that are responsible for the degradation of electrode performance or capacity fade (from the degradation sub-model to be presented later). The above equation is commonly referred to as the Butler-Volmer equation for the electrochemical reactions at the electrodes producing electrical current output from the electrodes. The parameters in the above equation are
represents the local overpotential with U the open-circuit potential, R and T the universal gas constant and battery operation temperature, respectively; αa and αc the anodic and cathodic transfer coefficients (considered to be 0.5 at both electrodes); Rf the SEI film resistance at the given electrode; as is the specific interfacial area between the solid and electrolyte phase in an electrode, and
It might be mentioned that Eqs 1, 2 represent the conservation of charge in the solid-phase of the electrodes, and in the electrolyte-phase of the battery (i.e., the electrolyte-containing electrodes and separator), respectively, under the quasi-steady condition. Eq. 3 is for the conservation of Li+ species in the electrolyte-phase, and Eq. 4 for the conservation of Li species in the electrode structure composed of solid particles, with the Li species considered in each agglomerate particle, hence it is in the radial direction of the agglomerates.
Boundary conditions that the above governing Eqs 1–4 are subjected to include.
- Specified current density at the boundary between the electrode and current collector, which is proportional to the charge gradient there;
- no charge transfer through the separator;
- no ionic transfer through the current collectors with its initial concentration specified; and
- spherical symmetry for the Li species transport in the agglomerates, and lithium insertion/removal from the agglomerate surface following the Butler-Volmer kinetics, along with a specified initial concentration.
The battery performance degradation sub-model considers two major degradation mechanisms: SEI film formation and growth around the electrode solid particles in the electrodes, and loss of active material for the electrodes:
where δSEI is the SEI layer thickness, MSEI and
It should be pointed out that in the above equation is is negative for the anode and positive for the cathode, and the side reactions follow Arrehenius kinetics.
The thermal sub-model for the battery temperature is based on the conservation of thermal energy with heat generation within the battery and heat dissipation at the external surfaces of the battery. Considering lumped analysis, the thermal model becomes
It is seen in the above equation that four volumetric heat generation terms, qr, qj, qc, and qe are considered. They represent the heat generation in the battery due to reaction, joule heating within the battery structure and the heat due to contact resistance, and entropic heating, respectively, as shown below (Chen et al., 2014):
In the above equations, the battery density, volume, heat capacity and temperature are represented by ρ, V, C, and T, respectively. The heat dissipation over the battery surface depends on the methods of thermal management used for the battery, and in this study, it is represented by a convection heat loss term with Tamb denoting the ambient temperature with which convective heat transfer occurs, and
It should be pointed out that the above model incorporates electrochemical, transport and thermal phenomena, and battery performance degradation sub-model only considers two major degradation mechanisms: SEI film formation and growth around the electrode solid particles in the electrodes, and loss of active material for the electrodes–these phenomena typically occur at battery temperature above freezing temperature, especially at high temperatures above 35°C. On the other hand, lithium-ion batteries operating at sub-freezing temperatures may produce lithium dendrites, causing short circuit, failure to start and other operational faults (Zhang et al., 2022). The thermal sub-model assumes a uniform temperature for the battery, with temperature variation across the battery not considered. This is acceptable for the present analysis since battery temperature is predominant and if the thermal management system is effective. Temperature variation across an operating battery can occur depending on the effectiveness of battery thermal management (Chen and Li, 2014), and this is secondary effect and not considered in the current study.
3 Methodology
The governing equations are discretized via finite control volume method in space and explicit method in time, and implemented in AutoLionST (EC Power, 2015) in order to utilize the various property information needed for numerical simulation. Mesh independence is investigated through mesh refinement, and accuracy of the model predictions is validated with experimental measurements (Carnovale and Li, 2020). Further details are available elsewhere (Carnovale, 2016).
The numerical simulation is carried out for the same battery as used in the experimental validation of (Carnovale and Li, 2020): a pouch-cell having the dimensions 11 × 60 × 162 mm in the thickness, width and height direction, respectively, with aluminum packaging, a carbon anode, NMC cathode, and a polymer separator. The rated capacity of the battery is 10Ah (± 0.5 Ah), with a charge cut-off voltage of 4.2 V and a discharge cut-off voltage of 2.75 V.
The main types of analysis conducted in the present study include the following scenarios for the charge/discharge processes: constant discharge C-rate representing a constant drive condition, and those equivalent to electric vehicles under various standard drive cycles, representing different driving characteristics and driver behaviors in the real world.
3.1 Constant C-rate charge/discharge
The first simulations performed are intended to characterize the capacity fade for the selected battery under constant discharge C-rate conditions, subject to full discharge (4.2V–2.75 V) and 1C CCCV (constant-current-constant-voltage) charging. Unlike the simulations reported in (Carnovale and Li, 2020), the current study is not isothermal.
Figure 1 and Figure 2 show the load current and voltage profiles for a 1C cycle; note that a short rest period is included between every charge and discharge. This cycle will be applied until the failure criterion is reached; at the suggestion of the industry partner, the failure criterion is once the battery reaches 75% of its original capacity.

FIGURE 1. Battery current during a single cycle of 1C discharge and CCCV charging with a rest period between discharge and charge process.

FIGURE 2. Battery voltage during a single cycle of 1C discharge and CCCV charging with a rest period between discharge and charge process.
While Figures 1, 2 show only the profiles for 1C charge/discharge, three discharge (or C-) rates are considered in the present study: 1C, 2C, and 4C. Again, charge rate is set constant at 1C. Three different heat transfer coefficients, representing three different methods/strategies for thermal management, are considered in the present study. At the request of our industry partner, three values of heat transfer coefficients are used, corresponding to natural convection, ICE plate (thermal management plate for electric vehicles) using air as the working fluid, and an ICE plate using a liquid coolant as the working fluid. The values of the heat transfer coefficients, supplied by the industry partner, are 6.3, 21.78, and 340 W/m2K, representing the battery cooling over its external surface via natural convection, forced air, and forced liquid convection, respectively.
On top of the C-rates and thermal management methods, the battery temperature is also varied. Since these simulations are not isothermal, the “base” temperature of the battery is varied. In each case the initial battery temperature, T0, and the temperature with which heat transfer occurs, Tamb, are set to the same value. Three values are considered, they are 20, 35, and 50°C. when battery is in operation, its temperature will increase due to heat generation in the battery and heat removal from the battery surface via natural or forced convection cooling, depending on the thermal management method used. Table 1 shows a summary of the operating parameters used in this study.

TABLE 1. Values for operating parameters used in the present constant C-rate simulations (Heat transfer coefficient values are supplied by industry partner).
3.2 Drive cycle simulations
A series of simulations employing standard drive cycles are performed while varying three chosen variables: charge voltage (the voltage to which the cell is charged to), battery “base” temperature (T0 = Tamb), and heat transfer coefficient h. Three values are chosen for each of these variables. The same drive cycle load profile is used for all simulations (to be discussed in more detail later in this section). Table 2 shows the values used for the drive cycle simulations.

TABLE 2. Values for operating parameters used in the present drive cycle simulations (Heat transfer coefficient values are supplied by industry partner).
For all simulations with drive cycles, 3.0 V is set as the minimum cell voltage. Thus, two failure criteria exist: 1) if the battery reaches 75% of its original capacity, or, 2) the battery reaches its minimum voltage level of 3.0 V. In the simulations with drive cycles, the actual criterion used is which ever one is reached first, and this will determine the lifetime of the battery considered. This change is due to the fact that using a drive cycle, there is a fixed energy requirement and the battery is used for a fixed amount of time. Hence, failure is considered once the battery can no longer provide the required energy within the specified voltage range. The vehicle parameters used are chosen to reflect a Chevrolet Volt, Table 3 shows these values.

TABLE 3. Vehicle parameters used for the simulations under the FTP drive cycle.
The drive cycle used in these simulations is the US FTP (Federal Test Procedure) drive cycle, which is also known as FTP-75 or EPA 75 (EPA, 2013). The FTP drive cycle lasts for 1875 s, covering a distance of 11.04 mi (17.77 km), with an average speed of 21.2 mi/hr (34.12 km/hr), and reaches a top speed of 56.7 mi/hr (91.25 km/hr). The data available for a given drive cycle is just the vehicle velocities over the drive cycle duration. A method found on an online drive cycle calculator titled, Wheels: Vehicle Road Load and Fuel Economy Online Calculator, was used to translate these velocities to power consumption (Safoutin, 2009), as briefly described below.
In order to translate vehicle velocity to power consumption, a simple Newton mechanics is considered with three forces, rolling resistance (FRR), aerodynamic drag (FAD), and inertial forces (FI). The discretized equations used to calculate them at a given time are as follows (Safoutin, 2009):
It is noted that (Vi + Vi-1)/2 in Eq. 15 represents the instantaneous velocity, averaged between two consecutive times, and (Vi–Vi-1) in Eq. 16 represents the instantaneous acceleration, since the time step is taken as one second. The total force is then the sum of these three forces. The tractive power can then be calculated as (Safoutin, 2009):
An efficiency of 75% is assumed for the motor/generator. In addition, only 1 cell is simulated so this tractive power, delivered by the motor, must be divided by the number of cells in the vehicle; a value of 288 battery cells (same as in the Chevrolet Volt) is used. Therefore, the true power consumed by a single cell is expressed as (Safoutin, 2009):
Figure 3 depicts the calculated power profile during an FTP drive cycle for a single cell. The negative power indicates braking power which can be captured via regenerative braking.

FIGURE 3. Instantaneous power consumption for a single cell during an FTP drive cycle.
In the first part of the analysis, regenerative braking is not considered, and power required is provided entirely from the battery. Later in the analysis, regenerative braking is considered using the calculated braking power. The regenerative braking is considered 50% efficient (on top of the system efficiency of 75% for the generator) to account for the portion of the kinetic energy utilized. The power associated with regenerative braking can then be expressed as follows, noting that Ptractive will be a negative value:
The overall drive cycle applied is meant to represent a single day use of the vehicle, referred to as one single cycle. It is composed of the following:
• Eight hour rest period (overnight)
• FTP drive cycle (drive to work)
• Eight hour rest period (at work)
• FTP drive cycle (drive home)
• Three minute rest period (rest period before charging)
• 1C-CCCV charge period
This cycle allows the battery voltage and temperature to come to a steady value before a new driving period.
4 Results and discussion
4.1 Discharge C-Rate cycling
The results of the constant discharge C-rate simulations are shown in Figures 4A–C. Each one of these figures displays the results for a unique discharge rate. For easy comparison, normalized capacity of batteries is presented as a function of the number of charge/discharge cycles. Three different battery base temperatures of T0 = Tamb = 20°C, 35°C, and 50°C are considered along with three different methods of thermal management (natural convection, forced air and liquid convection cooling), represented by the three different heat transfer coefficient values of h = 6.3, 21.78, and 340 W/m2 K, respectively. It might be mentioned that power consumption related to coolant flow is not considered in this study. The batteries are cycled at the 1C charge and three different discharge C-rates of 1C, 2C, and 4C, corresponding to the results presented in Figures 4A–C, respectively. It might be mentioned that the three different battery base temperatures used represent the operation of electric vehicles potentially in different seasons and geographical locations. Since other degradation mechanisms such as lithium plating become important at lower temperatures and sub-zero cold start processes (Tarascon and Armand, 2001; Chombo and Laoonual, 2020), a separate study will be dedicated to this condition, hence excluded from the present study.

FIGURE 4. Normalized capacity of batteries for three different specified battery base temperatures; three different methods of thermal management, represented by the three different heat transfer coefficients given in the figure; and cycled at the 1C charge and discharge C-rate of (A) 1C, (B) 2C, and (C) 4C.
It is seen from the results shown in Figure 4 that regardless of the discharge C-rate and thermal management methods, the capacity fade with the number of cycles behave almost identical at the high battery base temperature of T0 = Tamb = 50°C. At the medium battery base temperature of 35°C, different thermal management methods of natural convection, forced air and liquid cooling have observable impact on the capacity fade with the number of discharge/charge cycles. At the low battery base temperature of 20°C studied, capacity fade is significantly increased with the discharge C-rate and thermal management methods, especially at the high discharge rate of 4C. It is clear that the capacity fade is increased with an increase in the discharge rate, and is reduced by a more effective method of thermal management.
Figure 4 reveals that all the results shown indicate that overall cell temperature is still the most significant factor in influencing the battery capacity fade. With the exception of Figure 4C (with very high C-rate) all the results show a “band” of curves each representing the specified battery temperature. On each plot, it can also be seen that the heat transfer coefficient has a significant impact on capacity fade, notably at lower battery temperatures; this need for effective thermal management shows a strong interaction with the discharge rate, again notably at lower battery temperatures. Table 4 demonstrates the percent increase in cycles to failure (75% of the original capacity) for batteries at 20°C. It is seen clearly fromTable 4 that at high C-rates of discharge, effective thermal management will significantly improve cycle life. For example, thermal management using forced liquid convection cooling, corresponding to the heat transfer coefficient of 340 W/m2 K, increases the number of discharge and charge cycles by 63% and 40%, respectively, at the C-rate of 4C, when compared with the natural convection cooling (heat transfer coefficient of 6.3 W/m2 K) and forced air convection cooling (heat transfer coefficient of 21.78 W/m2 K). This implies the significance and importance of thermal management methods/strategies for the operation, performance and durability of lithium-ion batteries.

TABLE 4. Comparison of percentage increase in cycles to failure for the different heat transfer coefficients and discharge C-rates at the specified battery base temperature of T0 = Tamb = 20°C.
To assess the capability and potential of the different thermal management methods and the reason for the different capacity fade behaviors observed in Figure 4 and Table 4, Figure 5 presents the battery temperature increase for a single discharge at different C-rates for the battery base temperature of 35°C. It is seen in Figure 5A that at the discharge rate of 1C, the battery temperature remains almost constant during the entire discharge process for the forced liquid convection cooling, corresponding to the high heat transfer coefficient of 340 W/m2 K. However, battery temperature increase is noticeable for the forced air convection and natural convection cooling, and it becomes about 5°C and 8°C for the heat transfer coefficients of 21.78 and 6.3 W/m2 K, respectively. At the discharge rate of 2C shown in Figure 5B, the battery temperature rise becomes noticeable even for the highest heat transfer coefficient of 340 W/m2 K, exceeds 10°C and 15°C, respectively, for the heat transfer coefficients of 21.78 and 6.3 W/m2 K, respectively. At the high discharge rate of 4C, Figure 5C indicates that the battery temperature increases substantially at this high discharge rate compared with the lower discharge rates shown in Figures 5A,B, reaching about 5°C, 25°C and over 31°C for the heat transfer coefficients of 340, 21.78, and 6.3 W/m2 K, respectively. Consistent with (Liang et al., 2021) and as shown in Figure 4, increasing battery temperature is the single most dominant factor in the capacity fade of battery, thus explaining the significant reduction for the low rate of heat dissipation from the battery observed in Figure 4. This is because as the battery charge/discharge is cycled, the heat is generated in the battery; and if this heat is not fully dissipated over the battery surface, battery temperature is increased, thus unduly impacting the battery operation, performance and durability. This suggests the significance and importance of effective thermal management for the operation, performance and durability of batteries used for electric vehicles.

FIGURE 5. Battery temperature rise during one discharge process for the specified battery base temperature of T0 = Tamb = 35°C; three different heat transfer coefficients given in the figure, representing the different methods of thermal management for the battery investigated; and the discharge C-rate of (A) 1C; (B) 2C; and (C) 4C.
The maximum temperature increase at the end of one single discharge process as shown in Figure 5 is summarized in Table 5 for all the cases investigated. It is seen that the maximum temperature rise is the highest at the low battery base temperature of 20°C, and decreases as the battery base temperature is increased under the respective condition of discharge rate and method of thermal management. Therefore, the variation in the maximum temperature rise with the method of thermal management occurs at the condition of T0 = 20°C and the high discharge rate of 4C, suggesting this is the operation condition for which thermal management is the most effective. However, the actual maximum battery temperature, being equal to the battery base temperature plus the maximum temperature rise, occurs at T0 = 50°C and 4C discharge rate, and reaches 75.4°C, 70.0°C, and 53.8°C corresponding to the method of battery cooling by natural convection, forced air and forced liquid convection, respectively. Since high battery operation temperature accelerates the degradation of the performance (Carnovale and Li, 2020), battery operation at 50°C and 4C discharge rate leads to the shortest lifetime, consistent with the results shown in Figure 4.
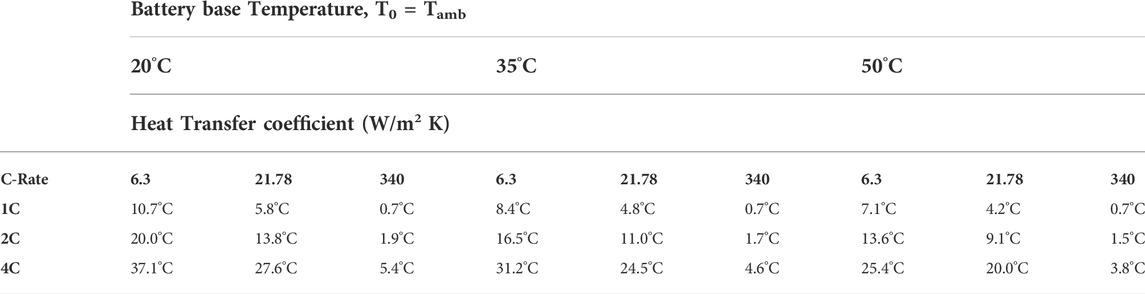
TABLE 5. The maximum temperature rise at the end of one discharge process for the three specified values of battery base temperature, heat transfer coefficient representing the different methods of thermal management for the battery investigated; and discharge C-rates.
4.2 FTP drive cycle cycling
The results for battery cycling following the US FTP drive cycles are shown in Figure 6 for the fully charged voltage of 4.0V, 4.1V, and 4.2 V. Three different values of battery base temperature, and heat transfer coefficient are again considered in the analysis. The numerical simulation ends when battery failure has been reached, which is defined as when the battery capacity has been reduced to 75% of their original capacity, or is unable to complete the entire drive cycle. This second criterion is set as the voltage drops below the specified minimum battery voltage of 3.0 V.

FIGURE 6. Normalized capacity of batteries for three different specified battery base temperatures; three different methods of thermal management, represented by the three different heat transfer coefficients; and cycled with the US FTP drive cycle and maximum charged voltage of (A) 4.0V, (B) 4.1V, and (C) 4.2 V.
It is evident from Figure 6 that again battery temperature is the dominant factor influencing battery capacity fade, as observed earlier, and thermal management method has significant effect at lower battery temperatures. At the low charged battery voltage of 4.0V, Figure 6A indicates that the battery lifetime is very short, less than 2 years even for operation at the low battery base temperature of 20°C. At the higher charged voltage of 4.1V, battery durability is increased substantially for all battery base temperatures, reaching close to 4 years at 20°C. Over 5 years of battery lifetime are achieved for battery operation at 20°C with forced liquid convection cooling when the charged voltage is increased to 4.2 V. The effect of charged voltage is compared directly in Figure 7 for battery base temperature of 20°C and 35°C with natural convection cooling as the thermal management method for the batteries. It is seen that the battery operation lifetime for the two temperatures shown is substantially increased when the charged voltage is increased from 4.0 V to 4.1 V; this increase is much smaller from the charged voltage increase from 4.1 V to 4.2 V. Clearly the effect of charged voltage is that batteries with less charge are prone to degrade to the point where they cannot provide the required energy for the required drive cycle considered in this study. Figure 7 also indicates that a higher charged voltage seems to degrade faster, but battery lifetime is determined by the battery first reaching the minimum voltage criterion instead of capacity fade reaching 75% of its original value; therefore, a higher charged voltage tends to have a longer operation lifetime.

FIGURE 7. A comparison of the normalized capacity of batteries illustrating the effect of charged voltage for the US FTP drive cycles considered in the analysis for the battery base temperature of 20°C and 35°C and heat transfer coefficient of 6.3 W/m2.
It might be pointed out that the results presented in this section so far do not consider the regenerative braking, that is, the energy that could be collected for braking is not captured and not used to charge the battery during the FTP drive cycling.
Figure 8 presents the battery performance with regenerative braking, that is, the negative power shown in Figure 3 has been harvested and stored in the battery. Therefore, the condition considered in achieving the results shown in Figure 8 is exactly the same as those shown in Figure 6 except that regenerative braking is applied for the results shown in Figure 8, while it is not for the results given in Figure 6. Comparing the results shown in Figures 6A, 8A for the charged voltage of 4.0 V it is clear that battery lifetime doubles with regenerative braking for all the conditions considered, even though for both cases the battery capacity has not reached 75% of their original value and the lifetime is determined by the minimum battery voltage being reached first leading to not having sufficient energy to complete one drive cycle required in the present analysis. Similar comparison indicates that the increase in battery lifetime is apparent for the charged voltage of 4.1 V, though the increase is much smaller; whereas for the charged voltage of 4.2 V, the impact of regenerative braking is minimal. Also for the charged voltages of 4.1V and 4.2 V as shown in Figures 8B,C, battery has sufficient capacity to last at least one drive cycle considered, so that the lifetime is limited by the degradation in capacity reaching 75% of their original value, because at these higher charged voltages, batteries have more energy (or higher capacity) to begin the drive cycle, thus the impact of regenerative braking, which is in reality the intermittent charging of the batteries during the drive cycle, become less important for the cycle completion.

FIGURE 8. Normalized capacity of batteries for three different specified battery base temperatures; three different methods of thermal management, represented by the three different heat transfer coefficients; and cycled with the US FTP drive cycle with regenerative braking and maximum charged voltage of (A) 4.0V, (B) 4.1V, and (C) 4.2 V.
The results shown in Figures 6, 8 further indicates that with or without regenerative braking, an effective thermal management method/strategy is important for electric vehicles. Though intuitively one may expect thermal management would be crucial for unfavorable operation conditions, such as in very warm or cold climates. The current results suggest that effective thermal management can significantly reduce battery degradation and enhance battery lifetime even under the most favourable battery operation condition of 20°C. For example, Figures 6C, 8C show that battery life can be extended by about 25% between the ineffective (natural convection cooling) and effective (forced liquid convection cooling) thermal management in a favourable condition of 20°C.
Figure 9 presents a comparison of the normalized capacity of batteries with regenerative braking, showing the effect of various charged voltages for the completion of US FTP drive cycles considered in the analysis for the battery base temperature of 20°C and 35°C and heat transfer coefficient of 6.3 W/m2. It is seen that at the low charged voltage of 4.0V, battery lifetime is limited by the amount of energy battery has been charged to provide the power needed to complete one drive cycle. Higher charged voltages have a higher rate of degradation, hence, the number of cycles at which 75% decay in the capacity occurs is reduced, hence the battery lifetime is reduced as well. When compared with the corresponding results shown in Figure 7 for the case of no regenerative braking, the lifetime for charged voltages of 4.0 and 4.1 V is increased significantly; while the lifetime limiting factor changes from the minimum battery voltage to the capacity fade of 75% for charged voltage of 4.1 V. This change also illustrates the effect of regenerative braking on the operation of battery. It might be mentioned that a lower charged voltage yields a less degradation the capacity fade is consistent with the results in literature [e.g., (Vetter et al., 2005)].

FIGURE 9. A comparison of the normalized capacity of batteries with regenerative braking illustrating the effect of various charged voltages for the completion of US FTP drive cycles considered in the analysis for the battery base temperature of 20°C and 35°C and heat transfer coefficient of 6.3 W/m2.
4.3 Effect of driving behaviors
Finally, it must be pointed out that different driving behaviors would lead to different driving cycles, which would have different power requirements or load imposed on the battery pack in electric vehicles. As a result, the operation, performance and degradation of batteries will all be affected. In the previous sub-section, only FTP drive cycle was considered. However, it is known that the FTP drive cycle may not represent actual driving behaviors, since it lacks high acceleration and high vehicle speeds (EPA, 2015). Therefore, other drive cycles have been developed, and their characteristics are shown in Table 6 (Safoutin, 2009).

TABLE 6. Characteristics of various standard drive cycles (Safoutin, 2009).
As seen in Table 6, the other drive cycles have more demanding power and energy requirements, and represent different but more aggressive driving behaviors. The LA92 drive cycle is very similar to the FTP drive cycle, but has overall higher speeds, less idling, and higher acceleration. US06 is a very intense but short driving cycle with very high speeds and accelerations. The US06 drive cycle was developed, as a supplemental cycle to the FTP cycle as it was believed the FTP drive cycle was lacking in representing real-world aggressive driving (EPA, 2007). Figure 10 shows a comparison of the average and maximum C-rates for the various drive cycles, following the analysis shown in Section 3-2. It is evident that different driving behaviors (cycles) have significant effect on the required battery power, hence the discharge C-rates for the batteries involved. It might be mentioned that the FTP + US06 drive cycle is generated to reflect a period of calmer city driving to a period of intense highway driving. The US06 × 2 drive cycle is merely two consecutive US06 drive cycles, and represents an intense drive cycle with a drive duration comparable to the FTP cycle.

FIGURE 10. Comparison of the average and maximum discharge C-rates for the various drive cycles, corresponding to battery operation in ambient environment of 20°C with the heat transfer coefficient h = 6.3 W/m2 K, and charged voltage of 4.2 V.
Illustrated in Figure 11 is the average temperature and maximum temperature rise of batteries during one single drive cycle for the various drive cycles shown in Table 6 with the battery base temperature of 35°C. It is seen in Figure 11A that for natural convection cooling (h = 6.3 W/m2 K), average battery temperature increases by almost 2°C for the FTP drive cycle; and it increases with the intensity of the power drawn from the battery, and reaches as high as about 9.5°C for US06 × 2 drive cycle. For a given drive cycle shown, the average temperature decreases with an increase in the heat transfer coefficient for cooling over the battery surface, and it becomes less than 1.5°C for forced liquid convection cooling (h = 340 W/m2 K). Similar behaviors for the maximum temperature rise, ΔT, of batteries are observed in Figure 11B. As it is seen, ΔT can vary from less than 4°C for the FTP drive cycle to almost 17°C for US06 × 2 drive cycle for the natural convection cooling, to less than 3°C for all the drive cycles shown in Table 6 when forced liquid convection cooling is employed. It is clear that with effective thermal management (as represented by h = 340 W/m2 K), the effect of even severe and aggressive driving behaviors can be mitigated. For instance, the US06 drive cycle, which represents high intensity driving for 10 min, a very realistic case, would result in an average cell temperature of 4°C higher than the initial temperature and a maximum temperature almost 10°C higher than the initial with natural air cooling. With effective cooling this can be reduced to a 1°C increase in average temperature and only a 2°C maximum temperature increase. Therefore, Figure 11 indicates that battery temperature could have significant variations for the different drive cycles, suggesting the importance of an effective thermal management method for batteries in electric vehicles in order to accommodate the different drive behaviors of the individual drivers. It might be also pointed out that aggressive driving can reduce the battery operation lifetime substantially.

FIGURE 11. (A) Average battery temperature and (B) maximum battery temperature rise during the process of one single drive cycle operation for batteries in the ambient environment of 35°C.
It should be mentioned that the effect of drive cycles leads to different amount of heat generation within the battery, as shown in Figure 12. If the heat generated is not effectively removed, battery temperature can increase substantially over the driving time. As shown earlier, higher battery temperature will accelerate the degradation of its performance, resulting into a shorter lifetime. Figure 12 also indicates that heat generation is substantially higher for the aggressive drive cycles of US06 and US06 × 2, even when forced liquid convection cooling is considered. It should also be pointed out that if an ineffective thermal management method is used, temperature will not only increase considerably over battery operation time, but its variation throughout the battery will occur, and this spatial non-uniformity of temperature will cause additional degradation of battery performance. This is because battery is thermodynamically 1 T engine and its performance is the best when there is no temperature gradient throughout its body. This further suggests the importance of having an effective thermal management method for the batteries used in electric vehicles, in order to ensure minimal spatial variation of temperature.

FIGURE 12. Average volumetric heat generation within battery during a single drive cycle as indicated with the initial battery temperature of 20°C, 35°C, and 50°C, respectively, and forced liquid convection cooling (h = 340 W/m2 K).
It might be emphasized that for the present analysis, the initial battery temperature T0 is considered to be the same as the temperature of the ambient environment, Tamb. Environmental condition can vary substantially due to changes in seasons and geographical locations. Thus an effective thermal management is required to minimize the impact of this seasonal as well as locational changes for the use of electric vehicles.
5 Conclusion
In this study, the effect of thermal management methods/strategies on the capacity fade of lithium-ion batteries used in electric vehicles has been evaluated using an integrated electrochemical-transport-thermal model. The degradation of the battery performance considered includes solid-electrolyte interface (SEI) film formation and growth around the solid (agglomerate) particles in the electrodes, and loss of active material in the electrodes. The driving condition considered include both constant load driving (discharge rates) and various load-changing driving cycles representing the different driving characteristics and behaviors in real world. Natural air convection, forced air and liquid convection cooling are considered as the three representative methods for thermal management of batteries. The results indicate that battery temperature is predominant over the operation, performance and lifetime of batteries, hence their capacity fade; it can be controlled through effective thermal management by dissipating heat generated in the battery during its operation. Battery capacity fade has a more significant variation with the various thermal management methods for a lower initial battery temperature (20°C) compared to the higher temperatures (35°C and 50°C) investigated, hence, thermal management is much more effective in reducing capacity fade at battery temperatures close to 20°C, which is considered the optimum operating temperature for lithium-ion batteries. Battery lifetime can be increased by as much as 25% with an effective thermal management in a favourable operation condition of 20°C for even the mild and gentle driving represented by FTP drive cycle. In addition, using a lower charge voltage can reduce capacity fade over the drive cycling, and battery lifetime can be increased significantly (doubled) when using a lower charge voltage coupled with regenerative braking. Thermal management is shown to be more important for realistic intense and aggressive driving behaviors in real world.
Data availability statement
The raw data supporting the conclusion of this article will be made available by the authors, without undue reservation.
Author contributions
AC and XL both contributed to conception and design of the study. AC carried out the detailed simulation and presentation of the results in figures and tables, as well as wrote the first draft of the manuscript. XL revised and finalized the manuscript into the final form for submission. Both authors contributed to manuscript revision, read, and approved the submitted version.
Funding
This work has received financial support from the Natural Sciences and Engineering Research Council of Canada (NSERC) via an Engage Grant with the grant number EGP 483882-15, and a Discovery Grant. The Engage Grant was also co-sponsored by Dana Canada Corporation.
Conflict of interest
The authors declare that the research was conducted in the absence of any commercial or financial relationships that could be construed as a potential conflict of interest.
Publisher’s note
All claims expressed in this article are solely those of the authors and do not necessarily represent those of their affiliated organizations, or those of the publisher, the editors and the reviewers. Any product that may be evaluated in this article, or claim that may be made by its manufacturer, is not guaranteed or endorsed by the publisher.
References
Al-Hallaj, S., and Selman, J. R. (2002). Thermal modeling of secondary lithium batteries for electric vehicle/hybrid electric vehicle applications. J. Power Sources 110, 341–348. doi:10.1016/s0378-7753(02)00196-9
Ashkboos, P., Yousefi, A., and Houshfar, E. (2021). Design improvement of thermal management for Li-ion battery energy storage systems. Sustain. Energy Technol. Assessments 44, 101094. doi:10.1016/j.seta.2021.101094
Bernardi, D., Pawlikowski, E., and Newman, J. (1985). A General energy balance for battery systems. J. Electrochem. Soc. 132, 5–12. doi:10.1149/1.2113792
Carnovale, A. (2016). Investigation into the effect of thermal management on the capacity fade of Lithium-ion batteries. Waterloo: University of Waterloo. MASc thesis.
Carnovale, A., and Li, X. (2020). A modeling and experimental study of capacity fade for lithium-ion batteries. Energy AI 2, 100032. doi:10.1016/j.egyai.2020.100032
Chen, K., and Li, X. (2014). Accurate determination of battery discharge characteristics – a comparison between two battery temperature control methods. J. Power Sources 247, 961–966. doi:10.1016/j.jpowsour.2013.09.060
Chen, K., Unsworth, G., and Li, X. (2014). Measurements of heat generation in prismatic Li-ion batteries. J. Power Sources 261, 28–37. doi:10.1016/j.jpowsour.2014.03.037
Chen, Y., and Evans, J. W. (1994). Thermal analysis of lithium polymer electrolyte batteries by a two dimensional model-thermal behaviour and design optimization. Electrochimica Acta 39, 517–526. doi:10.1016/0013-4686(94)80095-2
Chen, Y., and Evans, J. W. (1996). Thermal analysis of Lithium-ion batteries. J. Electrochem. Soc. 143, 2708–2712. doi:10.1149/1.1837095
Chevrolet Volt (2014a). Car and driver: New car reviews, buying advice and news. Retrieved from http://www.caranddriver.com/ (Accessed September 21, 2022).
Chevrolet Volt (2014b). Hybrid and electric cars reviews. Retrieved from http://hybridcars.reviews/2015-chevrolet-volt/ (Accessed September 21, 2022).
Chombo, P. V., and Laoonual, Y. (2020). A review of safety strategies of a Li-ion battery. J. Power Sources 478, 228649. doi:10.1016/j.jpowsour.2020.228649
Dunn, B., Kamath, H., and Tarascon, J-M. (2011). Electrical energy storage for the grid: A battery of choices. Science 334, 928–935. doi:10.1126/science.1212741
EC Power (2015). AutoLionST: A thermally coupled battery model for system-level analysis of Li-ion battery packs. User’s Manual.
EPA (2013). Dynamometer drive schedules. Washington, DC: United States Environmental Protection Agency. Retrieved from http://www3.epa.gov/nvfel/testing/dynamometer.htm.
EPA (2007). EPA fuel economy ratings – what’s coming in 2008. Washington, DC: Earthcars. Retrieved from http://web.archive.org/web/20071008015835/http://www.earthcars.com/articles/article.htm?articleId=6.
EPA (2015). Federal test procedure revisions. Washington, DC: United States Environmental Protection Agency. Retrieved from http://www3.epa.gov/otaq/sftp.htm.
Gan, Y., He, L., Liang, J., Tan, M., Xiong, T., and Li, Y. (2020b). A numerical study on the performance of a thermal management system for a battery pack with cylindrical cells based on heat pipes. Appl. Therm. Eng. 179, 115740. doi:10.1016/j.applthermaleng.2020.115740
Gan, Y., Wang, J., Liang, J., Huang, Z., and Hu, M. (2020a). Development of thermal equivalent circuit model of heat pipe-based thermal management system for a battery module with cylindrical cells. Appl. Therm. Eng. 164, 114523. doi:10.1016/j.applthermaleng.2019.114523
Hallaj, S. A., Maleki, H., Hong, J. S., and Selman, J. R. (1999). Thermal modeling and design considerations of lithium-ion batteries. J. Power Sources 83, 1–8. doi:10.1016/s0378-7753(99)00178-0
Karimi, G., and Li, X. (2013). Thermal management of lithium-ion batteries for electric vehicles. Int. J. Energy Res. 37, 13–24. doi:10.1002/er.1956
Khateeb, S. A., Farid, M. M., Selman, J. R., and Al-Hallaj, S. (2004). Design and simulation of a lithium-ion battery with a phase change material thermal management system for an electric scooter. J. Power Sources 128, 292–307. doi:10.1016/j.jpowsour.2003.09.070
Kiani, M., Ansari, M., Arshadi, A. A., Houshfar, E., and Ashjaee, M. (2020b). Hybrid thermal management of lithium-ion batteries using nanofluid, metal foam, and phase change material: An integrated numerical-experimental approach. J. Therm. Anal. Calorim. 141, 1703–1715. doi:10.1007/s10973-020-09403-6
Kiani, M., Omiddezyani, S., Houshfar, E., Miremadi, S. R., Ashjaee, M., and Nejad, A. M. (2020a). Lithium-ion battery thermal management system with Al2O3/AgO/CuO nanofluids and phase change material. Appl. Therm. Eng. 180, 115840. doi:10.1016/j.applthermaleng.2020.115840
Liang, J., Gan, Y., and Li, Y. (2018). Investigation on the thermal performance of a battery thermal management system using heat pipe under different ambient temperatures. Energy Convers. Manag. 155, 1–9. doi:10.1016/j.enconman.2017.10.063
Liang, J., Gan, Y., Yao, M., and Li, Y. (2021). Numerical analysis of capacity fading for a LiFePO4 battery under different current rates and ambient temperatures. Int. J. Heat Mass Transf. 165, 120615. doi:10.1016/j.ijheatmasstransfer.2020.120615
Mahamud, R., and Park, C. (2011). Reciprocating air flow for Li-ion battery thermal management to improve temperature uniformity. J. Power Sources 196, 5685–5696. doi:10.1016/j.jpowsour.2011.02.076
Maleki, H., and Shamsuri, A. K. (2002). Thermal analysis and modeling of a notebook computer battery. J. Power Sources 115, 131–136. doi:10.1016/s0378-7753(02)00722-x
Mi, C., Li, B., Buck, D., and Ota, N. (2007). “Advanced electro-thermal modeling of lithium-ion battery system for hybrid electric vehicle applications,” in IEEE Vehicle Power and Propulsion Conference (Arlington, TX: IEEE).
Mills, A., and Al-Hallaj, S. (2005). Simulation of passive thermal management system for lithium-ion battery packs. J. Power Sources 141, 307–315. doi:10.1016/j.jpowsour.2004.09.025
Pesaran, A. A. (2001). “Battery thermal management in EVs and HEVs: Issues and solutions,” in Advanced Automotive Battery Conference (Las Vegas, NV: AABC).
Rao, Z., Wang, S., Wu, M., Lin, Z., and Li, F. (2013). Experimental investigation on thermal management of electric vehicle battery with heat pipe. Energy Convers. Manag. 65, 92–97. doi:10.1016/j.enconman.2012.08.014
Sabbah, R., Kizilel, R., Selman, J. R., and Al-Hallaj, S. (2008). Active (air-cooled) vs. passive (phase change material) thermal management of high power lithium-ion packs: Limitation of temperature rise and uniformity of temperature distribution. J. Power Sources 182, 630–638. doi:10.1016/j.jpowsour.2008.03.082
Safoutin, M. (2009). Wheels: Vehicle Road load and Fuel Economy online calculator. Retrieved from http://www.virtual-car.org/wheels/wheels-road-load-calculation.html (Accessed September 21, 2022).
Tarascon, J. M., and Armand, M. (2001). Issues and challenges facing rechargeable lithium batteries. Nature 414, 359–367. doi:10.1038/35104644
Tousi, M., Sarchami, A., Kiani, M., Najafi, M., and Houshfar, E. (2021). Numerical study of novel liquid-cooled thermal management system for cylindrical Li-ion battery packs under high discharge rate based on AgO nanofluid and copper sheath. J. Energy Storage 41, 102910. doi:10.1016/j.est.2021.102910
Vetter, J., Novak, P., Wagner, M. R., Veit, C., Moller, K. C., Besenhard, J. O., et al. (2005). Ageing mechanisms in lithium-ion batteries. J. Power Sources 147, 269–281. doi:10.1016/j.jpowsour.2005.01.006
Wang, J., Gan, Y., Liang, J., Tan, M., and Li, Y. (2019). Sensitivity analysis of factors influencing a heat pipe-based thermal management system for a battery module with cylindrical cells. Appl. Therm. Eng. 151, 475–485. doi:10.1016/j.applthermaleng.2019.02.036
Wang, Q., Ping, P., Zhao, X., Chu, G., Sun, J., and Chen, C. (2012). Thermal runaway caused fire and explosion of lithium ion battery. J. Power Sources 208, 210–224. doi:10.1016/j.jpowsour.2012.02.038
Wu, M. S., Liu, K. H., Wang, Y. Y., and Wan, C. C. (2002). Heat dissipation design for lithium-ion batteries. J. Power Sources 109, 160–166. doi:10.1016/s0378-7753(02)00048-4
Zhang, X., Li, Z., Luo, L., Fan, Y., and Du, Z. (2022). A review on thermal management of lithium-ion batteries for electric vehicles. Energy 238, 121652. doi:10.1016/j.energy.2021.121652
Zhang, Y., Liang, F., Li, S., Zhang, C., Zhang, S., Liu, X., et al. (2022). A review on battery thermal management and its digital improvement-based cyber hierarchy and interactional network. Int. J. Energy Res. 46, 11529–11555. doi:10.1002/er.7957
Zichen, W., and Changqing, D. (2021). A comprehensive review on thermal management systems for power lithium-ion batteries. Renew. Sustain. Energy Rev. 139, 110685. doi:10.1016/j.rser.2020.110685
Nomenclature
Abberviations
As specific interfacial area [m−1]
As battery surface area [m2]
ce Li+ concentration in electrolyte phase [mol cm−3]
cs Li concentration in solid phase [mol cm−3]
C battery heat capacity [J K−1 kg−1] or coefficient
F Faraday constant [C mol−1] or force [N]
g acceleration due to gravity, [m s−2]
h convective heat transfer coefficient [W m−2 K−1]
i current [A]
is current density due to electrode side reactions [A m−2]
i0s side reaction exchange current density [A m−2]
jIC volumetric electrode current due to intercalation [A m−3]
j0IC exchange current density [A m−2]
jLi volumetric electrode current density [A m−3]
k rate constant [m3 A−1 s−1]
m vehicle mass [kg]
M molecular weight [g mol−1]
P Power [W]
qr heat generation due to reaction [W m−3]
qj heat generation due to joule heating [W m−3]
qc heat generation due to contact resistance [W m−3]
qe entropic heating [W m−3]
Rc contact resistance [Ω]
Rf film resistance [Ω m−2]
RSEI SEI layer resistance [Ω m−2]
Ru universal gas constant [J K−1 mol−1]
T battery temperature [K]
U open-circuit potential [V]
V cell volume [m3] or vehicle speed [m s−1]
Vcell cell output voltage [V]
Greek Letters
α electrode transfer coefficients
δ layer thickness [m]
η local overpotential [V]
ρ cell density [kg m−3]
ρa air density [kg m−3]
ρSEI SEI layer density [kg m−3]
Subscripts and Superscripts
a anode
amb ambient
AD air drag
c cathode
D drag
e electrolyte phase
eff effective
f frontal
I inertial
rr rolling resistance
s solid phase or surface or interfacial
s side reaction
Acronyms
CCCV constant current constant voltage
FTP federal test procedure
NMC nickel-manganese-cobalt
OCV open-circuit voltage
PCM phase change material
SEI solid-electrolyte interface
Keywords: Lithium-ion batteries, capacity fade, thermal management, degradation, aging, driving cycles, electric vehicles
Citation: Carnovale A and Li X (2022) Numerical assessment of thermal management on the capacity fade of lithium-ion batteries in electric vehicles. Front. Therm. Eng. 2:1049857. doi: 10.3389/fther.2022.1049857
Received: 21 September 2022; Accepted: 17 October 2022;
Published: 26 October 2022.
Edited by:
Fang Wang, Zhongyuan University of Technology, ChinaReviewed by:
Yuting Jia, Northeast Electric Power University, ChinaHengyun Zhang, Shanghai University of Engineering Sciences, China
Copyright © 2022 Carnovale and Li. This is an open-access article distributed under the terms of the Creative Commons Attribution License (CC BY). The use, distribution or reproduction in other forums is permitted, provided the original author(s) and the copyright owner(s) are credited and that the original publication in this journal is cited, in accordance with accepted academic practice. No use, distribution or reproduction is permitted which does not comply with these terms.
*Correspondence: Xianguo Li, x6li@uwaterloo.ca