Effects of dietary nitrogen and/or phosphorus reduction on mineral homeostasis and regulatory mechanisms in young goats
 Luisa S. Zillinger1
  Karin Hustedt1 Nadine Schnepel1 Frank Hirche2
  Marion Schmicke3
  Gabriele I. Stangl2
  Alexandra S. Muscher-Banse1*
- 1Institute for Physiology and Cell Biology, University of Veterinary Medicine Hannover, Foundation, Hannover, Germany
- 2Institute of Agricultural and Nutritional Science, Martin Luther University Halle-Wittenberg, Halle, Germany
- 3Clinic for Cattle, University of Veterinary Medicine Hannover, Foundation, Hannover, Germany
Introduction: The reduction of nitrogen (N) and phosphorus (P) in ruminant feed is desirable due to costs and negative environmental impact. Ruminants are able to utilize N and P through endogenous recycling, particularly in times of scarcity. When N and/or P were reduced, changes in mineral homeostasis associated with modulation of renal calcitriol metabolism occurred. The aim of this study was to investigate the potential effects of dietary N- and/or P-reduction on the regulatory mechanisms of mineral transport in the kidney and its hormonal regulation in young goats.
Results: During N-reduction, calcium (Ca) and magnesium (Mg) concentrations in blood decreased, accompanied by a lower protein expression of cytochrome P450 family 27 subfamily B member 1 (CYP27B1) (p = 0.016). The P-reduced fed goats had low blood phosphate concentrations with simultaneously high Ca and Mg levels. The insulin-like growth factor 1 concentrations decreased significantly with P-reduction. Furthermore, gene expression of CYP27B1 (p < 0.001) and both gene (p = 0.025) and protein (p = 0.016) expression of the fibroblast growth factor receptor 1c isoform in the kidney were also significantly reduced during a P-reduced diet. ERK1/2 activation exhibited a trend toward reduction in P-reduced animals. Interestingly, calcitriol concentrations remained unaffected by either restriction individually, but interacted significantly with N and P (p = 0.014). Additionally, fibroblast growth factor 23 mRNA expression in bone decreased significantly with P-restriction (p < 0.001).
Discussion: These results shed light on the complex metabolic and regulatory responses of mineral transport of young goats to dietary N and P restriction.
1 Introduction
The reduction of nitrogen (N) and phosphorus (P) in feed for livestock is a much-discussed topic in environmental and resource protection. Excessive N and P content in animal feed not only causes high production costs, but also poses a significant environmental problem, e.g., through nutrient runoff, which leads to eutrophication of water bodies. Due to the ruminohepatic urea cycle, ruminant microorganisms can utilize N for microbial protein synthesis compared to monogastric species (1). Furthermore, ruminants can maintain P homeostasis even with reduced P-intake. This is due to their ability to recycle endogenous phosphate (Pi) (2, 3). Nevertheless, an adequate supply of N and P is necessary for ruminants to maintain body functions.
Previous studies have shown that goats fed reduced N diets had lower blood calcium (Ca) levels (4, 5). In a study by Muscher and Huber (4), N-reduction also resulted in alterations in vitamin D metabolism. P-reduction also resulted in modulation of mineral homeostasis in goats and sheep with reduced plasma concentration of Pi and concomitant high plasma Ca levels in the blood (6, 7). The homeostasis of Pi and Ca in the body is tightly regulated by various hormones, primarily controlled by the interaction of active vitamin D (1,25(OH)2D3, calcitriol), parathyroid hormone (PTH), and fibroblast growth factor 23 (FGF23) (8). The enzyme cytochrome P450 family 27 subfamily B member 1 (CYP27B1) catalyzes the hydroxylation of calcidiol (25(OH)D3) to calcitriol in the kidney (9). Reduced plasma Pi concentration in monogastric species (10) and dairy cows (2) stimulates the synthesis of calcitriol. This results in an increased absorption of Pi from the intestine, where Pi transport proteins are upregulated (11). Conversely, elevated Ca concentrations inhibit the synthesis of calcitriol, leading to reduced Ca absorption from the intestine and the release of Ca and Pi from bone in both monogastric species (11, 12) and goats (13).
The degradation of calcitriol is facilitated by the enzyme cytochrome P450 family 24 subfamily A member 1 (CYP24A1). Additionally, CYP24A1 can convert calcidiol into 24,25-dihydroxyvitamin D3 (24,25(OH)2D3), another inactive form of vitamin D (14). Thus, calcitriol plays an essential role in maintaining serum Ca and Pi levels. Consequently, one of its effects is the stimulation of FGF23 secretion from osteoblasts and osteocytes (8). FGF23 primarily regulates plasma Pi concentration (8, 15), as demonstrated in sheep fed a P-reduced diet, where a simultaneous lower FGF23 mRNA expression in bone was observed (16). Therefore, FGF23 governs renal Pi excretion or reabsorption through the sodium-dependent Pi -transporters NaPiIIa (SLC34A1), NaPiIIc (SLC34A3) and possibly PiT2 (SLC20A2). However, no evidence of FGF23-dependent regulation was found for PiT1 (SLC20A1), another important sodium-dependent Pi transporter in the kidney (17). In contrast, in mature ruminants, renal Pi excretion does not appear to be influenced by low dietary P intake (18). FGF23 also modulates the expression of CYP27B1 in the kidneys of rodents (19). To exert these modulatory effects in the kidney, FGF23 requires its kidney-specific fibroblast growth factor receptor 1c (FGFR1c) and additionally its co-receptor α-Klotho for high-affinity binding to its receptor (20). Binding of FGF23 to this complex and subsequent activation of the FGFR1c/α-Klotho pathway triggers phosphorylation of the intracellular mitogen-activated protein kinase 3 and 1 (ERK1 and ERK2) signaling pathway (21). This activation then leads to suppression of renal expression of NaPiIIa, NaPiIIc and potentially PiT2 (17).
The aim of this study is to investigate the influence of an N- and/or P-reduced diet on the regulatory mechanisms of mineral transport in the kidneys of young goats, considering anticipated ruminant-specific alterations in these transport mechanisms. Previous research conducted by our team revealed lower concentrations of calcitriol and mRNA expression of CYP27B1 in goats fed an N-reduced diet (4, 22). Therefore, it was hypothesized that diminished levels of insulin-like growth factor 1 (IGF1) in plasma were responsible for the reduced expression of CYP27B1 and consequently calcitriol (22). However, the reduced IGF1 levels could also stimulate the release of FGF23 from bone, thereby inhibiting CYP27B1 expression. Conversely, reducing P intake might inhibit the release of FGF23 from bone, potentially leading to increased renal synthesis of calcitriol by stimulation CYP27B1 expression in young goats. Consequently, it will be investigated whether the observed lower CYP27B1 mRNA expression during N-reduction is corroborated at the protein level and maintained during simultaneous N- and P-reduction. Additionally, we aim to determine whether the hypothesized stimulatory effect of P-reduction on CYP27B1 expression outweighs the effects of N reduction.
2 Materials and methods
2.1 Ethical standards
The animal feeding and handling protocol for this experiment were approved by the Animal Welfare Officer of the University of Veterinary Medicine Hannover, Foundation (Hannover, Germany) and complied with the German Animal Welfare Law (permit number: 33.19–42,502–04-19/3076; Lower Saxony State Office for Consumer Protection and Food Safety (LAVES); 15 March 2019).
2.2 Animals and feeding regimes
For this molecular study, organs and blood samples were obtained from animals of a previous study (23) to avoid unnecessary repetition of animal model experiments. In brief, 28 male colored German goats from a commercial goat farm were selected for this experiment. This breed ensured uniform characteristics in terms of age, place of birth and genetic background, thus ensuring the reliability and reproducibility of the results. In addition, the same breed of goat was used in previous studies at this institute, which enables a direct comparison and continuity of the research results. The goats were initially fed a commercial milk replacer for 4 weeks, which was then slowly replaced by the control diet. After this adaptation period, the animals were divided into four different feeding groups and received (1) a control diet (16.48% crude protein (CP), 0.48% P, 1.3% Ca), (2) an N-reduced diet (8.35% CP, 0.51% P, 1.2% Ca), (3) a P-reduced diet (16.86% CP, 0.11% P, 1.2% Ca) or (4) an N- and P-reduced diet (8.1% CP, 0.11% P, 1.2% Ca). The level of urea was chosen to be underneath the threshold concentration at which the upregulation of rumen transepithelial urea transport begins. According to a previous study from our institute (24), the protein content was reduced to achieve a urea content of approximately 1 mmol/L in the blood. The amount of P in the diet was reduced to such extend that the Pi concentration in blood was approximately 1 mmol/L (25). The maximum amount of Ca in the diet for goats is suggested to be 1.5% of diet dry matter (DM) (26). In accordance with this recommendation, the Ca content in this study was adjusted to a maximum of 1.43% of DM. Individual feeding took place daily at 08.00 and 16.00 for 6 to 8 weeks. At the start of the experiment, the animals were 10 weeks old with an initial body weight (BW) of 19.04 kg (SEM 0.08) (23). A feed manufacturer specializing in feed production for animal research (ssniff Spezialdiäten GmbH, Soest, Germany) manufactured the pellets for the diets. All diets were isoenergetic, and contained approximately 12.7 MJ ME/kg DM. For further details on ingredients and chemical composition of the diets, see Weber et al. (23). Each feeding group consisted of seven animals housed together and received water ad libitum. Each animal received the amount of 55 g/kg0.75 pelleted concentrate twice a day. In addition, 25% of the concentrate weight was fed as wheat straw. To calculate the average intake of nutrients and minerals per animal, all feed offered and refused were recorded daily. The BW of the animals was measured weekly.
2.3 Body fluid and tissue sampling
Shortly before euthanasia, the goats underwent exsanguination following a standard abattoir captive bolt stunning procedure (Annex IV Directive 2010/63/EU). Blood samples were collected from the Vena jugularis using lithium-heparin syringes and serum syringes (Sarstedt AG & Co. KG, Nümbrecht, Germany). To mitigate diurnal variations, samples were consistently taken from fasting animals at the same morning time. Plasma and serum samples were centrifuged (2,000 g at room temperature, 15 min) for separation and subsequently stored at −20°C until further analysis. For technical reasons (Ussing chamber experiments), two goats per day were euthanized. To minimize potential time-related effects, animals from two feeding groups were slaughtered alternately. Within 5 min postmortem, the kidneys were removed, and tissue samples were taken from the cortex. The rib bones were dissected, the flesh was removed and then cut into cortical and medullary sections. The kidney cortices and bone sections were then rinsed with ice-cold saline (0.9% NaCl, w/v), immediately frozen in liquid N2 and stored at −80°C until further analysis.
2.4 Biochemical determinations
To determine the N, Pi and Ca status of the animals, the blood plasma concentrations of urea (commercial kit, R-Biopharm AG, Darmstadt, Germany), Pi, and Ca were measured colorimetrically using standard spectrometric methods (27, 28) [interassay CV 3.79% (N), 1.88% (Ca) and 5.05% (Pi); intraassay CV 1.2% (N), 2.85% (Ca) and 1.42% (Pi)]. For an indirect assessment of PTH levels, plasma cyclic adenosine monophosphate (cAMP) was determined using competitive ELISA (Enzo Life Sciences GmbH, Lörrach, Germany). Serum concentrations of calcidiol and calcitriol were determined commercially either by HPLC or competitive ELISA (Immundiagnostik AG, Bensheim, Germany). Plasma concentration of 24,25(OH)2D3 was measured using liquid chromatography–tandem mass spectrometry at the Institute for Agricultural and Food Sciences at the Martin-Luther-University Halle-Wittenberg, Halle, Germany as described elsewhere (29). To analyze plasma growth hormone (GH), serum IGF1, plasma triiodothyronine (T3) and serum magnesium (Mg) concentrations, assays were conducted at the Clinic for Cattle, Laboratory of Endocrinology, University of Veterinary Medicine Hannover, Foundation. Techniques included in-house enzyme-linked immunosorbent assay, radioimmunoassays (Beckman Coulter GmbH, Krefeld, Germany) (30) or a standardized spectrometric technique. The concentration of blood glucose was measured in whole blood samples using the mutant Q-GDH-based blood glucose monitor method with an Accu-Chek Performa blood glucose meter (Roche Diagnostics GmbH, Mannheim, Germany).
2.5 Quantitative real-time PCR
Renal cortical tissue RNA was isolated using the RNeasy Plus Mini-Kit (Qiagen GmbH, Hilden, Germany), while bone tissue RNA was isolated using the RNeasy Fibrous Tissue Mini-Kit (Qiagen GmbH). Both kits contained spin columns to eliminate genomic DNA and were used in accordance with the manufacturer’s protocol. The RNA concentrations were measured spectrophotometrically using NanoDrop One (Thermo Fisher Scientific Inc., Waltham, MA, USA). Additionally, the quality and integrity of the RNA were assessed using an RNA 6,000 nanoassay on an Agilent 2,100 Bioanalyzer (Agilent Technologies Deutschland GmbH, Böblingen, Germany). Reverse transcription of 200 ng isolated RNA was conducted using random hexamers, oligo-dT primers, and TaqMan™ Reverse Transcription Reagent (Thermo Fisher Scientific Inc.) in accordance with the manufacturer’s protocol.
To evaluate mRNA expression of NaPiIIa in renal cortical tissue, caprine gene specific TaqMan primers and probes were synthesized by TIB Molbiol Syntheselabor GmbH (Berlin, Germany; Table 1). Each reaction mixture of 20 μL contained TaqMan™ Gene Expression Master Mix (Thermo Fisher Scientific Inc.), 16 ng reverse transcript complementary DNA (cDNA), 300 nmol/L specific primers, and 100 nmol/L specific probe. PCR products were amplified (50°C, 2 min; 95°C, 10 min; 40 cycles of 95°C, 15 s and 60°C, 1 min) and analyzed on a real-time PCR cycler (CFX96™, Bio-Rad Laboratories GmbH, Feldkirchen, Germany). Expression levels of CYP24A1, CYP27B1, ERK1, ERK2, FGFR1c, α-Klotho, sodium-potassium adenosine triphosphatase (Na+/K+-ATPase), NaPiIIc, PiT1, PiT2 and xenotropic polytropic retrovirus receptor 1 (XPR1) in renal cortical tissue were quantified using SYBR Green® PCR assays with specific primers (Table 2). The expression of FGF23 in bone tissue was also quantified using SYBR Green® PCR assays with specific primers (Table 2). Reaction mixtures of 20 μL contained SensiFAST™ SYBR No-Rox Mix (BioCat GmbH, Heidelberg, Germany), 200 nmol/L specific primers, and 16 ng reverse transcribed cDNA. A real-time PCR cycler (Bio-Rad Laboratories GmbH) was used for amplification (3 min at 95°C; 40 cycles of 10 s at 95°C and 30 s at 60°C) and detection of PCR products. To determine the melting curve, the thermal profile began with an incubation of 10 min at 55°C with a gradual increase in temperature (0.5°C per 10 s) up to 95°C. Absolute copy numbers were determined using calibration curves generated with cloned PCR fragment standards (35). Specificity of amplicons was verified by sequencing (Microsynth Seqlab GmbH, Göttingen, Germany) and using NCBI Blast1. For renal cortical tissue, the reference gene 18S rRNA was synthesized by TIB MOLBIOL (Table 2). Additionally, reference genes beta-2-microglobulin (B2M), ribosomal protein L19 (RPL19), and ribosomal protein S9 (RPS9) were quantified with SYBR Green® PCR assays (Table 2). Among these, RPL19 was identified as the most suitable reference gene for normalization. In bone tissue, the reference genes 18S, RPL19 and RPS9 were synthesized as described. In bone tissue, 18S rRNA was identified as the optimal reference gene for normalization. Gene expression was quantified with SYBR Green® PCR assay as described above. NormFinder software2 was used to determine the best reference gene for normalization. Each reaction was run twice and included water as a no-template control to ensure accuracy and reliability.
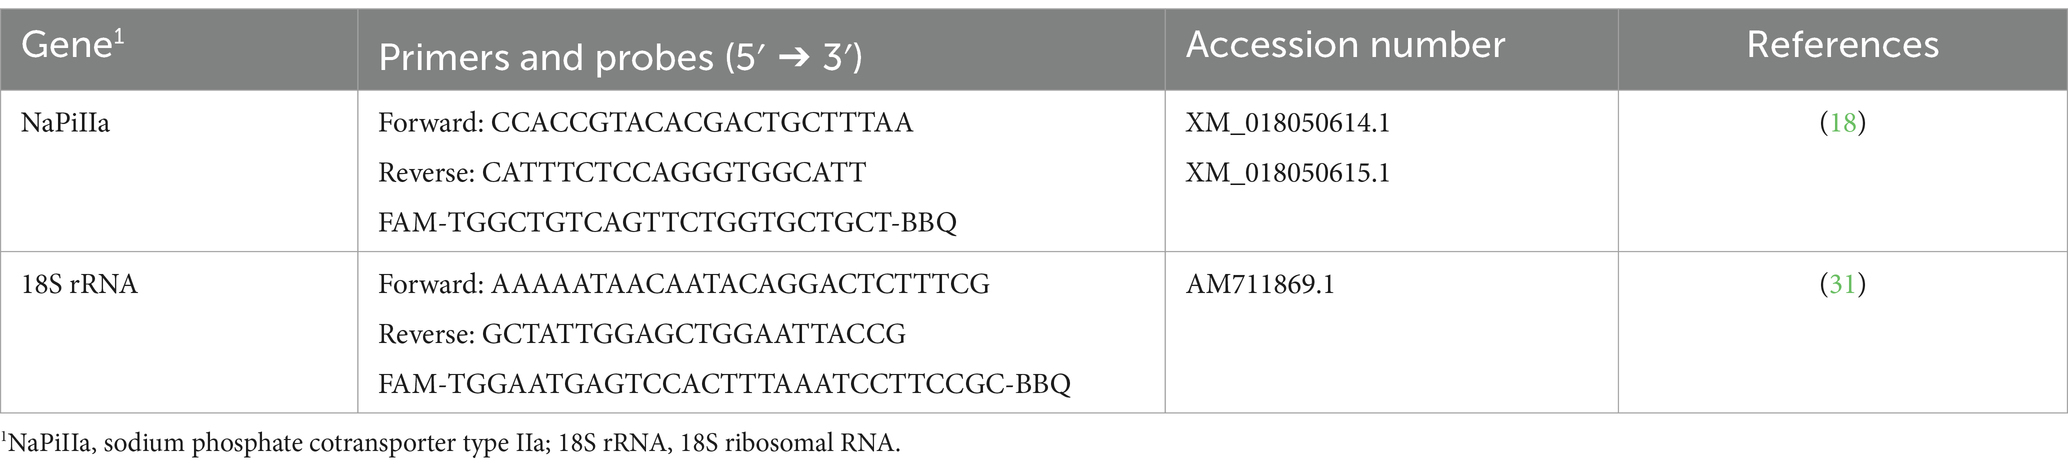
Table 1. Primers and probes used for TaqManTM assays in kidney cortex and bone tissue from young goats.
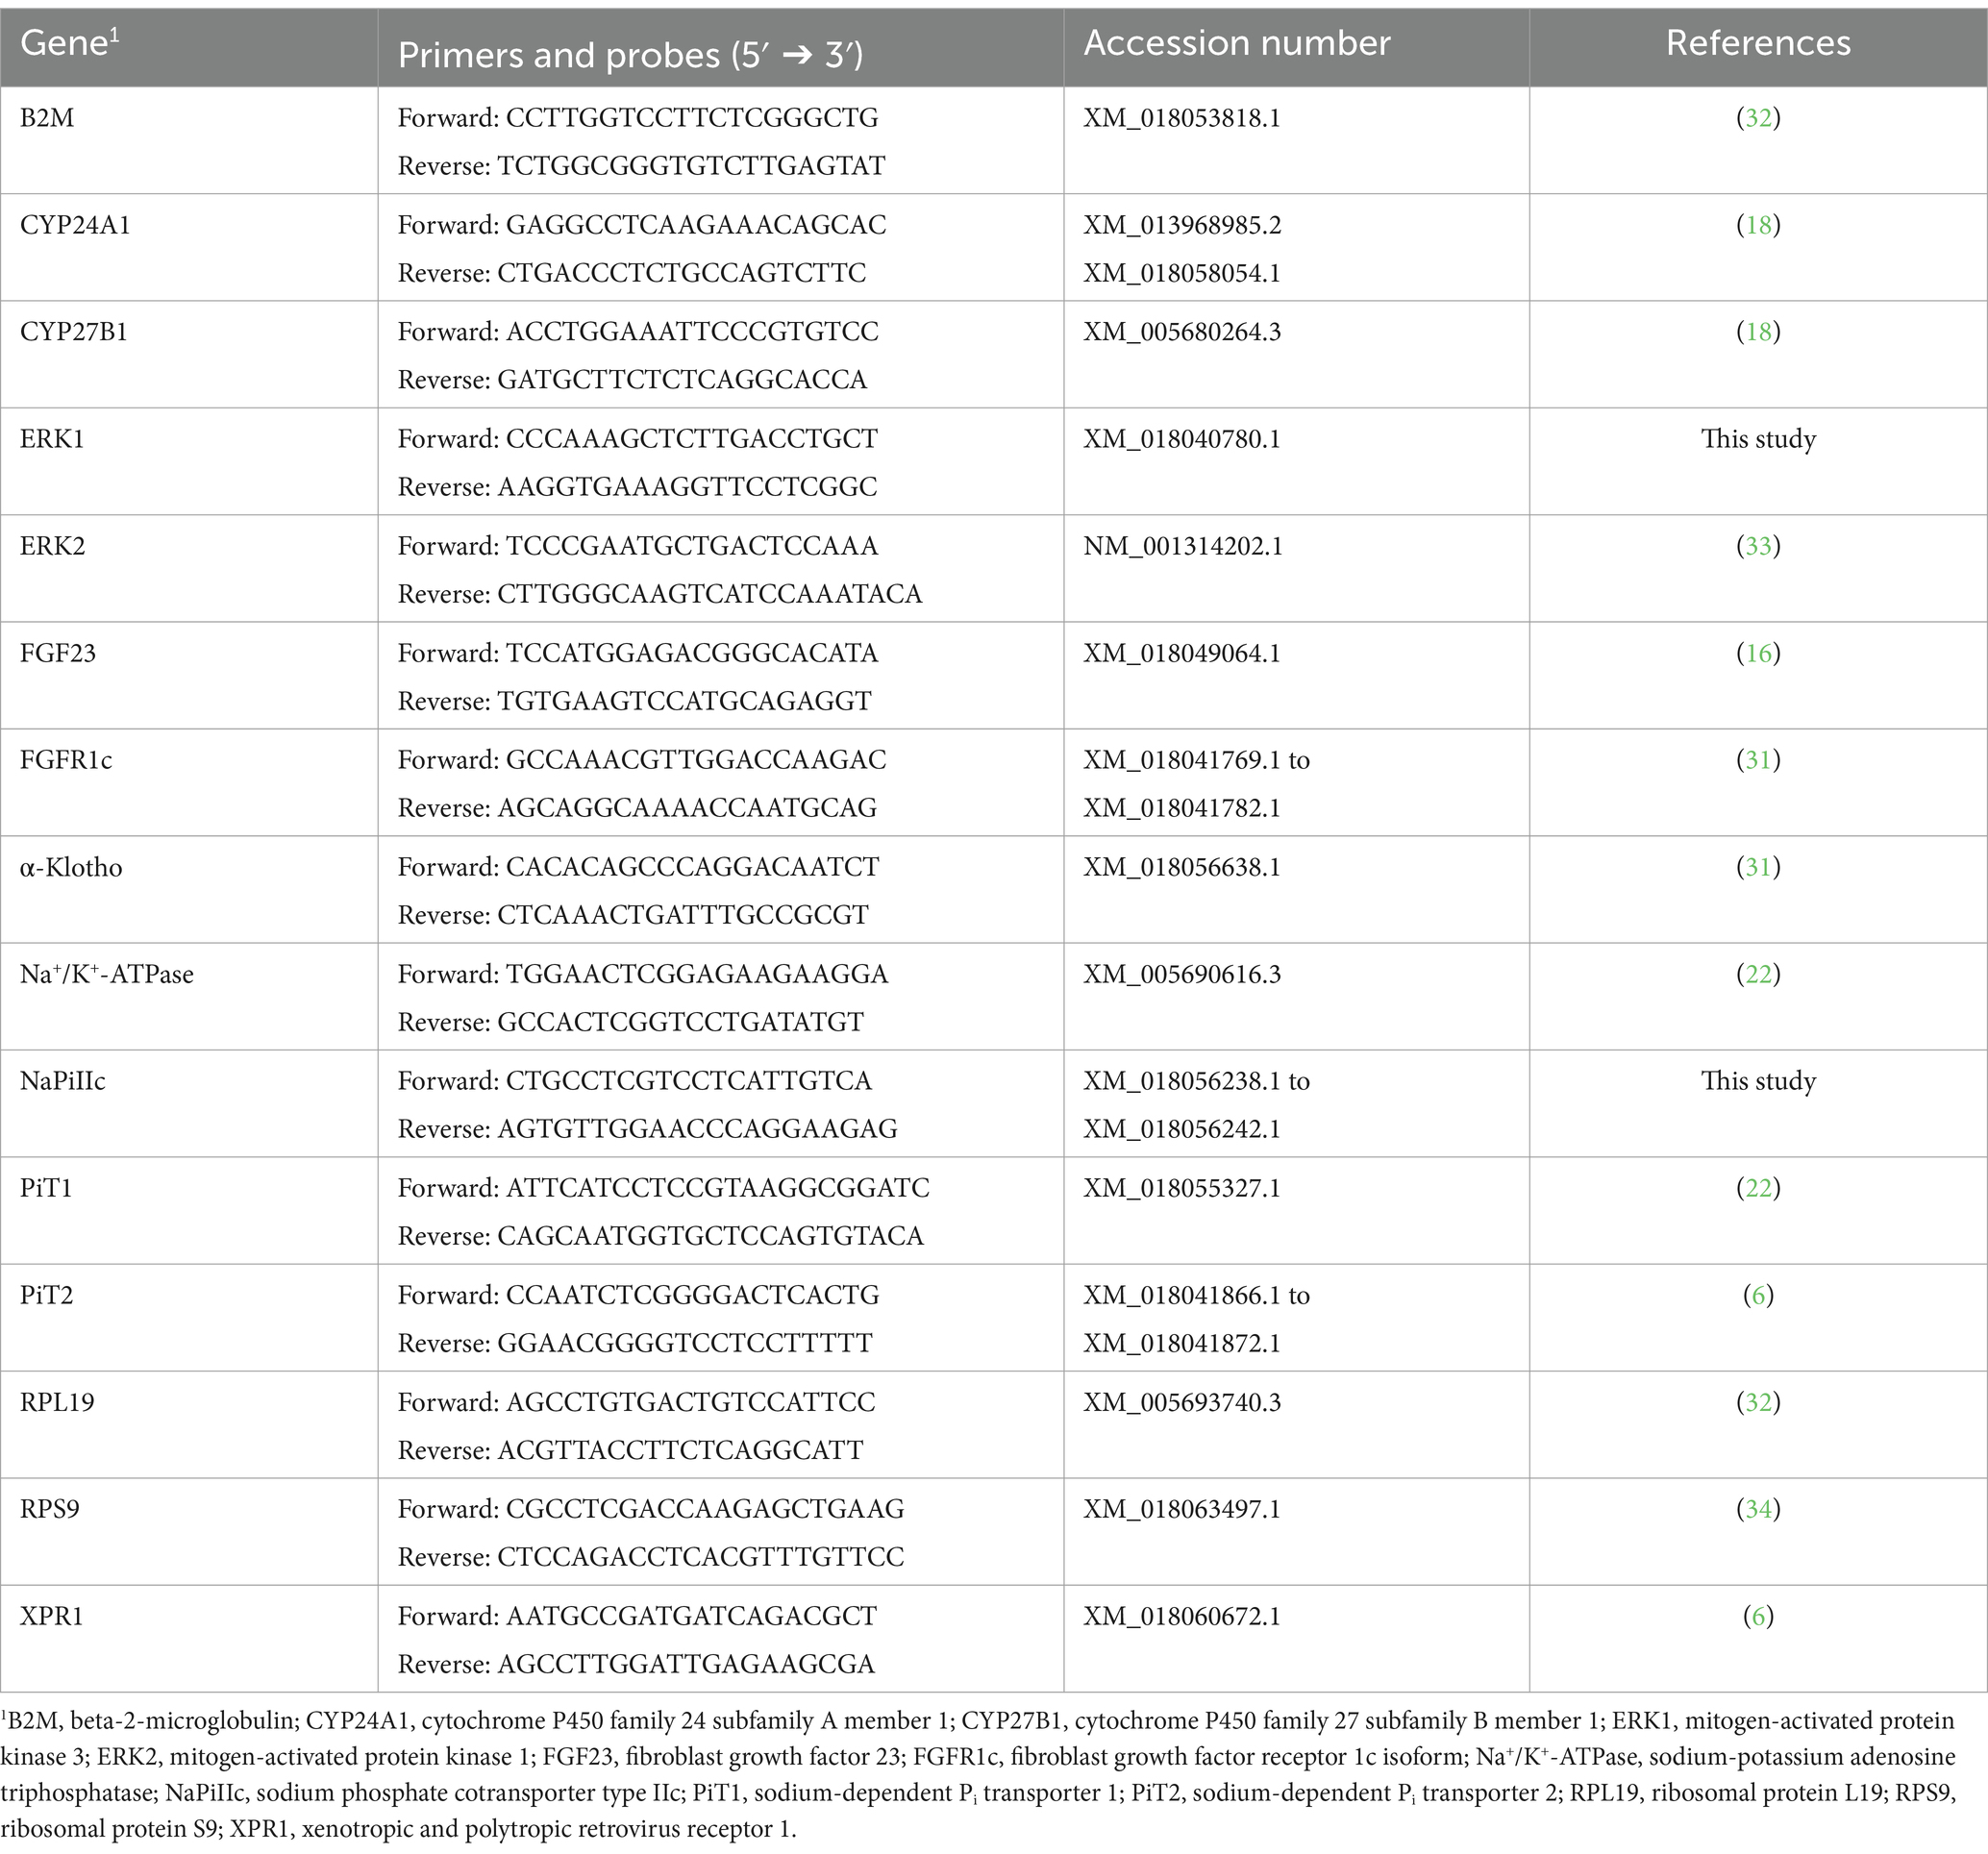
Table 2. Primers used for SYBR green assays in kidney cortex and bone tissue from young goats.
2.6 Tissue extraction and western blot analysis
To quantify the expression of NaPiIIa and PiT2, brush border membranes (BBM) were prepared in accordance with the method of Wilkens et al. (35). Cytosolic preparation was required for quantification of ERK1/2, whereas crude membranes (CM) were isolated for quantification of Na+/K+-ATPase, both in accordance with the method of Wilkens et al. (36). Total cell lysate preparation was required to determine CYP27B1 and FGFR1 protein expression in accordance with the method of Weber et al. (23). Protein concentrations of all cell fractions were measured using a commercial Bradford assay (Serva Elektrophoresis GmbH, Heidelberg, Germany). For detection of NaPiIIa protein expression, 15 μg of BBM was separated by 8.5% SDS-PAGE and transferred to nitrocellulose membranes (GE Healthcare Europe GmbH, Freiburg, Germany). The protein was incubated overnight with anti-NaPiIIa polyclonal antibody (Alpha Diagnostic Intl. Inc., San Antonio, TX, USA), diluted 1: 300 in phosphate-buffered saline (PBS) with 0.1% Tween 20 (PBST) and 2.5% non-fat milk powder at 4°C overnight. Immunoreactivity of the primary antibody was detected with an HRP-coupled secondary anti-rabbit antibody (diluted 1: 20,000). The specificity of the NaPiIIa antibody was successfully demonstrated by preincubation of the primary antibody with the corresponding antigenic peptide (data not shown). For detection of PiT2 protein expression, 25 μg of BBM was separated by 8.5% SDS-PAGE and transferred to nitrocellulose membranes (GE Healthcare Europe GmbH). Overnight incubation with a polyclonal anti-PiT2 antibody (self-made, Davids Biotechnologie GmbH, Regensburg, Germany, gift from Prof. V. Sorribas, Laboratory of Molecular Toxicology, University of Zaragoza, Spain) was performed, diluted 1: 1,000 in PBST. An HRP-coupled secondary anti-rabbit antibody (diluted 1: 2,000) was used to detect immunoreactivity of the primary antibody. To quantify ERK1/2 protein expression, 10 μg of cytosol was separated by 8.5% SDS-PAGE and transferred to nitrocellulose membranes (GE Healthcare Europe GmbH). To determine the level of phosphorylation, a primary anti-ERK1/2 (Cell Signaling Technology Europe B. V., Frankfurt am Main, Germany) was first incubated overnight and diluted 1: 2,000 in 5% bovine serum albumin (BSA) buffer and tris-buffered saline (TBS) with 0.1% Tween 20 (TBST). Immunoreactivity of the phosphospecific antibody was detected using an anti-rabbit antibody (diluted 1:2,500). The antibody was then removed by incubating the membrane with stripping buffer (pH 2.0). The membrane was blocked and incubated again overnight with the non-phosphospecific primary anti-ERK1/2 antibody (cell signaling), diluted 1:1,000 in 5% BSA and TBST. Immunoreactivity of the primary antibody was detected with anti-rabbit antibody (diluted 1: 2,500). The monoclonal ERK1/2 antibody recognizes bovine ERK1/2. For Na+/K+-ATPase, 10 μg of CM were separated by 8.5% SDS-PAGE and transferred onto nitrocellulose membranes (GE Healthcare Europe GmbH). To detect the Na+/K+-ATPase protein, the membranes were incubated overnight at 4°C with an anti- Na+/K+-ATPase antibody (Enzo Life Sciences GmbH) diluted 1: 10,000 in TBST and 5% non-fat milk powder. Immunoreactivity of the primary antibody was detected with an HRP-coupled anti-mouse antibody (diluted 1: 20,000). The monoclonal Na+/K+-ATPase antibody recognizes sheep and bovine Na+/K+ ATPase. For the quantification of CYP27B1, 10 μg of cell lysate was used. Membranes were incubated overnight with caprine anti-CYP27B1 (self-made, Davids Biotechnologie GmbH), diluted 1:500 in TBST and 2.5% non-fat milk powder. An HRP-coupled anti-rabbit antibody (diluted 1: 20,000) was used to detect the primary antibody. The specificity of the goat CYP27B1 antibody was successfully demonstrated by preincubation of the primary antibody with the corresponding antigenic peptide (data not shown). For the determination of FGFR1 protein, 25 μg of cell lysate was separated by 8.5% SDS-PAGE and transferred onto nitrocellulose membranes (GE Healthcare Europe GmbH). The protein was incubated overnight with a polyclonal anti-FGFR1 antibody (Thermo Fisher Scientific Inc.) 1:1,000 in TBST and 5% BSA. The primary antibody was detected with an HRP-coupled anti-rabbit antibody (diluted 1:2,500). The primary antibodies used were either specific to the particular caprine protein or exhibited species cross-reactivity for caprine, ovine or bovine target tissue. The protein sequences were verified for their homology with NCBI Blast (see text footnote 1). Immunoblot assays detecting the expression of ERK1/2, NaPi IIa and Na+/K+ ATPase proteins in caprine tissue were performed as described elsewhere (5, 37). Membranes were incubated solely with the secondary antibody to ensure exclusive detection of specific signals. For the detection of the specific proteins, a chemiluminescence system and the ChemiDoc MP (Bio-Rad Laboratories GmbH) were used. Densitometric measurements of proteins were performed using Image Lab 5.2.1 software (Bio-Rad Laboratories GmbH). For semi-quantification, the values of the quantified specific proteins were normalized to the amount of total protein stained with Indian ink. This normalization process aids in providing relative measurements of protein expression levels.
2.7 Statistical analysis
The sample size (n 7/group) was determined based on metabolic data from a previous study (5) with a statistical power of 0.8 and α error of 0.05. All data are given as means with their standard errors (SEM) unless otherwise stated. For data analysis, GraphPad Prism version 9.3 (GraphPad Software, San Diego, CA, USA) was used. All data were tested for normal distribution and were analyzed by two-way ANOVA with Tukey’s multiple comparisons test. p < 0.05 was considered significantly different, and p < 0.1 was used to define trends. Potential linear relationships between mRNA and protein expression levels, as well as correlations between gene and protein expression with blood metabolites, were calculated, using a simple correlation analysis with Pearson’s correlation coefficient. Non-linear relationships were calculated using Spearman’s correlation coefficient. Furthermore, potential outliers were tested using the ROUT method (38).
3 Results
3.1 Feed intake and growth performance of young goats fed a nitrogen- and/or phosphorus-reduced diet
All animals were clinically healthy throughout the study. The clinical health of the animals was ensured through monitoring and care by a qualified veterinarian that examined the animals daily and closely monitored their behavior and physical condition. The data on feed intake, daily weight gain and BW of the goats have been previously published (23). The data on feed intake are listed in Table 3. Daily BW gain was lower by 79% in the P-restricted group and by 64% in the N-/P-restricted group, resulting in final BW reductions of 20 and 16%, respectively, compared to the control group. The DM intake diminished by about 14% in the P- and 13% in the N-/P-groups. The concentrate intake diminished by about 14% in the P- and the N-/P- groups. The BW of goats in the N-restricted group remained unaffected. N-intake was lower by about 13% with P-restriction, 50% with N-restriction, and 56% with combined N- and P-restriction. Ca-intake was lower by 17% with P-restriction and 20% with N-/P-restriction. P-intake dropped by about 78% in both the P-restricted and N-/P- restricted groups.
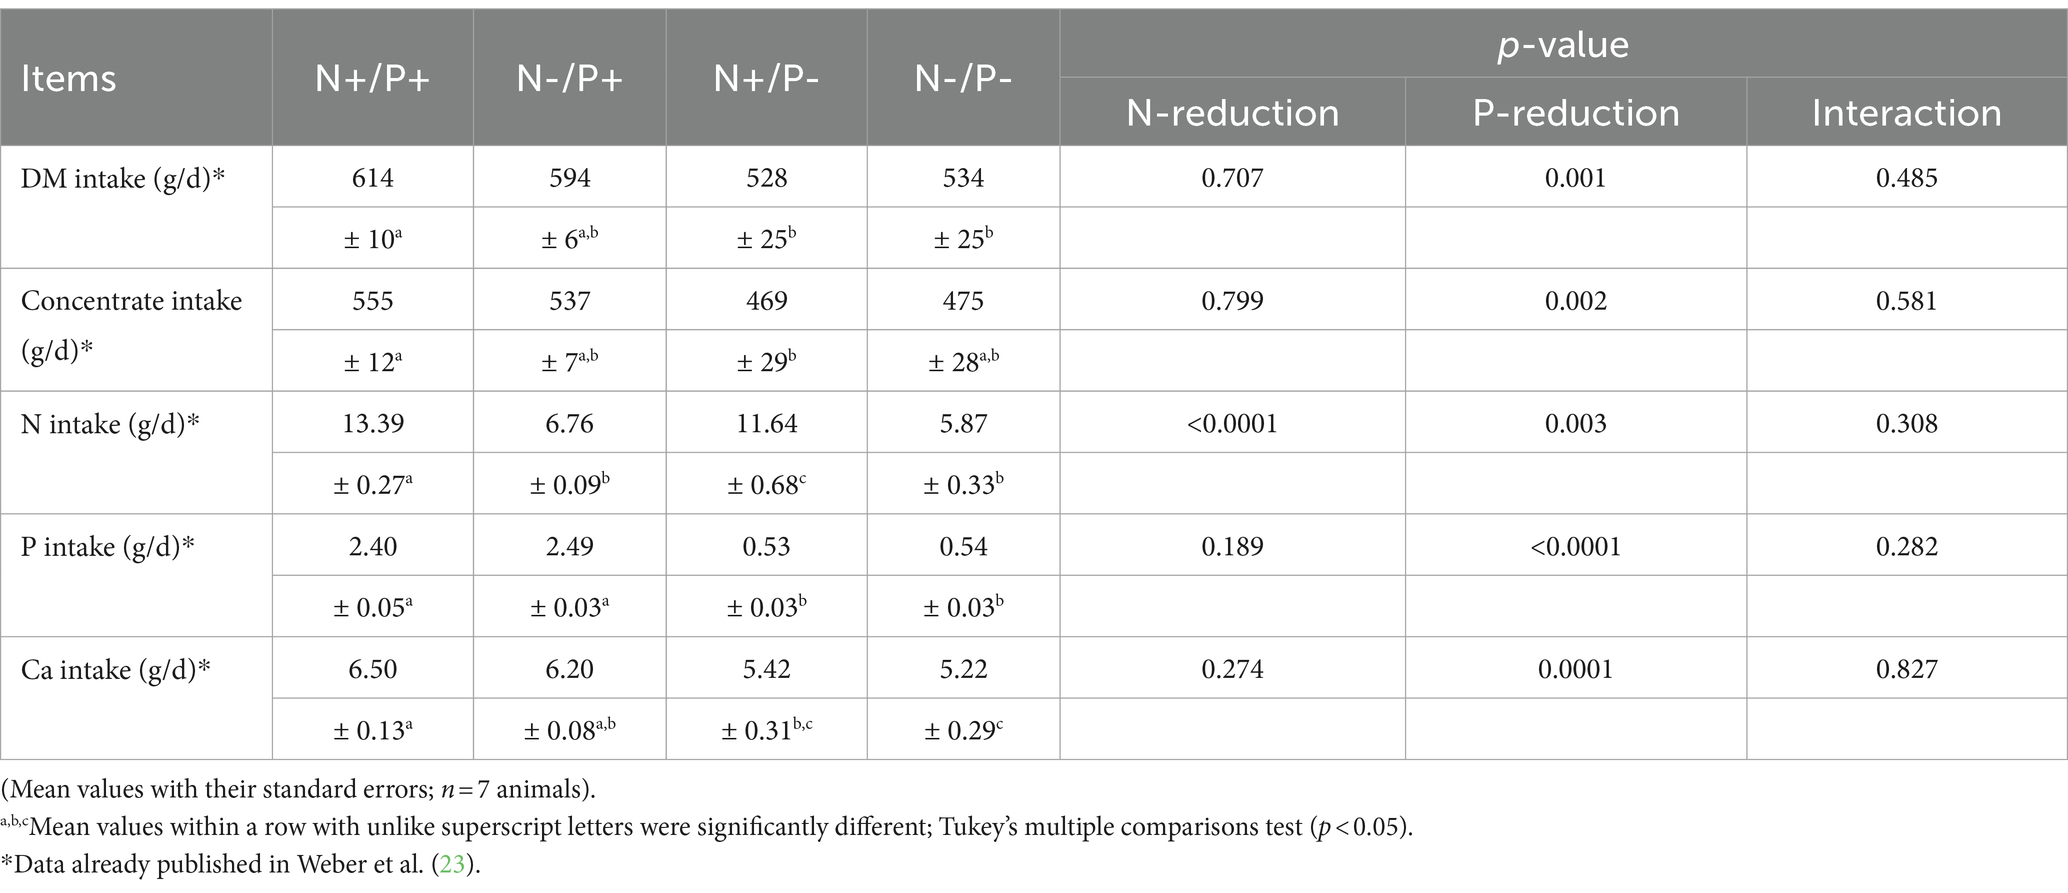
Table 3. Mean daily intake of dry matter (DM), concentrate, nitrogen (N), phosphorus (P) and calcium (Ca) of growing goats fed an N- and/or P-reduced diet.
3.2 Blood metabolites of young goats fed a nitrogen- and/or phosphorus-reduced diet
Blood metabolites are shown in Table 4. Some of these blood metabolites have already been published in Weber et al. (23). In the N-restricted feeding groups, blood plasma concentrations of urea were lower by about 83%. The P-reduced feeding groups showed significantly reduced blood plasma concentrations of Pi by about 67%, with concomitant higher blood Ca concentrations by about 37%. The glucose concentration in whole blood and the T3 concentration in plasma were consistent across all feeding groups (23). Plasma concentrations of cAMP was lower with N-restriction by trend and remained unaffected by P-restriction. Serum levels of calcidiol and calcitriol were not affected by N-reduction or P-reduction alone, but there was a significant interaction between N and P on calcitriol concentration. Blood plasma concentrations of 24,25(OH)2D3 were lower with the P-reduced diet, whereas an N-reduction had no effect on them. Plasma concentrations of GH were not affected by diet, whereas serum IGF1 concentrations tended to be lower with N-reduction and were significantly lower with P-reduction. Serum concentrations of Mg were higher with P-reduction and diminished by N-reduction.
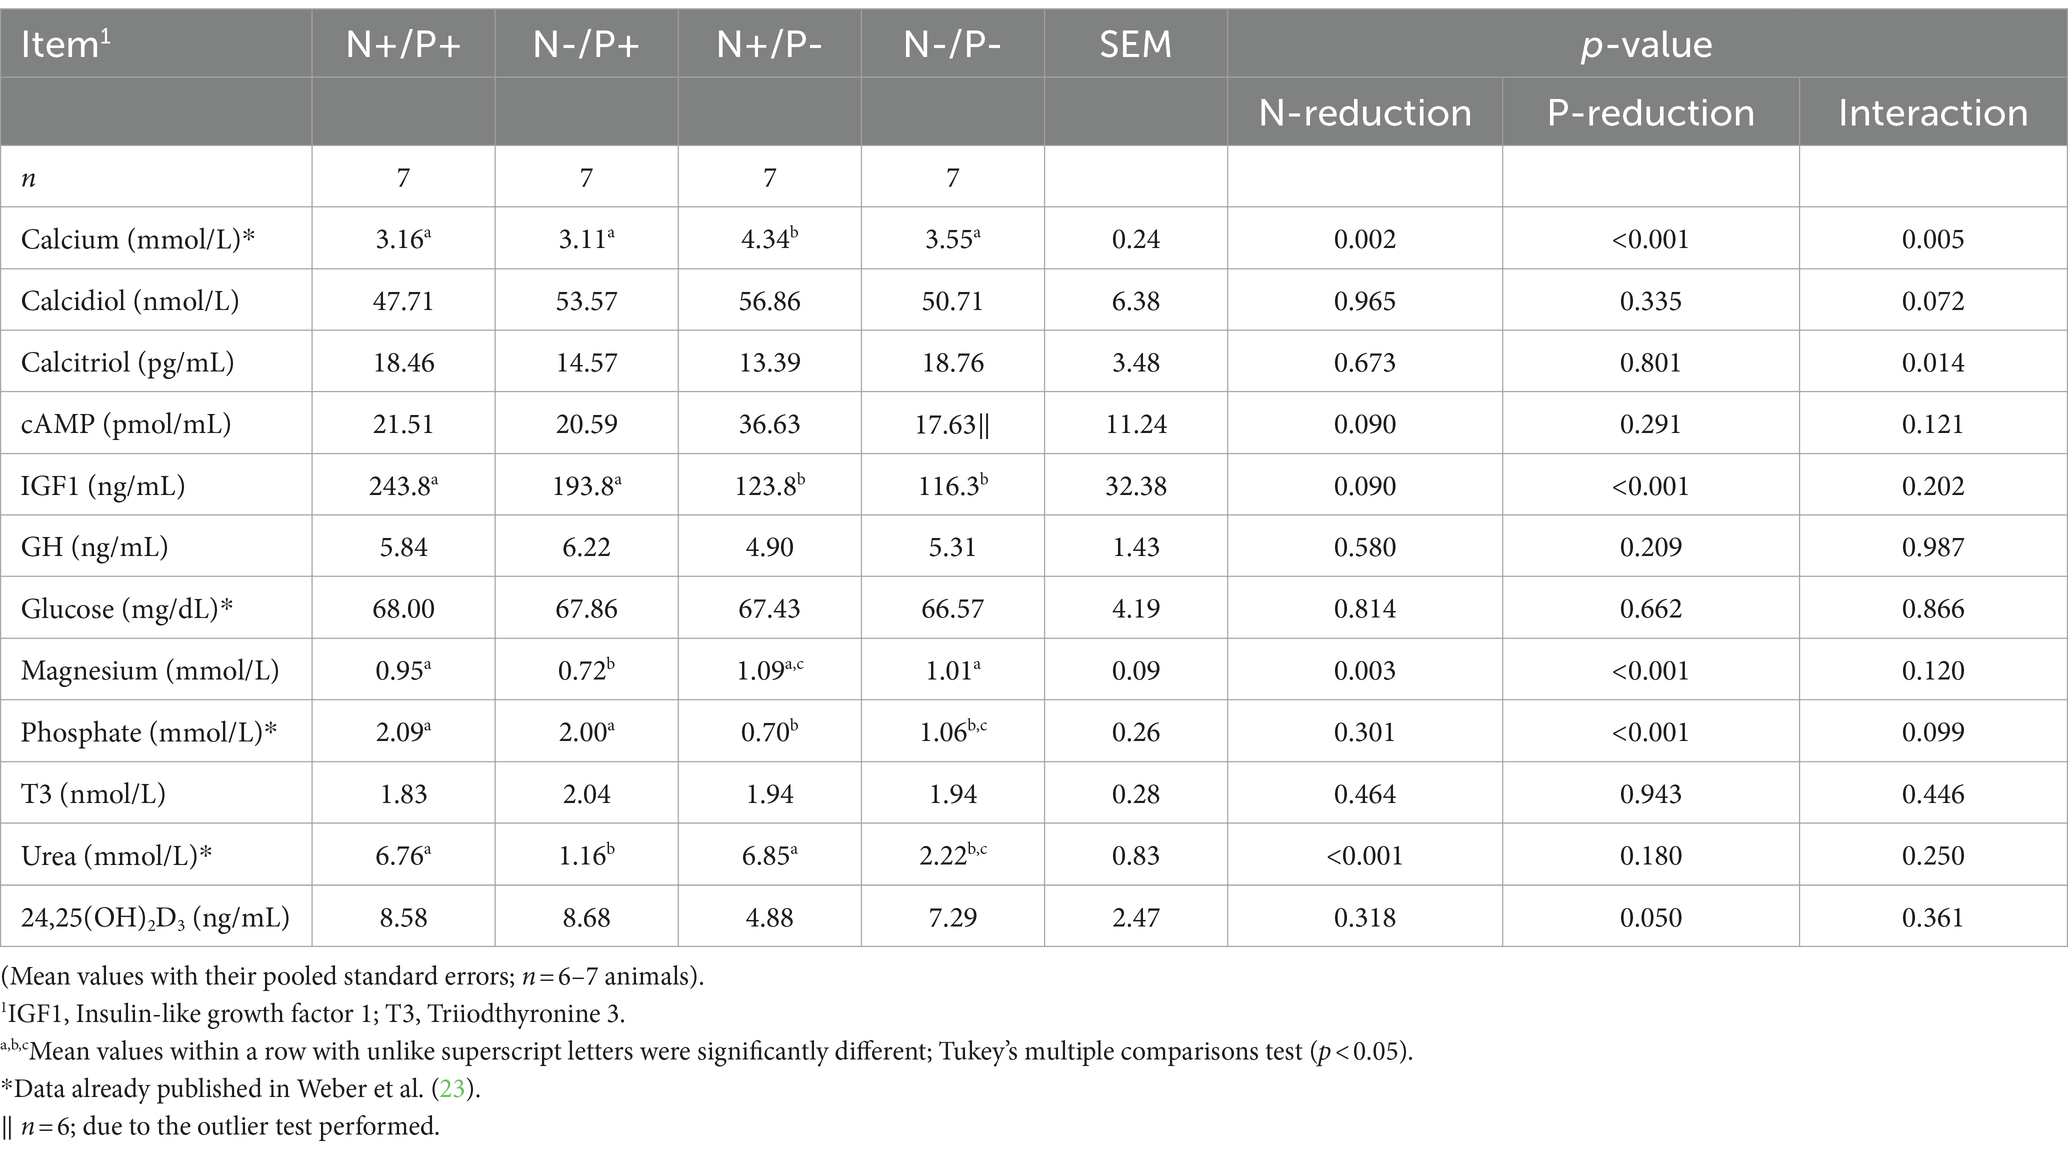
Table 4. Blood metabolites of young growing male goats fed an N- and/or P-reduced diet.
3.3 Effects of a nitrogen- and/or phosphorus-reduced diet on mRNA and protein expression of selected target genes in the kidney
The average RNA integrity number (RIN) of the kidney cortex tissue samples was 9.14 (SEM 0.12). The results of all genes and corresponding proteins expressed in the renal cortex are shown in Tables 5, 6. CYP27B1 mRNA expression was significantly reduced due to both N-reduction and P-reduction, as well as the interaction between N and P. Protein expression of CYP27B1 was lower in the N-restricted feeding group compared to the other feeding groups. Furthermore, CYP27B1 mRNA expression was negatively correlated with blood Ca concentration (r = −0.47, p = 0.014; Figure 1). FGFR1c mRNA and protein expression were significantly lower in the P-reduced feeding groups. FGFR1 protein expression correlated positively with plasma concentration of Pi (r = 0.42; p = 0.025; Figure 2) and negatively with plasma concentration of Ca (r = −0.41; p = 0.031; Figure 3). Furthermore, Na+/K+-ATPase mRNA expression was significantly lower in both groups receiving an N-reduced diet, while its protein expression remained unchanged. Na+/K+-ATPase mRNA expression was positively correlated with its protein expression. Although, NaPiIIa gene expression was not affected, NaPiIIa protein expression was higher in the P-reduced animals and tended to be higher in the N-reduced animals. The gene expression of NaPiIIc was lower by trend with P-restriction. Protein expression of ERK1/2 did not change, while pERK1/2 and the ratio of pERK1/2 to ERK1/2 showed a trend toward diminished expression in the P-reduced animals. Neither ERK1 nor ERK2 gene expression changed with different diets. Protein expression of ERK1/2 positively correlated with gene expression of FGFR1c (r = 0.41; p = 0.029; Figure 4). Expression of PiT2 mRNA showed a trend toward higher expression in the N-restricted feeding groups. However, protein expression of PiT2 was not affected by any of the feeding groups. The mRNA expression of CYP24A1, α-Klotho, PiT1 and XPR1 mRNA did not differ between the feeding groups.
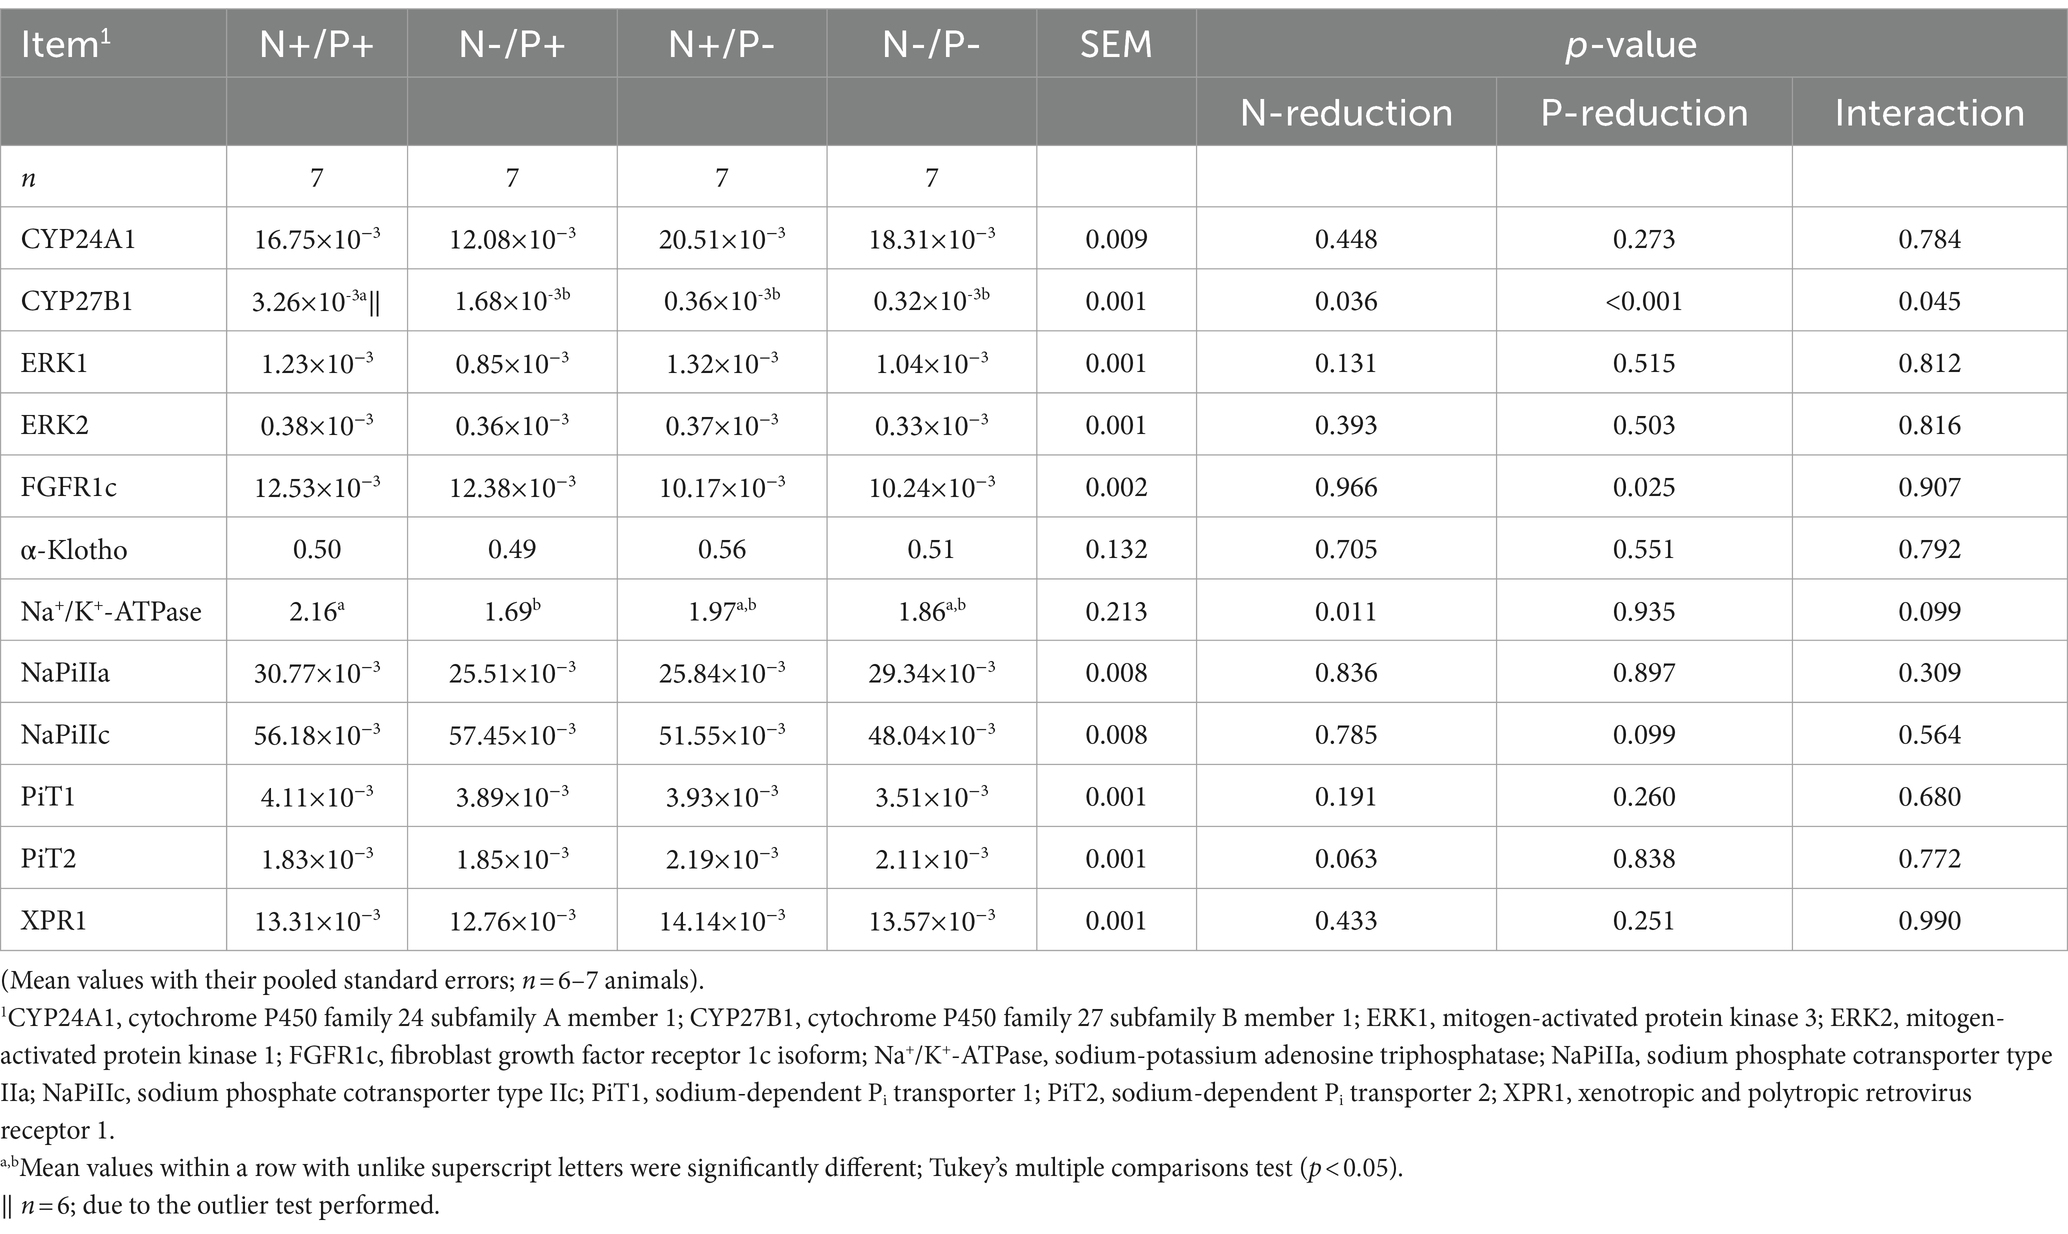
Table 5. Relative levels of CYP24A1, CYP27B1, ERK1, ERK2, FGFR1c, α-Klotho, Na+/K+-ATPase, NaPiIIa, NaPiIIc, PiT1, PiT2 and XPR1-mRNA expression normalized to RPL19 in the renal cortex of young growing male goats fed an N- and/or P-reduced diet.
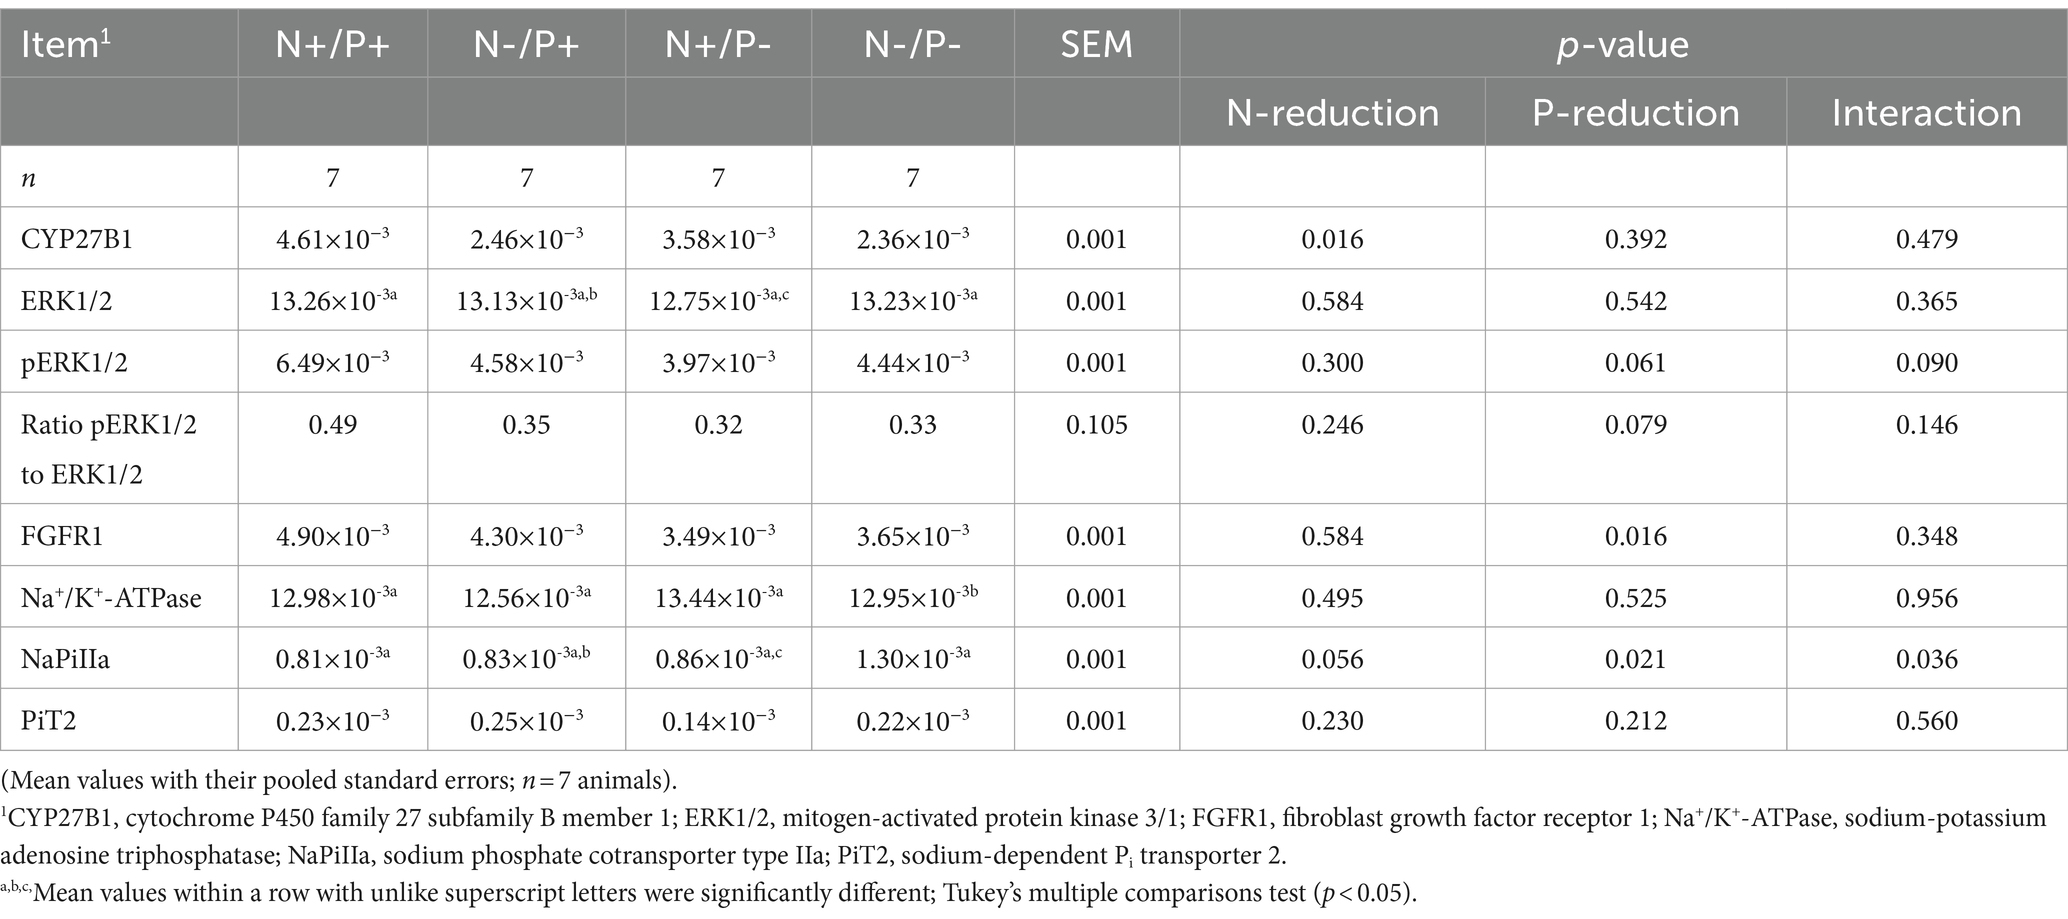
Table 6. Relative amounts of CYP27B1, ERK1/2, pERK1/2, FGFR1, Na+/K+-ATPase, NaPiIIa and PiT2 protein expression in the kidney cortex of young growing male goats fed an N- and/or P-reduced diet.
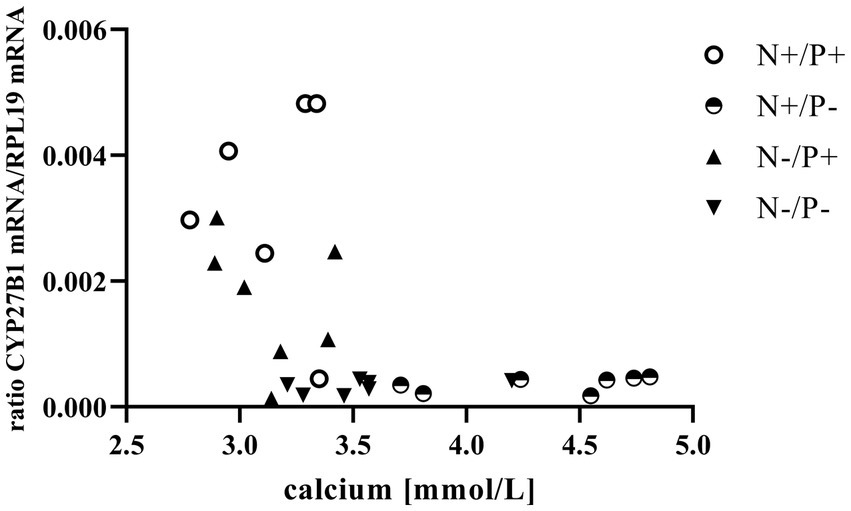
Figure 1. Relationship between blood calcium and cytochrome P450 family 27 subfamily B member 1 (CYP27B1) mRNA expression (r = −0.47, p = 0.014). The level of significance with Spearman’s correlation coefficient was set at p = 0.05.
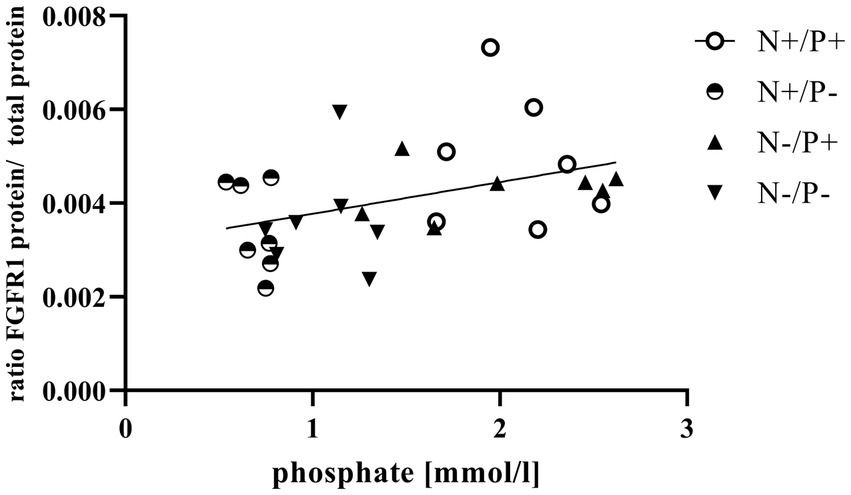
Figure 2. Linear relationship between phosphate in blood and fibroblast growth factor receptor 1 (FGFR1) protein expression (r = 0.42, p = 0.025). The level of significance with Pearson’s correlation coefficient was set at p = 0.05.
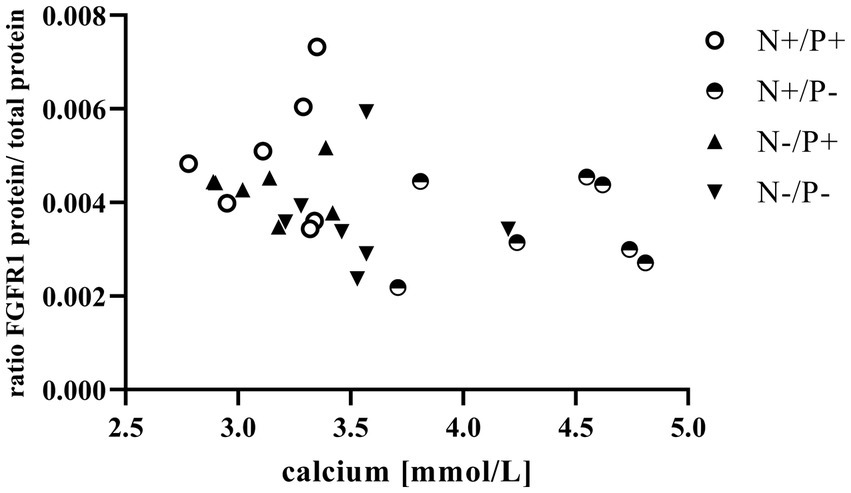
Figure 3. Relationship between calcium in blood and fibroblast growth factor receptor 1 (FGFR1) protein (r = −0.41, p = 0.031). The level of significance with Spearman’s correlation coefficient was set at p = 0.05.
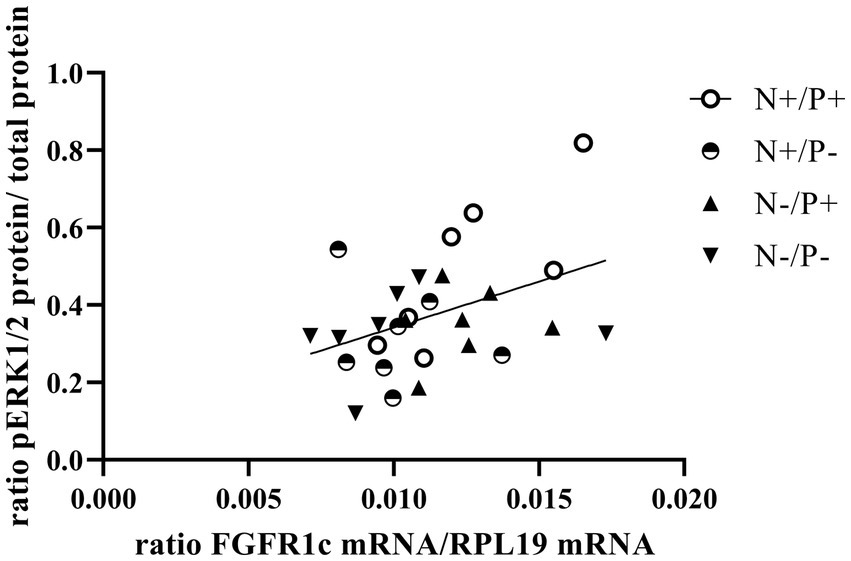
Figure 4. Linear relationship between phosphorylated mitogen-activated protein kinase 3/1 (pERK1/2) protein and fibroblast growth factor receptor 1c (FGFR1c) mRNA expression (r = 0.41, p = 0.029). The level of significance with Pearson’s correlation coefficient was set at p = 0.05.
3.4 Effects of a nitrogen- and/or phosphorus-reduced diet on mRNA expression of FGF23 in bone
The average RIN of the bone tissue samples was 8.69 (SEM 0.12). The mRNA expression of FGF23 is presented in Table 7. The FGF23 mRNA expression was significantly lower with P-restricted feeding.
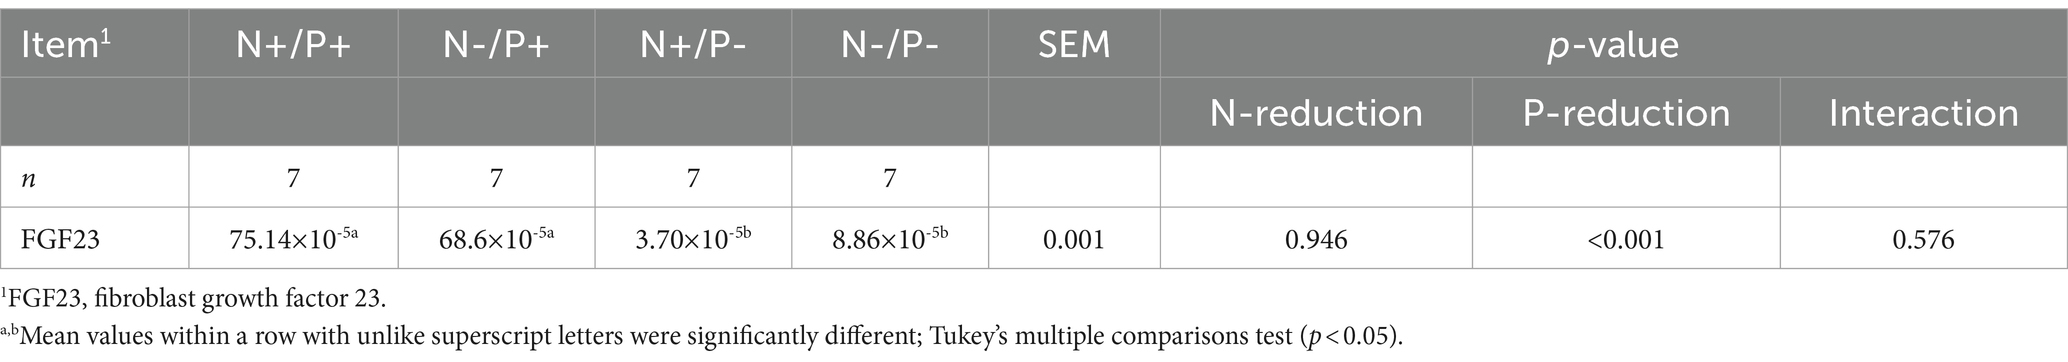
Table 7. Relative levels of FGF23 mRNA normalized to 18S rRNA in compact bone tissue of young growing male goats fed an N- and/or P-reduced diet (Mean values with their pooled standard errors; n = 7 animals).
4 Discussion
This study focused on the influence of N- and/or P-reduction on mineral homeostasis and its hormonal regulation in young goats. To our knowledge, this is the first study in young goats to investigate the effects of a simultaneous N- and P-reduced diet at the molecular level in the kidney.
Hormonal regulation of Pi and Ca homeostasis in blood is maintained by the described interplay of calcitriol, FGF23 and PTH (8). In monogastric species, P-reduction stimulated calcitriol synthesis (39) due to increased CYP27B1 expression mediated by pituitary hormones. However, previous studies in adult sheep and in female lactating goats have shown that blood calcitriol concentrations were not changed by P-reduction (7, 40). In this study conducted with young goats, the observed unchanged GH concentrations do not provide evidence that pituitary hormones stimulate renal CYP27B1 expression during P-reduction. This is further supported by the finding of reduced CYP27B1 expression and unchanged calcitriol concentrations in the current study.
The observed negative correlation between blood Ca concentration and CYP27B1 expression in this study indicates a relationship between the two variables (Figure 1). Elevated levels of circulating Ca are known to suppress CYP27B1 primarily by inhibiting PTH release (41). This reduction in calcitriol synthesis serves as a regulatory mechanism to prevent the animals from absorbing excessive Ca (11, 12).
An interesting result of this study is the increase in blood Mg concentration in P-reduction. In the kidney, Mg is passively reabsorbed paracellularly along its electrochemical gradient and actively reabsorbed transcellularly via Mg-permeable channels. In the current study, the increased Mg concentrations, like the increased Ca concentrations in the case of P-reduction, are presumably due to stimulated bone resorption. The increase in serum Mg during P-reduction, like the increased blood Ca levels mentioned earlier, could lead to an inhibition of PTH release from the parathyroid glands by activating the Ca sensing receptor. This would be an explanation for the reduced CYP27B1 mRNA expression (42). Moreover, the lower Mg concentrations in the serum of goats with N-reduction, and the simultaneously lower Ca concentrations in the blood, aligns with findings observed in humans, as well (43).
The current study is the first to quantify the protein expression of CYP27B1 in goats. Interestingly, contrary to the gene expression findings in these goats, P-reduction had no measurable effect on CYP27B1 protein expression. This discrepancy suggests the presence of additional regulatory mechanisms between transcript and protein levels. In the N-reduced animals of the current study, the low gene expression of CYP27B1 aligns with previous findings (31), which were also confirmed at protein level in this study. In the study by Wilkens et al. (31), the low levels of CYP27B1 mRNA were probably due to reduced levels of IGF1 in the blood of young goats during an N-reduced diet. IGF1 levels not only have a direct influence on CYP27B1 expression in the kidney but also affect bone metabolism. In humans, the synthesis of FGF23 in bone is inhibited by various factors, including IGF1 and insulin (44). Since an inhibitor of FGF23 synthesis is diminished during a reduced N diet and especially during a reduced P diet, a stimulation of FGF23 synthesis would be expected. To assess the status of FGF23, its mRNA expression in bone tissue was examined in the young goats of this study because no goat-specific blood FGF23 assays are currently available. Thus, this study demonstrates that the lower levels of CYP27B1 mRNA expression were not caused by stimulation of FGF23 expression from bone but were directly caused by lower IGF levels in blood, as initially hypothesized. The influence of IGF1 on CYP27B1 expression was also reflected in the higher significance of reduced IGF1 levels under P-restriction compared with the N-reduced animals. This was accompanied by a greater reduction in CYP27B1 mRNA under P-restriction.
Enhanced FGF23 signaling in response to elevated blood Pi levels is a well-known effect in monogastric species (45). FGF23 lowers renal NaPiIIa and NaPiIIc expression and leads to lower blood Pi concentration in vivo, predominantly via FGFR1c (46). The synthesis of FGFR1c in the kidney is directly upregulated by FGF23 through unknown mechanisms (47). In this study, the positive correlation of plasma Pi with FGFR1 protein (Figure 2) confirms that FGFR1 protein expression could be regulated by Pi in goats as in monogastric animals. This explains the lower expression of the FGF23 gene and the FGFR1(c) gene and protein in the P-reduced animals, whereas the expression of FGFR1(c) and FGF23 was not affected in the N-reduced animals. The prominent high blood Ca levels in the P-reduced goats of the current study might have also been a reason for the reduced FGF23 expression in the bones and FGFR1(c) in the kidneys. In FGF23 and FGFR1 knockout mice, Ca loss was observed due to a downregulation of the transient receptor potential cation channel subfamily V member 5 (48, 49). In these mice, this was regulated by a lower FGF23-induced ERK1/2 signaling cascade. In the present study, the interplay of Ca and FGF23 signaling is shown in an inverse correlation of plasma Ca with FGFR1 protein (Figure 3). Although FGFR1(c) and FGF23 expression changed, α-Klotho mRNA remained unaffected by the different diets. This could be explained by the unaffected blood level of calcitriol in the goats of this study. In a previous study on Ca-restricted goats, the increased expression of Klotho mRNA was hypothesized due to the presence of a vitamin D-responsive element in the Klotho gene (31), as is the case for the human and mouse Klotho gene (50).
In the current study, P-reduction resulted in lower FGF23 levels and thus decreased FGFR1c expression. This reduction also tended to reduce phosphorylation and subsequent activation of the ERK1/2 signaling cascade, just as in monogastric species (21). The positive correlation of FGFR1c mRNA and ERK1/2 protein (Figure 4) of the current study underlines this. Furthermore, a direct P-sensing mechanism, as postulated in various organs, could also be responsible for the tendentially reduced protein expression of pERK1/2 upon P-reduction (11).
The first step of calcitriol degradation is mainly mediated by the renal enzyme CYP24A1 through VDR (51). In addition, CYP24A1 also catalyzes calcidiol to 24,25(OH)2D3, an inactive form of vitamin D (14). To determine the degradation status of vitamin D in the goats of this study, blood concentrations of 24,25(OH)2D3 were measured during different intakes of N and/or P. The diminished blood concentration of 24,25(OH)2D3 during P-reduction indicates reduced catabolic degradation of calcidiol. In FGF23-overexpressing mice, CYP24A1 transcript levels were increased (19). Furthermore, FGF23-induced activation of FGFR1c in the kidney of monogastric animals resulted in higher CYP24A1 activation and consequently higher 24,25(OH)2D3 synthesis (52). Therefore, the low FGFR1 expression during P-reduction in this study could be responsible for the reduced 24,25(OH)2D3 concentration. Even though the gene expression of CYP24A1 was not significantly altered in these goats, the activity of the enzyme might still be changed. Since no goat-specific antibody against the CYP24A1 protein is available, altered protein expression and reduced activity cannot be ruled out.
A limitation of the study is the lack of urine parameters derived from 24-h urine samples, which could provide valuable insights into the functional implications of the observed molecular changes. Additionally, investigating the effects of N- and/or P-reduced feeding in goats at later stages in life, particularly in female animals, would be of interest. The rumen and its microbial population exhibit remarkable adaptability, and considering the additional influence of sex hormones on mineral homoeostasis is crucial for a comprehensive understanding of these processes in ruminants.
One potential application of the findings of the current study is the development of customized feeding protocols tailored to the specific nutritional needs of goats at different life stages and production goals. By incorporating knowledge of how dietary N and P levels affect mineral metabolism, producers can formulate more precise rations that optimize nutrient utilization and promote overall goat health and performance. In addition, the identification of key genes and proteins involved in mineral transport and hormone regulation offers opportunities for the development of targeted nutritional supplements or feed additives aimed at influencing these metabolic pathways. Such interventions could help to address specific nutritional problems or deficiencies in commercial goat herds and ultimately increase productivity and profitability. Furthermore, the knowledge gained from this research underlines the importance of constant innovation and adaptation in goat feeding to meet new challenges such as environmental sustainability and animal welfare. By integrating scientific advances into practical management strategies, goat farmers can improve the efficiency and sustainability of their operations while ensuring the health and welfare of their animals. Although the experiments conducted in this study are basic research, the results have the potential to significantly advance goat feeding practices in the industry.
5 Conclusion
This study demonstrated that the lower CYP27B1 mRNA observed during N-reduced feeding in young goats was also evident at the protein level. The reduction in CYP27B1 expression was primarily attributed to lower levels of IGF1 during this dietary treatment and not by FGF23 from bone. Although reduced P intake restricted the release of FGF23 from bone, there was no increase in renal synthesis of calcitriol, unlike in monogastric species. The reduced FGF23 levels resulted in lower receptor activation, compounded by lower expression of FGFR1(c) receptor in the kidney. This lower expression of FGFR1(c) may account for the lower blood concentration of 24,25(OH)2D3, consequently reducing the degradation of calcidiol in P-reduced young goats.
Data availability statement
The original contributions presented in the study are included in the article/supplementary material, further inquiries can be directed to the corresponding author.
Ethics statement
The animal study was approved by Lower Saxony State Office for Consumer Protection and Food Safety (LAVES). The study was conducted in accordance with the local legislation and institutional requirements.
Author contributions
LZ: Validation, Visualization, Writing – original draft, Data curation, Formal analysis, Investigation. KH: Formal analysis, Investigation, Visualization, Writing – review & editing. NS: Formal analysis, Investigation, Visualization, Writing – review & editing. FH: Formal analysis, Investigation, Writing – review & editing. MS: Formal analysis, Investigation, Writing – review & editing. GS: Formal analysis, Investigation, Writing – review & editing. AM-B: Writing – review & editing, Conceptualization, Funding acquisition, Project administration, Supervision, Validation, Visualization, Writing – original draft.
Funding
The author(s) declare that financial support was received for the research, authorship, and/or publication of this article. This Open Access publication was funded by the Deutsche Forschungsgemeinschaft (DFG, German Research Foundation) - 491094227 “Open Access Publication Funding” and the University of Veterinary Medicine Hannover, Foundation.
Acknowledgments
The authors wish to thank F. Sherwood-Brock for proofreading the manuscript, Professor V. Sorribas for providing the PiT2 antibody, J. Behrens for carrying out the animal experiment and Y. Armbrecht and M. Rhode for taking care of the animals.
Conflict of interest
The authors declare that the research was conducted in the absence of any commercial or financial relationships that could be construed as a potential conflict of interest.
Publisher's note
All claims expressed in this article are solely those of the authors and do not necessarily represent those of their affiliated organizations, or those of the publisher, the editors and the reviewers. Any product that may be evaluated in this article, or claim that may be made by its manufacturer, is not guaranteed or endorsed by the publisher.
Footnotes
References
1. Harmeyer, J, and Martens, H. Aspects of urea metabolism in ruminants with reference to the goat. J Dairy Sci. (1980) 63:1707–28. doi: 10.3168/jds.S0022-0302(80)83132-8
2. Horst, RL. Regulation of calcium and phosphorus homeostasis in the dairy cow. J Dairy Sci. (1986) 69:604–16. doi: 10.3168/jds.S0022-0302(86)80445-3
3. Puggaard, L, Kristensen, NB, and Sehested, J. Effect of decreasing dietary phosphorus supply on net recycling of inorganic phosphate in lactating dairy cows. J Dairy Sci. (2011) 94:1420–9. doi: 10.3168/jds.2010-3582
4. Muscher, A, and Huber, K. Effects of a reduced nitrogen diet on calcitriol levels and calcium metabolism in growing goats. J Steroid Biochem Mol Biol. (2010) 121:304–7. doi: 10.1016/j.jsbmb.2010.03.084
5. Firmenich, CS, Elfers, K, Wilkens, MR, Breves, G, and Muscher-Banse, AS. Modulation of renal calcium and phosphate transporting proteins by dietary nitrogen and/or calcium in young goats. J Anim Sci. (2018) 96:3208–20. doi: 10.1093/jas/sky185
6. Behrens, JL, Schnepel, N, Hansen, K, Hustedt, K, Burmester, M, Klinger, S, et al. Modulation of intestinal phosphate transport in young goats fed a low phosphorus diet. Int J Mol Sci. (2021) 22:866. doi: 10.3390/ijms22020866
7. Schröder, B, Breves, G, and Pfeffer, E. Binding properties of duodenal 1,25-dihydroxyvitamin D3 receptors as affected by phosphorus depletion in lactating goats. Comp Biochem Physiol A Comp Physiol. (1990) 96:495–8. doi: 10.1016/0300-9629(90)90668-I
8. Bergwitz, C, and Jüppner, H. Regulation of phosphate homeostasis by PTH, vitamin D, and FGF23. Annu Rev Med. (2010) 61:91–104. doi: 10.1146/annurev.med.051308.111339
10. Haussler, M, Hughes, M, Baylink, D, Littledike, ET, Cork, D, and Pitt, M. Influence of phosphate depletion on the biosynthesis and circulating level of 1alpha, 25-dihydroxyvitamin D. Adv Exp Med Biol. (1977) 81:233–50. doi: 10.1007/978-1-4613-4217-5_24
11. Kritmetapak, K, and Kumar, R. Phosphate as a signaling molecule. Calcif Tissue Int. (2021) 108:16–31. doi: 10.1007/s00223-019-00636-8
12. Sirajudeen, S, Shah, I, and Al, MA. A narrative role of vitamin D and its receptor: with current evidence on the gastric tissues. Int J Mol Sci. (2019) 20:3832. doi: 10.3390/ijms20153832
13. Elfers, K, Liesegang, A, Wilkens, MR, Breves, G, and Muscher-Banse, AS. Dietary nitrogen and calcium modulate bone metabolism in young goats. J Steroid Biochem Mol Biol. (2016) 164:188–93. doi: 10.1016/j.jsbmb.2015.11.007
14. Yoshikawa, R, Yamamoto, H, Nakahashi, O, Kagawa, T, Tajiri, M, Nakao, M, et al. The age-related changes of dietary phosphate responsiveness in plasma 1,25-dihydroxyvitamin D levels and renal Cyp27b1 and Cyp24a1 gene expression is associated with renal α-klotho gene expression in mice. J Clin Biochem Nutr. (2018) 62:68–74. doi: 10.3164/jcbn.17-20
15. Burnett, SM, Gunawardene, SC, Bringhurst, FR, Juppner, H, Lee, H, and Finkelstein, JS. Regulation of C-terminal and intact FGF-23 by dietary phosphate in men and women. J Bone Miner Res. (2006) 21:1187–96. doi: 10.1359/jbmr.060507
16. Köhler, OM, Grünberg, W, Schnepel, N, Muscher-Banse, AS, Rajaeerad, A, Hummel, J, et al. Dietary phosphorus restriction affects bone metabolism, vitamin D metabolism and rumen fermentation traits in sheep. J Anim Physiol Anim Nutr. (2021) 105:35–50. doi: 10.1111/jpn.13449
17. Hu, MC, Shiizaki, K, Kuro-o, M, and Moe, OW. Fibroblast growth factor 23 and klotho: physiology and pathophysiology of an endocrine network of mineral metabolism. Annu Rev Physiol. (2013) 75:503–33. doi: 10.1146/annurev-physiol-030212-183727
18. Herm, G, Muscher-Banse, AS, Breves, G, Schröder, B, and Wilkens, MR. Renal mechanisms of calcium homeostasis in sheep and goats1. J Anim Sci. (2015) 93:1608–21. doi: 10.2527/jas.2014-8450
19. Bai, X-Y, Miao, D, Goltzman, D, and Karaplis, AC. The autosomal dominant hypophosphatemic rickets R176Q mutation in fibroblast growth factor 23 resists proteolytic cleavage and enhances in vivo biological potency. J Biol Chem. (2003) 278:9843–9. doi: 10.1074/jbc.M210490200
20. Urakawa, I, Yamazaki, Y, Shimada, T, Iijima, K, Hasegawa, H, Okawa, K, et al. Klotho converts canonical FGF receptor into a specific receptor for FGF23. Nature. (2006) 444:770–4. doi: 10.1038/nature05315
21. Andrukhova, O, Zeitz, U, Goetz, R, Mohammadi, M, Lanske, B, and Erben, RG. FGF23 acts directly on renal proximal tubules to induce phosphaturia through activation of the ERK1/2–SGK1 signaling pathway. Bone. (2012) 51:621–8. doi: 10.1016/j.bone.2012.05.015
22. Elfers, K, Wilkens, MR, Breves, G, and Muscher-Banse, AS. Modulation of intestinal calcium and phosphate transport in young goats fed a nitrogen- and/or calcium-reduced diet. Br J Nutr. (2015) 114:1949–64. doi: 10.1017/S000711451500375X
23. Weber, SL, Hustedt, K, Schnepel, N, Visscher, C, and Muscher-Banse, AS. Modulation of GCN2/eIF2&alpha/ATF4 pathway in the liver and induction of FGF21 in young goats fed a protein- and/or phosphorus-reduced diet. Int J Mol Sci. (2023) 24:7153. doi: 10.3390/ijms24087153
24. Muscher-Banse, A, Schröder, B, Breves, G, and Huber, K. Dietary nitrogen reduction enhances urea transport across goat rumen epithelium. J Anim Sci. (2010) 88:3390–8. doi: 10.2527/jas.2010-2949
25. Breves, G, and Schröder, B. Comparative aspects of gastrointestinal phosphorus metabolism. Nutr Res Rev. (1991) 4:125–40. doi: 10.1079/NRR19910011
26. National Research Council. Nutrient requirements of small ruminants: sheep, goats, Cervids, and New World camelids. Washington, DC: The National Academies Press (2007).
27. Ray Sarkar, BC, and Chauhan, UPS. A new method for determining micro quantities of calcium in biological materials. Anal Biochem. (1967) 20:155–66. doi: 10.1016/0003-2697(67)90273-4
28. Kruse-Jarres, JD. Klinische Chemie. 2. Spezielle klinisch-chemische Analytik mit Tabellen. New York: G. Fischer Verlag (1979).
29. Aronov, PA, Hall, LM, Dettmer, K, Stephensen, CB, and Hammock, BD. Metabolic profiling of major vitamin D metabolites using Diels-Alder derivatization and ultra-performance liquid chromatography-tandem mass spectrometry. Anal Bioanal Chem. (2008) 391:1917–30. doi: 10.1007/s00216-008-2095-8
30. Piechotta, M, Kedves, K, Araujo, MG, Hoeflich, A, Metzger, F, Heppelmann, M, et al. Hepatic mRNA expression of acid labile subunit and deiodinase 1 differs between cows selected for high versus low concentrations of insulin-like growth factor 1 in late pregnancy. J Dairy Sci. (2013) 96:3737–49. doi: 10.3168/jds.2012-6341
31. Wilkens, MR, Elfers, K, Schmicke, M, Breves, G, and Muscher-Banse, AS. Dietary nitrogen and calcium modulate CYP27B1 expression in young goats. Domest Anim Endocrinol. (2018) 64:70–6. doi: 10.1016/j.domaniend.2018.03.005
32. Schulze, F, Malhan, D, El Khassawna, T, Heiss, C, Seckinger, A, Hose, D, et al. A tissue-based approach to selection of reference genes for quantitative real-time PCR in a sheep osteoporosis model. BMC Genomics. (2017) 18:975. doi: 10.1186/s12864-017-4356-4
33. Firmenich, CS, Schnepel, N, Hansen, K, Schmicke, M, and Muscher-Banse, AS. Modulation of growth hormone receptor-insulin-like growth factor 1 axis by dietary protein in young ruminants. Br J Nutr. (2020) 123:652–63. doi: 10.1017/S0007114519003040
34. Sacco, RE, Nonnecke, BJ, Palmer, MV, Waters, WR, Lippolis, JD, and Reinhardt, TA. Differential expression of cytokines in response to respiratory syncytial virus infection of calves with high or low circulating 25-hydroxyvitamin D3. PLoS One. (2012) 7:e33074. doi: 10.1371/journal.pone.0033074
35. Wilkens, MR, Kunert-Keil, C, Brinkmeier, H, and Schröder, B. Expression of calcium channel TRPV6 in ovine epithelial tissue. Vet J. (2009) 182:294–300. doi: 10.1016/j.tvjl.2008.06.020
36. Wilkens, MR, Mrochen, N, Breves, G, and Schröder, B. Gastrointestinal calcium absorption in sheep is mostly insensitive to an alimentary induced challenge of calcium homeostasis. Comp Biochem Physiol B Biochem Mol Biol. (2011) 158:199–207. doi: 10.1016/j.cbpb.2010.11.008
37. Starke, S, and Huber, K. Adaptive responses of calcium and phosphate homeostasis in goats to low nitrogen intake: renal aspects. J Anim Physiol Anim Nutr. (2014) 98:853–9. doi: 10.1111/jpn.12144
38. Motulsky, HJ, and Brown, RE. Detecting outliers when fitting data with nonlinear regression - a new method based on robust nonlinear regression and the false discovery rate. BMC Bioinformatics. (2006) 7:123. doi: 10.1186/1471-2105-7-123
39. Yoshida, T, Yoshida, N, Monkawa, T, Hayashi, M, and Saruta, T. Dietary phosphorus deprivation induces 25-hydroxyvitamin D(3) 1alpha-hydroxylase gene expression. Endocrinology. (2001) 142:1720–6. doi: 10.1210/endo.142.5.8119
40. Breves, G, Ross, R, and Höller, H. Dietary phosphorus depletion in sheep: effects on plasma inorganic phosphorus, calcium, l,25-(OH)2-Vit.D3 and alkaline phosphatase and on gastrointestinal P and Ga balances. J Agri Sci. (1985) 105:623–9. doi: 10.1017/S0021859600059530
41. Bikle, DD. Vitamin D metabolism, mechanism of action, and clinical applications. Chem Biol. (2014) 21:319–29. doi: 10.1016/j.chembiol.2013.12.016
42. Topf, JM, and Murray, PT. Hypomagnesemia and hypermagnesemia. Rev Endocr Metab Disord. (2003) 4:195–206. doi: 10.1023/A:1022950321817
43. Mouw, DR, Latessa, RA, and Hickner, J. Clinical inquiries. What are the causes of hypomagnesemia? J Fam Pract. (2005) 54:174–6.
44. Bär, L, Feger, M, Fajol, A, Klotz, LO, Zeng, S, Lang, F, et al. Insulin suppresses the production of fibroblast growth factor 23 (FGF23). Proc Natl Acad Sci USA. (2018) 115:5804–9. doi: 10.1073/pnas.1800160115
45. Perwad, F, Azam, N, Zhang, MY, Yamashita, T, Tenenhouse, HS, and Portale, AA. Dietary and serum phosphorus regulate fibroblast growth factor 23 expression and 1,25-dihydroxyvitamin D metabolism in mice. Endocrinology. (2005) 146:5358–64. doi: 10.1210/en.2005-0777
46. Gattineni, J, Bates, C, Twombley, K, Dwarakanath, V, Robinson, ML, Goetz, R, et al. FGF23 decreases renal NaPi-2a and NaPi-2c expression and induces hypophosphatemia in vivo predominantly via FGF receptor 1. Am J Physiol Renal Physiol. (2009) 297:F282–91. doi: 10.1152/ajprenal.90742.2008
47. Muñoz-Castañeda, JR, Herencia, C, Pendón-Ruiz de Mier, MV, Rodriguez-Ortiz, ME, Diaz-Tocados, JM, Vergara, N, et al. Differential regulation of renal klotho and FGFR1 in normal and uremic rats. FASEB J. (2017) 31:3858–67. doi: 10.1096/fj.201700006R
48. Andrukhova, O, Smorodchenko, A, Egerbacher, M, Streicher, C, Zeitz, U, Goetz, R, et al. FGF23 promotes renal calcium reabsorption through the TRPV5 channel. EMBO J. (2014) 33:229–46. doi: 10.1002/embj.201284188
49. Han, X, Yang, J, Li, L, Huang, J, King, G, and Quarles, LD. Conditional deletion of Fgfr1 in the proximal and distal tubule identifies distinct roles in phosphate and calcium transport. PLoS One. (2016) 11:e0147845. doi: 10.1371/journal.pone.0147845
50. Forster, RE, Jurutka, PW, Hsieh, J-C, Haussler, CA, Lowmiller, CL, Kaneko, I, et al. Vitamin D receptor controls expression of the anti-aging klotho gene in mouse and human renal cells. Biochem Biophys Res Commun. (2011) 414:557–62. doi: 10.1016/j.bbrc.2011.09.117
51. Ohyama, Y, Ozono, K, Uchida, M, Yoshimura, M, Shinki, T, Suda, T, et al. Functional assessment of two vitamin D-responsive elements in the rat 25-hydroxyvitamin D3 24-hydroxylase gene. J Biol Chem. (1996) 271:30381–5. doi: 10.1074/jbc.271.48.30381
Keywords: CYP27B1, dietary nitrogen and phosphate, FGFR1c, goat, vitamin D metabolism
Citation: Zillinger LS, Hustedt K, Schnepel N, Hirche F, Schmicke M, Stangl GI and Muscher-Banse AS (2024) Effects of dietary nitrogen and/or phosphorus reduction on mineral homeostasis and regulatory mechanisms in young goats. Front. Vet. Sci. 11:1375329. doi: 10.3389/fvets.2024.1375329
Edited by:
Douglas Tolleson, Texas A&M University, United StatesReviewed by:
Rayudika Aprilia Patindra Purba, Airlangga University, IndonesiaJacob Thorne, Texas A&M University, United States
Copyright © 2024 Zillinger, Hustedt, Schnepel, Hirche, Schmicke, Stangl and Muscher-Banse. This is an open-access article distributed under the terms of the Creative Commons Attribution License (CC BY). The use, distribution or reproduction in other forums is permitted, provided the original author(s) and the copyright owner(s) are credited and that the original publication in this journal is cited, in accordance with accepted academic practice. No use, distribution or reproduction is permitted which does not comply with these terms.
*Correspondence: Alexandra S. Muscher-Banse, alexandra.muscher@tiho-hannover.de