Spatiotemporal pattern and suitable areas analysis of equine influenza in global scale (2005–2022)
 Jiafeng Ding1,2,3
  Yu Wang1,2
  Jinjiao Liang1,2 Zhenhuan He4 Changhong Zhai1,2 Yinghao He1,2 Jiayin Xu1,2 Lei Lei1,2 Jing Mu1,2
  Min Zheng5
  Boyang Liu6*
  Mingxian Shi1,2*
- 1College of Animal Science and Technology, Guangxi University, Nanning, China
- 2Guangxi Key Laboratory of Animal Breeding, Disease Control and Prevention, Guangxi University, Nanning, China
- 3Nanning New Technology Entrepreneur Center, Nanning, China
- 4Shenyang Zhengda Animal Husbandry Co., Ltd., Shenyang, China
- 5Guangxi Center for Animal Disease Control and Prevention, Nanning, China
- 6College of Wildlife and Protected Area, Northeast Forestry University, Harbin, China
Equine influenza (EI) is a severe infectious disease that causes huge economic losses to the horse industry. Spatial epidemiology technology can explore the spatiotemporal distribution characteristics and occurrence risks of infectious diseases, it has played an important role in the prevention and control of major infectious diseases in humans and animals. For the first time, this study conducted a systematic analysis of the spatiotemporal distribution of EI using SaTScan software and investigated the important environmental variables and suitable areas for EI occurrence using the Maxent model. A total of 517 occurrences of EI from 2005 to 2022 were evaluated, and 14 significant spatiotemporal clusters were identified. Furthermore, a Maxent model was successfully established with high prediction accuracy (AUC = 0.920 ± 0.008). The results indicated that annual average ultraviolet radiation, horse density, and precipitation of the coldest quarter were the three most important environmental variables affecting EI occurrence. The suitable areas for EI occurrence are widely distributed across all continents, especially in Asia (India, Mongolia, and China) and the Americas (Brazil, Uruguay, USA, and Mexico). In the future, these suitable areas will expand and move eastward. The largest expansion is predicted under SSP126 scenarios, while the opposite trend will be observed under SSP585 scenarios. This study presents the spatial epidemiological characteristics of EI for the first time. The results could provide valuable scientific insights that can effectively inform prevention and control strategies in regions at risk of EI worldwide.
1 Introduction
Equine influenza (EI) is a highly contagious respiratory disease caused by the equine influenza virus (EIV) (1). This disease can cause significant economic losses to the global equine industry (2). Clinical symptoms of EI include fever, dry cough, and runny nose (3). EI is primarily transmitted through aerosols from infected horses and can spread quickly within a group of horses and to other susceptible animals nearby (4). EIV is classified into two subtypes, H7N7 and H3N8 (5). The H3N8 subtype is currently the predominant epidemic type worldwide, including both European and American lineages (6). The American lineages are further categorized into South American, Kentucky, and Florida lineages, with the Florida lineages having two additional branches. Florida Clade 1 is primarily found in the Americas and Europe, whereas Florida Clade 2 is primarily found in Europe, Asia, and Africa. Vaccination is currently considered the primary means of preventing EI, but it actually has not achieved the desired expectation (7).
Space epidemiology is an effective tool to study the risk and influencing factors of infectious disease transmission (8). The use of spatiotemporal analysis and niche models (ENMs) has focused on establishing prevention strategies for infectious diseases. Spatiotemporal analysis is a technique used to study the spatiotemporal distribution characteristics of infectious diseases, which can accurately predict the spatiotemporal distribution (clusters) of human and animal infectious diseases (9). Wong et al. conducted a study using spatiotemporal cluster analysis to investigate the geographical variation of syphilis epidemiology and predict possible outbreaks in south China (10). Their results suggest that spatiotemporal cluster analysis could be used to focus provincial syphilis control programs. Gao et al. successfully utilized spatiotemporal cluster analysis to identify the spatial distribution and risk areas of foot and mouth disease (FMD) in mainland China, providing valuable insights for decision-makers to tailor a risk-based surveillance of FMD in China (11). It is worth noting that, to date, no literature has explored the spatiotemporal distribution characteristics of EI using spatiotemporal cluster analysis.
ENMs link environmental variables to disease occurrence, elucidate the environmental conditions required for the survival and spread of infectious disease pathogens, identify environmental similarities between the study area and known areas of pathogen distribution, and understand the ecological characteristics and geographic distribution of pathogens (12). The Maxent model is a widely used ENMs that accurately predicts suitable areas with limited generation data, demonstrating excellent performance (13). Ren et al. used Maxent models to successfully identify potential risk areas for coronavirus disease 2019 in its early stages (14). Their findings were instrumental in implementing targeted prevention and control strategies. Similarly, Choi et al. utilized the Maxent model to accurately predict suitable areas for African swine fever (ASF) outbreaks in wild boars in South Korea (15). Their findings established preemptive measures to prevent ASF in pig farming sectors at risk of ASF spillover from wild boars. To date, no literature has analyzed the environmental variables and suitable areas for EI occurrence via Maxent model.
EI has become widespread worldwide in recent years, and existing studies have proven that environmental variables such as temperature and humidity have an important impact on the occurrence and spread of EI (16). Bioclimatic variables can faithfully reflect monthly temperature and precipitation values, and have been widely used in the prediction of various infectious diseases (17). In this study, the current and future bioclimatic variables were selected and combined with EI occurrence data, and the Maxent model was constructed to analyze the relationship between EI occurrence and climate change.
This study aims to apply spatiotemporal cluster analysis and the Maxent model to not only map the distribution of EI but also identify key environmental drivers and predict future outbreaks. The results could provide valuable scientific insights that can inform prevention and control strategies in regions at risk of EI worldwide.
2 Materials and methods
2.1 Data collection and processing
A comprehensive dataset of 696 global occurrence of the H3N8 subtype of EI between January 1, 2005, and December 31, 2022, was carefully collected from the Global Animal Disease Information System of the Food and Agriculture Organization of the United Nations (FAO, https://empres-i.apps.fao.org). The dataset includes the precise latitude and longitude coordinates of the occurrence, the occurrence time, and the number of affected animals. To ensure the accuracy of the Maxent model, the occurrence data were purified with ENMTools to remove the influence of spatial autocorrelation (18). Finally, the Maxent model was trained using 517 global occurrence data points of EI, as shown in Figure 1.
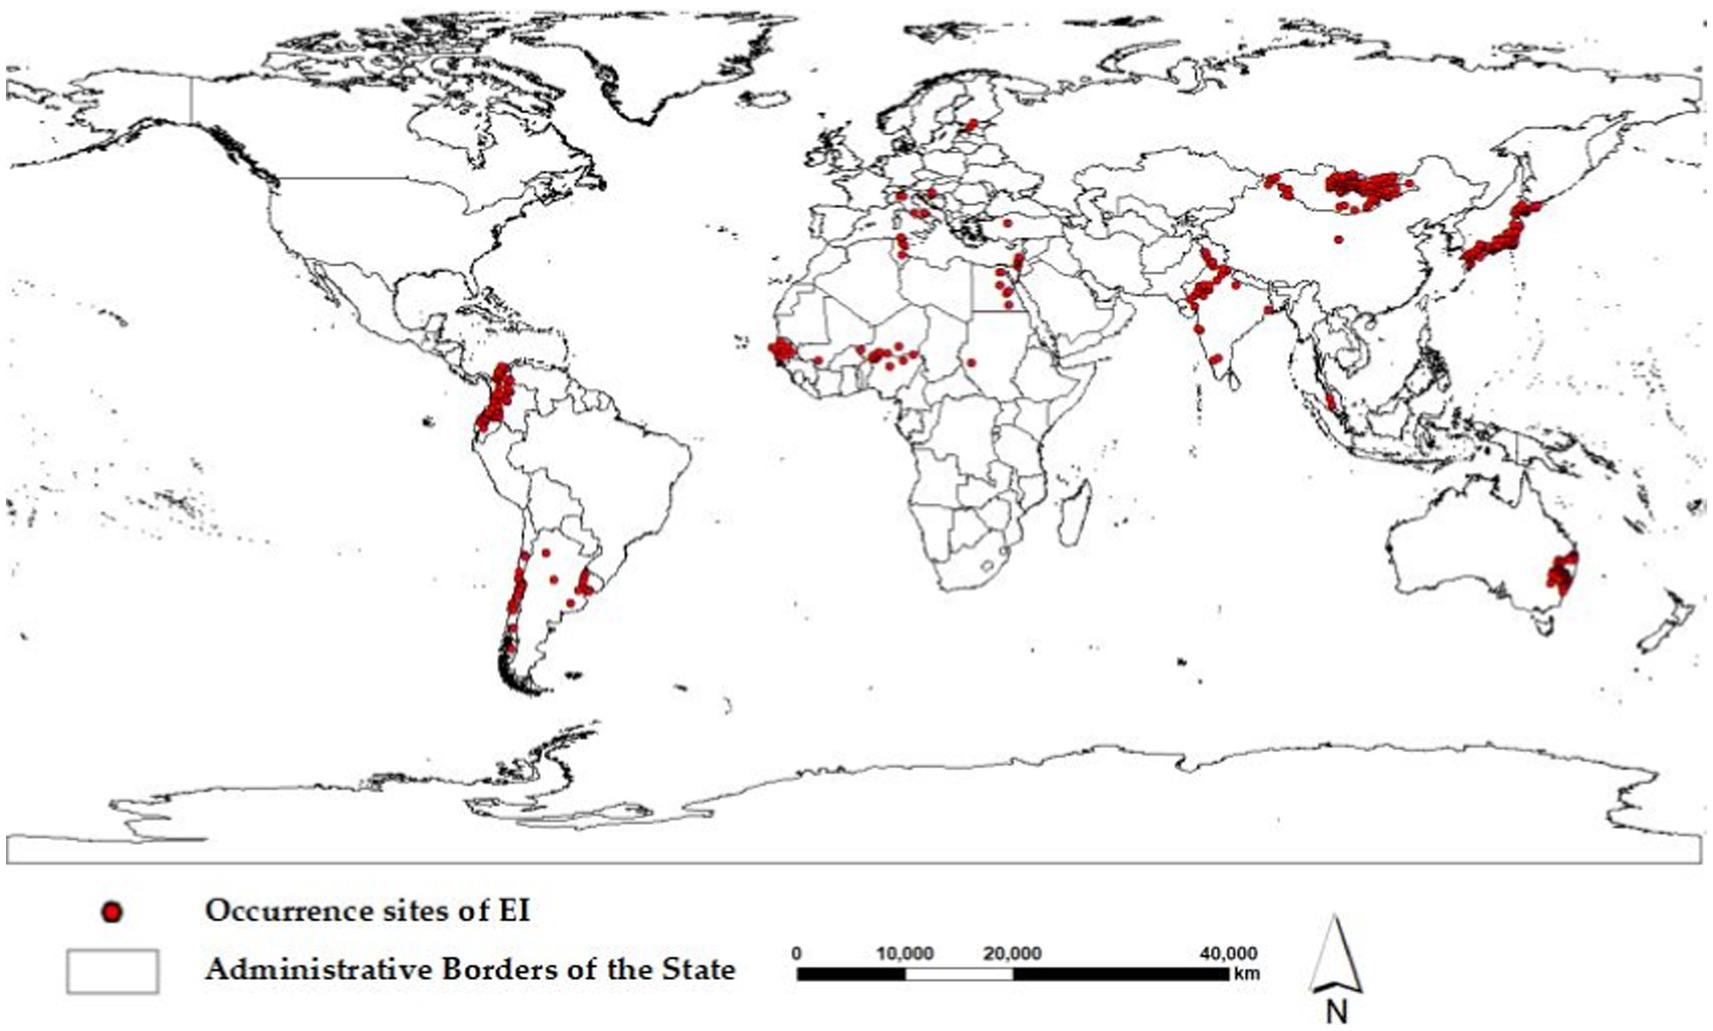
Figure 1. The 517 global occurrence sites of equine influenza (EI) from 2005 to 2022.
Twenty-one environmental variables were considered to build the Maxent model for EI, including 19 bioclimatic variables (bio_1–19), as well as 2 related variables, including annual average ultraviolet radiation (uvb1) and horse density (hd). The 19 bioclimatic variables, representing global climate conditions from 1970 to 2000, were obtained from the widely-used Worldclim 2.0 database1 (19). The uvb1 data were downloaded from the website of the Helmholtz Center for Environmental Research.2 Data for hd were obtained from the Global Livestock Distribution Database on the FAO website.3 The Maxent model used the twenty-one environmental variables listed in Table 1.
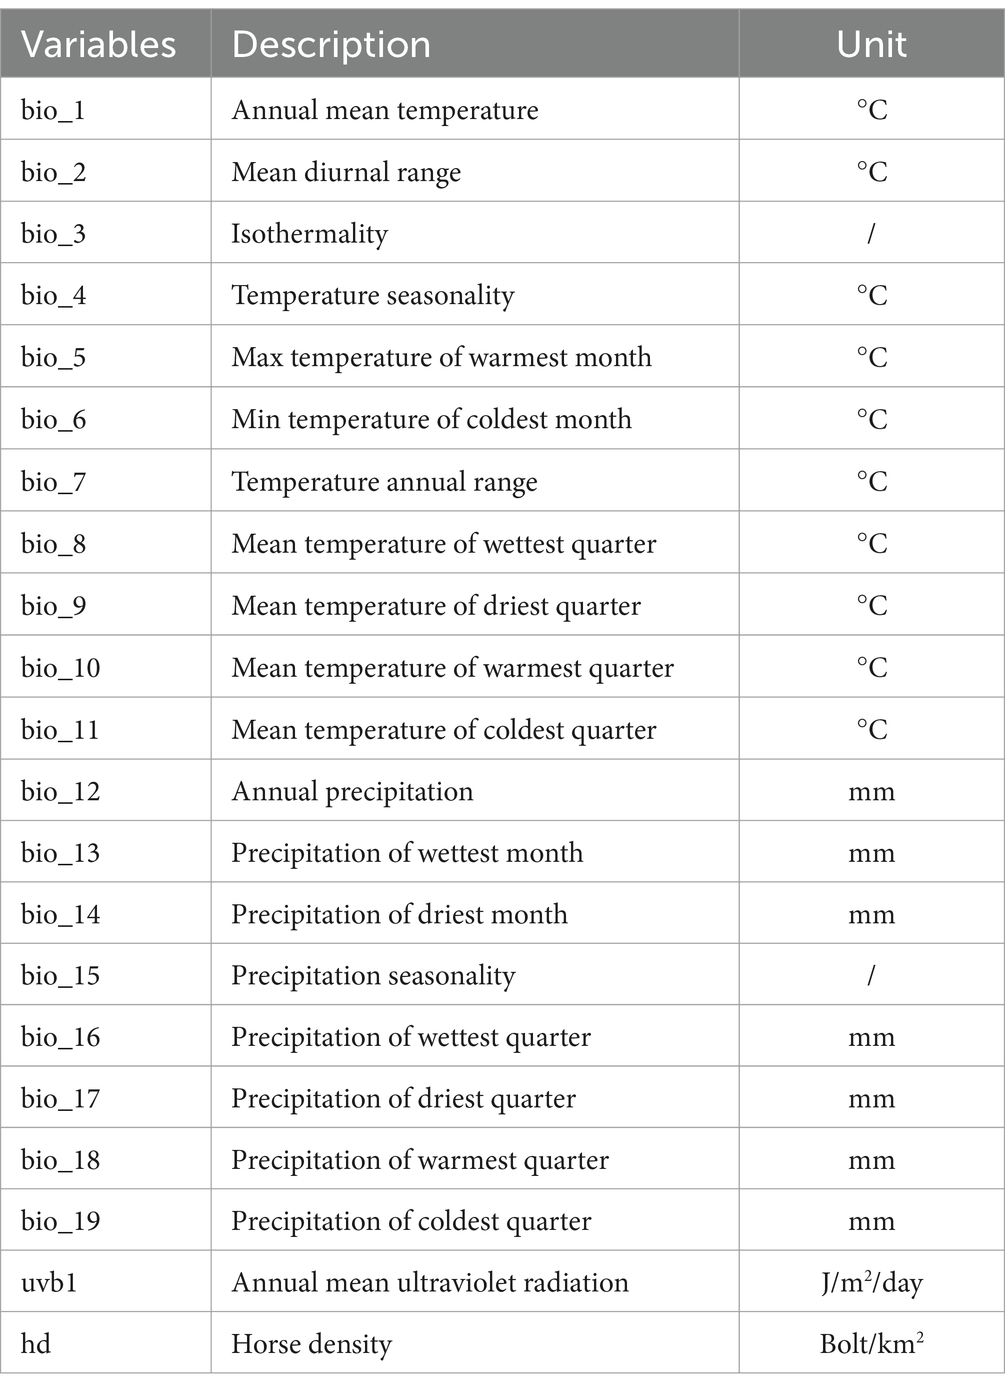
Table 1. The twenty-one environmental variables used in the Maxent model.
The data for future climate scenarios was obtained from the Worldclim 2.0 database using the sixth coupled model (BCC-CSM2-MR) of the Coupled Model Intercomparison Project (CMIP6), compared with the CMIP5 model, the CMIP6 model improves the simulation ability of the current regional temperature and precipitation in China, and the precipitation index is significantly improved (20). This model simulates the response of global climate to increased greenhouse gas. The Shared Socio-economic Pathways (SSP) consider a range of factors that affect future greenhouse gas emissions, including economic factors, population, economic growth, urbanization, and other socio-economic factors (21). This pathway provides a comprehensive view of future climate change from a long-term perspective within a predetermined scenario. For years 2050 (2041–2060 average) and years 2070 (2061–2080 average), three widely-used socioeconomic pathways were selected: SSP126 (represents the lowest emissions scenario, which is a sustainability-focused pathway), SSP245 (represents a medium emissions scenario and is a pathway where the trend largely follows its historical pattern), and SSP585 (represents the highest emissions scenario, which is a pathway dominated by traditional fossil fuels). We resolved the current and future environmental variables at a 2.5 arcminute resolution, corresponding to 21.6 square kilometers per grid.
2.2 Spatiotemporal cluster analysis
Spatiotemporal cluster analysis was conducted using SaTScan version 10.1 to explore the distribution characteristics of EI occurrence. In SaTScan, the spatiotemporal rearrangement scanning statistics model was selected to identify potential spatiotemporal clusters by forming a dynamic scanning window of occurrence data, which includes the number and location of onset cases, the spatiotemporal scanning statistical model can better detect the spatiotemporal aggregation patterns of infectious diseases (9). The clustering of scanning windows was evaluated using the generalized likelihood ratio (GLR). The study set a maximum spatial cluster size of 1,000 km and a maximum temporal cluster size of 20%. The p value was calculated using Monte Carlo random sampling to generate the simulation dataset (22). Any spatiotemporal cluster with a p value <0.05 was considered statistically significant. SaTScan analyzed the dataset of significant spatiotemporal clusters, which were then visualized using ArcGIS software version 10.2.
2.3 Maxent modeling
To predict the global suitable areas for EI occurrence, a Maxent model was built, using Maxent software version 3.4.1. To ensure the model’s accuracy, ENMTools was employed to test the correlation of bioclimatic variables (23). The visualization matrix of correlation coefficients for the twenty-one environmental variables was shown in Figure 2. The figure displays stronger correlations with darker red and darker blue. A correlation was considered strong when the correlation coefficient between each pair of variables |r| > 0.7 (24). Strong correlations between variables can lead to overfitting, which can affect modeling results. Therefore, the contribution rate of each variable was determined using Maxent software, and eliminate the variable with a smaller contribution rate among the relevant variables. The final model includes eight variables: bio_2, bio_3, bio_5, bio_13, bio_15, bio_19, hd, and uvb1. Eight environmental variables and the data of 517 occurrence were imported into the Maxent model. In the Maxent software, set Random Test Percentage to 25, which means that 25% of the data will be randomly selected as a test set to test the model. Set Replicates to 10, which means the model was run 10 times and the average was used as the final result. Regularization Multiplier was set to 1, and Replicate Run Type was subsampled (the formula was substituted into the model for operation, and the mode with the best final result was selected). The maximum number of background points was set to 10,000, and other settings were left as default.
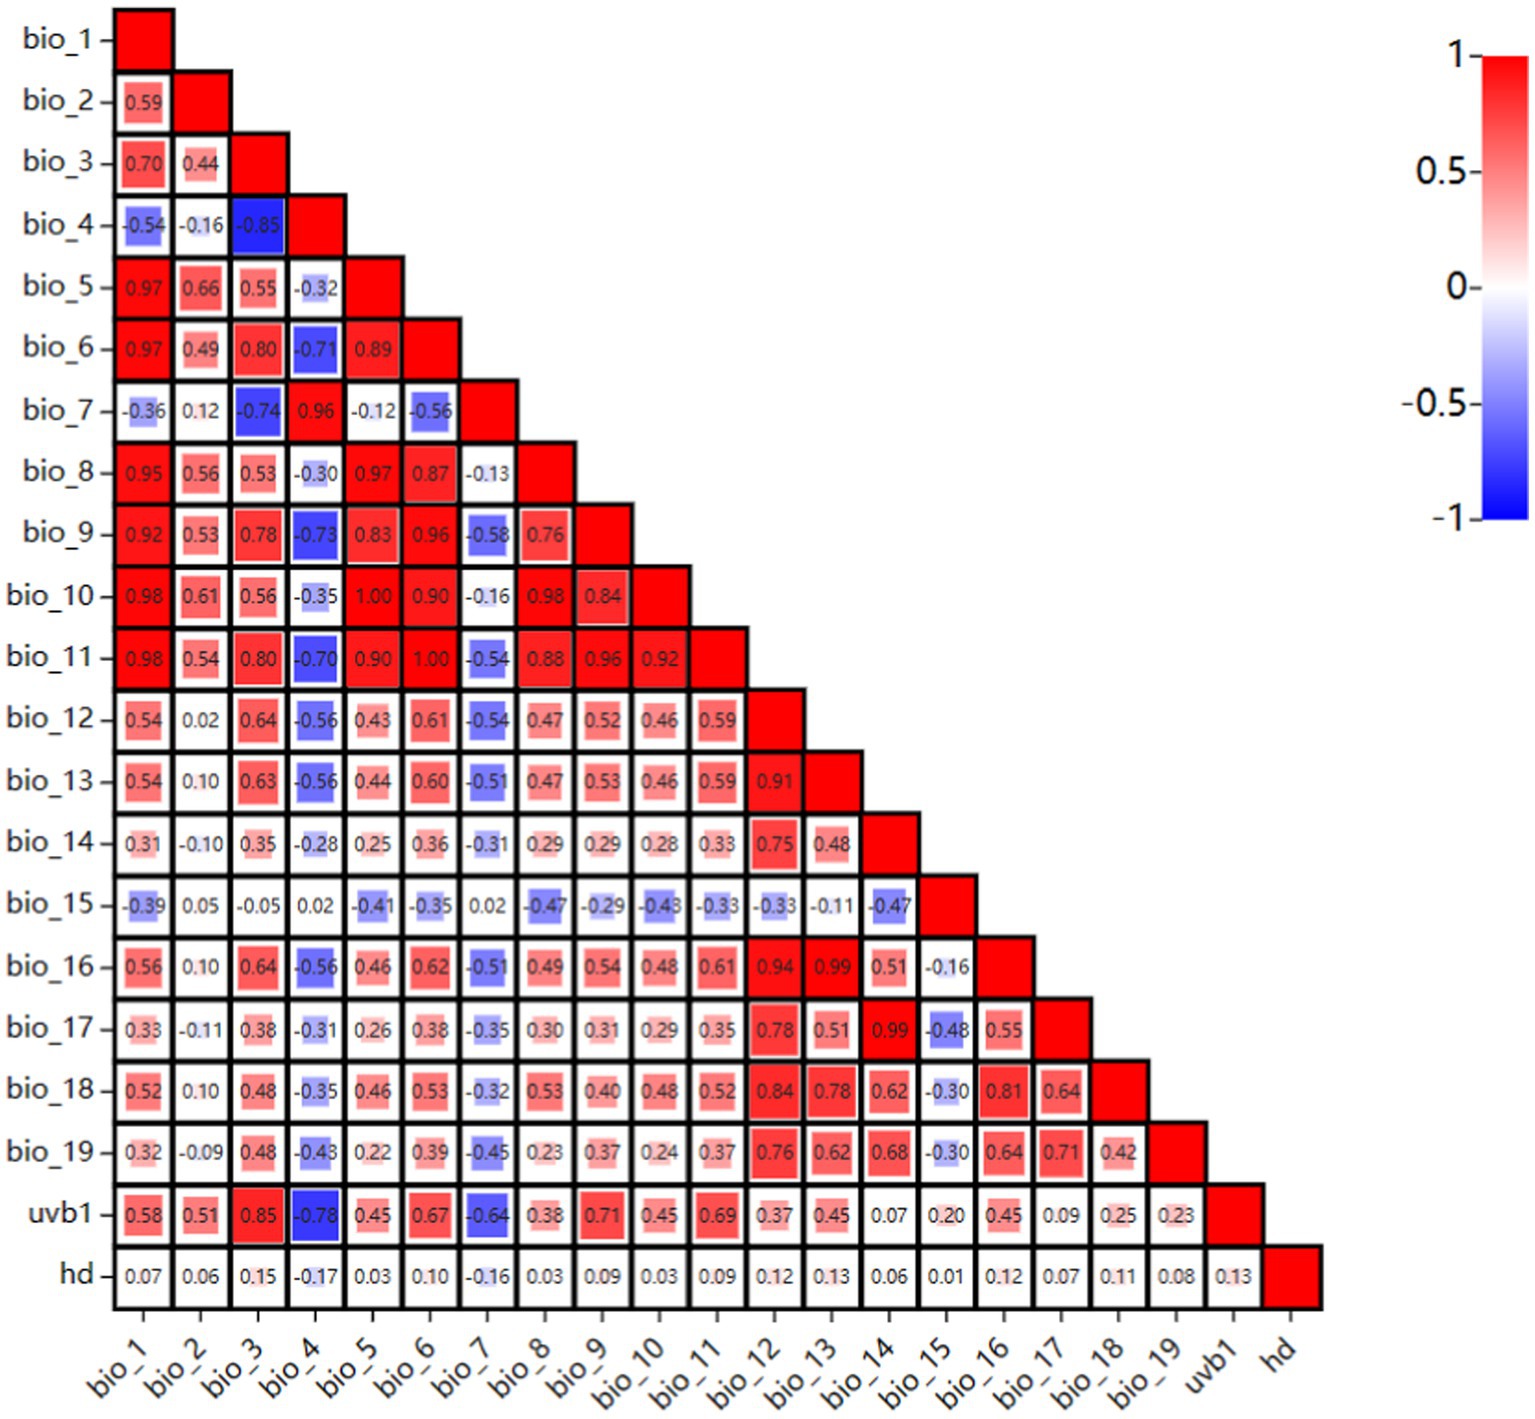
Figure 2. The visualization matrix of correlation coefficients for the twenty-one environmental variables.
The Maxent model’s performance was evaluated by calculating the area under the curve (AUC) of the ROC curve (25). A higher AUC value indicates better predictive performance, with the prediction considered failed (0.5–0.6), poor (0.6–0.7), fair (0.7–0.8), good (0.8–0.9), or excellent (0.9–1). The corresponding response curve was used to determine the impact of these variables on the suitable areas of EI occurrence (26). Moreover, the importance of the eight environmental variables in the Maxent model was evaluated, respectively, using the jackknife test (27). The probability of occurrence in suitable areas ranges from 0 to 1, with a higher value indicating a greater probability. Based on the obtained results, the suitable areas can be further divided into four levels using maximum test sensitivity plus specificity (MTSPS): unsuitable (0–MTSPS), lowly suitable (MTSPS–0.5), mediumly suitable (0.5–0.6), and highly suitable (0.6–1) (28). The sizes and locations of suitable areas for the current and future scenarios were compared using ArcGIS version 10.2. Centroid position shifts of the suitable areas were also calculated.
3 Results
3.1 Spatiotemporal cluster analysis
Fourteen significant (p < 0.05) spatiotemporal clusters of EI occurrence were identified, along with their location coordinates, country names, radii, times, GLRs, and p values, as shown in Table 2. The central countries of the fourteen spatiotemporal clusters were located in Senegal, Mongolia, India, China, Colombia, Japan, Nigeria, Australia, Chile, Tunisia, Egypt, Israel, Croatia, and Malaysia, respectively. The global locations of the fourteen spatiotemporal clusters of EI occurrence were shown in Figure 3.
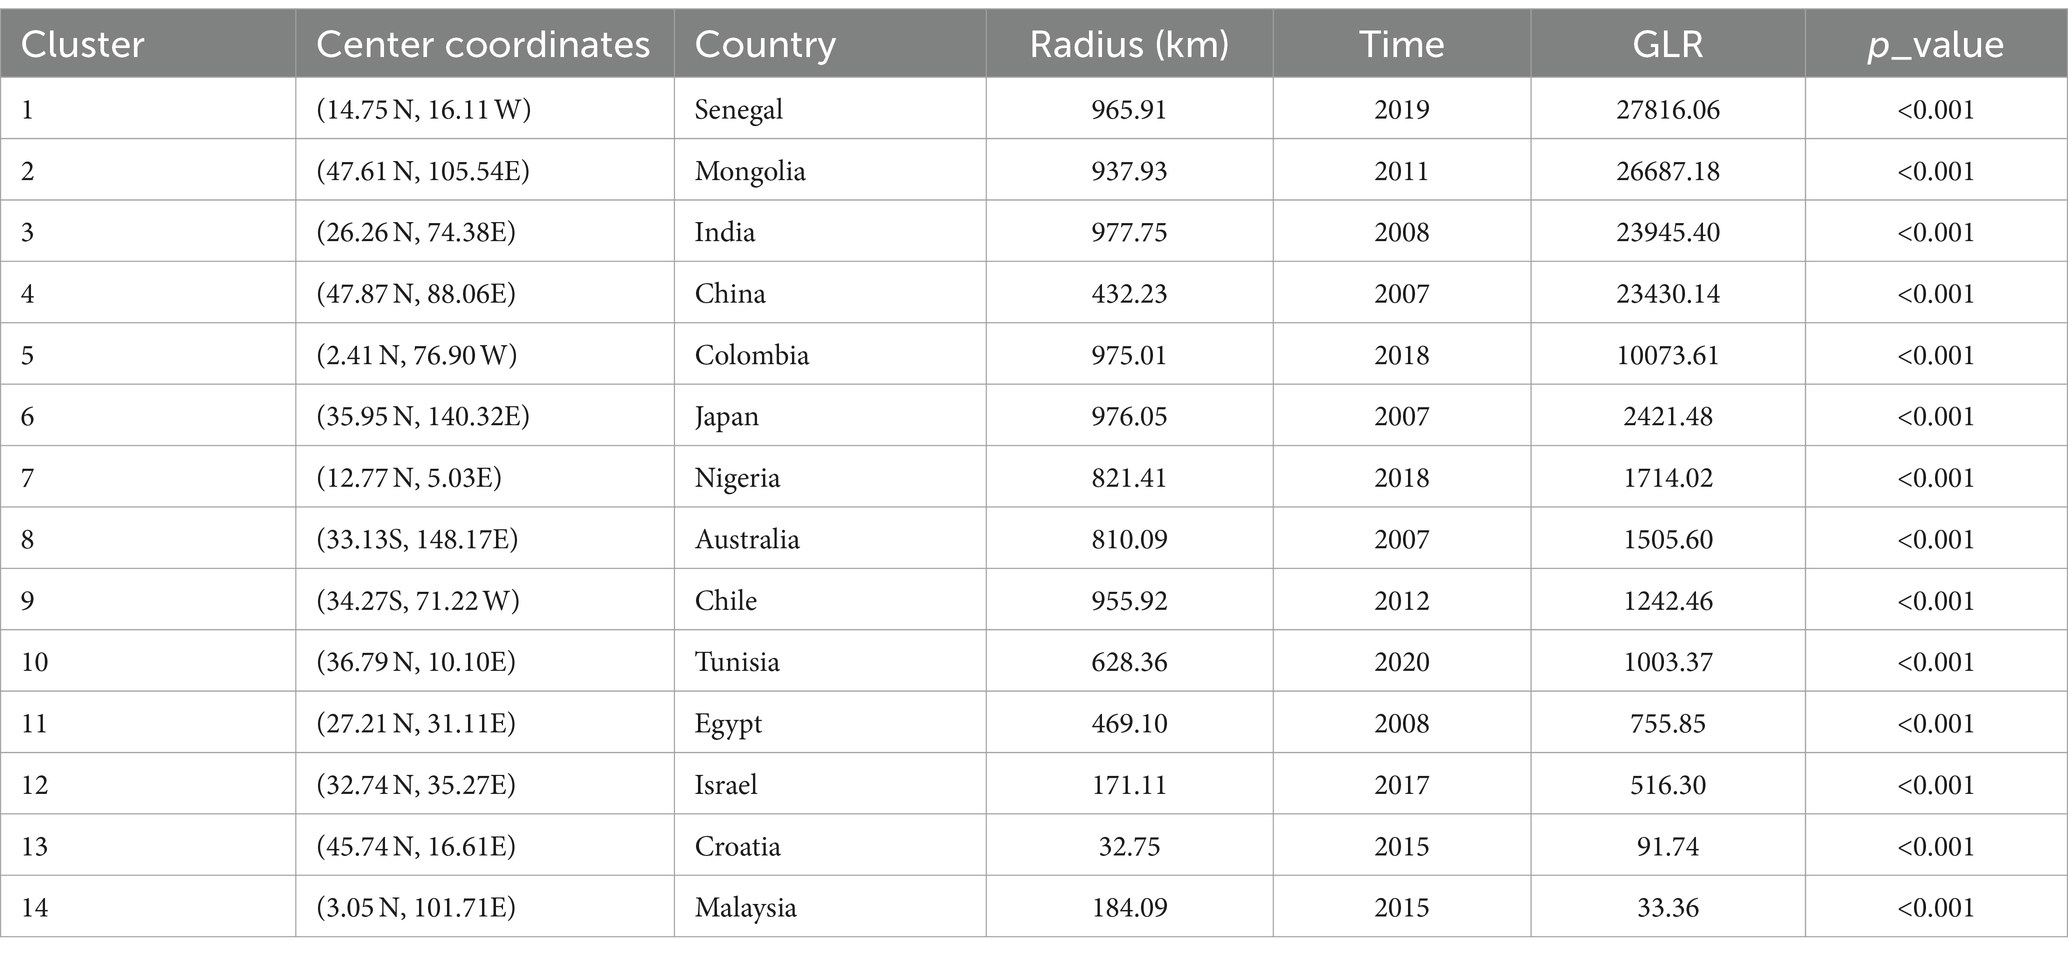
Table 2. Fourteen global spatiotemporal clusters of EI occurrence from the year 2005 to 2022.
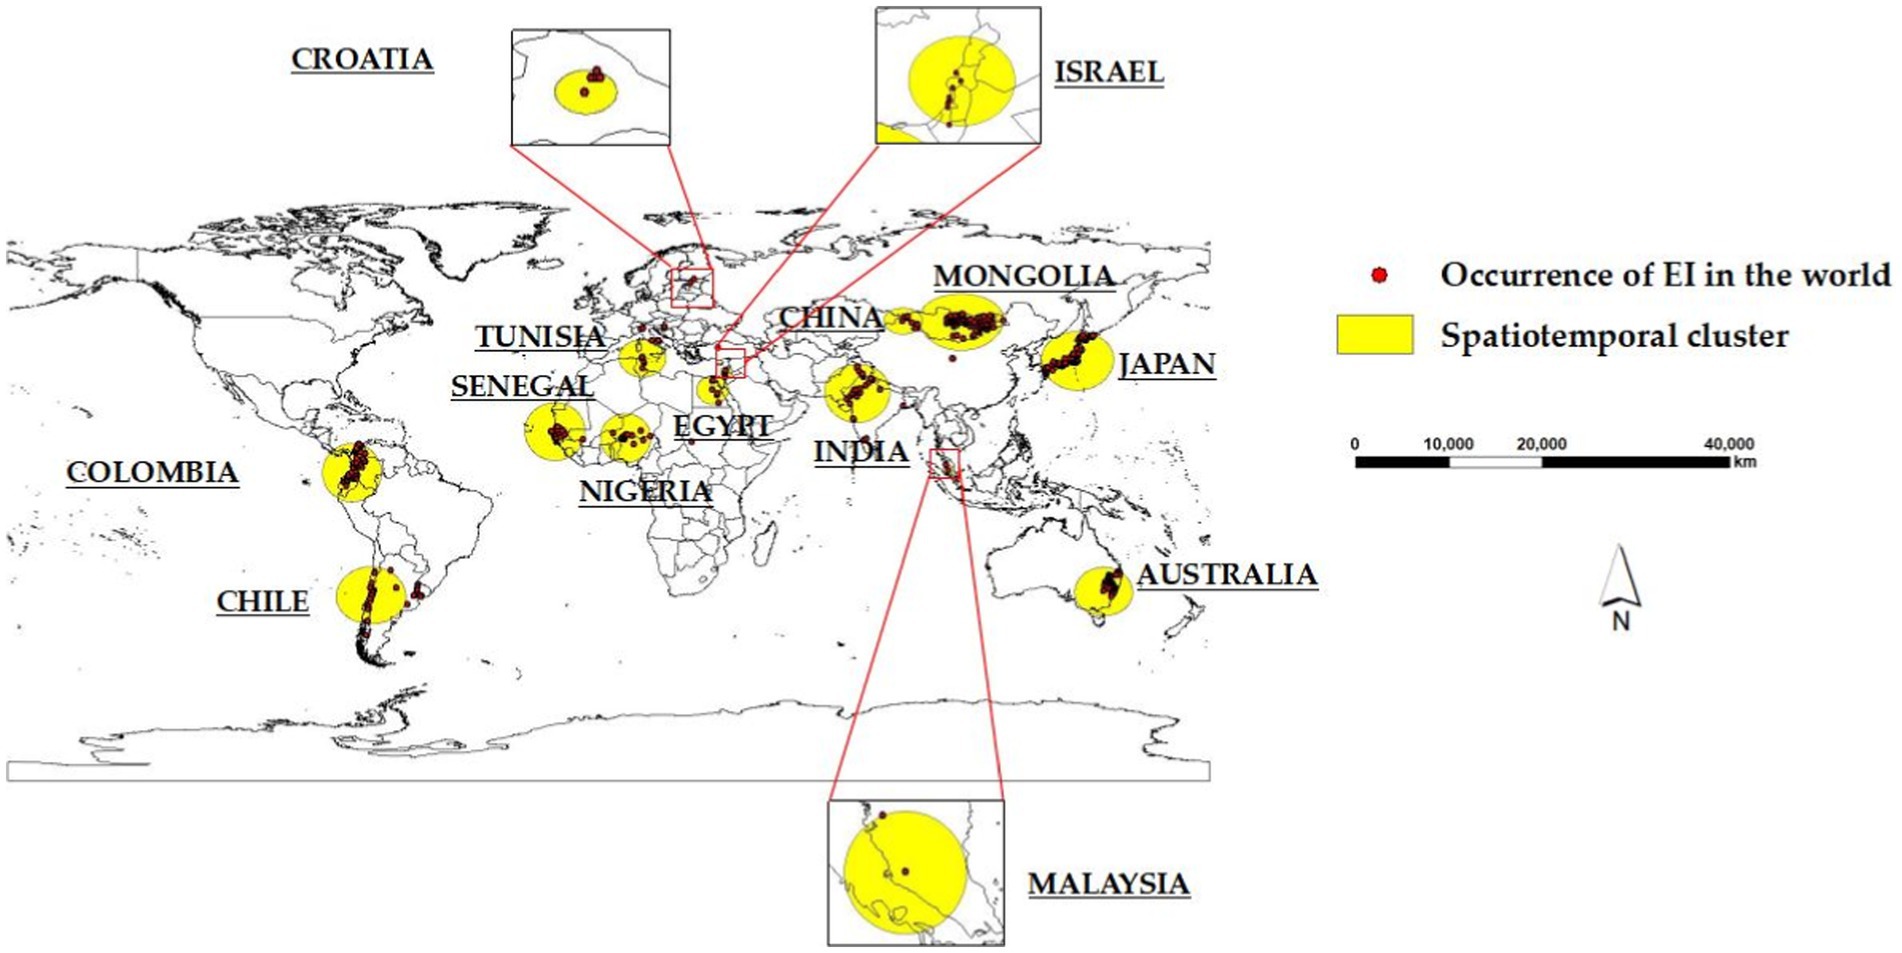
Figure 3. Global locations of the fourteen spatiotemporal clusters of EI occurrence.
3.2 Maxent modeling
The Maxent model achieved an AUC value of 0.920 ± 0.008 for EI occurrence (Figure 4A). The environmental variables with the highest contribution rates to EI occurrence were uvb1 (32%), hd (28.2%), and bio_19 (14.5%). These three variables had a cumulative contribution rate of 74.7%. According to the response curves, the probability of EI occurrence was highest at approximately 2000 J/m2/day of uvb1 (Figure 4B). Moreover, as the range of hd increased from 0–800 bolt/km2, the probability of EI occurrence also increased until it reached 800 bolt/km2, beyond which it remained stable (Figure 4C). Additionally, the highest probability of EI occurrence was observed when bio_19 reached 150 mm (Figure 4D).
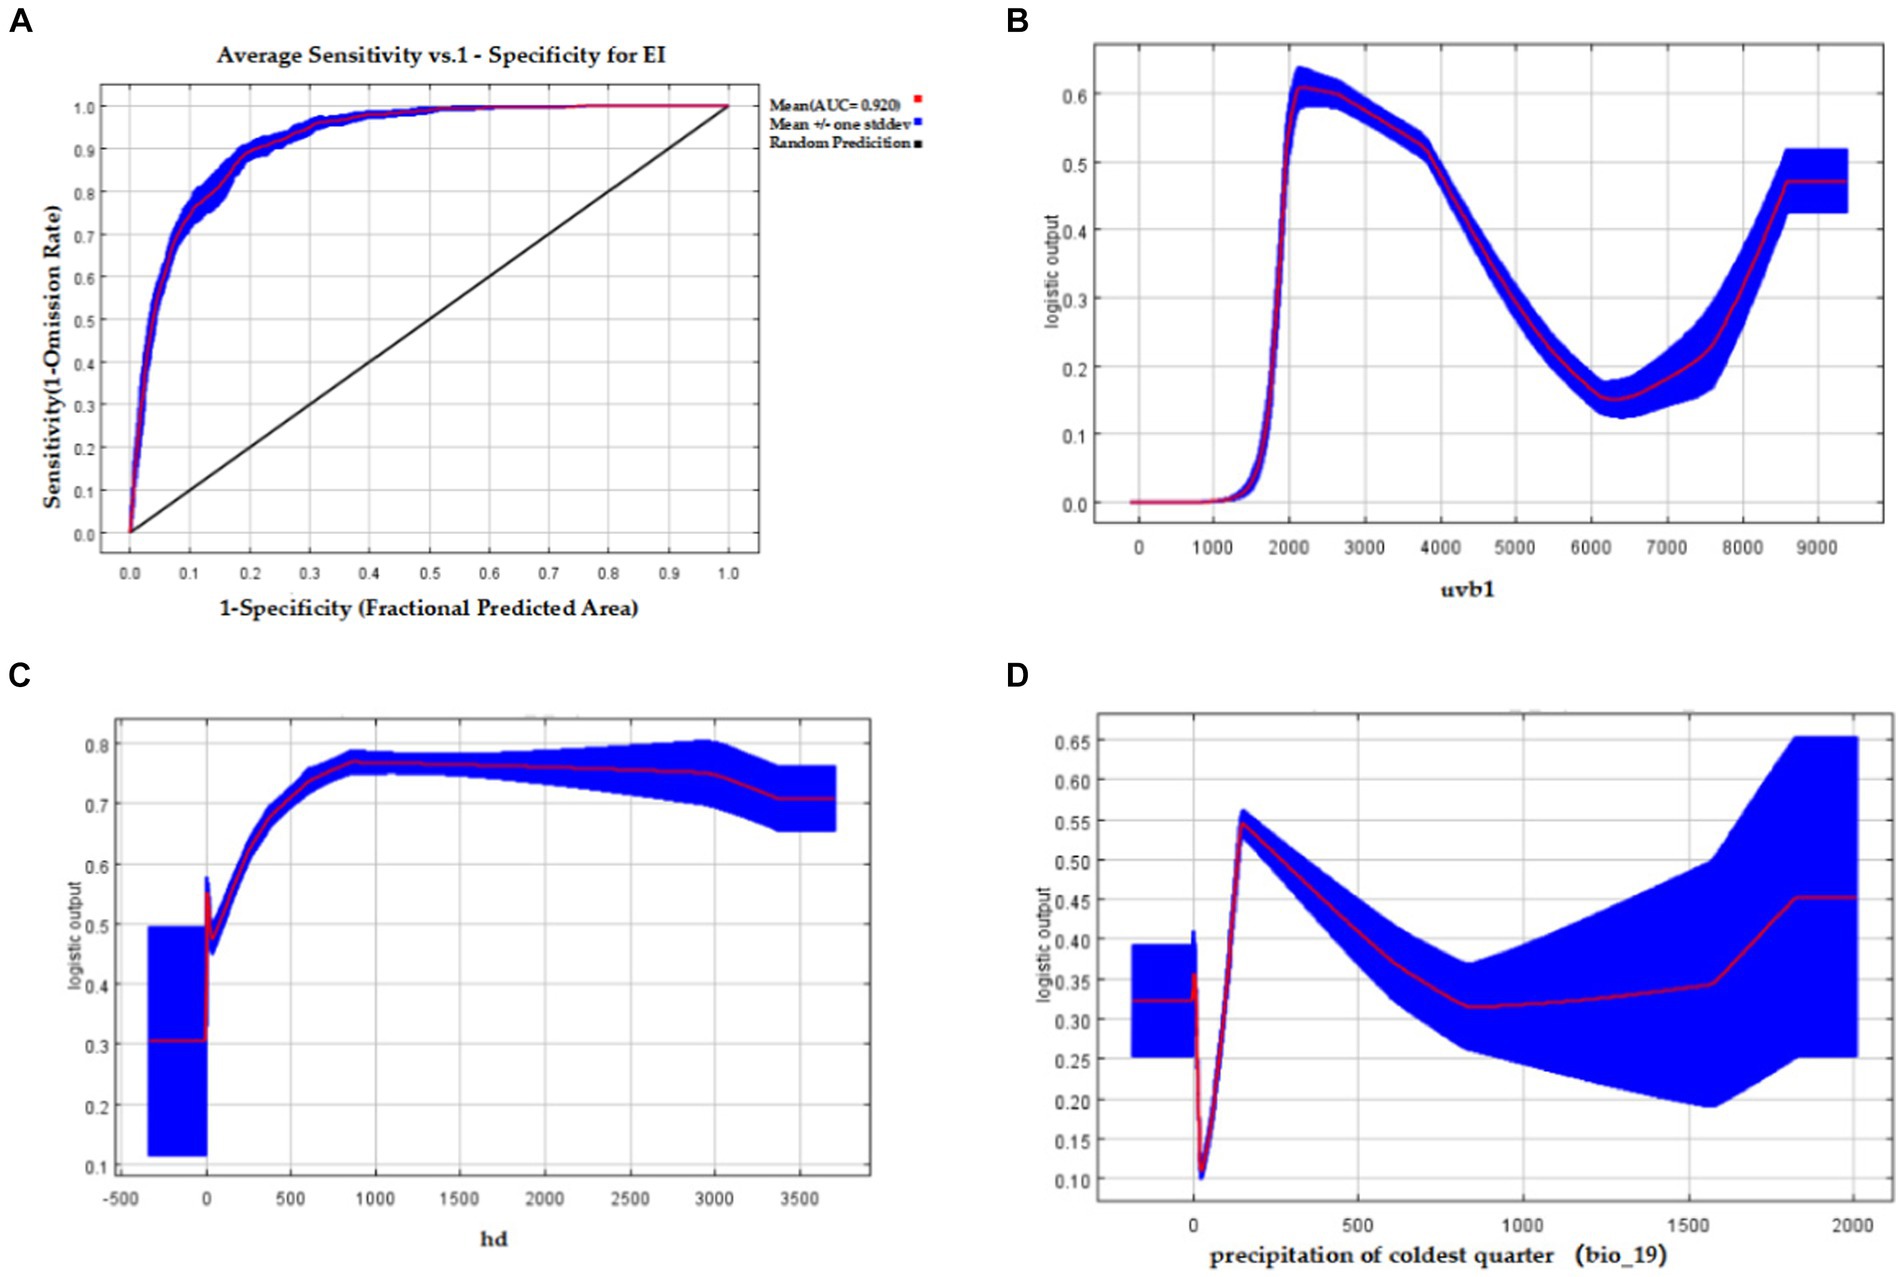
Figure 4. The AUC of the Maxent model for EI occurrence and response curves of three important environmental variables affecting EI occurrence. (A) The AUC value of the Maxent model of EI occurrence; (B) Response curve of annual average ultraviolet radiation (uvb1) affecting EI occurrence; (C) Response curve of horse density (hd) affecting EI occurrence; (D) Response curve of precipitation of coldest quarter (bio_19) affecting EI occurrence.
The importance analysis of eight environmental variables for EI occurrence in the Maxent model by the Jackknife test was shown in Figure 5. The model’s performance is represented by the red stripe when all variables are used, the dark blue stripe when only one variable is used, and the light blue stripe when only one variable is removed. The results showed that the use of solely environmental variables led to the highest gain for uvb1, followed by hd and bio_19. When only one variable was removed, uvb1 had the greatest impact, followed by hd and precipitation seasonality (bio_15), as shown in Figure 5.
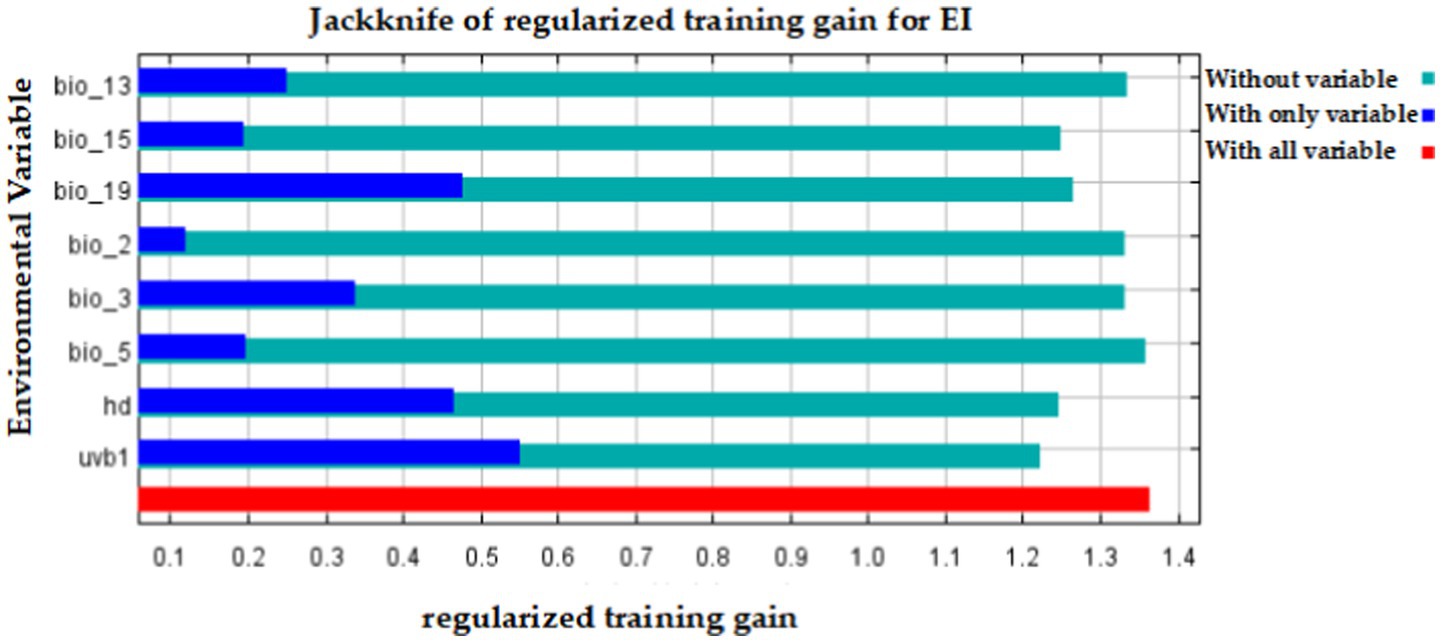
Figure 5. The importance analysis of eight environmental variables for EI occurrence in the Maxent model by the Jackknife test.
The model yields the MTSPS value of 0.4, the division of the suitable areas of EI occurrence: unsuitable (0–0.4), lowly suitable (0.4–0.5), mediumly suitable (0.5–0.6), and highly suitable (0.6–1). The global suitable areas of EI occurrence under the current and future climate scenarios of SSP126, SSP245, and SSP585 pathways for years 2050 and 2070 are shown in Figures 6, 7, respectively. Figure 6 shows that the suitable areas were globally distributed, with significant concentrations in Asia (India, Mongolia, and China), Europe (Czech Republic), Africa (Sudan), South America (Brazil and Uruguay), and North America (USA and Mexico) under the current climate scenario. In Figure 7, the suitable areas will show an overall expansion trend, particularly in Asia and the Americas, under the future climate scenarios. Additionally, changes in global suitable areas of EI occurrence under three future climate scenarios for the years 2050 and 2070 were shown in Figure 8 and Table 3. Notably, by 2050, the suitable areas will obviously expand, with the area of the SSP126 scenario increasing by nearly 145.42 × 10⁵ km2. By 2070, the expansion of suitable areas will no longer be obvious, with SSP585 scenario’s area even shrinking by 59.67 × 10⁵ km2.
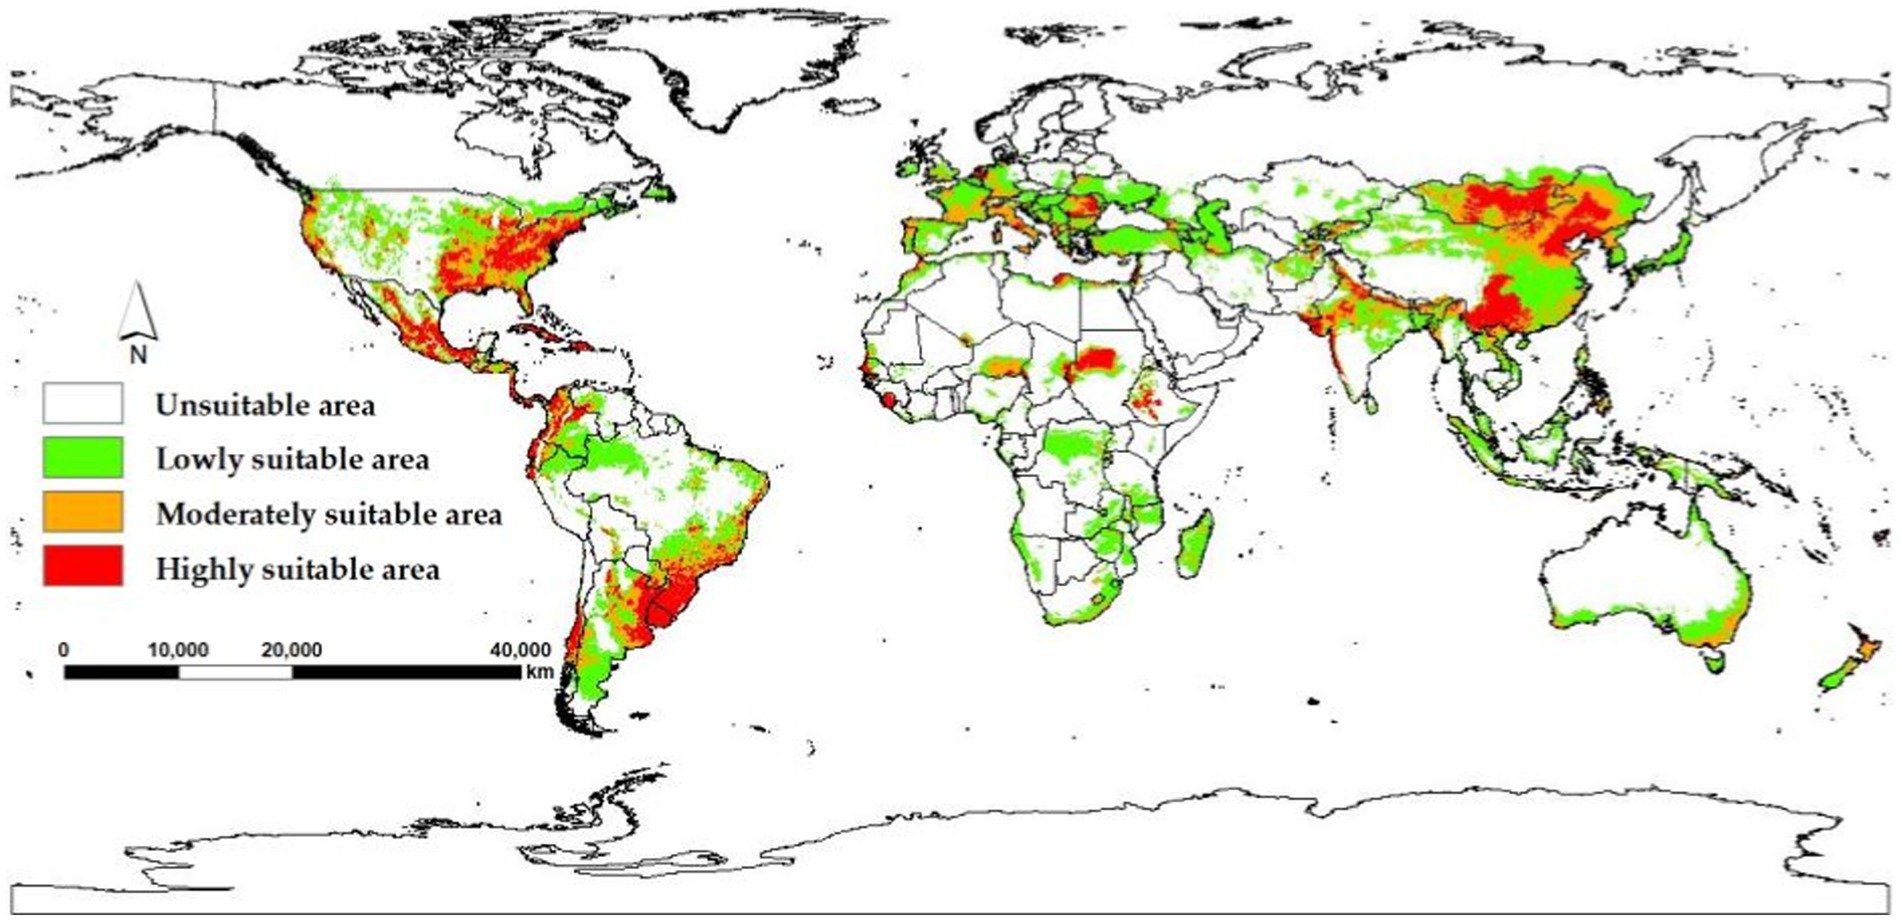
Figure 6. Global suitable areas of EI occurrence under the current climate scenario.
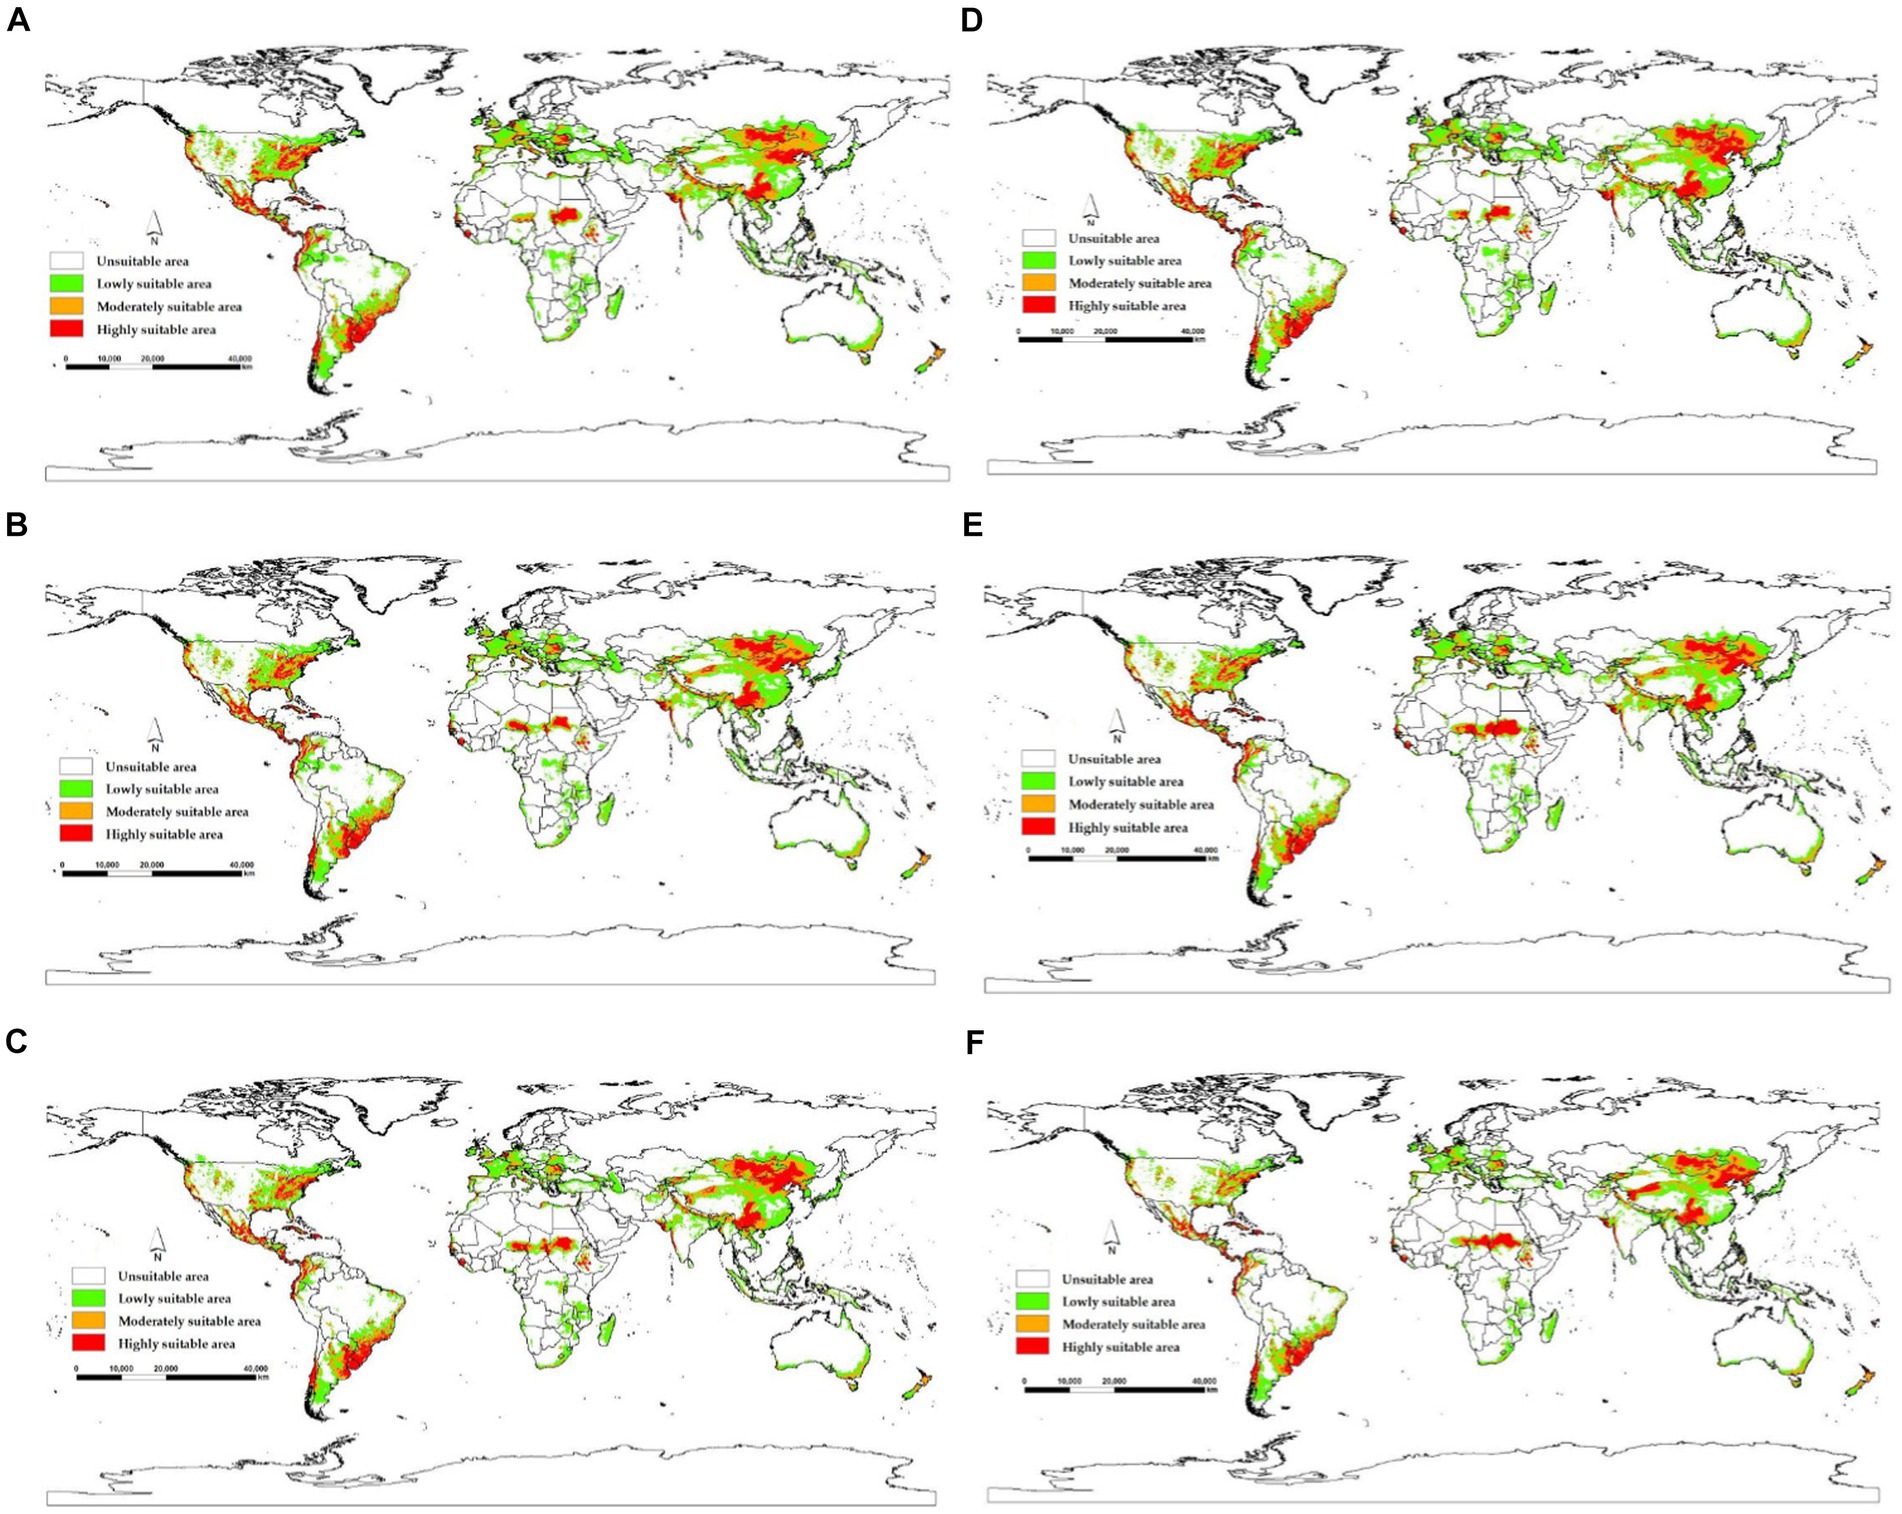
Figure 7. Global suitable areas of EI occurrence under three future climate scenarios for the years 2050 and 2070. (A) 2050SSP126, (B) 2050SSP245, (C) 2050SSP585, (D) 2070SSP126, (E) 2070SSP245, (F) 2070SSP585.
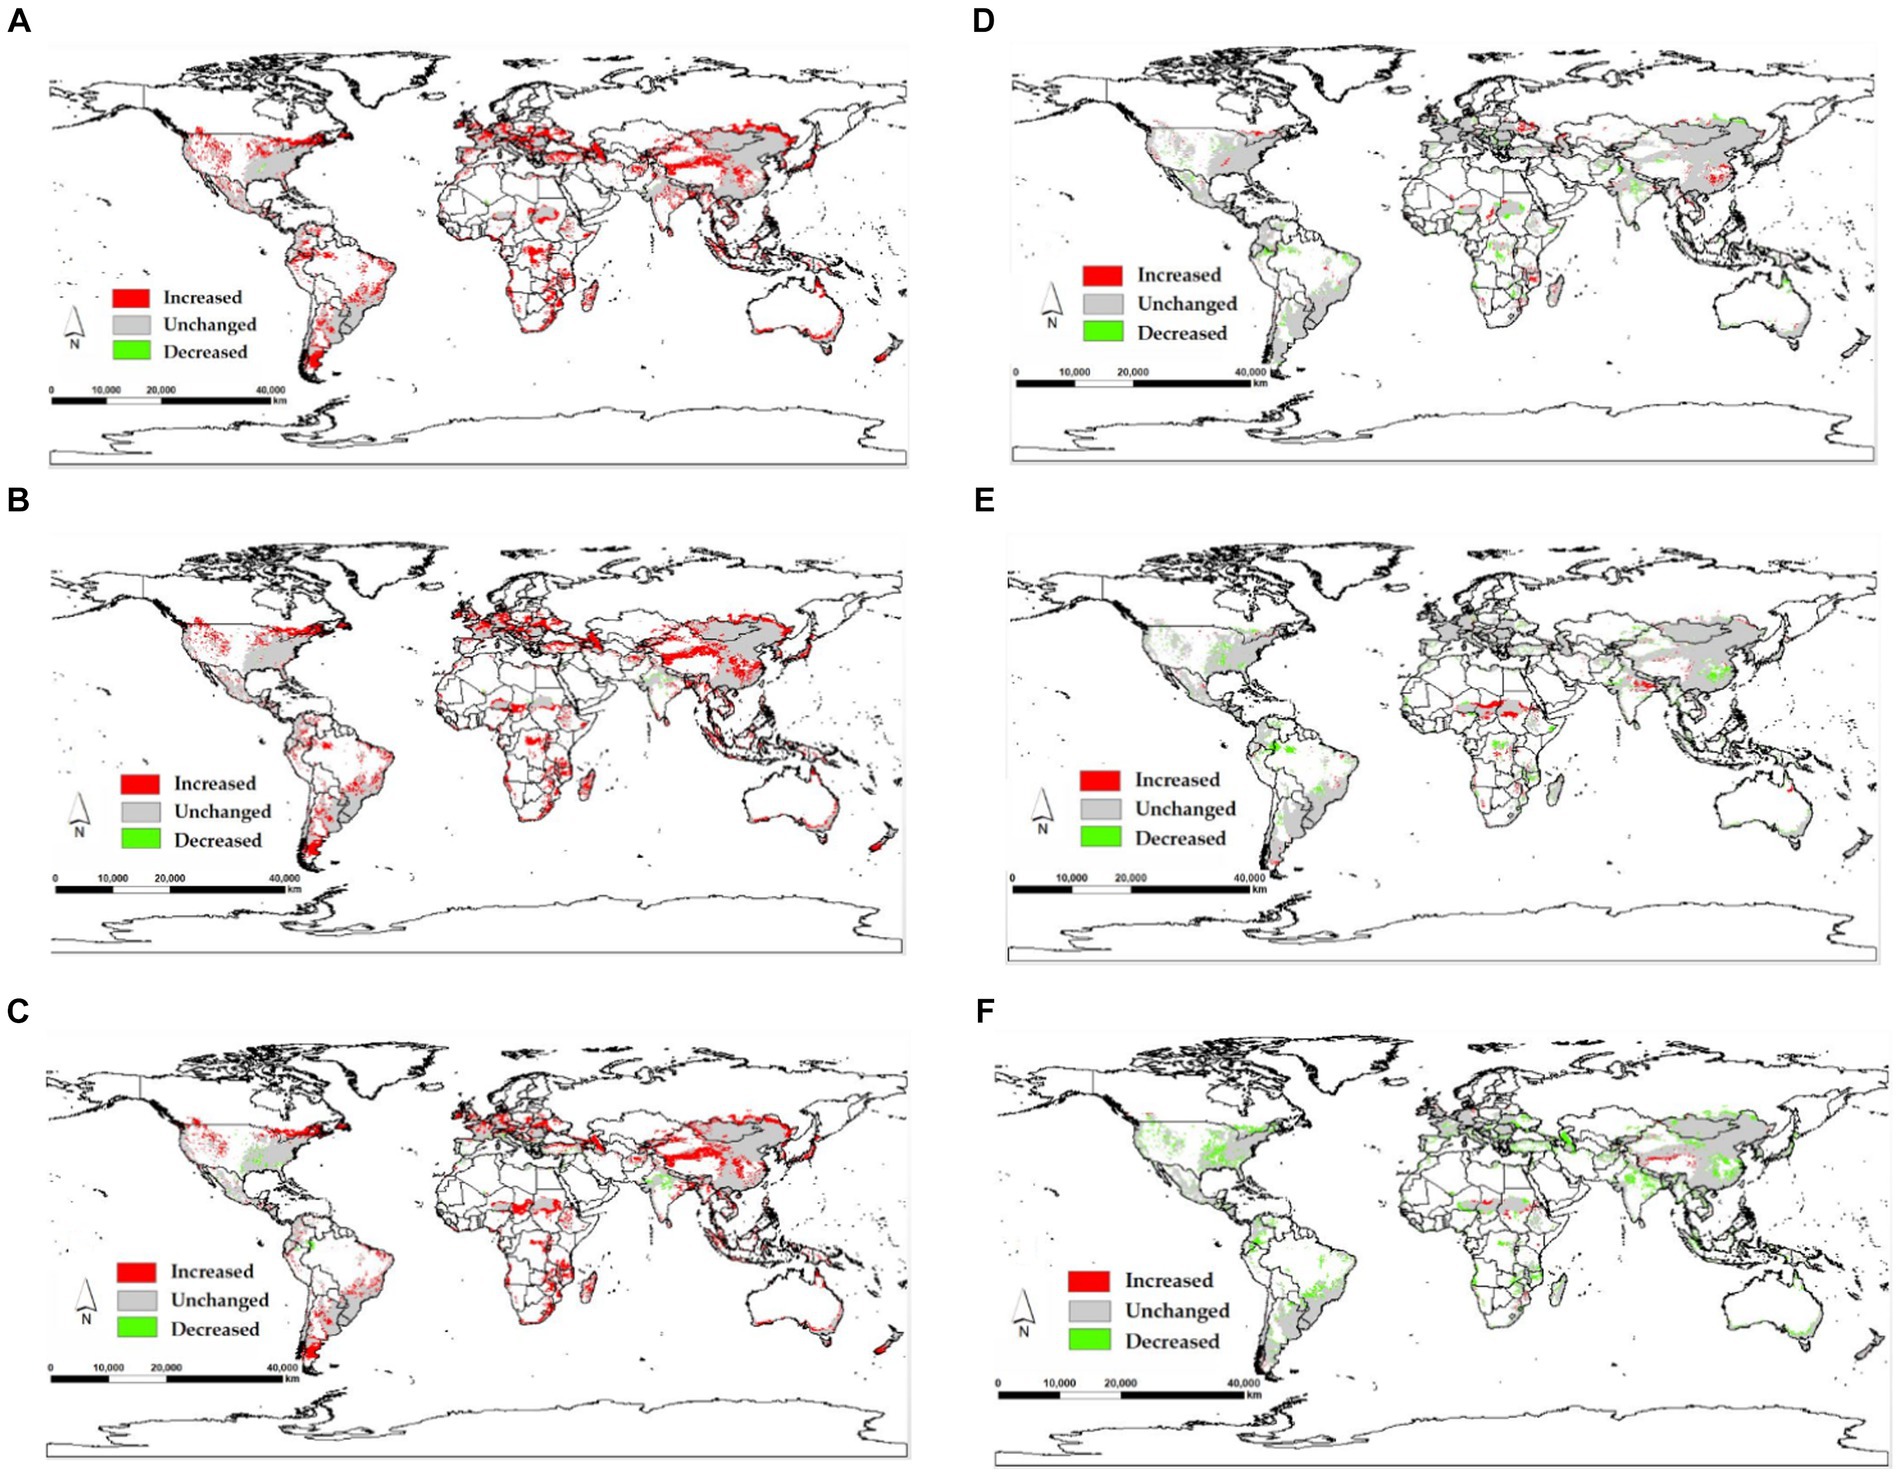
Figure 8. Changes in global suitable areas of EI occurrence under three future climate scenarios for the years 2050 and 2070. (A) 2050SSP126, (B) 2050SSP245, (C) 2050SSP585, (D) 2070SSP126, (E) 2070SSP245, (F) 2070SSP585.
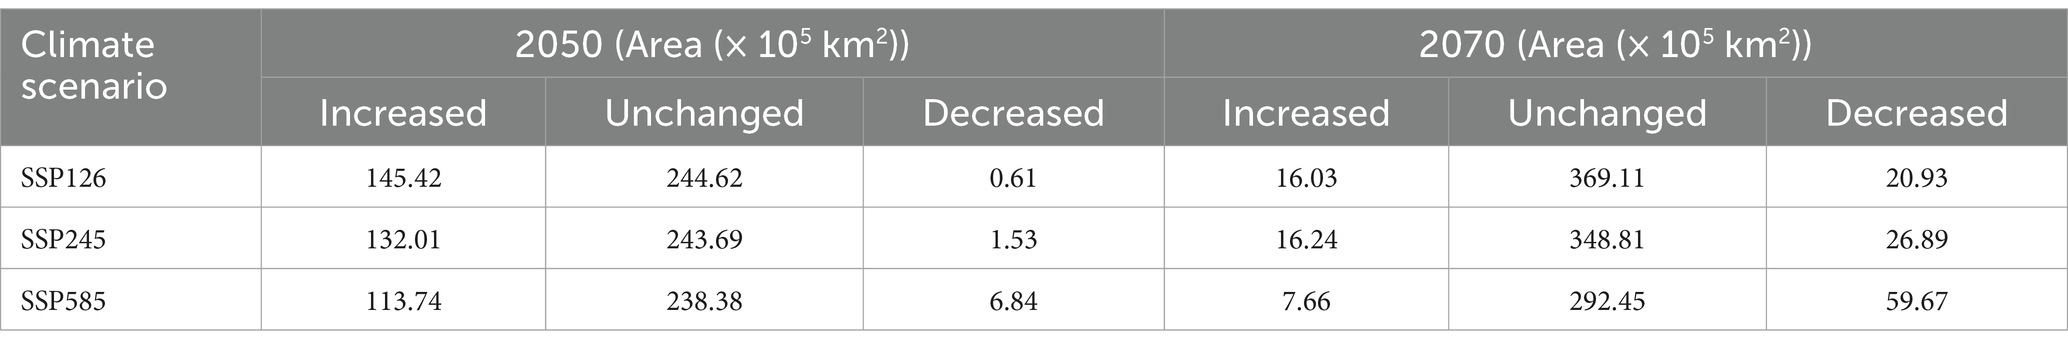
Table 3. Changed area in global suitable areas of EI occurrence under the SSP126/SSP245/SSP558 climate scenarios for the years 2050 and 2070.
The centroid position of EI occurrence shifts from left to right under the SSP126/SSP245/SSP558 climate scenarios from current to the years 2050 and 2070, as shown in Figure 9. The current centroid position is located in Chad at geographic coordinates of (17°80′E, 20°24′N). Under the SSP126 climate scenario, the centroid will shift 417 km eastward to the position (22°17′E, 19°93′N) in 2050, and shift 104 km northeast to the position (22°65′E, 20°40′N) in 2070. Specifically, under the SSP245 climate scenario, the centroid will shift 626 km eastward to position (22°19′E, 20°40′N) in 2050, and shift nearly 313 km eastward to position (23°11′E, 20°41′N) in 2070. Under the SSP585 climate scenario, the centroid will continuously shift eastward from 2050 (24°48′E, 19°83′N) to 2070 (26°50′E, 19°80′N). Overall, the centroid position will shift eastward to varying degrees under three climate scenarios.
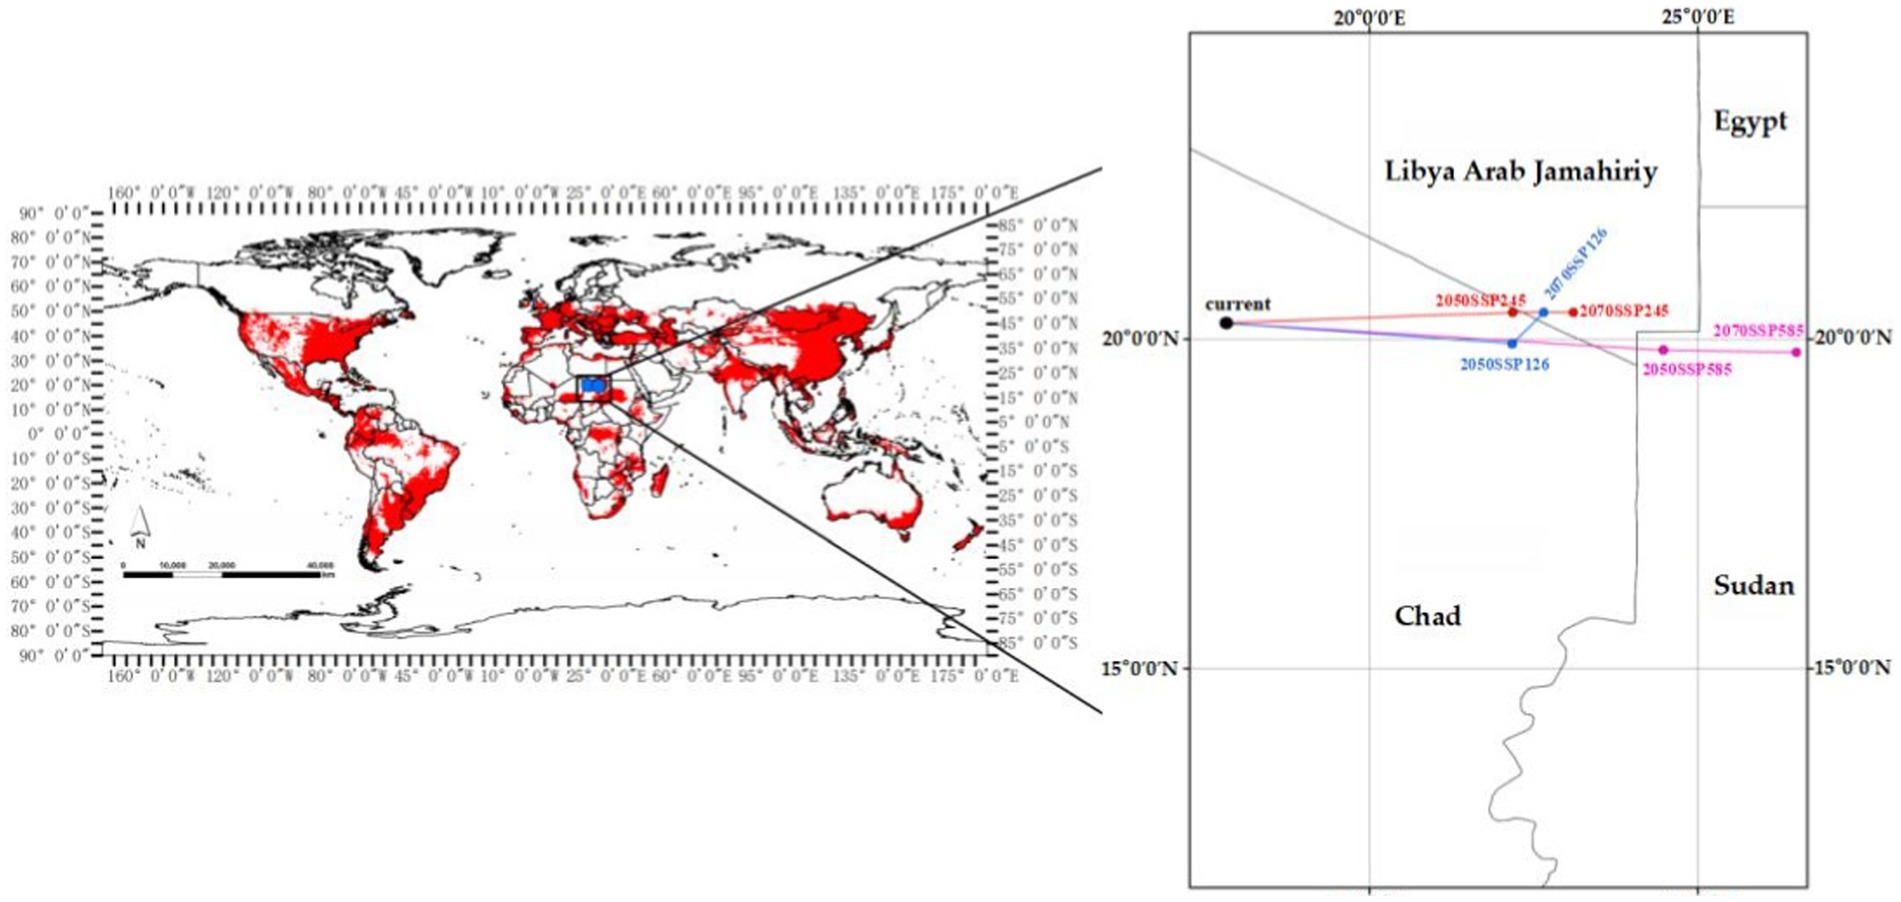
Figure 9. Centroid position of EI occurrence shifts under three climate scenarios from current to the years 2050 and 2070 (The blue, red and purple lines, respectively, represent the SSP126, SSP245, and SSP585 climate scenarios).
4 Discussion
EI is an important infectious disease in the global horse industry (29). Understanding the epidemiological characteristics of EI is crucial for its effective prevention and control. Previous literature has demonstrated that environmental variables such as temperature, humidity, and the number of susceptible animals play a crucial role in the transmission of the influenza virus (30, 31). Although scientists have made efforts, the environmental variables associated with EI occurrence and their roles are still unclear. This study is the first to utilize spatial epidemiological technologies to analyze the epidemiological characteristics of EI, including spatiotemporal cluster distribution, important environmental variables, and suitable areas for occurrence. The aim is to effectively improve the EI’s prevention and control effect.
This study identified fourteen spatiotemporal clusters of EI occurrence. EI was found to occur in almost all years between 2005 and 2022, and was widely distributed across all continents. The majority of spatiotemporal clusters were found in Asia (6/14), with early onset and long duration. Four spatiotemporal clusters were subsequently found in Africa, with almost all of them concentrated between 2017 and 2022. Previous studies have also reported a high incidence of EI in these four spatiotemporal clusters (32). These results suggest that EI is currently prevalent in Africa, and related countries should actively work on prevention and control measures. The remaining spatiotemporal clusters were located in the Americas, Europe, and Oceania. The results indicated that EI spatiotemporal clusters were widely distributed. The import and export of horses, as well as transnational horse competitions, pose a challenge to EI prevention and control (33). Further exploration of the risk of EI being affected in these situations is warranted.
The Maxent model had an AUC value of 0.920 ± 0.008, indicating successful establishment (25). The results suggest that annual mean ultraviolet radiation (uvb1) is a significant variable affecting the occurrence of EI. Although no study has clarified how ultraviolet radiation affects the occurrence of EI, it has been reported that the similar influenza virus is sensitive to ultraviolet radiation (34). To improve prevention and control of EI, it may be beneficial to conduct more specific studies on how ultraviolet radiation affects its occurrence. In addition, horse density (hd) is a key variable, as higher densities result in the clustering of more susceptible animals, and combined with the high incidence of EI and its rapid rate of spread, an increase in horse density can greatly contribute to the spread of EI (35). At present, spatial epidemiological studies of several infectious diseases also show that ultraviolet light and animal density play an important role in the occurrence and spread of infectious diseases (11, 36), and more precise and detailed effects need to be supported by more data from direct experiments or other epidemiological studies. Another important variable for EI occurrence is bio_19, which measures the precipitation during the coldest quarter. Firestone et al. reported that the spread of EI could be affected by relative humidity and temperature (16). As horses are homeothermic animals, they take steps to avoid damage caused by low temperatures when the environmental temperature drops to the critical lower limit of the body temperature (37). These steps include hiding in human-built shelters or congregating, which may increase the risk of direct transmission (38).
The global suitable areas for EI occurrence were predicted under the current and future climate scenarios. Under the current climate scenario, the suitable areas were mainly concentrated in Asia and the Americas, consistent with reported epidemic locations (39). Three future climate scenarios (SSP126, SSP245, and SSP585) demonstrate the impact of human activities on climate under different socioeconomic development paths. Under the future climate scenarios, the suitable areas are projected to be larger in 2050 than in 2070. The SSP126 scenario showed the largest increase in suitable areas, while the SSP585 scenario showed the largest reduction. This could be due to the fact that the SSP126 scenario had the least carbon emissions and the slowest rise in temperature, whereas the SSP585 scenario had the opposite (21). These results support the findings of the study that low temperature is a significant environmental factor affecting the occurrence of EI. It is recommended to intensively monitor the suitable areas based on the indications from future climate scenarios, particularly SSP126. The centroid position of suitable areas is expected to shift eastward in the future, indicating that there may be more suitable areas to the east of the centroid. It is reasonable to assume that these areas have favorable environmental conditions and a sufficient number of susceptible animals, creating conditions for the occurrence of EI. Once an EI occurs in these areas, the EIV can persist for an extended period, and the risk of an epidemic remains (40).
Indeed, this study has unavoidable limitations, including underreporting and time lags due to data collected from official reports. The Maxent model works in such a way that the model can achieve good modeling results even when some data is missing (41), so the limitations due to missing data are limited. Due to time and technical level, we did not apply extrapolation detection (ExDet) to evaluate model performance and identify potential overfits (42), which we will work on in future studies. Trade and transportation are critical human factors that may influence the occurrence of EI (33), these factors also contribute to the epidemic outbreak of the disease, which are not considered in this study, because accurate and comprehensive data information cannot be obtained.
With the rise in international trade and commercial activities such as exhibitions and competitions, the risk of EI occurrence is expected to increase. Therefore, effective prevention and control measures for EI are necessary. In particular, focus on immunization in areas of high suitability identified in the study and pay particular attention to whether the vaccine matches the strain currently circulating in the area. Next, researchers could concentrate on developing online platforms for preventing and monitoring EI. These platforms could help analyze and visualize the global incidence of EI and provide early warnings to high-risk areas.
5 Conclusion
The study identified fourteen spatiotemporal clusters of EI worldwide. The important environmental variables affecting EI occurrence were annual average ultraviolet radiation, horse density, and precipitation of the coldest quarter. Suitable areas for EI are currently widely distributed across continents, particularly in Asia and the Americas. The study predicts that under future climate scenarios, the suitable areas will expand and shift eastward. These findings present the epidemiological characteristics of EI, which can serve as a valuable reference for its prevention and control.
Data availability statement
The original contributions presented in the study are included in the article/supplementary material, further inquiries can be directed to the corresponding authors.
Ethics statement
The manuscript presents research on animals that do not require ethical approval for their study.
Author contributions
JD: Writing – original draft. YW: Writing – review & editing. JL: Software, Writing – review & editing. ZH: Software, Writing – review & editing. CZ: Software, Validation, Writing – review & editing. YH: Formal analysis, Writing – review & editing. JX: Investigation, Writing – review & editing. LL: Resources, Writing – review & editing. JM: Conceptualization, Writing – review & editing. MZ: Data curation, Writing – original draft. BL: Methodology, Writing – review & editing. MS: Methodology, Writing – review & editing.
Funding
The author(s) declare financial support was received for the research, authorship, and/or publication of this article. This research was funded by Guangxi University Student Innovation and Entrepreneurship Training Program (S202310593365).
Acknowledgments
All authors would like to thank all medical personnel contributing to the diagnosis and report of equine influenza cases.
Conflict of interest
JD was employed by Nanning New Technology Entrepreneur Center. ZH was employed by Shenyang Zhengda Animal Husbandry Co., Ltd.
The remaining authors declare that the research was conducted in the absence of any commercial or financial relationships that could be construed as a potential conflict of interest.
Publisher’s note
All claims expressed in this article are solely those of the authors and do not necessarily represent those of their affiliated organizations, or those of the publisher, the editors and the reviewers. Any product that may be evaluated in this article, or claim that may be made by its manufacturer, is not guaranteed or endorsed by the publisher.
Footnotes
References
1. Chambers, TM. Equine Influenza. Cold Spring Harb Perspect Med. (2022) 12:a038331. doi: 10.1101/cshperspect.a038331
2. Singh, RK, Dhama, K, Karthik, K, Khandia, R, Munjal, A, Khurana, SK, et al. Comprehensive review on equine influenza virus: etiology, epidemiology, pathobiology, advances in developing diagnostics, vaccines, and control strategies. Front Microbiol. (2018) 9:1941. doi: 10.3389/fmicb.2018.01941
3. Chambers, TM. A brief introduction to equine influenza and equine influenza viruses In: E Spackman, editor. Animal influenza virus. methods in molecular biology. New York, NY: Springer (2014). 365–70.
4. Landolt, GA. Equine influenza virus. Vet Clin North Am. (2014) 30:507–22. doi: 10.1016/j.cveq.2014.08.003
5. Daly, JM, MacRae, S, Newton, JR, Wattrang, E, and Elton, DM. Equine influenza: a review of an unpredictable virus. Vet J. (2011) 189:7–14. doi: 10.1016/j.tvjl.2010.06.026
6. Olguin-Perglione, C, and Barrandeguy, ME. An overview of equine influenza in South America. Viruses. (2021) 13:888. doi: 10.3390/v13050888
7. Newton, JR, Rendle, DI, Mountford, DR, and Marr, CM. Equine influenza vaccination catches an autumn cold! But must get over it as soon as it can. Equine Vet J. (2023) 55:142–6. doi: 10.1111/evj.13885
8. Ostfeld, RS, Glass, GE, and Keesing, F. Spatial epidemiology: an emerging (or re-emerging) discipline. Trends Ecol Evol. (2005) 20:328–36. doi: 10.1016/j.tree.2005.03.009
9. Kulldorff, M, Heffernan, R, Hartman, J, Assunção, R, and Mostashari, F. A space-time permutation scan statistic for disease outbreak detection. PLoS Med. (2005) 2:e59. doi: 10.1371/journal.pmed.0020059
10. Wong, NS, Huang, SJ, Chen, L, Zhao, PZ, Tucker, JD, Yang, LG, et al. Spatiotemporal clusters of primary and secondary syphilis cases in South China: an observational study. Lancet. (2016) 388:S90. doi: 10.1016/S0140-6736(16)32017-7
11. Gao, HY, and Ma, J. Spatial distribution and risk areas of foot and mouth disease in mainland China. Prev Vet Med. (2021) 189:105311. doi: 10.1016/j.prevetmed.2021.105311
12. Deka, MA, Vieira, AR, and Bower, WA. Modelling the ecological niche of naturally occurring anthrax at global and circumpolar extents using an ensemble modelling framework. Transbound Emerg Dis. (2022) 69:e2563–77. doi: 10.1111/tbed.14602
13. Warren, DL, and Seifert, SN. Ecological niche modeling in Maxent: the importance of model complexity and the performance of model selection criteria. Ecol Appl. (2011) 21:335–42. doi: 10.1890/10-1171.1
14. Ren, H, Zhao, L, Zhang, A, Song, L, Liao, Y, Lu, W, et al. Early forecasting of the potential risk zones of COVID-19 in China’s megacities. Sci Total Environ. (2020) 729:138995. doi: 10.1016/j.scitotenv.2020.138995
15. Choi, JH, Namgung, H, Lim, SJ, Kim, EK, Oh, Y, and Park, YC. Predicting suitable areas for African swine fever outbreaks in wild boars in South Korea and their implications for managing high-risk pig farms. Animals. (2023) 13:2148. doi: 10.3390/ani13132148
16. Firestone, SM, Cogger, N, Ward, MP, Toribio, JA, Moloney, BJ, and Dhand, NK. The influence of meteorology on the spread of influenza: survival analysis of an equine influenza (a/H3N8) outbreak. PLoS One. (2012) 7:e35284. doi: 10.1371/journal.pone.0035284
17. Baker, RE, Mahmud, AS, Miller, IF, Rajeev, M, Rasambainarivo, F, Rice, BL, et al. Infectious disease in an era of global change. Nat Rev Microbiol. (2021) 9:193–205. doi: 10.3390/vetsci9110606
18. Warren, DL, Glor, RE, and Turelli, M. ENMTools: a toolbox for comparative studies of environmental niche models. Ecography. (2010) 33:607–11. doi: 10.1111/j.1600-0587.2009.06142.x
19. Poggio, L, Simonetti, E, and Gimona, A. Enhancing the WorldClim data set for national and regional applications. Sci Total Environ. (2018) 625:1628–43. doi: 10.1016/j.scitotenv.2017.12.258
20. Wu, TW, Lu, YX, Fang, YJ, Xin, XG, Li, L, Li, WP, et al. The Beijing climate center climate system model (BCC-CSM): the main progress from CMIP5 to CMIP6. Geosci Model Dev. (2019) 12:1573–600. doi: 10.5194/gmd-12-1573-2019
21. Kong, Y, Feng, C, and Guo, L. Peaking global and G20 Countries’ CO2 emissions under the shared socio-economic pathways. Int J Environ Res Public Health. (2022) 19:11076. doi: 10.3390/ijerph191711076
22. Liu, K, Sun, J, Liu, X, Li, R, Wang, Y, Lu, L, et al. Spatiotemporal patterns and determinants of dengue at county level in China from 2005–2017. Int J Infect Dis. (2018) 77:96–104. doi: 10.1016/j.ijid.2018.09.003
23. Guo, W, Li, Z, Liu, T, and Feng, J. Effects of climate change on the distribution of threatened fishing bat Myotis pilosus in China. Animals. (2023) 13:1784. doi: 10.3390/ani13111784
24. Teng, AY, Che, TL, Zhang, AR, Zhang, YY, Xu, Q, Wang, T, et al. Mapping the viruses belonging to the order Bunyavirales in China. Infect Dis Poverty. (2022) 11:81. doi: 10.1186/s40249-022-00993-x
25. Phillips, SJ, Anderson, RP, and Schapire, RE. Maximum entropy modeling of species geographic distributions. Ecol Model. (2006) 190:231–59. doi: 10.1016/j.ecolmodel.2005.03.026
26. Liu, B, Jiao, Z, Ma, J, Gao, X, Xiao, J, Hayat, MA, et al. Modelling the potential distribution of arbovirus vector Aedes aegypti under current and future climate scenarios in Taiwan, China. Pest Manag Sci. (2019) 75:3076–83. doi: 10.1002/ps.5424
27. Akpan, GE, Adepoju, KA, Oladosu, OR, and Adelabu, SA. Dominant malaria vector species in Nigeria: modelling potential distribution of Anopheles gambiae sensu lato and its siblings with MaxEnt. PLoS One. (2018) 13:e0204233. doi: 10.1371/journal.pone.0204233
28. Aidoo, OF, Souza, PGC, da Silva, RS, Santana, PA, Picanço, MC, Kyerematen, R, et al. Climate-induced range shifts of invasive species (Diaphorina citri Kuwayama). Pest Manag Sci. (2022) 78:2534–49. doi: 10.1002/ps.6886
29. Dominguez, M, Münstermann, S, de Guindos, I, and Timoney, P. Equine disease events resulting from international horse movements: systematic review and lessons learned. Equine Vet J. (2016) 48:641–53. doi: 10.1111/evj.12523
30. Katherine, EEJ, and Ghedin, E. Quantifying between-host transmission in influenza virus infections. Cold Spring Harb Perspect Med. (2020) 10:a038422. doi: 10.1101/cshperspect.a038422
31. Lowen, AC, Mubareka, S, Steel, J, and Palese, P. Influenza virus transmission is dependent on relative humidity and temperature. PLoS Pathog. (2007) 3:1470–6. doi: 10.1371/journal.ppat.0030151
32. Diallo, AA, Souley, MM, Issa Ibrahim, A, Alassane, A, Issa, R, Gagara, H, et al. Transboundary spread of equine influenza viruses (H3N8) in west and Central Africa: molecular characterization of identified viruses during outbreaks in Niger and Senegal, in 2019. Transbound Emerg Dis. (2021) 68:1253–62. doi: 10.1111/tbed.13779
33. Sack, A, Cullinane, A, Daramragchaa, U, Chuluunbaatar, M, Gonchigoo, B, and Gray, GC. Equine influenza virus—a neglected, Reemergent disease threat. Emerg Infect Dis. (2019) 25:1185–91. doi: 10.3201/eid2506.161846
34. Juzeniene, A, Ma, LW, Kwitniewski, M, Polev, GA, Lagunova, Z, Dahlback, A, et al. The seasonality of pandemic and non-pandemic influenzas: the roles of solar radiation and vitamin D. Int J Infect Dis. (2010) 14:e1099–105. doi: 10.1016/j.ijid.2010.09.002
35. Whitlock, F, Grewar, J, and Newton, R. An epidemiological overview of the equine influenza epidemic in Great Britain during 2019. Equine Vet J. (2023) 55:153–64. doi: 10.1111/evj.13874
36. Jun, M, Hao, C, Xiang, G, Jianhua, X, and Hongbin, W. African swine fever emerging in China: distribution characteristics and high-risk areas. Prev Vet Med. (2019) 175:104863:104861. doi: 10.1016/j.prevetmed.2019.104861
37. Mejdell, CM, Bøe, KE, and Jørgensen, GHM. Caring for the horse in a cold climate—reviewing principles for thermoregulation and horse preferences. Appl Anim Behav Sci. (2020) 231:105071. doi: 10.1016/j.applanim.2020.105071
38. Jørgensen, GHM, Aanensen, L, Mejdell, CM, and Bøe, KE. Preference for shelter and additional heat in horses exposed to Nordic winter conditions. Equine Vet J. (2016) 48:720–6. doi: 10.1111/evj.12522
39. OIE. World Organisation for Animal Health. Available at: https://www.woah.org/ (Accessed February 16, 2023)
40. Gonzalez-Obando, J, Forero, JE, Zuluaga-Cabrera, AM, and Ruiz-Saenz, J. Equine influenza virus: an old known enemy in the Americas. Vaccine. (2022) 10:1718. doi: 10.3390/vaccines10101718
41. Elith, J, Phillips, SJ, Hastie, T, Dudík, M, Chee, YE, and Yates, CJ. A statistical explanation of MaxEnt for ecologists. Divers Distrib. (2011) 17:43–57. doi: 10.1111/j.1472-4642.2010.00725.x
Keywords: equine influenza, spatial epidemiology, spatiotemporal pattern, suitable area, Maxent model
Citation: Ding J, Wang Y, Liang J, He Z, Zhai C, He Y, Xu J, Lei L, Mu J, Zheng M, Liu B and Shi M (2024) Spatiotemporal pattern and suitable areas analysis of equine influenza in global scale (2005–2022). Front. Vet. Sci. 11:1395327. doi: 10.3389/fvets.2024.1395327
Edited by:
Ioannis Magouras, University of Bern, SwitzerlandReviewed by:
Hongyan Gao, Hainan University, ChinaJun Ma, Northeast Agricultural University, China
Haoran Wang, Northeast Agricultural University, China
Copyright © 2024 Ding, Wang, Liang, He, Zhai, He, Xu, Lei, Mu, Zheng, Liu and Shi. This is an open-access article distributed under the terms of the Creative Commons Attribution License (CC BY). The use, distribution or reproduction in other forums is permitted, provided the original author(s) and the copyright owner(s) are credited and that the original publication in this journal is cited, in accordance with accepted academic practice. No use, distribution or reproduction is permitted which does not comply with these terms.
*Correspondence: Boyang Liu, liuboyang1994neau@163.com; Mingxian Shi, shimingxian2020@163.com