Influence of GlycoGag on the Incorporation of Host Membrane Proteins Into the Envelope of the Moloney Murine Leukemia Virus
 Mariam Maltseva
 Marc-André Langlois
- 1Department of Biochemistry, Microbiology and Immunology, Faculty of Medicine, University of Ottawa, Ottawa, ON, Canada
- 2Ottawa Center for Infection, Immunity and Inflammation (CI3), Ottawa, ON, Canada
Analysis of viral particle heterogeneity produced from infected cells has been limited by the inefficiency of traditional analytical methods to characterize large populations of viruses at an individual particle level. Flow virometry (FVM) is an emerging technique based on flow cytometry principles that enables a high throughput, multiparametric, and phenotypic characterization of viruses at a single particle resolution. Here, we performed FVM to analyze surface markers found on Murine Leukemia Virus (MLV) and glycosylated Gag-deficient (glycoGag) MLV. The glycoGag viral accessory protein has several roles in the MLV viral infection cycle including directing retroviral assembly and particle release at lipid rafts. Based on previous studies, we hypothesize that glycoGag modulates host protein incorporation into the viral envelope during viral assembly and budding. Here, by using FVM, we reveal that glycoGag is associated with an increased incorporation of the host-derived tetraspanins CD81 and CD63 along with the lipid raft marker and immune antigen Thy1.2 during the assembly and release of viral particles from infected NIH 3T3, EL4, and primary CD4+ T cells. Moreover, we show differences in the uptake of host proteins by viruses that are released from the two cell lines and primary T lymphocytes. Additionally, at the individual viral particle level, we observed a degree of expression heterogeneity of host-derived antigens within the viral population. Finally, certain cellular antigens can show either enrichment or exclusion from the viral envelope depending on whether glycoGag is expressed by the virus. This suggests that glycoGag is involved in a mechanism of selective host protein incorporation into the viral envelope.
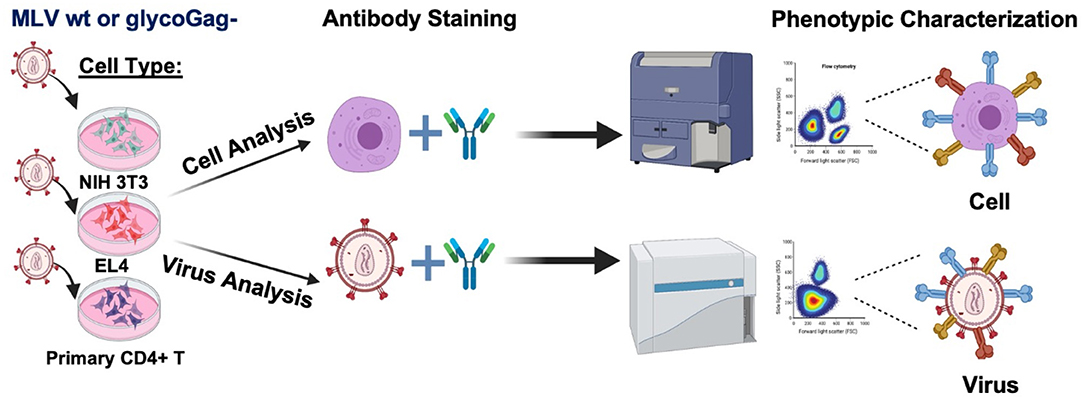
Graphical AbstractWe profiled the expression of a selection surface proteins on infected cells and compared their relative abundance on the surface of two variants of Moloney murine leukemia virus that express or not the accessory protein glycoGag (Illustration made in BioRender.com).
Highlights
- When retroviruses egress from an infected cell, they capture some of the cell membrane which becomes part of its viral envelope. Host proteins are not randomly inserted into the envelope of budding retroviral particles. Certain cellular and viral factors influence the type and abundance of host proteins incorporated into the viral envelope at the site of viral egress. These proteins can have functional roles in immune escape, infectivity and even pathogenesis. Here we explore how the retroviral accessory protein glycoGag can modulate host protein incorporation into the viral envelope.
Introduction
Retroviruses are a diverse group of enveloped, single-stranded, RNA viruses that infect a wide variety of vertebrates. Murine Leukemia Virus (MLV) is often used as the prototypical model to study more complex retroviruses such as the Human Immunodeficiency Virus type 1 (HIV-1) and Human T-cell Lymphotropic Virus (HTLV). MLV is a simple enveloped retrovirus, initially presumed to code for three essential genes that are required for the retroviral replication cycle: Group Specific Antigen (Gag), envelope glycoprotein (Env), and viral RNA-dependent DNA polymerase and integrase (Pol). However, it has been shown that the MLV genome can also code for an additional glycosylated variant of Gag known as glycoGag which harbors an additional 88 amino acids in its N-terminus (Figure 1A) (1–3). Recognition of an alternative CUG start codon upstream and in frame of the gag gene codes for a new leader sequence that directs the glycoGag protein to the endoplasmic reticulum for N-glycosylation. Upon post-translational modification, glycoGag is cleaved into two subunits with the amino-terminal cleavage product of the protein becoming membrane-associated and subsequently inserted into the viral envelope of budding progeny virions in the NexoCcyto orientation of a type I integral membrane protein (1, 4–6).
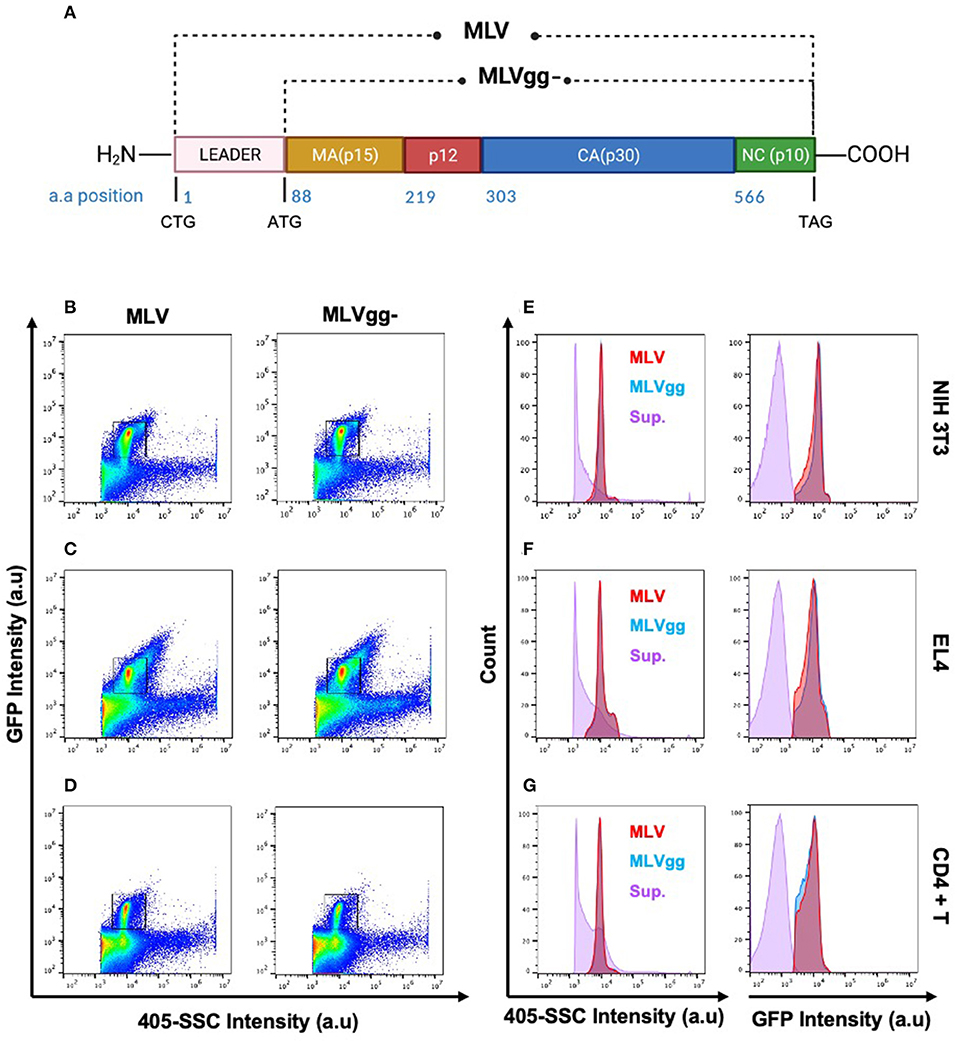
Figure 1. Identification of the viral population by side scatter and GFP fluorescence. (A) Schematic representation of wild-type MLV (MLV) and glycoGag-deficient MLV (MLVgg-). MLV virions present a similar scatter plot profile to MLVgg- virions when released from (B,E) NIH 3T3 fibroblast, (C,F) EL4 T lymphocytes and (D,G) primary CD4+ T cells. The viral population of interest is resolved from background by sfGFP fluorescence and side scatter (405-SCC) intensity (B–D). Gated particles express similar monodisperse 405-SSC and sfGFP profiles and are resolved from supernatant (sup.) collected from uninfected cells as visualized here by histogram plots (E–G).
GlycoGag has been postulated to be an accessory protein of MLV since it is not required for viral replication in vitro but enhances the replication and pathogenesis of MLV in vivo (7–14). GlycoGag has also been shown to influence viral budding in the producer cell by directing virion assembly and release to lipid raft microdomains, which are lipid-rich environments in the cell membrane that are highly saturated in cholesterol (10, 11). Finally, glycoGag provides stability to the viral core and aids MLV in circumventing the antagonistic functions of host restriction factors including the APOBEC3 cytidine deaminase and serine incorporated proteins (Serinc) (3, 6, 15–17).
The majority of newly assembled retroviral particles bud at the cell surface (18). In doing so, they capture a portion of the lipid bilayer from the cell, viral glycoproteins, and host-associated surface markers. This process ensures a highly controlled and precisely executed colocalization, incorporation, and assembly of all the virus' structural components. In the case of MLV, particles released are structurally extremely homogenous and monodisperse (6, 19–21). However, the underlying mechanism that governs host cellular antigen uptake by retroviruses and budding viruses is not clearly understood. Several different models have been proposed, including both passive and active models of host-derived antigen incorporation (22–24). The former suggests that the producer cell type predominantly determines the viral antigenic profile (22). In contrast, several studies have shown that cellular surface antigen uptake is not only a passive outcome of viral egress, and that viral components can directly influence their specific uptake. This active uptake model involves a selective mechanism of antigen incorporation that can be observed by the extent of viral phenotypic variability of surface markers and their effect on infection, adhesion, neutralization, and pathogenesis (22–29). Many of these studies note that antigen expression levels on the surface of a host cell do not necessarily correlate by stoichiometry to the abundance of a given protein on the viral envelope (25, 28–30). Although the cell type from which the viral particles are released from is an important determinant of viral envelope composition, viral factors may also play an active role in influencing the envelope's antigenic composition. For example, myristylation sites detected in the viral matrix protein are essential for targeting Gag assembly to detergent-resistant microdomains and lipid rafts, areas in which MLV and HIV-1 preferentially egress from (28, 31–33). In conjunction, Fan and colleagues have shown that glycoGag of wild-type MLV facilitates viral release through lipid rafts (10, 11). Intriguingly, Jalaguier et al. (26) have demonstrated that certain viral matrix mutations significantly impact host-derived ICAM-1 incorporation in the HIV-1 viral envelope thereby elucidating the matrix protein's contribution to host protein incorporation. Furthermore, HIV-1 accessory proteins Nef and viral protein u (Vpu) downregulate host surface antigens such as CD4, MHC class I, and tetherin (6, 15–17, 30, 34–36). Functionally similar to Nef in some aspects, glycoGag first delocalizes the host restriction factors Serinc 3 and Serinc 5 from the plasma membrane by clathrin-dependent endocytosis and subsequently induces their processing through lysosomal degradation (6, 16, 17, 37). Despite extensive investigation into the role of HIV-1's accessory proteins and the various observations of down-modulation of select antigens on the surface of the infected cells, the impact of viral factors on the viral envelope composition has been understudied.
Viral surface antigens have been mostly characterized indirectly through bulk methodologies (e.g., Western Blot, ELISA, mass spectrometry) due to the relative scarcity of technologies capable of characterizing large numbers of viruses in a population at a single particle level. Bulk analyses generally lack the ability to provide critical information on: i) the surface protein composition of individual enveloped viruses, ii) the heterogeneity of viral populations, and iii) the presence of viral subpopulations (38, 39). While electron microscopy is extremely effective at investigating antigens on individual viruses, it is restricted in the number of particles analyzed simultaneously, labor intensive and only provides a relatively small snapshot of the heterogenous viral population. Recently, flow cytometry principles have been adapted to analyze submicron particles such as viruses and extracellular vesicles (EVs) (19, 20, 38–40). Analysis of viruses by flow cytometry is a technique called flow virometry (FVM) which provides information regarding the relative size of viruses in a population, their light-scattering features indicative of population homogeneity, the abundance of total intact particles in a sample, and the relative expression level of proteins on their surface (20).
Here, we investigated by FVM the impact of glycoGag on the incorporation of host-derived proteins into the viral envelope of Moloney MLV. For this purpose, we compared the uptake of host surface antigens between wild-type MLV (MLV) and glycoGag-deficient (MLVgg-) particles released from three different murine cell types. Both viruses are replication-competent and express an Env-sfGFP fusion protein on their surface (19). We performed a direct comparison of populations of these two MLV variants released from infected NIH 3T3 fibroblasts, EL4 T lymphocytes, and primary CD4+ T cells. Our study revealed a broad range in expression of host-derived proteins in the envelope of populations of the two viruses. We also show that the glycoGag accessory protein is associated with a selective increase or decrease in the incorporation of certain host-derived proteins into the viral envelope. Thus, our findings further support a role for glycoGag in governing host cellular protein incorporation into the MLV envelope during viral release.
Materials and Methods
Mice
All breeding and experiments performed on animals were conducted in accordance with the Ontario Animals for Research Act and were approved by the University of Ottawa Animal Ethics Committee (protocol number ME-133). As previously described by our lab, Apobec3-deficient (mA3−/−) mice (mA3-knockout mice) were backcrossed 12 times to a C57BL/6 mouse background (41). C57BL/6 (mA3 wild-type [WT]) and mA3-KO mice were maintained in the barrier unit of the University of Ottawa Animal Care Facility.
Cell Culture
Mouse embryonic fibroblasts (NIH 3T3) were cultured in DMEM (Wisent), and mouse T lymphocytes (EL4) and primary CD4+ T lymphocytes were cultured in RPMI 1640 (Wisent) and propagated in an incubator at 37°C with 5% CO2. Media was supplemented with 10% FBS (Corning), 100 U/mL penicillin, and 100 μg/mL streptomycin (Wisent). Mouse splenocytes were isolated from mA3-knockout 6-week old C57BL/6 mice. Briefly, spleens were homogenized by enforcing passage through a 70 μm nylon cell strainer as previously described (3). Primary CD4+ T cells were isolated with total CD4 T cell isolation kit (Miltenyi Biotec) using MACS separator following the manufacturer's instructions. Following isolation, cells were activated with anti-CD3 (1 μg/mL) (clone 172A, Biolegend) and anti-CD28 (1 μg/mL) (clone E18, Biolegend) antibodies and resuspended in RPMI 1640 media substituted with human IL-2 50 units/mL (Peprotech) and 0.01 M Betamercaptoethanol (BME) (Sigma) for 48 h.
Expression Plasmids and Virus Production
Plasmids encoding WT and glycogag-deficient Moloney MLV-sfGFP (MLVgg-) were described previously by our group (19, 21). Briefly, both plasmids were generated using restriction-free cloning to replace eGFP in the proline-rich region of Env in Moloney MLV vector with a sfGFP as previously reported (6, 42). Forward primer 5′-TTCAGTCACCAAACCACCCAGTGGGAGCAAGGGCGAGGAACTGTTCACC-3′, and reverse primer 5′-CGGTACGTACGCACCGGTGGACTTGT ACAGCTTGTACAGCTCGTCCATGCCGTGGG-3′ were used. Thus, both WT and MLVgg- express sfGFP as a fusion protein with Env, where sfGFP is exposed on the outer side of the viral envelope. Consequently, wild-type MLV has an additional 88 amino acid leader sequence compared to the MLVgg- due the recognition of an alternative CUG start codon upstream and in frame of the gag gene (Figure 1A). MLV and MLVgg- were produced from chronically infected NIH 3T3 cells as previously described (6, 15, 19, 20). Virus harvested from stably infected NIH 3T3 cells was used to infect EL4 cells. Briefly, chronically infected NIH 3T3 cells were seeded at 2.5 × 10⁶ in a 10 cm dish and cultured for 72 h. Collected viral supernatant was filtered through a 0.45 μm filter and ultra-centrifuged at 100,000 g for 3.5 h in a 70Ti rotor at 4°C. Lastly, the viral pellet was resuspended in RPMI 1640 and used to infect EL4 cells seeded in a 6 well plate at 5 × 10⁵ cells per well. Infected EL4 cells were identified by sfGFP expression and were subsequently sorted by flow cytometry. These cells were expanded and used for this study. For viral production, chronically infected NIH 3T3 and EL4 cells were seeded at 5x10⁶ cells in a 10 cm dish in 10 mL of DMEM media (Wisent) or RPMI 1640 media (Wisent) that did not contain phenol red, supplemented with 10% (v/v) EV-depleted FBS, and cultured for 72 h. Viral supernatants were collected, centrifuged at 900 g for 5 min, and filtered with a 0.45 μm filter. Lastly, the supernatant was diluted in 0.1 μm filtered 1X PBS (Wisent) and analyzed by FVM analysis without additional enrichment.
Ex vivo Infections of Primary CD4+ T Cells
Activated primary CD4+ T cells were infected with either MLV or MLVgg-. As previously described, viral supernatant harvested from chronically infected NIH 3T3 producer cells was collected, passed through a 0.45 μm filter, and ultra-centrifuged at 100,000 g for 3.5 h in a 70Ti rotor at 4°C. The viral pellet was resuspended in RPMI 1640 medium (IL-2 50 units/mL, 0.01 M BME) and used to spin infect activated primary CD4 T cells. At 24 h post-infection, cells were washed thoroughly with PBS and resuspended in RPMI 1640 media supplemented with [IL-2 50 units/mL, 0.01 M BME, and 1 ng/mL IL-7 (Miltenyi Biotec)]. After 48 h of incubation, viral supernatants were collected and used for FVM analysis as described. Cells were analyzed by flow cytometry for sfGFP expression and screened for select antigen expression (Table 1).
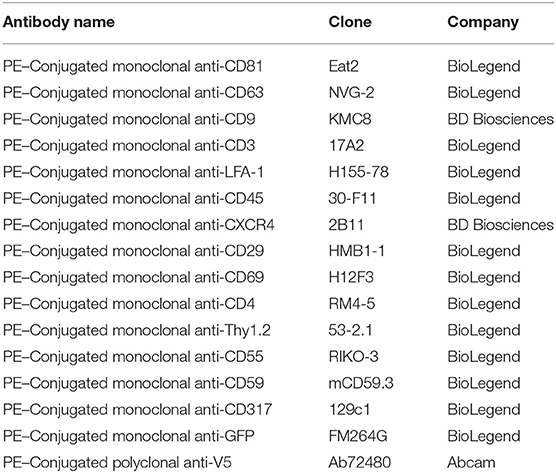
Table 1. List of antibodies used for cell and viral stainings.
Flow Virometry Analysis and Staining
A detailed methodology is available online describing antibody staining of the viruses and instrument settings (19, 21). Briefly, FVM analysis was conducted on a CytoFLEX S (Beckman Coulter) using the 405 nm SSC-H as the threshold parameter (threshold of 1,500 a.u). All viral supernatants were filtered and centrifuged prior to dilution in 0.1 μm-filtered 1X PBS. Prior to viral staining, the antibody was centrifuged at 17,000 g for 10 min in order to decrease the presence of antibody aggregates. Briefly, all viral antibody labeling was performed with 1:1 ratio viral supernatant to PE-conjugated antibody aliquot at final concertation of 0.2–1.6 μg/mL for 1 × 10⁹ viral particles for 60 min at 37°C. Stained viral supernatant was diluted in 0.1 μm filtered PBS and acquired for 60 s at a low setting at a sampling rate of 10 μL/min. Table 1 includes a detailed description of all PE-fluorophore conjugated antibodies used in this study. Figure 1 illustrates the gating strategy utilized for antigen detection in the viral population of interest. Tables 3, 4 include a detailed analysis of labeled Moloney MLV particles for select antigens that were significantly higher than media labeled with antibody control.
Flow Cytometry
For flow cytometry analysis of uninfected and infected cells, cells were stained with the same antibodies as used in the FVM analysis (Table 1) for 20 min at 4C. Excess antibody was removed by washing with 0.2% BSA-PBS.
Data and Statistical Analysis
Flow cytometry and FVM data was analyzed with FlowJo v.10.7.1 (FlowJo, Ashland, OR). For cell analysis, FSC-height vs. FSC-area and SSC-area vs. FSC-area were used to exclude cell aggregates and debris. Statistical analysis to test for normal distribution, multiple unpaired t-test and unpaired Mann-Whitney test was performed using GraphPad Prism (GraphPad Software, San Diego, CA). To analyze the presence and distribution of host-derived antigens on the surface of individual MLV particles, the viral supernatants were stained against the previously described antibodies chosen for cell phenotypic analysis. We set out to assess the two separate null hypotheses stipulated as follows:
H0: MLV viral particles do not uptake cell-derived antigens on their viral envelope during budding, thus the signal intensity between stained MLV virus and negative control does not differ.
H1: MLV viral particles do uptake cell-derived antigens on their viral envelope during budding, thus the signal intensity between stained MLV virus and negative control is different.
H0': The glycoGag protein of MLV virus does not increase the incorporation of the cell-derived antigens compared to the MLVgg-.
H1': The glycoGag protein of MLV does increase the incorporation of the cell-derived antigens compared to the MLVgg-.
The distribution normality of the samples' data was tested using D'Agostino-Pearson and Kolomogorov-Smirnov statistical criteria. Data distribution of all the samples analyzed was confirmed not to be of Gaussian distribution (K2 > 191, KS > 0.06, n > 10,000, p < 0.0001) on a high significance level. Therefore, to assess whether the null hypothesis is rejected and whether there is indeed a statistically significant difference in signal between the two MLV viruses, the Mann-Whitney test was applied. The standard error of mean (SEM) of each sample was calculated as .
Results
Generation of Chronically and Transiently Infected Virus Producer Cells
To analyze the effect of the glycoGag accessory protein on the uptake of host proteins between cell types, we chronically infected NIH 3T3 fibroblast and EL4 T lymphocyte cell lines with wild-type MLV and glycogag deficient MLV. Infected cells were identified by sfGFP expression and sorted by flow cytometry. Viral supernatants collected from NIH 3T3 cells were used to transiently infect primary CD4+ T cells ex vivo. Activated primary total CD4+ T cells isolated from APOBEC3-deficient (mA3−/−) mice were infected with either MLV or MLVgg- as described in the methods section. Supernatants from chronically and transiently infected cells were collected for viral staining and FVM analysis throughout the study without further enrichment or purification.
Viruses produced by all three infected cell types were resolved from the background by both 405-side scatter intensity (405-SSC) and sfGFP fluorescence (Figure 1). Analysis of MLV virions showed a highly monodisperse GFP+ population above a non-fluorescent population composed of EVs and background noise that is mostly visible when compared to the overlaid signal of supernatant collected from uninfected cells (Figures 1E–G). These GFP+ particles display heterogeneity in 405-SSC intensity that is slightly different for each cell type analyzed. Diversity in particle size, refractive index (RI), protein or nucleic acid composition, or lipid content of the cell membrane that constitutes the viral envelope can all be factors influencing this heterogeneity (20, 43–45). The gating strategy used for stained particles is depicted in Figure 2 using CD81 as an example. The GFP+ virus population can be clearly resolved from the instrument background (Figures 1, 2). We have shown previously that Env-sfGFP expressed on EVs account for <0.3% of total GFP+ particles released from infected or transfected cells, and are thereby negligible in the overall virus particle count (19, 20).
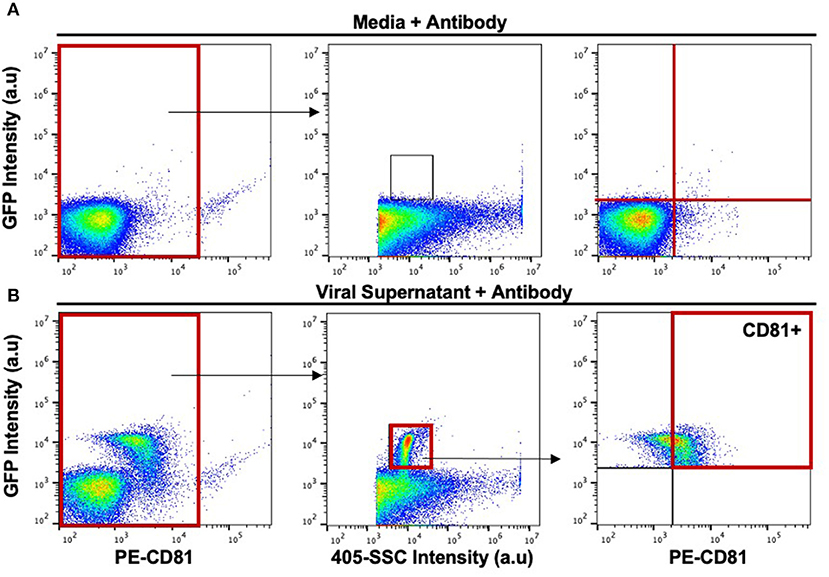
Figure 2. Gating strategy for the phenotypic analysis of host-derived proteins on the surface of the viral envelope of MLV virions. (A) Stained media-only control was used to assess background fluorescence and antibody aggregates. The background noise within this gate was used to set upper and lower gates to identify labeled virions (top rightmost panel). (B) Stained MLVsfGFP virus with anti-CD81 was identified based on side scatter and GFP expression. CD81+ particles were located based on gates applied in (A).
Determining the Dynamic Range of Signal-to-Noise for Virus Stainings
Small particle flow cytometry and FVM face a significant challenge in analyzing surface antigen abundance on viruses due to the substantially smaller particle sizes, surface area, and antigen abundance compared to cells. For cell labeling, quantification of highly expressed proteins resulted in a dynamic range of ~2−2.5 logs in separation between the positive and the negative signals for CD81, Thy 1.2 and GFP (Figures 3A,D). In contrast, we observed a very limited dynamic range in our virus stainings (Figures 3B–E). However, the contour plots clearly indicate that all of the antigens tested can be clearly resolved from the isotype control (Figure 3C). The Env-sfGFP fusion protein trimer is estimated at ~300 molecules in the MLV viral envelope (21). Yet, the analysis of stained MLVsfGFP and nonspecific labeling with anti-GFP-PE revealed a separation of ~1.5 log between the two populations on our instrument (Figures 3B,D,E). For the phenotypic characterization of surface antigens in this study, we used PE-conjugated antibodies as the PE fluorophore produced the highest stain index from the three fluorophores tested in our previous study (21). To determine the optimal antibody concentration for viral staining, we titrated the anti-GFP-PE antibody on a mix of equal proportions of MLVsfGFP and MLV particles with no GFP reporter (MLVnoGFP), where the latter acted as a control to assess for non-specific binding (Figure 3E). As such, the dynamic range is closely affected by antigen expression levels in the viral envelope and the background fluorescence of the sample, which hinders the resolution of viral particles with low levels of antigen expression.
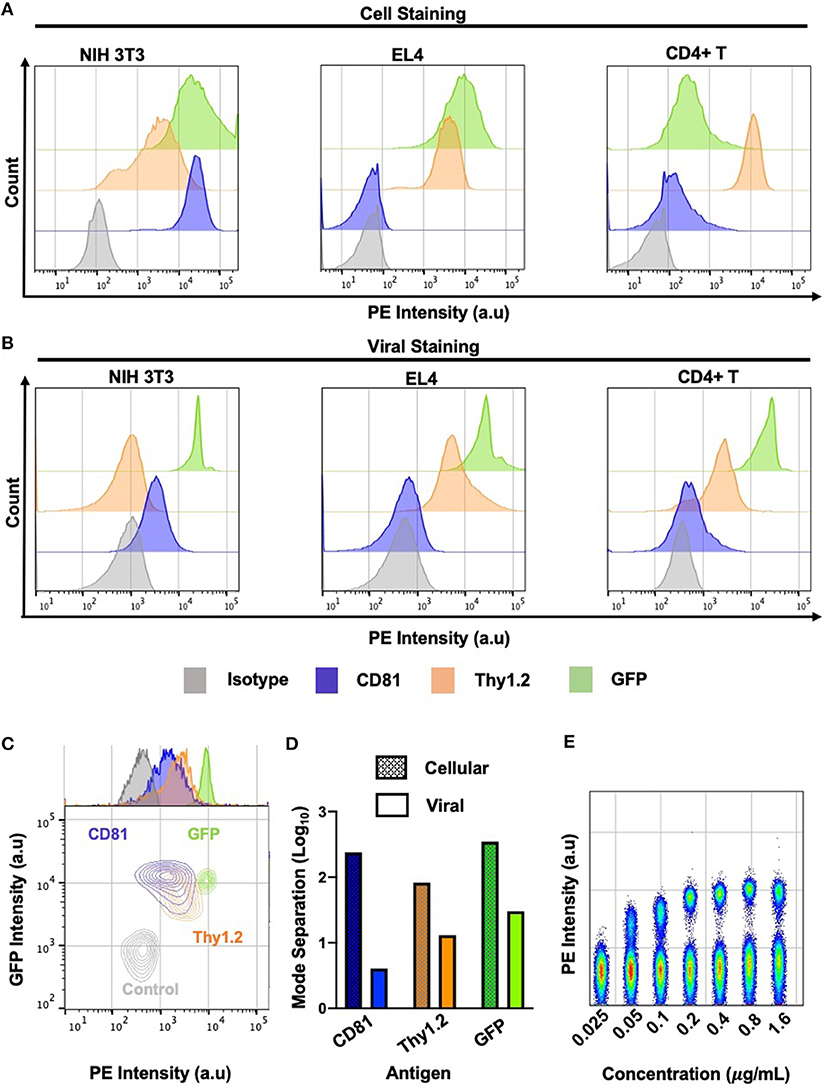
Figure 3. Dynamic range of cell and virus stainings. (A) Phenotypic analysis of labeled infected murine NIH 3T3, EL4, and primary CD4+ T cells by flow cytometry against select cellular antigens of low and high abundance. (B) Phenotypic analysis of labeled MLV virions released from three murine cell types by flow virometry. (C) Overlaid contour plots of labeled virus from (B) where CD81+ is MLV released from NIH 3T3 cells, Thy1.2+ MLV was released from primary CD4+ T cells and GFP+ is MLV released from NIH 3T3 cell. Control MLVnoGFP virus released from NIH 3T3 was labeled with an GFP-PE antibody. (D) Mode separation between positive and negative labeled cells (dotted) and virions (solid color) from (C). (E) Titration of anti-GFP PE antibody from 0.025 to 1.6 μg/ml. Staining performed on a mixture of equal proportions of MLVnoGFP and MLVsfGFP virus particles.
Detection and Quantification of Surface Proteins on Cells and Progeny Virions
Next, we performed a phenotypic screen of surface antigens with a panel of 15 antibodies on three uninfected or infected cell types, and also on the produced virions (Figure 4). Targets for these antibodies were selected based on their previously described incorporation into HIV-1's and EV's envelope, their abundance as tissue specific markers and as proteins that preferentially partition to lipid rafts (11, 22, 25, 29, 40, 46). We present the data as a heatmap of median fluorescence intensity. Our assessment of surface antigens on non-infected and chronically infected NIH 3T3 fibroblast cells with MLV and MLVgg- demonstrate similar phenotypic profiles (Figure 4A). NIH 3T3 cells expressed tetraspanin-enriched microdomains (TEMs) antigens CD81, CD63, and CD9, the CD29 integrin marker, and lipid raft markers CD55, and Thy1.2. Of note, CD81 and CD63 were the most abundantly expressed cell-derived markers while sfGFP was the most abundant antigen on the surface of the chronically infected NIH 3T3 cells. Uninfected and chronically infected EL4 T lymphocytes expressed similar phenotypic profiles, with CD45, Thy1.2, and LFA-1 being the most abundantly detected antigens, followed by CD3 and CXCR4 (Figure 4A). There was generally low expression of other lipid raft marker (CD55, CD59, and CD317) on EL4 cells. Lastly, primary CD4+ T cells displayed a similar phenotypic profile to EL4 T cells, with the expression of CD45, Thy1.2, and LFA-1 being the highest, followed by CD3, CD29, and CD9. There was minimal expression of CD81, CD63, and CD55 on the primary CD4+ T cells. We noted similar phenotypic profiles between MLV and MLVgg-infected cells (Table 2).
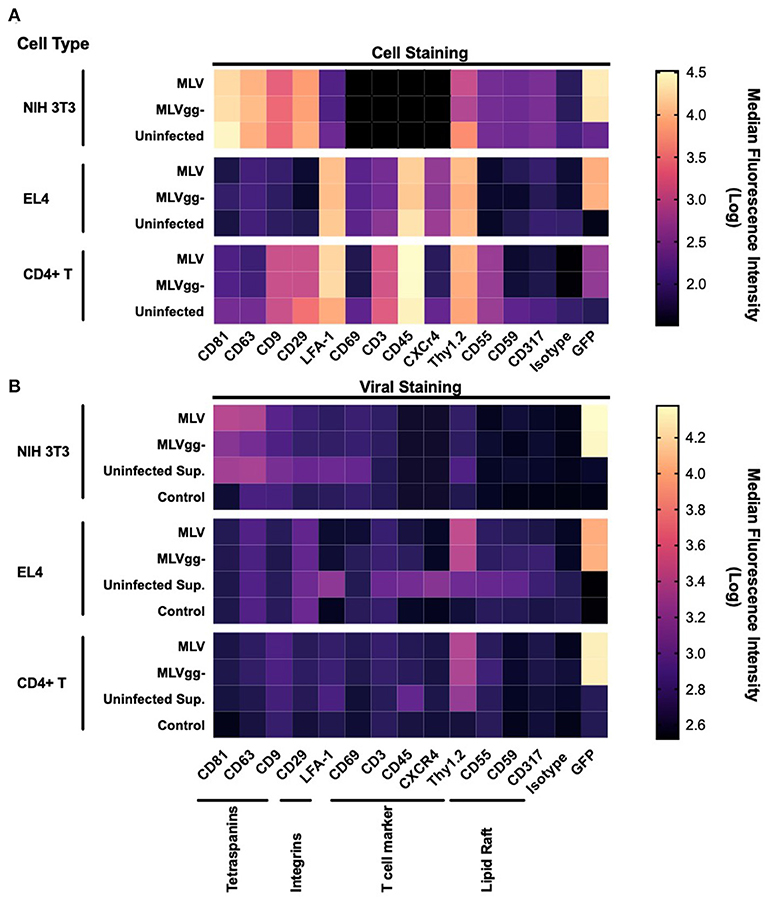
Figure 4. Phenotypic analysis of surface antigens on murine cells and on MLV and MLVgg- particles. (A) Heat map of surface antigens analyzed on uninfected and infected NIH 3T3, EL4, and primary CD4+ T cells with a panel of 15 PE-conjugated antibodies. (B) Heat map of surface antigen expression intensity on MLV and MLVgg- virions released from infected NIH 3T3, EL4, and primary CD4+ T cells. Supernatants from uninfected cells were also analyzed (Uninfected Sup.). Media-only with antibody was used to assess background fluorescence and non-specific binding. Tile intensity is the median fluorescence intensity transformed into log. Presented data was compiled from 3 to 4 experiments.
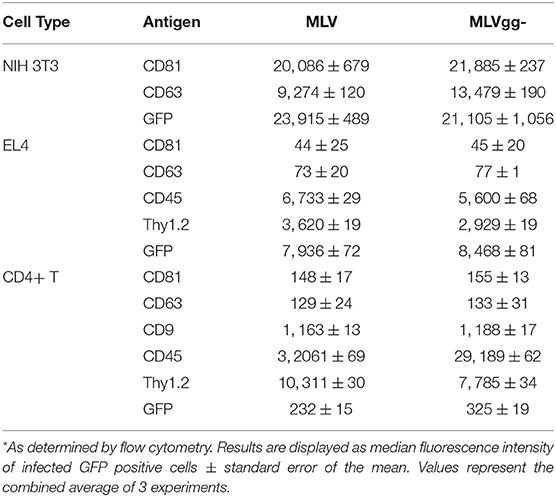
Table 2. Median fluorescence intensity of infected cells stained for select antigens*.
To measure host-derived antigens on the surface of individual MLV particles, the viral supernatant collected from these infected cells was stained using the same panel of antibodies used for the phenotyping of the infected cells (Figure 4B). From the 15 stainings that were performed on MLV and MLVgg- virions, we noted that Env-sfGFP was the most abundantly expressed protein on the viral envelope (Figure 4B). Intriguingly, while Env-sfGFP was the highest expressed cellular antigen on chronically infected NIH 3T3 cells, its abundance was lower on infected primary CD4+ T cells. Nevertheless, despite its varied expression between cell types, sfGFP-Env is expressed at similar levels on the virions released from these cells (Figure 3B). Analysis of virions released from NIH 3T3 show presence of the highly abundant cellular tetraspanin markers CD81 and CD63 on the viral envelope of both variants (Figure 4B). These differences can be visualized more clearly when the data is presented as contour plots (Figure 5A). Other cellular markers present on the cell surface were not detected in the viral envelope of MLV. The characterization of virus released from EL4 cells revealed the presence of the highly abundant mouse T cell and lipid raft marker Thy1.2 (Figure 4B). Intriguingly, low levels of the T cell CD45 marker were detected on MLV virions (Figure 4B, Tables 3, 4). Lastly, we detected an overall low abundance of the tetraspanin marker CD63 (Figure 4B), suggestive of possible viral egress through the endosomal pathway as this antigen was not present on the cell surface (Figures 4A, 6) (47, 48). For this purpose, we calculated the virus-to-cell surface antigen expression ratio between MLV and MLVgg- to that of their respective producer cells (Figure 6). Next, we evaluated whether retroviral phenotypic analysis using FVM could be performed directly on virions released from primary cells infected ex vivo. Similar to the results with virus released from EL4 cells, Thy1.2 was the most concentrated host-derived protein on the viral envelope, followed by CD45, and CD9 (Figure 4B). Despite CD45 being among the most abundantly expressed antigens on lymphocytes (Figure 4A), CD45 is observed at low abundance on virions released from both EL4 and CD4+ T cells (Figure 6, Tables 3, 4). Interestingly, although only a portion of the cells staining positive for tetraspanin markers CD81 and CD63, we observe a preferential uptake or enrichment of these TEM markers on the surface of the virus (Figure 6).
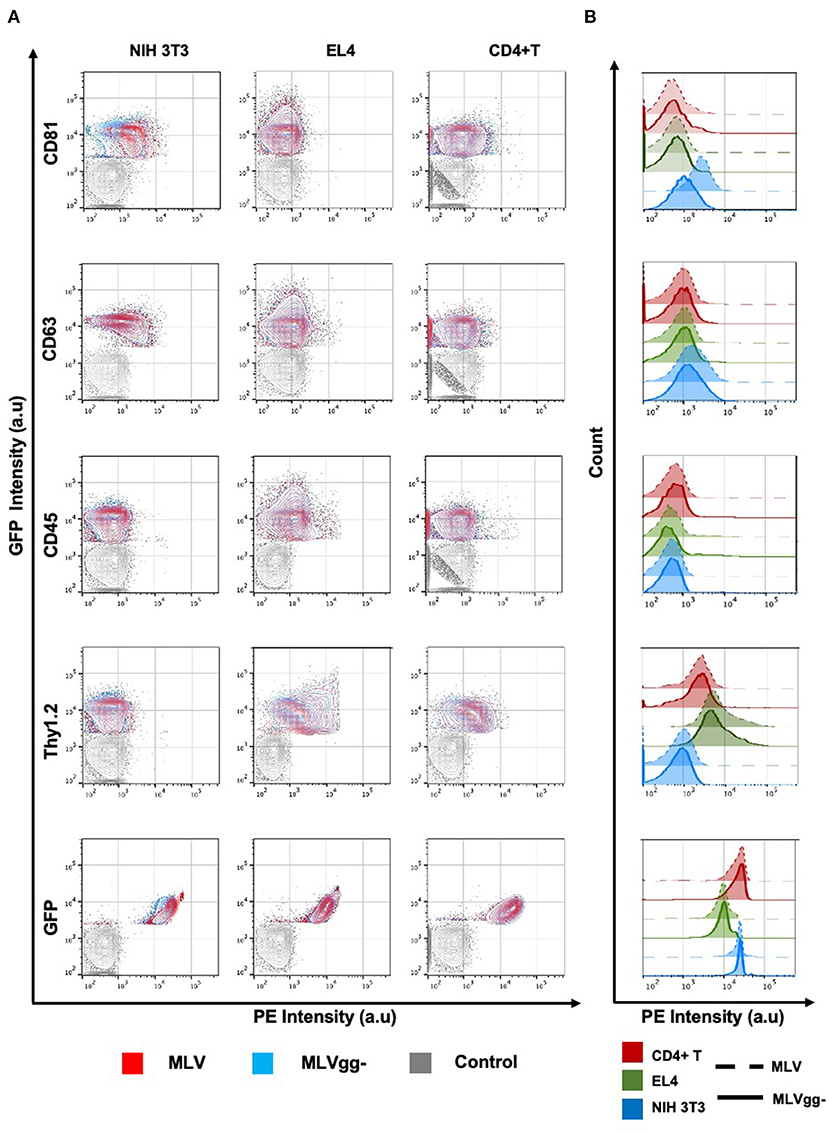
Figure 5. Analysis of antigenic heterogeneity between MLV and MLVgg- virions released from murine cells. (A) Contour plots of superimposed labeled MLV, MLVgg- and media-only with antibody control (Control). Antigenic heterogeneity varies between the two variants and the cell types that virions were released from. (B) Histogram plot of labeled MLV and MLVgg- against selected antigens from (A) released from three different murine cell types: NIH 3T3, EL4 and primary CD4+ T cells.
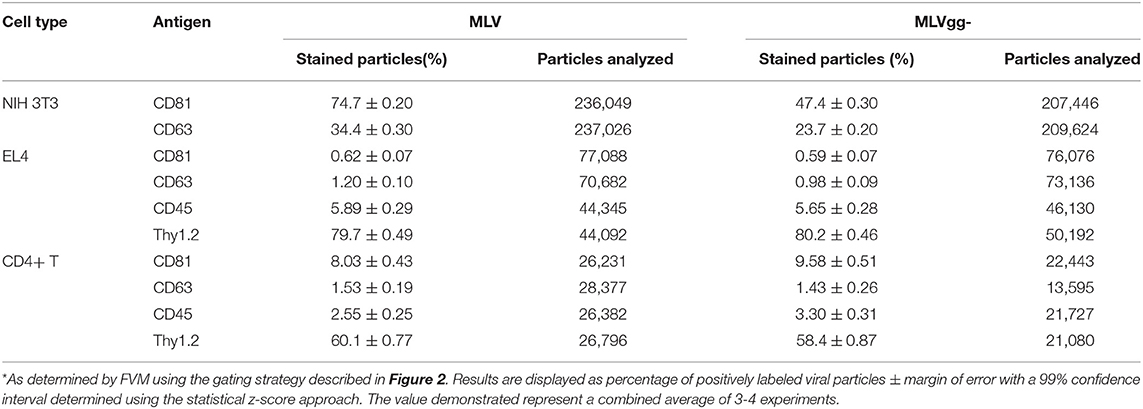
Table 3. MLV particles positively stained for select antigens*.
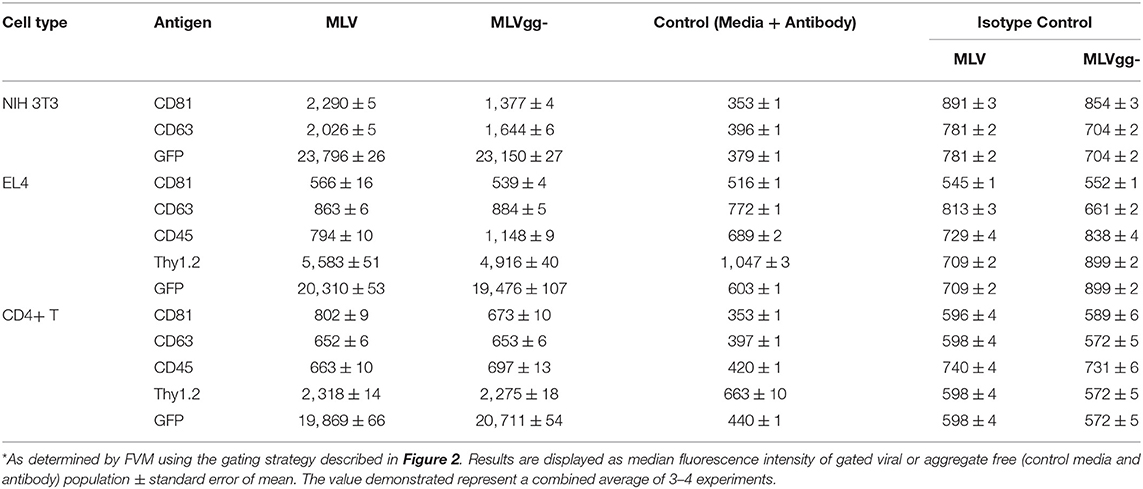
Table 4. Median fluorescence intensity of MLV particles stained for select antigens*.
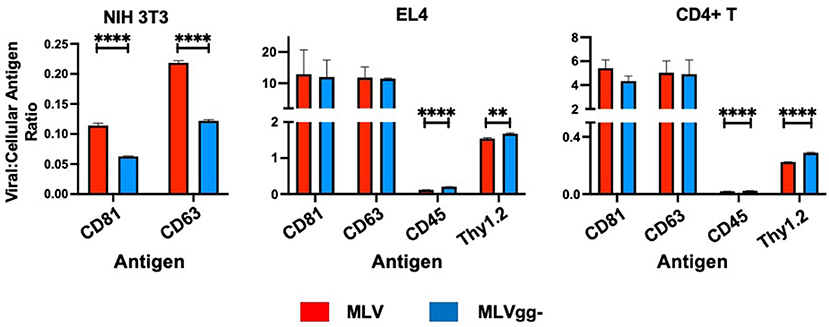
Figure 6. Surface antigen expression levels in the viral envelope relative to that of their infected cell of origin. Bar graphs of virus-to-cell surface antigen expression ratios and antigen expression differences between MLV and MLVgg- released from NIH 3T3, EL4 and primary CD4+ T cells. The median fluorescent intensity of antigens expressed on MLV and MLVgg- was divided by the median fluorescence intensity of cognate antigens expressed on their respective producer cell. Presented data was compiled from 3 experiments. Statistical analysis was performed with the multiple unpaired t-test with Welch's correction. Significant antigen expression enrichment observed on the MLV relative to MLVgg- for NIH 3T3 cells for CD81 (p < 0.00001) and CD63 (p < 0.00001). In contrast, virus-to-cell surface antigen expression levels were found to be significantly enriched on the MLVgg- for: EL4 cells: CD45 (p < 0.00001), Thy1.2 (p < 0.0001); and primary CD4+ T cell cells: CD45 (p < 0.00001) and Thy1.2 (p < 0.00001). **p < 0.0001, ****p < 0.00001.
GlycoGag Modulates Host-Derived Antigens on the Surface of MLV
We next compared host-derived antigen expression between MLV and MLVgg- released from the three cell types. FVM analysis revealed that CD81 and CD63 on the surface of virus released from NIH 3T3 cells were present on 74.7, and 34.4% of MLV virions, and on 47.6 and 23.6% of MLVgg- virions, respectively (Figure 5A, Table 3). Furthermore, we measured a 66% increase of CD81 antigen abundance on MLV particles compared to MLVgg- virions released from NIH 3T3 cells. CD63 was also increased by 23% on the viral envelope of MLV virions (Figure 7A).
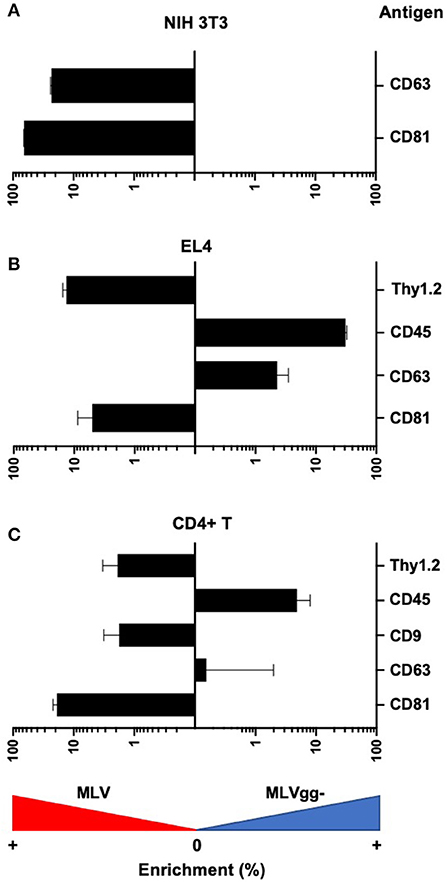
Figure 7. Differences in antigen expression between MLV and MLVgg- virions released from different murine cells. Bar graph of the enrichment in surface antigen expression between MLV and MLVgg- released from (A) NIH 3T3, (B) EL4, and (C) primary CD4+ T cells. Pooled median fluorescence intensity of antigens expressed on MLV was divided by the pooled median fluorescence intensity of antigens expressed on MLVgg-. Statistical analysis was performed with the Mann-Whitney test. Significant antigen enrichment observed on the MLV viral envelope relative to MLVgg- for virions released from NIH 3T3 cells: CD81 (p < 0.0001), CD63 (p < 0.0001); EL4 cells: CD81 (p < 0.0001), CD63 (p < 0.0001), Thy1.2 (p < 0.0001); primary CD4+ T cells: CD81 (p < 0.0001) and Thy1.2 (p < 0.001). In contrast, CD45 was found to be significantly enriched in the MLVgg- viral envelope relative to MLV for virions released from EL4 cells (p < 0.0001) and primary CD4+ T cell cells (p < 0.0001). Results are displayed as median fluorescence intensity of gated viral population ± standard error margin. Presented data was compiled from 3 to 4 experiments.
Similarly, we reported an ~20% increase of CD81 protein expression on MLV over MLVgg- virions released from primary CD4+ T cells, while CD63 abundance was comparable between the two viruses (Figure 7C). The antigenic distribution of CD81 and CD63 on MLV virions released from CD4+ T cells showed one dominant monodisperse population and a separate discrete subpopulation expressing an increased PE signal (Figure 5B). Additionally, we detected an ~2% increase of CD9 protein expression on MLV compared to MLVgg- particles released from CD4+ T cells (Figure 7C). Interestingly, CD45 protein expression was significantly increased on MLVgg- particles released from both EL4 and primary CD4+ T infected cells. In particular, we observed a 31% antigen increase on MLVgg- virions produced by EL4 cells, while this increase was less pronounced (~5%) when released from CD4+ T cells (Figures 7B,C).
To help elucidate glycoGag's role on viral budding at lipid rafts microdomains, we labeled MLV particles with antibodies against lipid raft markers CD55, CD59, CD317, and Thy1.2. However, only Thy1.2 was expressed on all cell types tested, while CD55 was only weakly expressed on NIH 3T3 and primary CD4+ T cells (Figure 4A). Thy1.2 was the only lipid raft marker detected on 79.7 and 80.2%, and 60.1 and 58.4% of MLV and MLVgg- particles released from EL4 and CD4+ T cells, respectively (Table 3). In support of the findings observed by Fan et al. we observed a significantly increased expression of Thy1.2 on MLV virions released from EL4 cells (~14%) while this increase was less pronounced with virus released from primary CD4+ T cells (~2%) (Figures 7B,C) (11). We consistently measured a slightly elevated fluorescent intensity on wild-type MLV, however whether this small difference is biologically relevant is unknown. Analysis of Thy1.2 expression revealed a highly heterogeneous distribution of this cellular antigen between the two MLV variants released from EL4 and primary CD4+ T infected cells (Figure 5B). Taken together, our results reveal a selective increase in TEM and Thy1.2 antigen incorporation within the viral envelope of MLV virions produced by NIH 3T3, EL4, and primary CD4+ T cells. Our findings provide support that glycoGag can facilitate the incorporation of specific host-derived proteins during viral assembly and egress.
Discussion
The aim of our study was to better understand host antigen uptake by retroviruses and the effect of the glycoGag accessory protein on this process. We revealed that the abundance of antigen expression on the surface of a cell does not necessarily result in proportional expression on the surface of a retrovirus. An important challenge in this study was that the dynamic range for the detection of labeled antigens on a virus is limited by a much smaller surface area compared to that of a cell, thus resulting in poor sensitivity to detect antigens with very low levels of expression. This challenge is highlighted when a comparison between cellular and viral stainings is performed. For cells, we observed a ~2.5 log separation between the negative and positive populations for the most abundant antigens we tested. In contrast, for viral stainings this was reduced to a ~1.5 log separation at most. For highly expressed cellular markers such as CD81 and Thy1.2, where the majority of the viral population was positively labeled, we report an even greater decrease in the ratio of separation between positive and negative signals relative to their cellular expression (Figure 3).
In some cases, we detected highly expressed cell-derived markers on the virus surface in a similar proportion to the antigen density on the cell. Interestingly, we also observed instances where there was either a relative enrichment of antigens on the surface of the virus compared to the cognate infected cell, or the opposite (Figure 6). In particular, despite high expression on cells, we did not detect CD29 or LFA-1 in the viral envelope of virions released from NIH 3T3 or EL4 and primary CD4+ T cells (Figure 4). Intriguingly, we revealed low levels of CD45 on MLV released from infected lymphocytes. This is in contrast to its absence from the HIV-1 envelope (25, 28, 29, 49, 50). CD45 is abundantly expressed on the surface of lymphocytes, covering as much as 10–25% of the total surface area (51). As such, if the viral egress mechanism was passive, a higher relative amount of virion incorporated CD45 antigen would be expected in the viral envelope. This was not the case in our findings. Taken together, these data indicate a selective process of host protein acquisition that can enrich or decrease the incorporation specific host-derived proteins found in the virus envelope. Prior studies have demonstrated that the site of retroviral egress on the cell surface, but also alternative egress pathways such as through the endosomal pathway, can influence the type and abundance of host antigens captured in the viral envelope (12, 18, 48, 52–54).
Next, we investigated the influence of glycoGag on host antigen incorporation in the viral envelope, specifically the uptake of lipid raft markers. However, due to low or absent expression of these markers on the cells analyzed in our study, we only measured a significant reduction of the lipid raft marker Thy1.2 on MLVgg- particles released from EL4 T lymphocytes and primary CD4+ T cells. We observed a similar amount of positive labeled Thy1.2 MLV and MLVgg- virions released from infected EL4 and primary CD4+ T cells. However, the increased antigen abundance observed on MLV compared to MLVgg- suggests that glycoGag promotes increased incorporation of Thy1.2, but it must also be considered that the site of egress for MLV virions could have higher Thy1.2 density. Yet, Thy1.2 expression on MLVgg- virions suggests that they egress at sites which Thy1.2 also partitions to and potentially highlights a role for Thy1.2 in viral replication (25, 28, 29, 49, 50). In contrast, we observed a significant enrichment of CD45 protein on MLVgg- particles compared to MLV virions (Figures 7B,C, Table 4). This further supports previous findings, which showed that glycoGag directs viral egress at lipid raft rich microdomains that are generally very poor in CD45 (25, 28, 55).
Furthermore, the HIV-1 gag protein has been shown to induce lipid raft and TEM domain merging at the site of its viral assembly, while in the absence of viral infection these two domains are distinct (46). In addition, Gaudin et al. (40) suggest that some types of retroviruses may induce a similar mechanism of coalescence as they showed labeled virions that were positive for both host-derived CD9 and the lipid raft marker cholera toxin B. As such, glycoGag could also induce a similar reorganization of cellular microdomains. We observed an enrichment of the tetraspanin markers on MLV compared to MLVgg- virions produced from 3T3 NIH cells. Similarly, we noted an increase of CD81 on MLV released from primary CD4+ T cells compared to MLVgg-. These observations highlight how expression of glycoGag influences the uptake of host proteins by viruses that are released from different cell types. Several studies show an effect by glycoGag on viral assembly and the modulation of host proteins to enhance viral pathogenicity (7, 8, 10–12, 15, 16, 37, 56, 57). GlycoGag's evident beneficial function in vivo is further supported by the reversion from a glycoGag-deficient phenotype back to wild-type in mice (7, 14). Thus, this raises the intriguing possibility that the glycoGag protein has evolved functions to positively impact the incorporation of biologically significant cellular proteins to aid in its pathogenicity. Two important questions arise from our observations: 1) whether glycoGag reorganizes cellular microdomains at viral assembly sites, and 2) what are the downstream pathways that govern glycoGag-induced cellular microdomain reorganization. These findings will provide the necessary information for elucidating the pathway by which glycoGag can selectively modulate the uptake of host protein incorporation.
Conclusion
We set out to detect and quantify host-derived antigens on the surface of Moloney MLV and investigate how the virus-encoded accessory protein glycoGag influences this uptake. Here, we revealed a high degree of viral diversity in antigen abundance on the viral envelope when comparing MLV wild-type and glycoGag-deficient variants released from the three murine cell types tested in our study. As such, our analysis at the individual viral particle level shows the extent of viral phenotypic heterogeneity of cell-derived antigens, which is further accentuated by the infected cell type. We uncovered the intriguing possibility that the glycoGag protein plays a role in increasing the incorporation of select host-derived antigens during viral assembly and release. How this heterogeneity in host-derived antigen uptake influences infectivity, pathogenicity and immune escape still remains to be fully assessed.
Data Availability Statement
The raw data supporting the conclusions of this article will be made available by the authors, without undue reservation.
Ethics Statement
The studies involving animals were reviewed and approved by the University of Ottawa Animal Ethics Committee (protocol number ME-133), and were conducted in accordance with the Ontario Animals for Research Act.
Author Contributions
MM performed the experiments, carried out the data analysis, and drafted the manuscript. M-AL designed the study, provided guidance, supervised the data analysis, and drafted the manuscript. All authors approved the submitted version.
Funding
This study was supported by a Discovery grant to M-AL by the Natural Sciences and Engineering Research Council (NSERC) of Canada (#2017-05974).
Conflict of Interest
The authors declare that the research was conducted in the absence of any commercial or financial relationships that could be construed as a potential conflict of interest.
Publisher's Note
All claims expressed in this article are solely those of the authors and do not necessarily represent those of their affiliated organizations, or those of the publisher, the editors and the reviewers. Any product that may be evaluated in this article, or claim that may be made by its manufacturer, is not guaranteed or endorsed by the publisher.
Acknowledgments
MM holds a Queen Elizabeth II Graduate Scholarship in Science and Technology (QEII-GSST). M-AL holds a Canada Research Chair in Molecular Virology and Intrinsic Immunity.
References
1. Edwards SA, Fan H. gag-Related polyproteins of Moloney murine leukemia virus: evidence for independent synthesis of glycosylated and unglycosylated forms. J Virol. (1979) 30:551–63. doi: 10.1128/jvi.30.2.551-563.1979
2. Prats AC, De Billy G, Wang P, Darlix JL. CUG initiation codon used for the synthesis of a cell surface antigen coded by the murine leukemia virus. J Mol Biol. (1989) 205:363–72. doi: 10.1016/0022-2836(89)90347-1
3. Rosales Gerpe MC, Renner TM, Belanger K, Lam C, Aydin H, Langlois MA. N-linked glycosylation protects gammaretroviruses against deamination by APOBEC3 proteins. J Virol. (2015) 89:2342–57. doi: 10.1128/JVI.03330-14
4. Fujisawa R, McAtee FJ, Zirbel JH, Portis JL. Characterization of glycosylated Gag expressed by a neurovirulent murine leukemia virus: identification of differences in processing in vitro and in vivo. J Virol. (1997) 71:5355–60. doi: 10.1128/jvi.71.7.5355-5360.1997
5. Pillemer EA, Kooistra DA, Witte ON, Weissman IL. Monoclonal antibody to the amino-terminal L sequence of murine leukemia virus glycosylated gag polyproteins demonstrates their unusual orientation in the cell membrane. J Virol. (1986) 57:413–21. doi: 10.1128/jvi.57.2.413-421.1986
6. Renner TM, Belanger K, Lam C, Gerpe MCR, McBane JE, Langlois MA. Full-length glycosylated gag of murine leukemia virus can associate with the viral envelope as a type i integral membrane protein. J Virol. (2018) 92:e01530–17. doi: 10.1128/JVI.01530-17
7. Chun R, Fan H. Recovery of glycosylated gag virus from mice infected with a glycosylated gag-negative mutant of moloney murine leukemia virus. J Biomed Sci. (1994) 1:218–23. doi: 10.1159/000456794
8. Corbin A, Prats AC, Darlix JL, Sitbon M. A nonstructural gag-encoded glycoprotein precursor is necessary for efficient spreading and pathogenesis of murine leukemia viruses. J Virol. (1994) 68:3857–67. doi: 10.1128/jvi.68.6.3857-3867.1994
9. Fan H, Chute H, Chao E, Feuerman M. Construction and characterization of Moloney murine leukemia virus mutants unable to synthesize glycosylated gag polyprotein. Proc Natl Acad Sci USA. (1983) 80:5965–9. doi: 10.1073/pnas.80.19.5965
10. Low A, Datta S, Kuznetsov Y, Jahid S, Kothari N, McPherson A, et al. Mutation in the glycosylated gag protein of murine leukemia virus results in reduced in vivo infectivity and a novel defect in viral budding or release. J Virol. (2007) 81:3685–92. doi: 10.1128/JVI.01538-06
11. Nitta T, Kuznetsov Y, McPherson A, Fan H. Murine leukemia virus glycosylated Gag (gPr80gag) facilitates interferon-sensitive virus release through lipid rafts. Proc Natl Acad Sci USA. (2010) 107:1190–5. doi: 10.1073/pnas.0908660107
12. Nitta T, Tam R, Kim JW, Fan H. The cellular protein La functions in enhancement of virus release through lipid rafts facilitated by murine leukemia virus glycosylated Gag. mBio. (2011) 2:e00341–10. doi: 10.1128/mBio.00341-10
13. Schwartzberg P, Colicelli J, Goff SP. Deletion mutants of Moloney murine leukemia virus which lack glycosylated gag protein are replication competent. J Virol. (1983) 46:538–46. doi: 10.1128/jvi.46.2.538-546.1983
14. Stavrou S, Nitta T, Kotla S, Ha D, Nagashima K, Rein AR, et al. Murine leukemia virus glycosylated Gag blocks apolipoprotein B editing complex 3 and cytosolic sensor access to the reverse transcription complex. Proc Natl Acad Sci USA. (2013) 110:9078–83. doi: 10.1073/pnas.1217399110
15. Ahi YS, Zhang S, Thappeta Y, Denman A, Feizpour A, Gummuluru S, et al. Functional interplay between murine leukemia virus glycogag, serinc5, and surface glycoprotein governs virus entry, with opposite effects on gammaretroviral and ebolavirus glycoproteins. mBio. (2016) 7:e01985–16. doi: 10.1128/mBio.01985-16
16. Li S, Ahmad I, Shi J, Wang B, Yu C, Zhang L, et al. Murine leukemia virus glycosylated gag reduces murine SERINC5 protein expression at steady-state levels via the endosome/lysosome pathway to counteract SERINC5 antiretroviral activity. J Virol. (2019) 93:e01651–18. doi: 10.1128/JVI.01651-18
17. Shi J, Xiong R, Zhou T, Su P, Zhang X, Qiu X, et al. HIV-1 nef antagonizes SERINC5 restriction by downregulation of SERINC5 via the endosome/lysosome system. J Virol. (2018) 92:e00196–18. doi: 10.1128/JVI.00196-18
18. Freed EO. HIV-1 assembly, release and maturation. Nat Rev Microbiol. (2015) 13:484–96. doi: 10.1038/nrmicro3490
19. Renner TM, Tang VA, Burger D, Langlois MA. Intact viral particle counts measured by flow virometry provide insight into the infectivity and genome packaging efficiency of moloney murine leukemia virus. J Virol. (2020) 94:e01600–19. doi: 10.1128/JVI.01600-19
20. Tang VA, Renner TM, Fritzsche AK, Burger D, Langlois MA. Single-particle discrimination of retroviruses from extracellular vesicles by nanoscale flow cytometry. Sci Rep. (2017) 7:17769. doi: 10.1038/s41598-017-18227-8
21. Tang VA, Fritzsche AK, Renner TM, Burger D, Lannigan JA, Brittain GC, et al. engineered retroviruses as fluorescent biological reference particles for nanoscale flow cytometry. bioRxiv. (2019) 2019:614461. doi: 10.1101/614461
22. Tremblay MJ, Fortin JF, Cantin R. The acquisition of host-encoded proteins by nascent HIV-1. Immunol Today. (1998) 19:346–51. doi: 10.1016/S0167-5699(98)01286-9
23. Burnie J, Guzzo C. The incorporation of host proteins into the external HIV-1 envelope. Viruses. (2019) 11:86. doi: 10.3390/v11010085
24. Cantin R, Methot S, Tremblay MJ. Plunder and stowaways: incorporation of cellular proteins by enveloped viruses. J Virol. (2005) 79:6577–87. doi: 10.1128/JVI.79.11.6577-6587.2005
25. Esser MT, Graham DR, Coren LV, Trubey CM, Bess JW Jr, et al. Differential incorporation of CD45, CD80 (B7-1), CD86 (B7-2), and major histocompatibility complex class I and II molecules into human immunodeficiency virus type 1 virions and microvesicles: implications for viral pathogenesis and immune regulation. J Virol. (2001) 75:6173–82. doi: 10.1128/JVI.75.13.6173-6182.2001
26. Jalaguier P, Cantin R, Maaroufi H, Tremblay MJ. Selective acquisition of host-derived ICAM-1 by HIV-1 is a matrix-dependent process. J Virol. (2015) 89:323–36. doi: 10.1128/JVI.02701-14
27. Lawn SD, Roberts BD, Griffin GE, Folks TM, Butera ST. Cellular compartments of human immunodeficiency virus type 1 replication in vivo: determination by presence of virion-associated host proteins and impact of opportunistic infection. J Virol. (2000) 74:139–45. doi: 10.1128/JVI.74.1.139-145.2000
28. Nguyen DH, Hildreth JE. Evidence for budding of human immunodeficiency virus type 1 selectively from glycolipid-enriched membrane lipid rafts. J Virol. (2000) 74:3264–72. doi: 10.1128/JVI.74.7.3264-3272.2000
29. Orentas RJ, Hildreth JE. Association of host cell surface adhesion receptors and other membrane proteins with HIV and SIV. AIDS Res Hum Retroviruses. (1993) 9:1157–65. doi: 10.1089/aid.1993.9.1157
30. Abdel-Mohsen M, Kuri-Cervantes L, Grau-Exposito J, Spivak AM, Nell RA, Tomescu C, et al. CD32 is expressed on cells with transcriptionally active HIV but does not enrich for HIV DNA in resting T cells. Sci Transl Med. (2018) 10:eaar6759. doi: 10.1126/scitranslmed.aar6759
31. Ding L, Derdowski A, Wang JJ, Spearman P. Independent segregation of human immunodeficiency virus type 1 Gag protein complexes and lipid rafts. J Virol. (2003) 77:1916–26. doi: 10.1128/JVI.77.3.1916-1926.2003
32. Graham DR, Chertova E, Hilburn JM, Arthur LO, Hildreth JE. Cholesterol depletion of human immunodeficiency virus type 1 and simian immunodeficiency virus with beta-cyclodextrin inactivates and permeabilizes the virions: evidence for virion-associated lipid rafts. J Virol. (2003) 77:8237–48. doi: 10.1128/JVI.77.15.8237-8248.2003
33. Waheed AA, Freed EO. The Role of Lipids in Retrovirus Replication. Viruses. (2010) 2:1146–80. doi: 10.3390/v2051146
34. Chaudhuri R, Lindwasser OW, Smith WJ, Hurley JH, Bonifacino JS. Downregulation of CD4 by human immunodeficiency virus type 1 Nef is dependent on clathrin and involves direct interaction of Nef with the AP2 clathrin adaptor. J Virol. (2007) 81:3877–90. doi: 10.1128/JVI.02725-06
35. Garcia JV, Miller AD. Serine phosphorylation-independent downregulation of cell-surface CD4 by nef. Nature. (1991) 350:508–11. doi: 10.1038/350508a0
36. Haller C, Muller B, Fritz JV, Lamas-Murua M, Stolp B, Pujol FM, et al. HIV-1 Nef and Vpu are functionally redundant broad-spectrum modulators of cell surface receptors, including tetraspanins. J Virol. (2014) 88:14241–57. doi: 10.1128/JVI.02333-14
37. Ahi YS, Yimer D, Shi G, Majdoul S, Rahman K, Rein A, et al. IFITM3 reduces retroviral envelope abundance and function and is counteracted by glycoGag. mBio. (2020) 11:e03088–19. doi: 10.1128/mBio.03088-19
38. Lippe R. Flow virometry: a powerful tool to functionally characterize viruses. J Virol. (2018) 92:e01765–17. doi: 10.1128/JVI.01765-17
39. Morales-Kastresana A, Telford B, Musich TA, McKinnon K, Clayborne C, Braig Z, et al. Labeling extracellular vesicles for nanoscale flow cytometry. Sci Rep. (2017) 7:1878. doi: 10.1038/s41598-017-01731-2
40. Gaudin R, Barteneva NS. Sorting of small infectious virus particles by flow virometry reveals distinct infectivity profiles. Nat Commun. (2015) 6:6022. doi: 10.1038/ncomms7022
41. Langlois MA, Kemmerich K, Rada C, Neuberger MS. The AKV murine leukemia virus is restricted and hypermutated by mouse APOBEC3. J Virol. (2009) 83:11550–9. doi: 10.1128/JVI.01430-09
42. Tsuruyama T, Liu W, Yoshikawa K. In vitro murine leukemia retroviral integration and structure fluctuation of target DNA. PLoS One. (2012) 7:e31533. doi: 10.1371/journal.pone.0031533
43. Brittain GCt, Chen YQ, Martinez E, Tang VA, Renner TM, Langlois MA, et al. A novel semiconductor-based flow cytometer with enhanced light-scatter sensitivity for the analysis of biological nanoparticles. Sci Rep. (2019) 9:16039. doi: 10.1038/s41598-019-52366-4
44. Forster F, Medalia O, Zauberman N, Baumeister W, Fass D. Retrovirus envelope protein complex structure in situ studied by cryo-electron tomography. Proc Natl Acad Sci USA. (2005) 102:4729–34. doi: 10.1073/pnas.0409178102
45. Yeager M, Wilson-Kubalek EM, Weiner SG, Brown PO, Rein A. Supramolecular organization of immature and mature murine leukemia virus revealed by electron cryo-microscopy: implications for retroviral assembly mechanisms. Proc Natl Acad Sci USA. (1998) 95:7299–304. doi: 10.1073/pnas.95.13.7299
46. Hogue IB, Grover JR, Soheilian F, Nagashima K, Ono A. Gag induces the coalescence of clustered lipid rafts and tetraspanin-enriched microdomains at HIV-1 assembly sites on the plasma membrane. J Virol. (2011) 85:9749–66. doi: 10.1128/JVI.00743-11
47. Molle D, Segura-Morales C, Camus G, Berlioz-Torrent C, Kjems J, Basyuk E, et al. Endosomal trafficking of HIV-1 gag and genomic RNAs regulates viral egress. J Biol Chem. (2009) 284:19727–43. doi: 10.1074/jbc.M109.019844
48. Morita E, Sundquist WI. Retrovirus budding. Annu Rev Cell Dev Biol. (2004) 20:395–425. doi: 10.1146/annurev.cellbio.20.010403.102350
49. Arakelyan A, Fitzgerald W, Margolis L, Grivel JC. Nanoparticle-based flow virometry for the analysis of individual virions. J Clin Invest. (2013) 123:3716–27. doi: 10.1172/JCI67042
50. Trubey CM, Chertova E, Coren LV, Hilburn JM, Hixson CV, Nagashima K, et al. Quantitation of HLA class II protein incorporated into human immunodeficiency type 1 virions purified by anti-CD45 immunoaffinity depletion of microvesicles. J Virol. (2003) 77:12699–709. doi: 10.1128/JVI.77.23.12699-12709.2003
51. Horejši V. The leucocyte antigen factsjournal. Immunol Today. (1998) 244–7. doi: 10.1016/S0167-5699(97)01240-1
52. Dowlatshahi DP, Sandrin V, Vivona S, Shaler TA, Kaiser SE, Melandri F, et al. ALIX is a Lys63-specific polyubiquitin binding protein that functions in retrovirus budding. Dev Cell. (2012) 23:1247–54. doi: 10.1016/j.devcel.2012.10.023
53. Leung K, Kim JO, Ganesh L, Kabat J, Schwartz O, Nabel GJ. HIV-1 assembly: viral glycoproteins segregate quantally to lipid rafts that associate individually with HIV-1 capsids and virions. Cell Host Microbe. (2008) 3:285–92. doi: 10.1016/j.chom.2008.04.004
54. Ashok A, Hegde RS. Prions and retroviruses: an endosomal rendezvous? EMBO Rep. (2006) 7:685–7. doi: 10.1038/sj.embor.7400749
55. Liao Z, Cimakasky LM, Hampton R, Nguyen DH, Hildreth JE. Lipid rafts and HIV pathogenesis: host membrane cholesterol is required for infection by HIV type 1. AIDS Res Hum Retroviruses. (2001) 17:1009–19. doi: 10.1089/088922201300343690
56. Pizzato M. MLV glycosylated-Gag is an infectivity factor that rescues Nef-deficient HIV-1. Proc Natl Acad Sci USA. (2010) 107:9364–9. doi: 10.1073/pnas.1001554107
Keywords: Murine Leukemia Virus (MLV), glycoGag, retroviruses, viral envelope, flow virometry
Citation: Maltseva M and Langlois M-A (2021) Influence of GlycoGag on the Incorporation of Host Membrane Proteins Into the Envelope of the Moloney Murine Leukemia Virus. Front. Virol. 1:747253. doi: 10.3389/fviro.2021.747253
Received: 26 July 2021; Accepted: 04 October 2021;
Published: 29 October 2021.
Edited by:
Masaaki Miyazawa, Kindai University, JapanReviewed by:
Wibke Bayer, Essen University Hospital, GermanyCeri Alan Fielding, Cardiff University, United Kingdom
Christine Kozak, National Institutes of Health (NIH), United States
Copyright © 2021 Maltseva and Langlois. This is an open-access article distributed under the terms of the Creative Commons Attribution License (CC BY). The use, distribution or reproduction in other forums is permitted, provided the original author(s) and the copyright owner(s) are credited and that the original publication in this journal is cited, in accordance with accepted academic practice. No use, distribution or reproduction is permitted which does not comply with these terms.
*Correspondence: Marc-André Langlois, langlois@uottawa.ca