Reliability of Wastewater Analysis for Monitoring COVID-19 Incidence Revealed by a Long-Term Follow-Up Study
 Rafael Sanjuán
 Pilar Domingo-Calap
- Institute for Integrative Systems Biology (I2SysBio), Universitat de València and Consejo Superior de Investigaciones Científicas (CSIC), València, Spain
Wastewater-based epidemiology has been used for monitoring human activities and waterborne pathogens. Although wastewaters can also be used for tracking SARS-CoV-2 at the population level, the reliability of this approach remains to be established, especially for early warning of outbreaks. We collected 377 samples from different treatment plants processing wastewaters of >1 million inhabitants in Valencia, Spain, between April 2020 and March 2021. Samples were cleaned, concentrated, and subjected to RT-qPCR to determine SARS-CoV-2 concentrations. These data were compared with cumulative disease notification rates over 7 and 14 day periods. We amplified SARS-CoV-2 RNA in 75% of the RT-qPCRs, with an estimated detection limit of 100 viral genome copies per liter (gc/L). SARS-CoV-2 RNA concentration correlated strongly with disease notification rates over 14-day periods (Pearson r = 0.962, P < 0.001). A concentration >1000 gc/L showed >95% sensitivity and specificity as an indicator of more than 25 new cases per 100,000 inhabitants. Albeit with slightly higher uncertainty, these figures were reproduced using a 7-day period. Time series were similar for wastewaters data and declared cases, but wastewater RNA concentrations exhibited transient peaks that were not observed in declared cases and preceded major outbreaks by several weeks. In conclusion, wastewater analysis provides a reliable tool for monitoring COVID-19, particularly at low incidence values, and is not biased by asymptomatic cases. Moreover, this approach might reveal previously unrecognized features of COVID-19 transmission.
Introduction
The COVID-19 pandemic has enforced severe epidemiological control measures in many countries, including restrictions on population movement, lockdowns, and reduced social and economic activities. SARS-CoV-2 is an airborne virus that replicates in the respiratory tract, but also in other body compartments such as the intestinal mucosa. As a result, viral material is excreted through feces and other specimens such as urine or saliva (1, 2). This offers the possibility of monitoring the presence of SARS-CoV-2 at the population level using wastewater analysis (3–14). Previous work has carried out short-term follow-ups including treatment plants in the Frankfurt metropolitan area (Germany) from March to September 2020 (15), in San Diego (USA) from July to October 2020 (16), in Brisbane, Queensland (Australia) from February to May 2020 (17), in Paris (France) from March to April 2020 (18), in Santa Catarina (Brazil) from October 2019 to March 2020 (19), and in Barcelona (Spain) from April to July 2020 (20).
These works suggest that wastewater analysis can provide useful epidemiological information. However, at present, the observed correlation between viral RNA concentration in wastewaters and declared COVID-19 cases has not been high enough to achieve this goal (21, 22). This might reflect intrinsic limitations to the method or a lack of sufficient sampling effort. Another open question is whether wastewaters can anticipate COVID-19 incidence trends and, thus, can serve as an early warning tool (23, 24). Some studies suggest anticipation of 2–4 days based on short-term follow-ups, with variations depending on the period under study (25, 26). However, a caveat concerning these analyses is that COVID-19 diagnosis was underreported during the early stages of the pandemics, since systematic PCR testing of suspected cases was not efficiently implemented at that time. For instance, high levels of viral RNA were found in wastewaters collected during early March 2020 in the metropolitan area of Valencia, Spain, whereas declared cases lagged weeks behind due to poor testing (12). Finally, wastewaters might reveal previously unappreciated aspects of COVID-19 epidemiology. Since approximately half of the infections are asymptomatic and disease severity is strongly age-dependent, large fractions of young populations are likely to escape diagnosis, and wastewater analysis could in principle help us correct this detection bias. In addition, wastewater analysis could potentially detect viral shedding prior to the onset of symptoms, potentially anticipating the epidemiological trends obtained from individual COVID-19 testing (27).
Here, we use wastewaters to carry out a nearly one-year follow-up study of SARS-CoV-2 incidence in a large city. To achieve this goal, we monitored treatment plants in the metropolitan area of Valencia, Spain, from April 2020 to March 2021. We found that SARS-CoV-2 RNA concentration in wastewaters was strongly correlated with the number of declared cases over 7- and 14-day periods. Consequently, wastewaters provided an accurate indicator of COVID-19 incidence. Throughout multiple epidemic waves, we found no conclusive evidence supporting the ability of SARS-CoV-2 RNA concentration in wastewaters to systematically anticipate an increase in the number of declared cases. Nevertheless, wastewater SARS-CoV-2 RNA concentrations experienced transient peaks preceding such waves, a unique feature that was not revealed by the analysis of declared cases, and that warrants future investigation.
Materials and Methods
Wastewater Sampling
Wastewaters from the Pinedo 1, Pinedo 2, and Quart-Benàger wastewater treatment plants (WWTP) in the metropolitan area of Valencia (Spain) were sampled (200 mL) by grabbing or taking 4 h composite samples between 7 and 11 am. Samples were kept at 4 °C and processed in the laboratory within 24 h of collection. Before processing, waters were spiked with 105 plaque forming units of transmissible gastroenteritis coronavirus (TGEV) as an internal positive control. Then, samples were spun at 3000 × g for 10 min at 4°C, and the supernatant was filtered through 0.45 μm pore filters to remove large debris. Subsequently, 35 mL of filtered wastewater was centrifuged at 80,000 g, 3.5 h, 4°C to concentrate viral particles. Finally, the supernatant was removed and the pellet was resuspended in 500 μL phosphate-buffered saline (PBS).
RNA Extraction and SARS-CoV-2 RT-qPCR
RNA extraction was performed with the Nucleospin RNA Virus Kit (Macherey-Nagel) following the manufacturer's instructions. RT-qPCR was carried out using the GoTaq® Probe 1-Step RT-qPCR System (Promega) and the U.S. Center for Disease Control N1 and N2 primers set (2019-nCoV CDC EUA Kit, IDT). For each RT-qPCR run, calibration curves for N1 and N2 were performed using the 2019-nCoV_N_Positive Control provided in the kit. Five different RNA concentrations of this control (ranging between 54 and 540,000 genomic copies) were used to calibrate the curve. The coefficient of determination in these calibrations averaged r2 = 0.990 (range: 0.928–0.999) for N1 and, similarly, r2 = 0.990 (range: 0.924–0.999) for N2. Negative controls of the concentration, extraction, and PCR process were included. Cycle threshold (Ct) values were used for calculating SARS-CoV-2 genomic copies per liter (gc/L) in the original sample based on calibration curves. Ct values < 40 were considered positive for SARS-CoV-2, as previously proposed (28). For each sample and primer set (N1 or N2), RT-qPCRs were performed in duplicate. Therefore, four estimates of the viral RNA concentration were obtained for each sample. In-house primers were used for TGEV RT-qPCRs (Forward: AGCAGTGCCAAGCATTACCC, reverse: CTGGTCGCCATCTTCCTTTG, probe: FAM-TGGCTGAA/ZEN/GTGTTCCATCTGTGTCTAGC-3IABkFQ).
Epidemiological Data
Numbers of declared cases per day and per municipality were provided by the Conselleria de Sanidad Universal y Salud Pública (Generalitat Valenciana). The specific municipalities covered by each WWTP were provided by the Empresa Pública de Saneamiento de Aguas Residuales (EPSAR, Generalitat Valenciana). The analysis of local mobility in the city of Valencia was obtained from the publicly available population mobility data server of the Spanish Ministerio de Transporte, Mobilidad y Agenda Urbana (29).
Statistical Analysis
SARS-CoV-2 RNA gc/L inferred from RT-qPCRs were log transformed to facilitate statistical comparisons across several orders of magnitude. Four data points were available per treatment plant and sampling day (N1 and N2 primer sets, two technical replicates for each). Three treatment plants were analyzed (see text for details), and sampling was typically performed three times per week, with some variations in case of public holidays or other sample availability reasons. To compare the signal provided by N1 and N2 primers, a paired t-test was performed, in which the average log RNA concentration of a given sample obtained from the two technical RT-qPCR replicates performed using N1 primers was paired with the average log RNA concentration of the same sample obtained from the two technical replicates performed with N2 primers. To establish comparisons with cumulative reported cases (i.e. disease incidence), log transformed gc/L data were averaged (arithmetic mean) over 7-day (or 14-day) periods using a sliding window with a one-day shift. These two variables were compared using linear regression, Pearson correlation, and non-parametric Spearman correlation analyses, as detailed in the text. Alternatively, medians were used instead of arithmetic means. To detect significant changes in SARS-CoV-2 RNA concentration through time, all log transformed gc/L data within a given 7-day (or 14-day) period were compared with the data corresponding to the following 7-day period (e.g. September 1–7 vs. September 8–14) using a t-test or, alternatively, a non-parametric Mann-Whitney test.
Results
We obtained composite wastewater samples from the two wastewater treatment plants (WWTP) of Pinedo, which process sewage from 1.2 million inhabitants in the metropolitan area of Valencia, Spain. Each composite sample consisted of a pool of multiple discrete samples taken at regular intervals over a 4 h period (7–11 am). Sampling was carried out on 129 different days spanning from April 16, 2020, to March 9, 2021, a period during which three recognizable epidemic waves occurred. We did not include the first outbreak that took place from February to March 2020 since PCR testing was not sufficiently implemented at that time, leading to severe case underreporting. Each sampling day, two different WWTP collectors were analyzed. Samples were spiked with the transmissible gastroenteritis coronavirus (TGEV) as an internal control, spun to remove large debris, filtrated, concentrated by high-speed centrifugation, and used for RNA extraction. We then performed SARS-CoV-2 RT-qPCR in duplicate for each of two viral genome regions (N1 and N2), and used calibration curves for estimating the concentration of SARS-CoV-2 RNA in wastewater, measured as viral genome copies per L (gc/L). We successfully amplified a PCR product in 771 out of 1024 total reactions (75.3%). Failures occurred typically when the number of declared COVID-19 cases in the region was low (Figure 1A). Moreover, RT-qPCR yielded a PCR product for TGEV in these SARS-CoV-2-negative samples, showing that the lack of SARS-CoV-2 amplification was not due to issues in sample processing or the presence of PCR inhibitors. Consequently, these negative PCRs provided information about disease incidence. Graphical examination of the distribution of the estimated SARS-CoV-2 RNA concentrations suggested a detection limit of approximately 100 gc/L (Figure 1B). We therefore assumed this lower-limit value for negative PCRs. N1 and N2 provided similar estimates of the SARS-CoV-2 RNA concentrations, albeit N1 yielded a slightly more intense signal (grand mean log10 gc/L = 3.48 ± 0.08) than N2 (grand mean log10 gc/L = 3.32 ± 0.08, paired t-test: P < 0.001; Figure 1B).
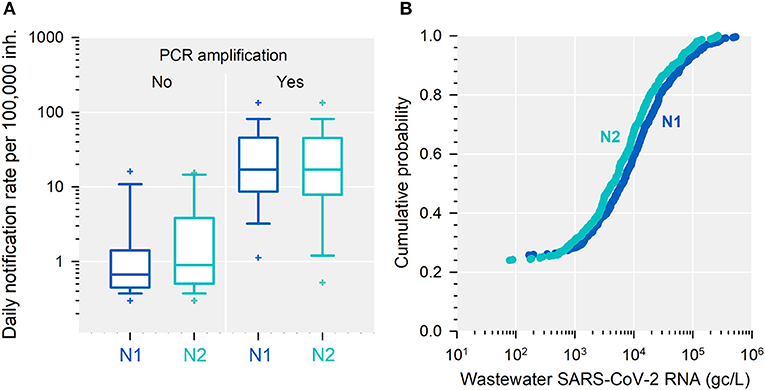
Figure 1. SARS-CoV-2 detection limit in wastewaters. (A) Box plot of daily notification rates per 100,000 inhabitants for wastewater samples that yielded an RT-qPCR product, vs. those that failed to amplify. Data are shown separately for viral genome regions N1 and N2. Boxes show the 25th, 50th (median), and 75th percentiles. Error bars indicate the 10th and 90th percentiles, and crosses show the 5th and 95th percentiles. (B) Cumulative probability distribution of the estimated viral RNA concentration for genome regions N1 and N2. Based on this distribution, the detection limit of the RT-qPCR was approximately 100 gc/L.
We averaged log wastewater SARS-CoV-2 RNA concentrations using a 14-day sliding window, which yielded 301 values encompassing the entire follow-up period. These averages correlated strongly with 14-day cumulative notification rates reported by public health authorities (Pearson r = 0.962, P < 0.001). The estimated log-log regression slope was 1.011 ± 0.016, suggesting an approximately linear relationship between these two quantities over several orders of magnitude (Figure 2A). A mean concentration higher than 1000 gc/L showed 95.6% sensitivity and 100% specificity as an indicator of a 14-day cumulative notification rate higher than 25 new cases per 100,000 inhabitants (Table 1). This disease incidence has been used in EU countries as a cutoff value below which restrictions to free population movements could be lifted (30). In turn, a mean concentration exceeding 10,000 gc/L showed 91.8% sensitivity and 95.1% specificity as an indicator of a 14-day cumulative notification rate above 350 new cases per 100,000 inhabitants, a high-concern incidence (Table 1). The correlation between 14-day cumulative notification rates and wastewater RNA concentrations was similarly high when medians were used for calculating the 14-day sliding window (r = 0.959, P < 0.001, Figure 3A). We also found that the RT-qPCR results obtained with primers N1 and N2 were highly correlated (r = 0.952, P < 0.001) except for low-concentration samples, in which N2 tended to yield higher values than N1 (Figure 3B). Similarly, there was a high correlation between data obtained from the two wastewater plant collectors (r = 0.951, P < 0.001; Figure 3C).
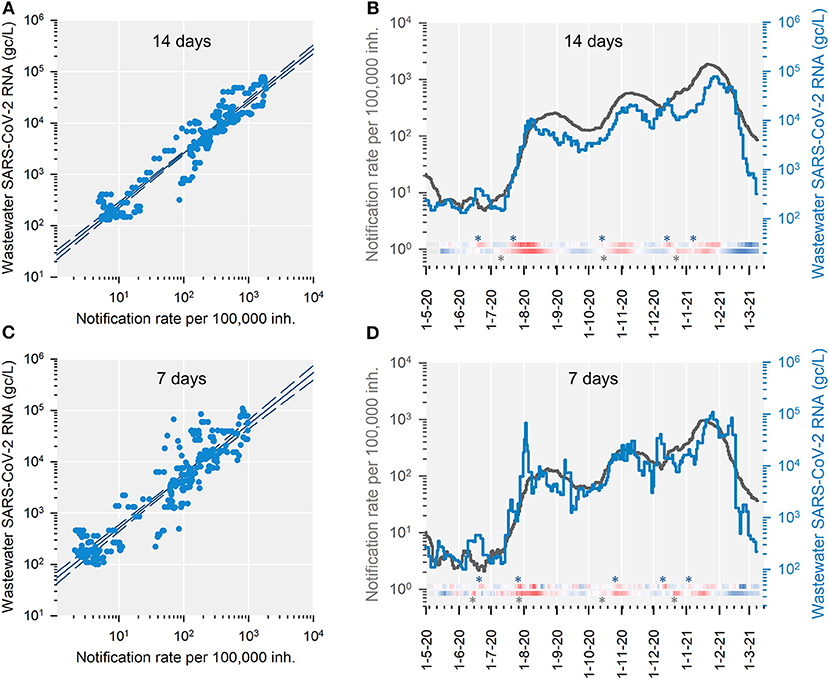
Figure 2. SARS-CoV-2 wastewater signal and notification rates over 14-day or 7-day periods. Average log SARS-CoV-2 RNA concentrations in wastewater and cumulative case notification rates per 100,000 inhabitants are shown. These variables were calculated for each of 301 periods of 14 days, or 322 periods of 7 days, using a one-day shifted sliding window. (A) Least-squares log-log linear regression using 14-day periods. Equation for the linear regression line: y = 1.011 x + 1.393. Goodness of fit: r2 = 0.925. The 99% confidence intervals are shown. (B) 14-day time series. The heat maps below the curves show the difference between consecutive periods for wastewater data (top) and notification rates (bottom). Asterisks indicate the first day in which a significant increase between two consecutive 14-day periods was detected. (C) Least-squares log-log linear regression using 7-day periods. Equation for the linear regression line: y = 1.009 x + 1.699. Goodness of fit: r2 = 0.856. The 99% confidence intervals are shown. (D) 7-day time series. Heat maps and asterisks indicating the first day in which a significant increase between two consecutive 7-day periods was detected are shown.
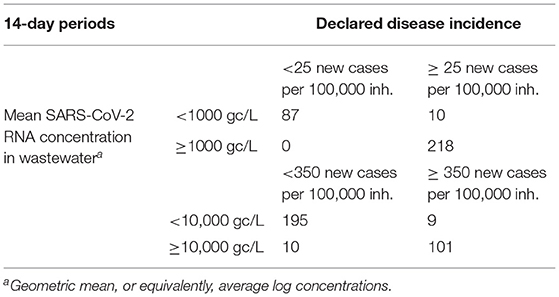
Table 1. Wastewater RNA concentrations vs. disease incidences over 14-day periods.
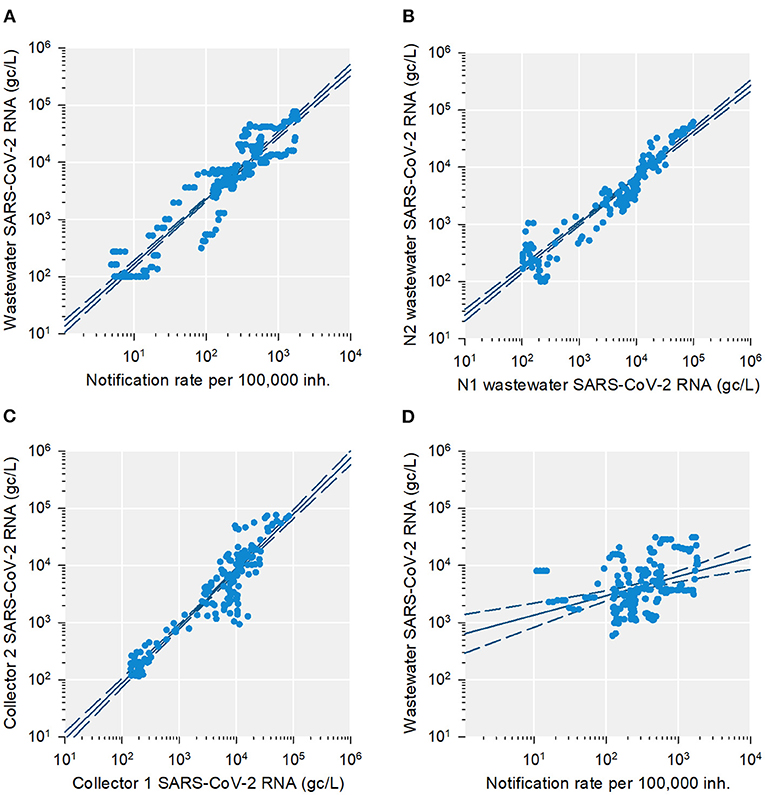
Figure 3. Influence of wastewater sampling strategy on SARS-CoV-2 quantitation. Viral RNA concentrations in wastewater and cumulative case notification rates per 100,000 inhabitants were calculated for 14-day periods using a one-day shifted sliding windows. Least-squares log-log linear regression lines and 99% confidence intervals are shown. (A) Notification rate vs. median viral RNA concentration in wastewaters. (B) Average log viral RNA concentrations estimated using SARS-CoV-2 genome region N1 vs. N2. (C) Average log viral RNA concentrations estimated from the Pinedo WWTP collector 1 vs. collector 2. (D) Notification rate vs. average log viral RNA concentration in wastewaters using individual instead of composite samples.
To test the importance of taking composite samples, we also obtained individual (grab) samples from the same WWTP collectors on 91 different days, and performed 720 RT-qPCRs from these individual samples accordingly. The correlation between 14-day cumulative notification rates and average log SARS-CoV-2 RNA concentrations was much lower than for composite samples (r = 0.398, P < 0.001; Figure 3D). This illustrates the importance of taking representative wastewater samples, although we note that the time period for this analysis was shorter (July 16, 2020 to March 9, 2021) and encompassed less variation in SARS-CoV-2 declared cases.
We also obtained composite samples from a single collector in a smaller WWTP (Quart-Benàger), which processes sewage from approximately 140,000 inhabitants, and performed 480 RT-qPCRs from samples taken on 120 different days (April 16, 2020 to March 9, 2021). We found a relatively high correlation between 14-day cumulative notification rates and average log SARS-CoV-2 RNA concentrations (r = 0.868, P < 0.001; Figure 4), although lower than for the larger Pinedo WWTP.
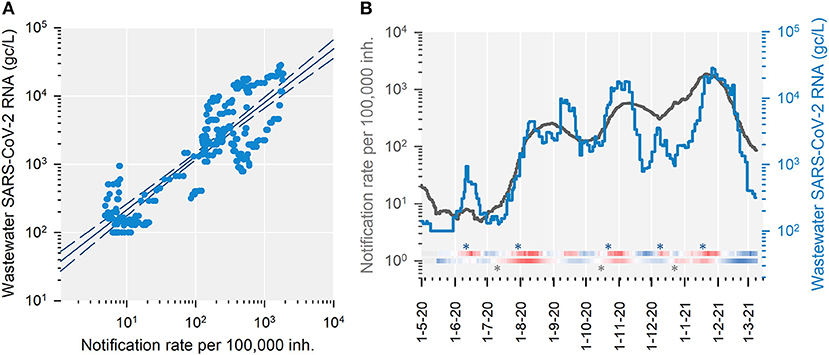
Figure 4. SARS-CoV-2 wastewater signal from a second treatment plant vs. notification rates over 14-day periods. Average log SARS-CoV-2 RNA concentrations in wastewater from Quart-Benàger WWTP and cumulative case notification rates per 100,000 inhabitants are shown. These variables were calculated for each of 301 periods of 14 days using a one-day shifted sliding windows. (A) Least-squares log-log linear regression, showing 99% confidence intervals (y = 0·785 x + 1·547, r2 = 0·753). (B) Time series. The heat maps below the curves show the difference between consecutive 14-day periods (red: increasing, blue: decreasing) for wastewater data (top) and notification rates (bottom). Asterisks indicate the first day in which a significant increase between two consecutive 14-day periods was detected.
We then analyzed Pinedo WWTP data using a 7-day sliding window. Average log SARS-CoV-2 RNA concentrations correlated highly with 7-day cumulative notification rates, again exhibiting a linear relationship over several orders of magnitude (log-log Pearson r = 0.925, P < 0.001, slope = 1.009 ± 0.023; Figure 2C). A mean concentration above 1000 gc/L showed 95.2% sensitivity and 95.7% specificity as an indicator of a 7-day cumulative notification rate higher than 12.5 new cases per 100,000 inhabitants, whereas a mean concentration exceeding 10,000 gc/L showed 88.6% sensitivity and 91.2% specificity as an indicator of more than 175 new cases per 100,000 inhabitants (Table 2). Therefore, wastewater analysis over weekly periods also provided a reliable tool, and could be used for early warning of SARS-CoV-2 spread.
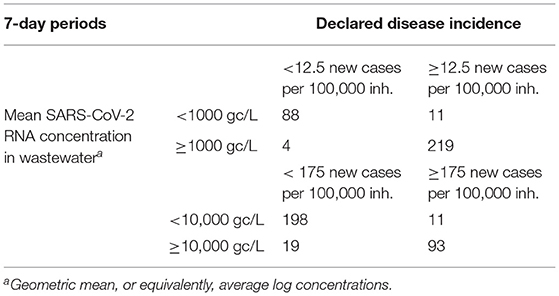
Table 2. Wastewater RNA concentrations vs. disease incidences over 7-day periods.
We further investigated the ability of wastewater analysis to detect outbreaks by plotting side by side the time series of 14-day log SARS-CoV-2 RNA average concentrations and cumulative notification rates (Figure 2B). Three waves of cases occurred in July, October and December 2020 in the region under study, all of which were clearly identified in wastewaters. By comparing consecutive 14-day periods, the first statistically significant increase in cases took place on July 9, 2020 (i.e. comparing June 12-25 vs. June 26 - July 9, t-test using log transformed data: P = 0.022). In contrast, the first significant elevation of wastewater RNA concentrations was detected on June 18 (P = 0.013), followed by a decrease and, then, a more pronounced spike first detected on July 21 (P = 0.008). For the second wave, a significant increase in declared cases was first seen on October 14 (P = 0.042), whereas wastewater analysis first revealed such an increase on October 13 (P = 0.032). The third wave of declared cases was first detected on December 22. Again, wastewater RNA concentrations increased before declared cases (first detected on December 13, P = 0.008) then decreased transiently, and rebounded more strongly in January 2021. Finally, a decline in SARS-CoV-2 incidence and wastewater RNA concentrations started in February 2021 and continued until the end of the follow-up period.
Using a 7-day window, we also found good agreement between the time series of cumulative notification rates and average log wastewater RNA concentrations, although the latter was noisier, as expected (Figure 2D). With this approach, the first outbreak was detected on July 20 for declared cases (t-test: P = 0.027) and on July 19 for wastewaters (P < 0.001). Again, this was preceded by a transient peak in both wastewaters and declared cases between June 4 and 11 (P < 0.05). The second outbreak became significant for declared cases on October 8 (P = 0.046) and on October 21 for wastewaters (P = 0.017). Interestingly, the 7-day wastewater analysis detected another transient, marginally significant bout preceding this outbreak (September 10, P = 0.061). The third wave of declared cases was first detected on December 17 (P = 0.012). Again, we found that wastewater RNA concentrations increased before declared cases (December 6, P = 0.046), then decreased, and subsequently rebounded.
The transient peaks in wastewater SARS-CoV-2 RNA concentrations that preceded major outbreaks were confirmed by non-parametric statistics. By this approach, peaks starting on June 18 (Mann-Whitney U: P = 0.008) and December 13 (P = 0.003) were identified using a 14-day window. With a 7-day window, we obtained similar peaks (P = 0.012 on June 11 and P = 0.038 on December 6) as well as an additional marginally significant bout starting on September 10 (P = 0.057), consistent with the above results. To further test this transient-peak pattern, we analyzed data from the Quart-Benàger WWTP. Comparison of 14-day periods revealed significant bouts starting on June 13 (t-test: P = 0.007) and December 8 (P = 0.020) that preceded major outbreaks. We also found increased SARS-CoV-2 RNA concentrations during September 7–14, compared to August 23-31 (P = 0.034), thus supporting the presence of a short peak preceding the October wave.
Discussion
Our analysis encompassing a period of major epidemic concern in the Spanish city of Valencia reveals that wastewaters can be used as a reliable indicator of COVID-19 disease incidence. We find that wastewater analysis is particularly useful for monitoring incidence values on the order of 25 new cases per 100,000 inhabitants over a 14-day period, or equivalently, 12.5 cases over a 7-day period. For these values, wastewater RNA concentrations achieve specificity and sensitivity greater than 95% using an RNA cutoff value of 1,000 gc/L. We also estimated that the detection limit of the technique is on the order 100 gc/L, which should correspond to approximately two new cases per 100,000 inhabitants over a 7-day period.
To what extent these quantitative data can be extrapolated to other scenarios remains to be addressed. We have shown that compound sampling is essential for achieving a strong correlation between wastewater RNA concentration and declared cases, and that systematic sampling of large treatment plants should yield more accurate data. Additional factors that could influence the results include the sample concentration method, the RT-qPCR reagents used, and features of the local sewage system, among others. In addition, viral shedding through feces could vary depending on virological factors (31). For instance, certain SARS-CoV-2 variants might exhibit differences in organ tropism compared to the B lineage (32) predominant in the region of Valencia over the course of this study, which was subsequently replaced by variant B.1.1.7 during March 2021. Vaccination might also affect the association between wastewater RNA concentration and declared cases, since vaccination programs have modified the age composition of the infected population and, potentially, could also alter viral shedding patterns.
Contrarily to previous suggestions (17, 20, 23, 33), we did not find that wastewater analysis could systematically anticipate incidence peaks. Yet, intriguingly, transient elevations of wastewater viral RNA concentrations were detected approximately one month before major epidemic waves in some of the WWTP analyzed here. Importantly, these peaks went unnoticed when looking at declared cases, or were very mild. We speculate that these cryptic peaks took place among subpopulations mainly constituted by asymptomatic carriers who failed to be diagnosed, particularly young individuals. These episodes should have been restricted to a specific time period or to certain communities that presumably became infected and then cleared the virus. For instance, this pattern might be due to episodic population movements, such as travel, or increases in social activity. Potentially, the transient peaks could have ignited viral transmission in the general population, causing major outbreaks in the weeks that followed.
Major lockdown measures were enforced in the region in March 2020, allowing control of the first outbreak, which is not addressed in this study (12). On May 28, 2020, there was a major relaxation of certain anti-COVID-19 measures in the Valencian region, which included the opening of indoor spaces such as restaurants, sports centers, and shopping malls. This opening had a measurable effect on cell phone-based population movement records (Figure 5). This might have led to a reactivation of viral spread, mainly among younger people. Then, traveling between provinces or countries was allowed on June 21, matching the start of school holidays. This series of events could explain the observed evolution of SARS-CoV-2 RNA concentration in wastewaters. School classes were resumed on September 7, and viral RNA concentration in wastewaters increased precisely at that time, albeit weakly. It is thus possible that hidden viral spread during this period preceded the second major outbreak in October. Concerning the third transient peak observed in wastewaters prior to the Christmas period, possible causes include the increase in commercial activity starting around November and the vacation period from December 5 to 8, during which indoor social activities could have increased, although these events did not appreciably impact population movement records (Figure 5).
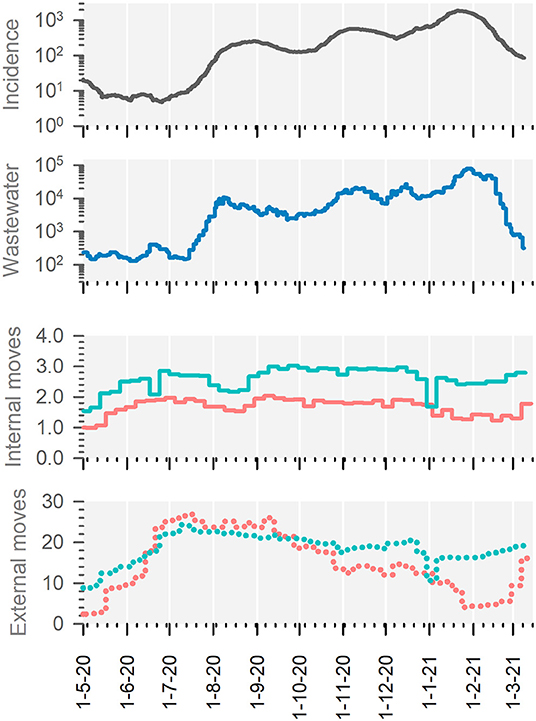
Figure 5. COVID-19 incidence, SARS-CoV-2 RNA concentration in wastewaters, and population mobility records. From top to bottom: 14-day cumulative declared cases per 100,000 inhabitants; average log SARS-CoV-2 RNA concentration (gc/L) using a 14-day sliding window; publicly available population movement records within the city of Valencia (Spain) on Wednesdays (green) and Sundays (red); population movements entering or departing from the city of Valencia (Spain) recorded on Wednesdays (green) and Sundays (red).
In conclusion, this study shows that SARS-CoV-2 population spread can be monitored reliably over a wide range of incidence values using wastewater analysis, and that wastewater viral RNA quantitation is a sensitive and specific indicator of early viral spread. Although we did not observe that this approach could systematically anticipate disease incidence peaks, we noticed that such peaks were preceded by transient elevations of RNA concentration in wastewaters. This finding deserves further examination and could potentially reveal novel aspects of COVID-19 epidemiology.
Data Availability Statement
The raw data supporting the conclusions of this article will be made available by the authors, without undue reservation.
Author Contributions
All authors listed have made a substantial, direct, and intellectual contribution to the work and approved it for publication.
Funding
This work was funded by the Conselleria d'Agricultura, Desenvolupament Rural, Emergencia Climàtica i Transició Ecològica of the Generalitat Valenciana (project OTR2020-20593SUBDI to RS), the Instituto de Salud Carlos III (FONDO-COVID19 COV20/00210 to PD-C), CSIC (Salud Global CSIC 202020E292 to PD-C), and the Spanish Ministerio de Ciencia e Innovación (Ramón y Cajal contract, RYC2019-028015-I, to PD-C).
Conflict of Interest
The authors declare that the research was conducted in the absence of any commercial or financial relationships that could be construed as a potential conflict of interest.
Publisher's Note
All claims expressed in this article are solely those of the authors and do not necessarily represent those of their affiliated organizations, or those of the publisher, the editors and the reviewers. Any product that may be evaluated in this article, or claim that may be made by its manufacturer, is not guaranteed or endorsed by the publisher.
Acknowledgments
We thank Óscar Zurriaga and the Subdirección General de Epidemiología, Vigilancia de la Salud y Sanidad Ambiental (Conselleria de Sanitat Universal i Salut Pública, Generalitat Valenciana) for providing case notification rates, Augusto Montamarta and Ignacio García (Entitat de Sanejament d'Aigües, Generalitat Valenciana) for access to wastewater treatment plants, Ángel Jimenez, Pau Granell, Sonia Tristante and María José Tárrega for wastewater sampling, Lola Arocas for technical assistance, and Rocío Báguena for assistance with big data collection (Spanish Ministerio de Transporte, Mobilidad y Agenda Urbana).
References
1. Cheung KS, Hung IFN, Chan PPY, Lung KC, Tso E, Liu R, et al. Gastrointestinal manifestations of SARS-CoV-2 infection and virus load in fecal samples from the Hong Kong cohort and systematic review and meta-analysis. Gastroenterology. (2020) 159:81–95. doi: 10.1053/j.gastro.2020.03.065
2. Xiao F, Tang M, Zheng X, Liu Y, Li X, Shan H. Evidence for gastrointestinal infection of SARS-CoV-2. Gastroenterology. (2020) 158:1831–3. doi: 10.1053/j.gastro.2020.02.055
3. Ahmed W, Angel N, Edson J, Bibby K, Bivins A, O'Brien JW, et al. First confirmed detection of SARS-CoV-2 in untreated wastewater in Australia: a proof of concept for the wastewater surveillance of COVID-19 in the community. Sci Total Environ. (2020) 728:138764. doi: 10.1016/j.scitotenv.2020.138764
4. Arora S, Nag A, Sethi J, Rajvanshi J, Saxena S, Shrivastava SK, et al. Sewage surveillance for the presence of SARS-CoV-2 genome as a useful wastewater based epidemiology (WBE) tracking tool in India. Water Sci Technol. (2020) 82:2823–36. doi: 10.2166/wst.2020.540
5. Bivins A, North D, Ahmad A, Ahmed W, Alm E, Been F, et al. Wastewater-based epidemiology: global collaborative to maximize contributions in the fight against COVID-19. Environ Sci Technol. (2020) 54:7754–7. doi: 10.1021/acs.est.0c02388
6. Gonzalez R, Curtis K, Bivins A, Bibby K, Weir MH, Yetka K, et al. COVID-19 surveillance in Southeastern Virginia using wastewater-based epidemiology. Water Res. (2020) 186:116296. doi: 10.1016/j.watres.2020.116296
7. Haramoto E, Malla B, Thakali O, Kitajima M. First environmental surveillance for the presence of SARS-CoV-2 RNA in wastewater and river water in Japan. Sci Total Environ. (2020) 737:140405. doi: 10.1016/j.scitotenv.2020.140405
8. La Rosa G, Iaconelli M, Mancini P, Bonanno Ferraro G, Veneri C, Bonadonna L, et al. First detection of SARS-CoV-2 in untreated wastewaters in Italy. Sci Total Environ. (2020) 736:139652. doi: 10.1016/j.scitotenv.2020.139652
9. Lodder W, de Roda Husman AM. SARS-CoV-2 in wastewater: potential health risk, but also data source. Lancet Gastroenterol Hepatol. (2020) 5:533–4. doi: 10.1016/S2468-1253(20)30087-X
10. Medema G, Heijnen L, Elsinga G, Italiaander R, Brouwer A. Presence of SARS-Coronavirus-2 RNA in sewage and correlation with reported COVID-19 prevalence in the early stage of the epidemic in The Netherlands. Environ Sci Technol Lett. (2020) 7:511–6. doi: 10.1021/acs.estlett.0c00357
11. Peccia J, Zulli A, Brackney DE, Grubaugh ND, Kaplan EH, Casanovas-Massana A, et al. Measurement of SARS-CoV-2 RNA in wastewater tracks community infection dynamics. Nat Biotechnol. (2020) 38:1164–7. doi: 10.1038/s41587-020-0684-z
12. Randazzo W, Cuevas-Ferrando E, Sanjuán R, Domingo-Calap P, Sánchez G. Metropolitan wastewater analysis for COVID-19 epidemiological surveillance. Int J Hyg Environ Health. (2020) 230:113621. doi: 10.1016/j.ijheh.2020.113621
13. Hemalatha M, Kiran U, Kuncha SK, Kopperi H, Gokulan CG, Mohan SV, et al. Surveillance of SARS-CoV-2 spread using wastewater-based epidemiology: comprehensive study. Sci Total Environ. (2021) 768:144704. doi: 10.1016/j.scitotenv.2020.144704
14. Prado T, Fumian TM, Mannarino CF, Resende PC, Motta FC, Eppinghaus ALF, et al. Wastewater-based epidemiology as a useful tool to track SARS-CoV-2 and support public health policies at municipal level in Brazil. Water Res. (2021) 191:116810. doi: 10.1016/j.watres.2021.116810
15. Agrawal S, Orschler L, Lackner S. Long-term monitoring of SARS-CoV-2 RNA in wastewater of the Frankfurt metropolitan area in Southern Germany. Sci Rep. (2021) 11:5372. doi: 10.1038/s41598-021-84914-2
16. Karthikeyan S, Ronquillo N, Belda-Ferre P, Alvarado D, Javidi T, Longhurst CA, et al. High-throughput wastewater sars-cov-2 detection enables forecasting of community infection dynamics in san diego county. mSystems. (2021) 6:e00045–21. doi: 10.1128/mSystems.00045-21
17. Ahmed W, Tscharke B, Bertsch PM, Bibby K, Bivins A, Choi P, et al. SARS-CoV-2 RNA monitoring in wastewater as a potential early warning system for COVID-19 transmission in the community: a temporal case study. Sci Total Environ. (2021) 761:144216. doi: 10.1016/j.scitotenv.2020.144216
18. Wurtzer S, Marechal V, Mouchel JM, Maday Y, Teyssou R, Richard E, et al. Evaluation of lockdown effect on SARS-CoV-2 dynamics through viral genome quantification in waste water, Greater Paris, France, 5 March to 23 April 2020. Euro Surveill. (2020) 25:2000776. doi: 10.2807/1560-7917.ES.2020.25.50.2000776
19. Fongaro G, Stoco PH, Souza DSM, Grisard EC, Magri ME, Rogovski P, et al. The presence of SARS-CoV-2 RNA in human sewage in Santa Catarina, Brazil, November 2019. Sci Total Environ. (2021) 778:146198. doi: 10.1016/j.scitotenv.2021.146198
20. Chavarria-Miró G, Anfruns-Estrada E, Martínez-Velázquez A, Vázquez-Portero M, Guix S, Paraira M, et al. Time evolution of severe acute respiratory syndrome coronavirus 2 (SARS-CoV-2) in wastewater during the first pandemic wave of COVID-19 in the metropolitan area of Barcelona, Spain. Appl Environ Microbiol. (2021) 87:e02750–20. doi: 10.1128/AEM.02750-20
21. Li X, Zhang S, Shi J, Luby SP, Jiang G. Uncertainties in estimating SARS-CoV-2 prevalence by wastewater-based epidemiology. Chem Eng J. (2021) 415:129039. doi: 10.1016/j.cej.2021.129039
22. Zhu Y, Oishi W, Maruo C, Saito M, Chen R, Kitajima M, et al. Early warning of COVID-19 via wastewater-based epidemiology: potential and bottlenecks. Sci Total Environ. (2021) 767:145124. doi: 10.1016/j.scitotenv.2021.145124
23. Kumar M, Joshi M, Patel AK, Joshi CG. Unravelling the early warning capability of wastewater surveillance for COVID-19: A temporal study on SARS-CoV-2 RNA detection and need for the escalation. Environ Res. (2021) 196:110946. doi: 10.1016/j.envres.2021.110946
24. Panchal D, Prakash O, Bobde P, Pal S. SARS-CoV-2: sewage surveillance as an early warning system and challenges in developing countries. Environ Sci Pollut Res Int. (2021) 28:22221–40. doi: 10.1007/s11356-021-13170-8
25. Nemudryi A, Nemudraia A, Wiegand T, Surya K, Buyukyoruk M, Cicha C, et al. Temporal detection and phylogenetic assessment of SARS-CoV-2 in municipal wastewater. Cell Rep Med. (2020) 1:100098. doi: 10.1016/j.xcrm.2020.100098
26. D'Aoust PM, Graber TE, Mercier E, Montpetit D, Alexandrov I, Neault N, et al. Catching a resurgence: Increase in SARS-CoV-2 viral RNA identified in wastewater 48 h before COVID-19 clinical tests and 96 h before hospitalizations. Sci Total Environ. (2021) 770:145319. doi: 10.1016/j.scitotenv.2021.145319
27. Larsen DA, Wigginton KR. Tracking COVID-19 with wastewater. Nat Biotechnol. (2020) 38:1151–3. doi: 10.1038/s41587-020-0690-1
28. Wang W, Xu Y, Gao R, Lu R, Han K, Wu G, et al. Detection of SARS-CoV-2 in different types of clinical specimens. JAMA. (2020) 323:1843–4. doi: 10.1001/jama.2020.3786
29. Estudio de movilidad con Big Data | Ministerio de Transportes, Movilidad y Agenda Urbana (2021). Available online at: https://www.mitma.es/ministerio/covid-19/evolucion-movilidad-big-data. (accessed May 25, 2021).
30. Maps in support of the Council Recommendation on a coordinated approach to travel measures in the EU European Centre for Disease Prevention and Control. (2021). Available online at: https://www.ecdc.europa.eu/en/covid-19/situation-updates/weekly-maps-coordinated-restriction-free-movement. (accessed May 25, 2021).
31. Jones DL, Baluja MQ, Graham DW, Corbishley A, McDonald JE, Malham SK, et al. Shedding of SARS-CoV-2 in feces and urine and its potential role in person-to-person transmission and the environment-based spread of COVID-19. Sci Total Environ. (2020) 749:141364. doi: 10.1016/j.scitotenv.2020.141364
32. Ondruschka B., Heinrich F., Lindenmeyer M., Edler C., Möbius D., Czogalla J., et al. (2021). Multiorgan tropism of SARS-CoV-2 lineage B.1.1.7. Int. J. Legal Med. 135, 2347–2349. doi: 10.1007/s00414-021-02691-z
Keywords: wastewater-based epidemiology, SARS-CoV-2, epidemiological surveillance, public health, virus
Citation: Sanjuán R and Domingo-Calap P (2021) Reliability of Wastewater Analysis for Monitoring COVID-19 Incidence Revealed by a Long-Term Follow-Up Study. Front. Virol. 1:776998. doi: 10.3389/fviro.2021.776998
Received: 14 September 2021; Accepted: 26 October 2021;
Published: 19 November 2021.
Edited by:
Alexander Ciota, Wadsworth Center, United StatesReviewed by:
Francesca Di Giallonardo, University of New South Wales, AustraliaSteven A. Kemp, University of Cambridge, United Kingdom
Copyright © 2021 Sanjuán and Domingo-Calap. This is an open-access article distributed under the terms of the Creative Commons Attribution License (CC BY). The use, distribution or reproduction in other forums is permitted, provided the original author(s) and the copyright owner(s) are credited and that the original publication in this journal is cited, in accordance with accepted academic practice. No use, distribution or reproduction is permitted which does not comply with these terms.
*Correspondence: Rafael Sanjuán, rafael.sanjuan@uv.es; orcid.org/0000-0002-1844-545X; Pilar Domingo-Calap, pilar.domingo@uv.es; orcid.org/0000-0003-2829-8809
†These authors have contributed equally to this work