Propagation of an RNA Bacteriophage at Low Host Density Leads to a More Efficient Virus Entry
 Mara Laguna-Castro
  Ester Lázaro*
- Department of Molecular Evolution, Centro de Astrobiologia (CAB), Consejo Nacional de Investigaciones Científicas-Instituto Nacional de Técnica Aeroespacial (CSIC-INTA), Torrejón de Ardoz, Madrid, Spain
The successful spread of a virus in a specific ecological niche is largely determined by host availability. The lower the host density, the longer the virus spends in the external environment between successive infections, thus increasing its probability of degradation due to physical and chemical variables, which ultimately could lead to its extinction. Nevertheless, the high error rate of viral replication, particularly in the case of RNA viruses, can lead to the emergence and subsequent selection of mutants that increase their probability of transmission under unfavorable conditions. This fact could cause some containment measures, such as those based on restriction of contacts, to have unexpected consequences that it is important to analyze. Whereas it is quite difficult to implement this kind of studies during the spread of real epidemics, evolution experiments carried out with controlled variables in the lab can be very useful to unveil regularities in virus behavior that allow to anticipate difficulties. In this work we have carried out an evolution experiment in which the bacteriophage Qβ, a virus with an RNA genome, has been propagated at different host densities under conditions that prevent the selection of defense mechanisms in the bacteria. Our results show that there is a minimal host concentration that separates sustained propagation from extinction. After a certain number of generations, all lineages propagated at suboptimal host concentration selected a mutation in the minor capsid protein whose phenotypic effect was to enhance the entry of the virus into the cell. Although it is difficult to extrapolate our findings to more complex situations, they show the need to carry out an exhaustive monitoring of viral evolution when measures based on confinements or physical barriers that limit transmission are applied.
Introduction
The degree of expansion reached by a virus in a population largely depends on its probability of transmission, which, among other factors, relies on the ease of finding susceptible hosts (1–4). Not surprisingly, frequent measures to reduce epidemic spread in our species are based on preventing virus access to people, lowering the probability of contagion. Despite their efficacy in the short term (5), that kind of measures, when applied on a large scale, have a huge economic and social impact and there are important doubts about how strictly they must be implemented to be effective in the long term. Another concern refers to whether the limitations to virus propagation could favor the selection of evolutionary strategies that increase contagion capacity. The risk is especially high in the case of RNA viruses, due to the high genetic heterogeneity contained in their populations, which is a consequence of their elevated replication error rates (6, 7) and the large size of their populations. RNA virus populations are often described as quasispecies, an extremely dynamic population structure made up of an ensemble of mutants that differ from each other in one or several mutations, and that confers rapid adaptation to most selective pressures of the environment (8, 9).
Since December 2019, a previously unknown RNA virus, the severe acute respiratory syndrome coronavirus 2 (SARS-CoV-2), has spread globally causing millions of deaths. At different moments throughout the pandemic, most governments have established confinements and restrictions to limit virus expansion. The decrease in the number of susceptible hosts, together with the increasing number of individuals with defenses against the virus may impose a selective pressure that, together with other relevant epidemiological factors, has probably contributed to its evolution (10, 11). There are evidences that the virus has increased its transmission capacity through different strategies that include the improvement of the interaction with the cell receptor and partial escape to antibody neutralization (10, 12). To find out the relative contribution of each, it would be necessary to disentangle the molecular mechanisms that optimize virus entry from those that counteract cellular defenses, which sometimes can be difficult, in particular if the changes involved are subjected to fitness trade-offs (13, 14).
RNA bacteriophages may be a simple, adequate model to investigate the question raised above. Although bacteria can also select defenses against their phages, it is possible to design serial transfers experiments in which the phage is propagated in a continuous way, which allows its evolution, while the bacteria are replaced at each transfer to prevent the spreading of resistance mechanisms (15). We took advantage of this approach to design an evolution experiment aimed to study the evolutionary strategies followed by the RNA bacteriophage Qβ when it was propagated in the presence of suboptimal host concentrations.
Qβ is a lytic virus that infects the bacterium Escherichia coli using as receptor the conjugative F pilus. It is a member of the Leviviridae family (genus Allolevivirus) (16). It has a single-stranded, positive-sense RNA genome of 4217 nucleotides that encodes four proteins: A2 (that mediates phage binding to the bacterial pili, penetration of the viral genome, and cell lysis), coat (the major capsid protein), A1 (the minor capsid protein), and the replicase. As other RNA viruses, it replicates with very high error rate (estimated in 1.4 x 10⁻⁴ errors per copied nucleotide) (7, 17) and has a quasispecies population structure.
The objectives of the evolution experiment carried out with Qβ were i) to determine the minimal host density that allows sustained propagation of the virus under a set of defined environmental conditions, ii) to analyze whether the virus can adapt to lower-than-optimal host density, iii) to detect the mutations fixed in the consensus sequences of the evolved lineages and identify those that could be responsible for adaptation, and iv) to find out the phenotypic effect of the observed mutations. Our main result was that Qβ is able to optimize its replication at suboptimal host densities. In all cases analyzed, adaptation took place through the selection of a non-synonymous mutation in the minor capsid protein (A1) whose phenotypic effect was the increase of virus entry into the bacteria.
Materials and Methods
Virus and Bacteria. Standard Procedures for Infection
The plasmid pBRT7Qβ, which contains a cDNA of bacteriophage Qβ cloned in the plasmid pBR322 (18, 19), was used to transform Escherichia coli DH5-α, a strain that permits virus expression but that cannot be infected because it lacks the virus receptor. The supernatant of an overnight culture, obtained from a transformed colony, was used to infect E. coli, strain Hfr (Hayes), in semisolid agar. The virus progeny contained in a randomly chosen lytic plaque was isolated, and 106 plaque forming units (pfu) were used to infect an E. coli Hfr culture under standard conditions (see below). The supernatant of this culture was used as the ancestor of all the evolutionary lineages propagated in this work. It was denoted QβAnc and its consensus sequence showed no mutations relative to the Qβ cDNA cloned in pBR322.
Qβ was propagated in E. coli Hfr in NB medium (8 g/L Nutrient Broth from Merck and 5 g/L NaCl). Infections in liquid medium were carried out using fresh log-phase E. coli cultures with an OD600 of 0.8 that were infected at the multiplicity of infection (moi) indicated in each experiment. Cultures were incubated at 37°C for 2 h with good aeration (250 rpm). To estimate the total virus yield, cultures were treated with 1/20 volume of chloroform for 15 min at 37°C with shaking (850 rpm) in thermoblock. For the estimation of the extracellular virus fraction, chloroform treatment was omitted. Virus supernatants were harvested upon centrifugation at 13000 xg and maintained at 4°C for short-term use (less than 15 days) or at -80°C for long-term storage. Virus titers were determined by plaque assay and expressed as the number of pfu per mL of the phage suspension.
Evolution Experiment
This virus QβAnc was used to initiate 5 replicate evolutionary lineages differing in the amount of bacteria that was available for infection (Figure 1), and that were propagated through 16 serial transfers or until the virus infectivity was extinguished. At each transfer, bacteria were freshly prepared by growing E. coli until an OD600 of 0.8, which according our estimations corresponds to 6 x 10⁸ colony forming units (cfu) per mL (https://www.agilent.com/store/biocalculators/calcODBacterial.jsp). The culture was serially diluted in NB medium (10-1, 10-2, 10-3, and 10-4 dilutions), and 0.5 mL of each dilution were placed in 10 mL tubes containing 400 µL of NB. A control culture with undiluted bacteria was prepared in the same way. Infections were initiated with 106 pfu (the first two transfers) or 107 pfu (the rest of transfers) in 100 µL of phage buffer (25 mM Tris HCl pH 7.5, 5 mM MgCl2, 0.5 g/L gelatin). In the case of the lineages propagated at the lowest bacteria density, due to the low yield obtained, from transfer number 2 we initiated the infections with 100 µL of the undiluted previous supernatant. After 2 h of incubation under standard conditions, the virus supernatants were collected upon treatment with chloroform, and a fraction of the phage suspension was used to infect fresh E. coli cultures prepared as described above. Evolutionary lineages were denoted Qβ(3x10⁸), Qβ(3x10⁷), Qβ(3x10⁶), Qβ(3x10⁵), and Qβ(3x10⁴) to indicate the bacterial density used for virus propagation. When necessary, the numbers 1 and 2 were used to distinguish the two replicas performed for each condition.
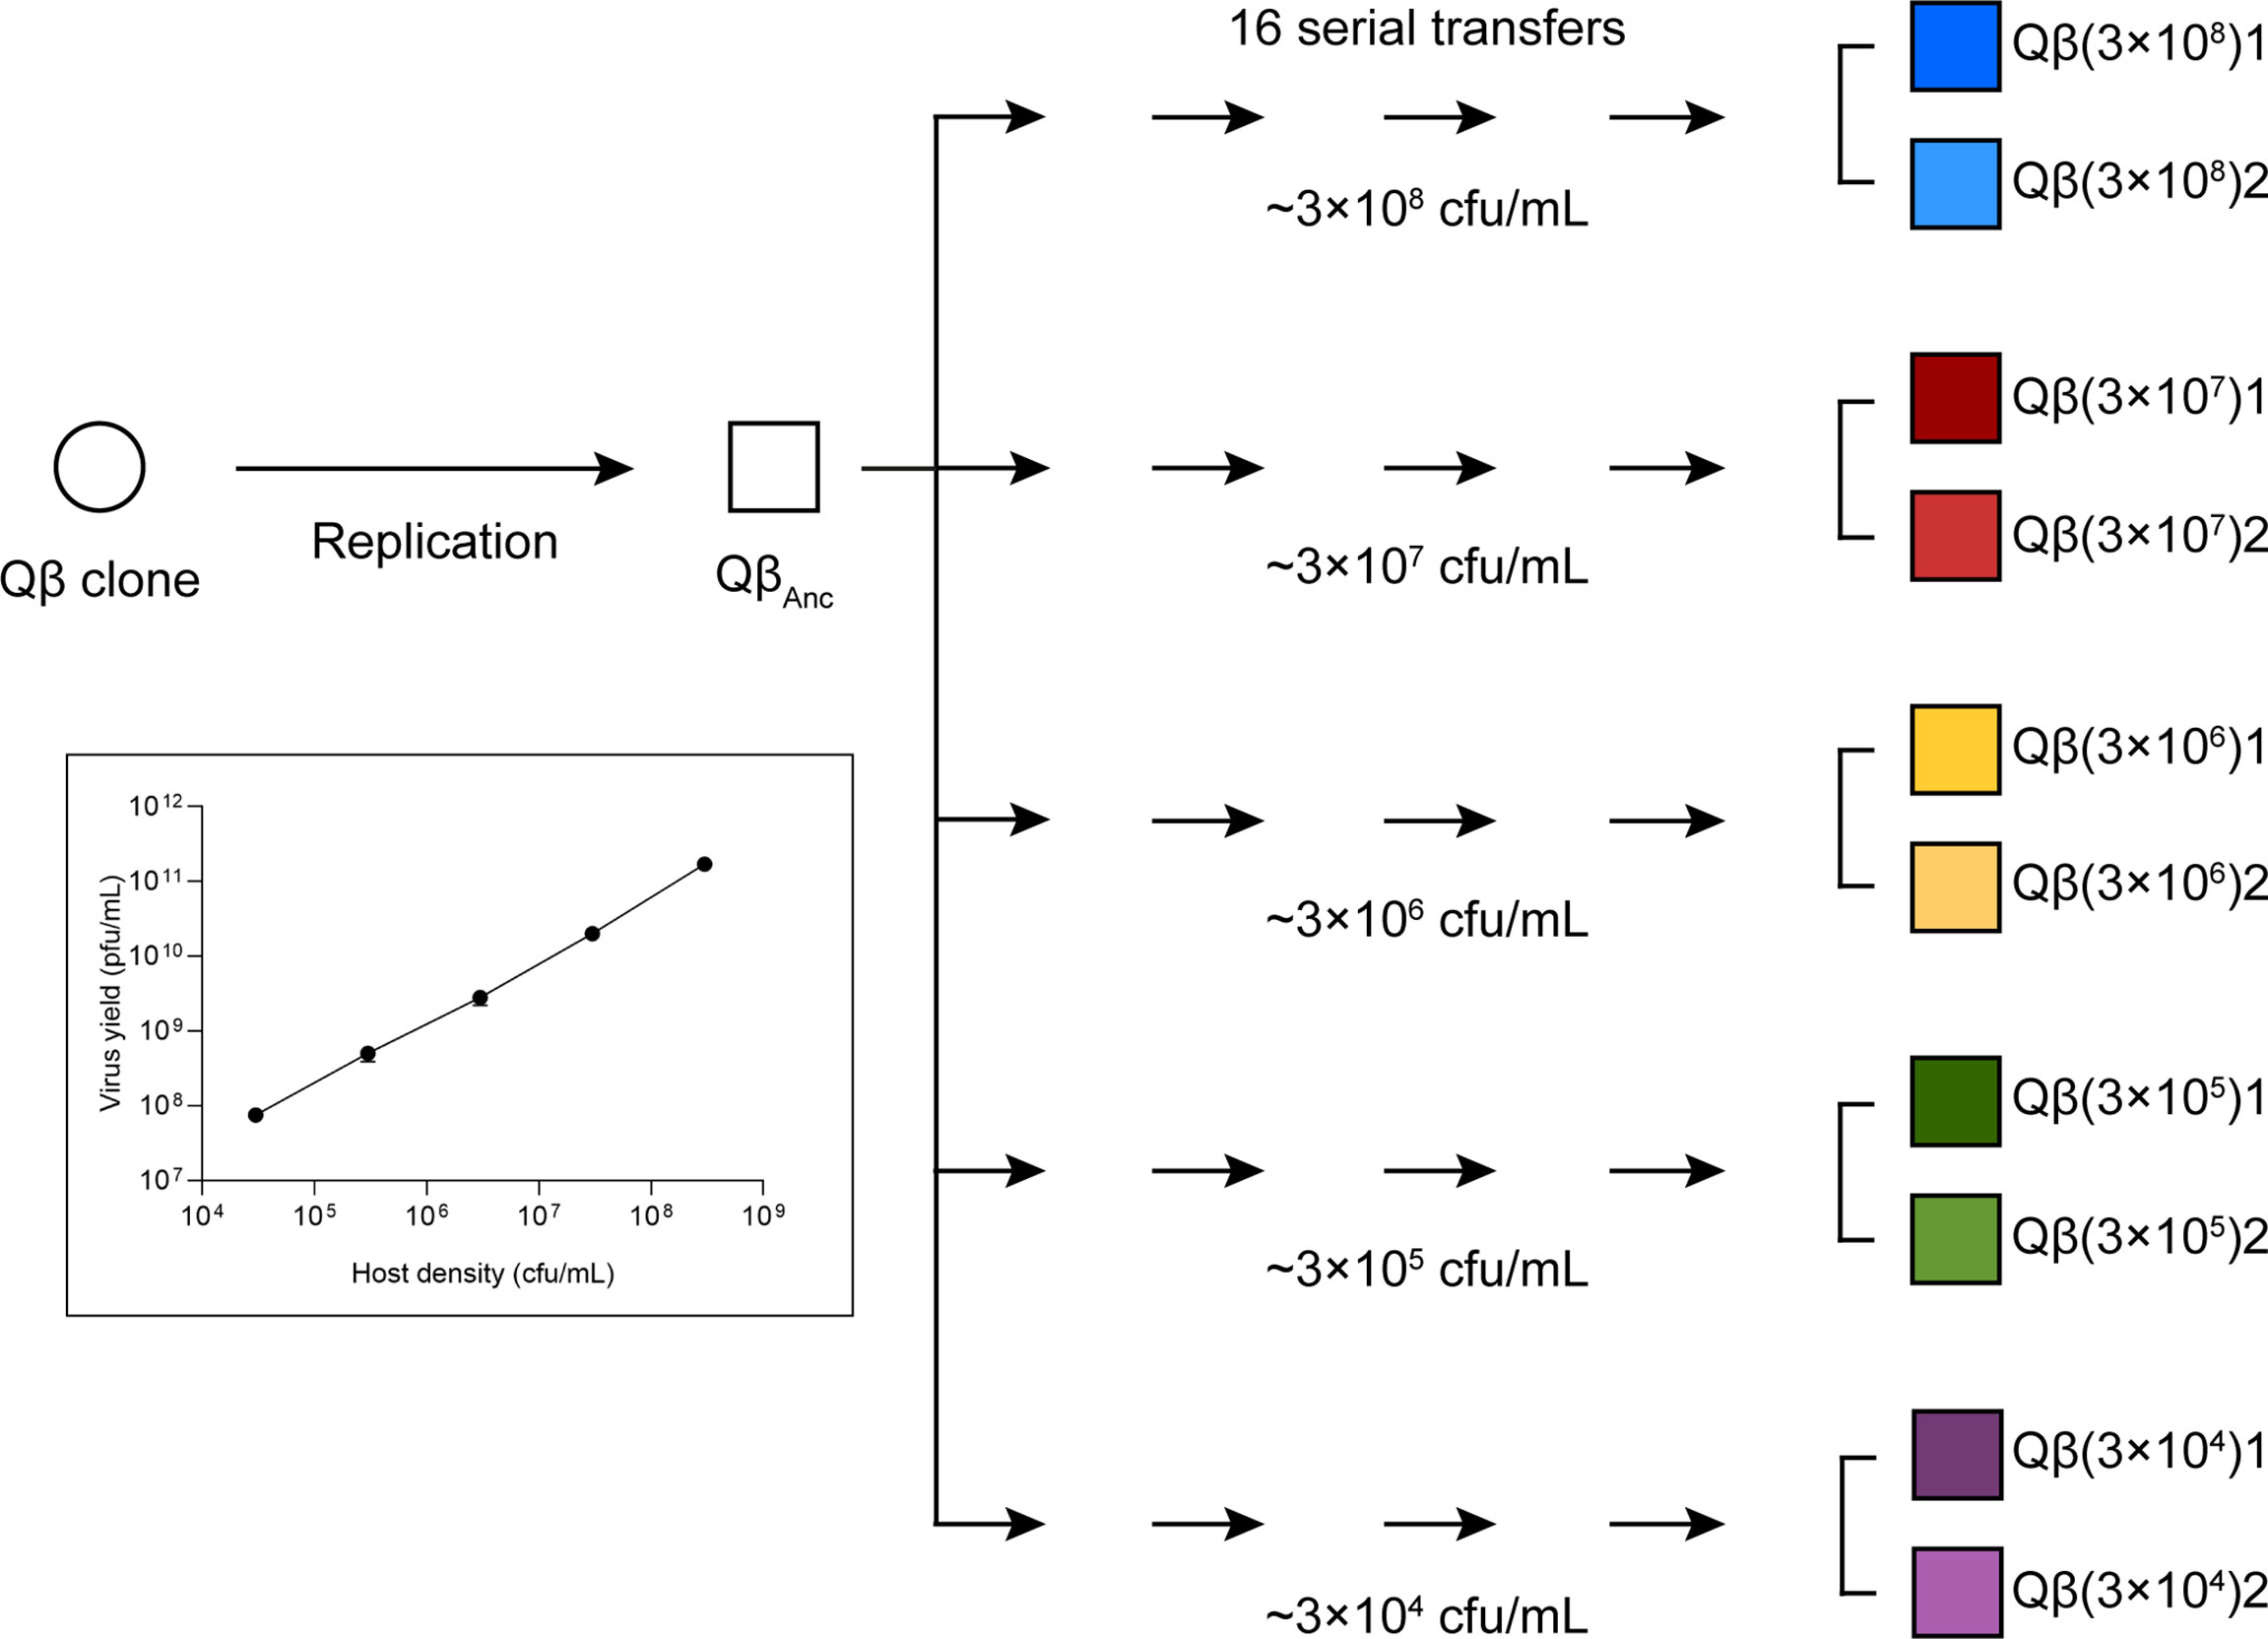
Figure 1 Scheme of the evolution experiment. A lytic plaque obtained upon expression of the plasmid pBRT7Qβ was allowed to replicate for 2 h in E. coli Hfr under standard conditions. The population obtained (QβAnc) was propagated through serial transfers carried out at different bacterial densities (see Materials and Methods). Evolutionary lineages are represented in different colors and named according to the bacterial density assayed. All lineages were replicated and the replicas distinguished with the numbers 1 and 2. The inset represents an experiment in which the bacteria concentrations indicated in the x axis were infected with 107 pfu and incubated for 2 h under standard conditions (see Material and Methods). Supernatants were collected, treated with chloroform and titrated to determine the virus yield. All bacterial concentrations were assayed in duplicate.
A negative control in which undiluted bacteria were incubated in culture medium in the absence of virus was set at each transfer. This control was processed and plated exactly the same as the experimental samples. When lytic plaques appeared, the corresponding transfer was discarded and repeated again.
Determination of the Virus Replicative Ability
The virus yields obtained in replication assays carried out in liquid medium were used as a measure of the virus replicative ability. Triplicate liquid cultures containing the indicated bacteria density were inoculated with 104 pfu of the virus population assayed, in a final volume of 1 mL. We used this amount of virus to ensure that the replicative capacity of the system was not saturated. After two hours of incubation at 37°C, the culture was distributed in two aliquots to estimate either the total or the extracellular virus produced. In this case, total virus was estimated through treatment with 0.8 mg/mL of egg white lysozyme (Sigma-Aldrich) for 30 min at 37°C with shaking (850 rpm in thermoblock). Lysozyme was used instead of chloroform because of its higher efficiency to lysate cells, demonstrated in several lysis assays carried out in our lab (data not shown). Extracellular virus was estimated in the same way but in the absence of lysozyme treatment.
Site-Directed Mutagenesis
The plasmid pBRT7Qβ was used to engineer a single-mutant virus (QβT222N) containing the mutation C2011A that produces the change T222N in the A1 protein. Mutagenesis was carried out using the QuickChange Lightning Site-Directed Mutagenesis Kit (Agilent Technologies) with the primer 5’TGGGATTCTCGGCTTAGTTATAACACGTTCCGCGG3’ and its complementary that contain the mutation to introduce in the virus genome. The procedures to build and isolate the site-directed mutant were the same as previously described for other Qβ mutants (20). A lytic plaque generated in E. coli Hfr by the virus QβT222N was picked and sequenced to test the presence of the desired mutation and the absence of any other that might have arisen during the mutagenesis process.
Competition Experiments
Competitions were carried out by infecting bacteria at the indicated density with equal amounts (106 pfu) of the viruses QβAnc and QβT222N in a final volume of 1 mL. After 2 h of incubation, the viral supernatant was collected, and 106 pfu were used to initiate a new infection. In all cases, competitions were carried out in duplicate. The consensus sequences of the populations obtained after 5 transfers were determined to test whether one of the viruses had out-competed the other, which was visualized through the inspection in the chromatograms of the nucleotide position that distinguished the two competitors.
Plaque Size Assays
Areas of the lysis plaques formed by QβAnc and the mutant QβT222N were quantified to define the differences between them. Around 100 pfu of each virus were mixed with ~ 3 x 10⁸ bacteria and 3 mL of semisolid agar, and plated in agar plaques that had been prepared using the same volume of the same preparation of LB-agar (Invitrogen). Plaques were incubated overnight at 37°C. Images of the Petri dishes were taken with ChemiDoc MP Imaging System (Bio-Rad) using a white sample tray and “Coomasie Blue” mode. Images were analyzed with Image Lab Software (Bio-Rad) (RRID : SCR_014210), using the tool “Volume Tool-Round” to manually select seventy lysis plaques of each virus and measure their area values. Area values shown for both viruses are the mean of those seventy data.
Determination of Virus Entry Into Bacteria
Triplicate liquid 1 mL cultures, containing bacteria and virus at the concentration indicated in each experiment, were incubated at 37°C and 75 rpm. At the indicated times, 100 µL of EDTA 100 mM were added to stop virus entry into the bacteria. A control experiment showed that incubation of Qβ with this EDTA concentration completely inhibited its entry into E. coli, which agrees with previous results obtained for other phages (21). Cultures were centrifuged at 13000 xg at 4°C and the supernatant was discarded. The pellet was washed once with 500 μL of cold phage buffer containing EDTA 10 mM and re-suspended in phage buffer without EDTA. The number of infectious centers was estimated by plaque assay. Parallel cultures that were incubated at 4°C in the presence of EDTA 10 mM were used to estimate the virus background.
One Step Growth Curve
Duplicate 1mL liquid cultures containing 3 x 10⁸ bacteria and 106 pfu of the viruses QβAnc or QβT222N were incubated for 5 min at 37°C in NB medium and 75 rpm. Virus entry was stopped by a 10000-fold dilution of the cultures. Diluted cultures were incubated at 37°C in a static bath, and only mixed by inversion right before taking the samples to avoid additional encounters between cells and viruses. At different times, 250 µL aliquots were removed and centrifuged to obtain the virus supernatants that were titrated to estimate the amount of virus that had been released. The duration of the latent period was calculated as the intercept between the regression line of the natural logarithm of the virus titers against time during the exponential rise period and the regression line for the points corresponding to the pre-rise period. The maximal growth rate was evaluated as the slope of the regression line during the rise period
Burst Size Determination
Triplicate 1mL liquid cultures containing 3 x 10⁸ bacteria and 106 pfu of the virus indicated were incubated for 10 min at 37°C in NB medium and 75 rpm to allow virus entry into the bacteria. After this time, a 0.3 mL aliquot was removed to determine the number of infectious centers as described above. The remaining 0.7 mL were diluted 100000-fold. The diluted cultures were incubated at 37°C, 250 rpm for 55 min, after which 0.3 mL aliquots were removed and centrifuged. The virus supernatants were titrated to estimate the amount of extracellular virus. The burst size was calculated by dividing the number of pfu obtained by the number of infectious centers.
RNA Extraction, cDNA Synthesis, PCR Amplification, and Nucleotide Sequencing
Viral RNA was prepared following standard procedures to determine the consensus sequence either from biological clones or from complex virus populations. RNAs were used for cDNA synthesis with the avian myeloblastosis virus reverse transcriptase (Promega), followed by PCR amplification using Expand high-fidelity DNA polymerase (Roche). The pairs of oligonucleotide primers used for RT-PCR were the following: P1 forward (5’CTTTAGGGGGTCACCTCACAC3’) with P1 reverse (5’GGATGGGTCACAAGAACCGT3’) to amplify from nucleotide position 10 to 1595, P2 forward (5’GACGTGACATCCGGCTCAAA3’′) with P2 reverse (5’CAACGGACGGAACATCTCCT3’′) to amplify from nucleotide position 1109 to 2787 and P3 forward (5′GTGCCATACCGTTTGACT3′) with P3 reverse (5′GATCCCCCTCTCACTCGT3′) to amplify from nucleotide position 2254 to 4195. PCR products were column purified (Qiagen) and subjected to standard Sanger sequencing using Big Dye Chemistry with an automated sequencer (Applied Biosystems; Perkin Elmer). Sequences were assembled and aligned with Geneious Pro v4.8.5 (https://www.geneious.com). Mutations relative to the sequence of the virus QβAnc were identified using the same software.
Statistics
The statistical significance of the differences between the results obtained for the viruses QβAnc, QβT222N and the evolutionary lineages at transfer 16 was assayed through the Mann Whitney test. When indicated, experimental points were fitted to straight lines or other functions. All calculations were performed with the program Mathematica 9.0 (Wolfram Research), using the functions MannWhitneyTest with a significance level of p < 0.05, LinearFit (fit to straight lines through regression analysis) and NonLinearFit (fit to functions different of straight lines).
Results
Bacteriophage Qβ Can Adapt to Replicate at Lower-Than-Optimal Host Density
To investigate whether bacteriophage Qβ can evolve adaptive strategies to decreased host availability, we designed an evolution experiment (Figure 1) in which the virus QβAnc was propagated at different bacteria densities: 3 x 10⁸ cfu/mL, 3 x 10⁷ cfu/mL, 3 x 10⁶ cfu/mL, 3 x 10⁵ cfu/mL, and 3 x 10⁴ cfu/mL. We did not assayed higher bacteria concentrations because that would have implied growing them until an OD600 higher than 0.8, when they enter in late exponential phase and pili expression starts to decay. The results obtained at the first transfer, in which infections were carried out with 106 pfu, showed that 3 x 10⁷ cfu/mL produced the highest titers (Figure 2). The number of pfu used in the experiment was the same for all bacteria densities, meaning that the moi was higher the lower the bacterial density was. Since, at all bacteria densities assayed, we observed a decrease in the virus titers between the two first transfers, to avoid virus extinction, from transfer 3 we initiated infections with 107 pfu in all lineages but Qβ(3x10⁴), in which, due to the low virus yield obtained, we could not use 107 pfu, and instead we infected with 100 µL of the undiluted previous virus supernatant. To analyze the changes in the virus yield as a function of the bacteria density when infections were carried out with 107 pfu, we carried out a control experiment with the virus QβAnc (see the inset in Figure 1). The results showed that, with this amount of virus, a bacterial density of 3 x 10⁸ cfu/mL produced the highest titers. Thus, we considered that the optimal bacterial density, under the conditions used in most transfers of the evolution experiment, was around 3 x 10⁸ cfu/mL.
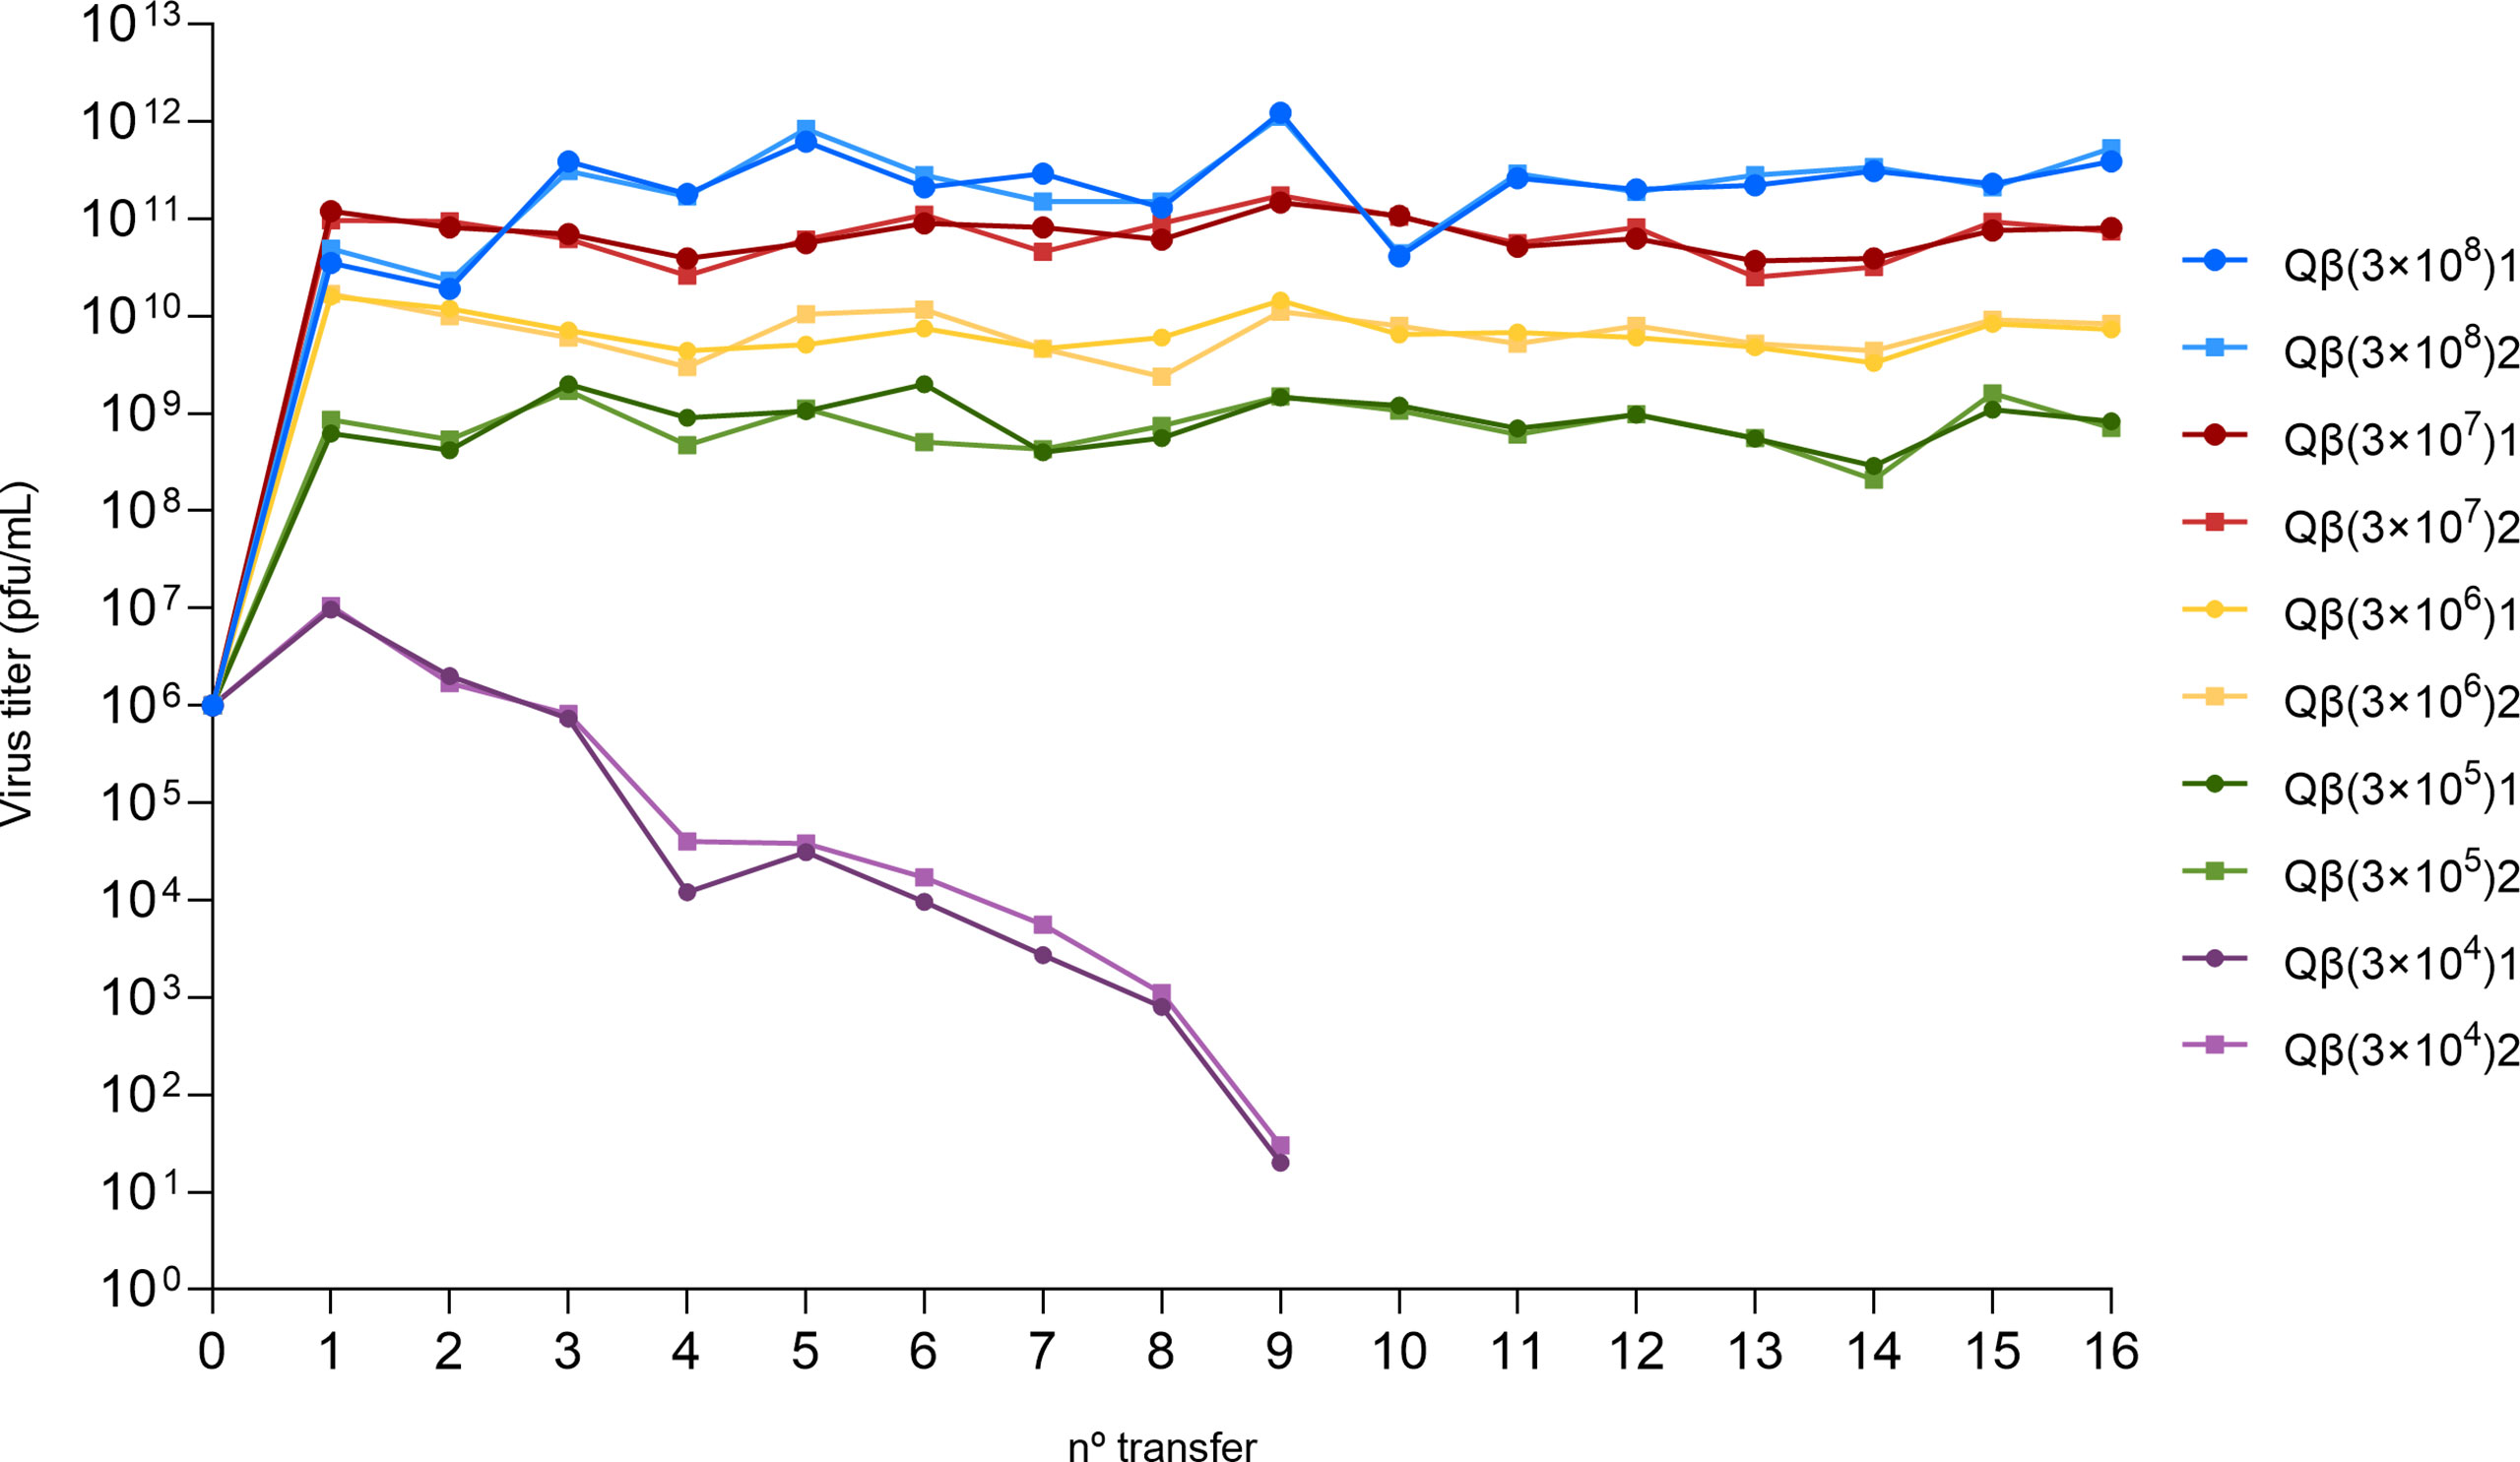
Figure 2 Virus titers obtained at each transfer of the evolution experiment (Figure 1). The color code used to distinguish the lineages evolved at different host density is the same shown in Figure 1. In each case, lineage 1 is represented with circles and lineage 2 with squares.
Both lineages Qβ(3x10⁴) were extinguished by transfer 10, indicating that the minimal bacterial density that allows sustained propagation of Qβ under the conditions assayed is around 3 x 10⁵ cfu/mL. In all other lineages, virus titers did not change significantly from transfer 3 to 16 and kept a direct relationship with the host density (Figure 2). Virus populations obtained at the last transfer were assayed to determine their replicative ability at the same bacteria concentration at which they had been propagated. When the total virus was considered, only evolutionary lineages propagated at the highest and the lowest host density compatible with virus maintenance for the 16 transfers [Qβ(3x10⁸) and Qβ(3x10⁵)] increased the virus yield with respect to the ancestor (p < 0.05, Mann Whitney test) (Figure 3A). Nevertheless, all evolutionary lineages propagated at lower-than-optimal host densities significantly increased the amount of extracellular virus produced (p < 0.05, Mann Whitney test for all comparisons carried out between the ancestor and the evolutionary lineages assayed at the same host density) (Figure 3B), suggesting that the virus had modified some of the parameters defining its life cycle.
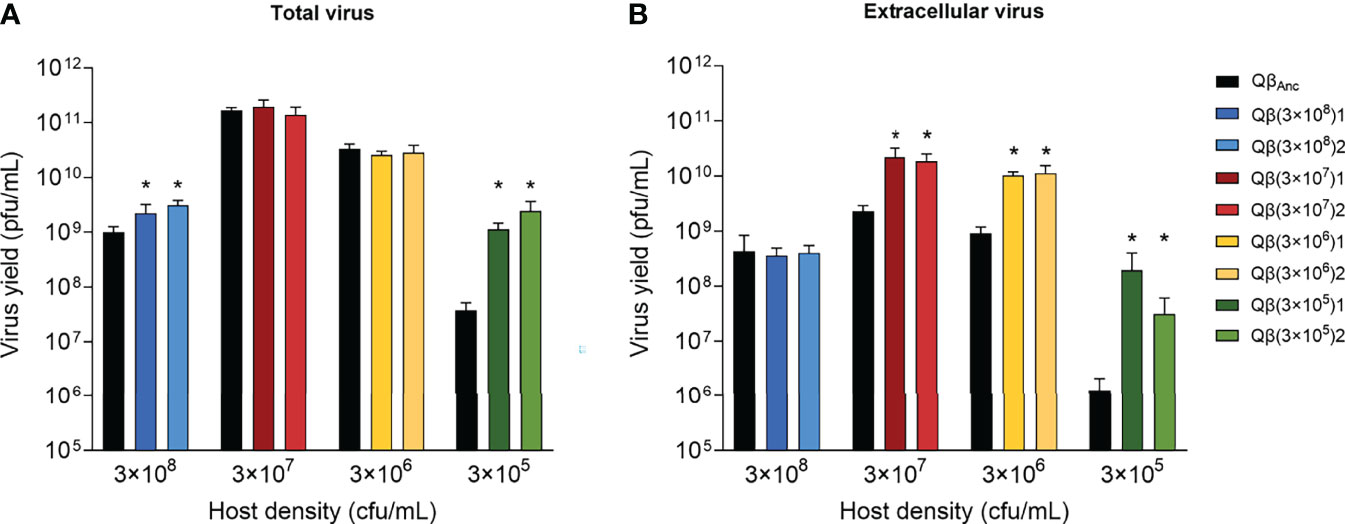
Figure 3 Replicative ability of the lineages obtained at transfer number 16 in comparison with the ancestor. Each evolutionary lineage was assayed at the same bacteria density at which it had evolved (indicated at the bottom of the figure). Each bar represents the average of three replicas. The color code used to distinguish the different lineages is the same shown in Figure 1. The virus QβAnc, which was assayed at all host densities, is shown in black. (A) Total virus. (B) Extracellular virus. Asterisks above the bars indicate that the result is significantly different from the value obtained for the virus QβAnc (p < 0.05) according to a Mann Whitney test. The absence of asterisk indicates that the value obtained did not significantly differ from that of the ancestor. The type 1 error for multiple comparisons (two evolutionary lines were compared with the ancestor at each bacterial density tested) was 0.1.
Another interesting observation was that in the assay shown in Figure 3, in which infections were carried out with 104 pfu, the maximum virus yield of the virus QβAnc was obtained at a bacteria concentration of 3 x 10⁷ cfu/mL (Figure 3), the same than infecting with 106 pfu (see the first transfer in Figure 2) and one order of magnitude lower than when infections were carried out with 107 pfu (see inset in Figure 1). The result indicates that, keeping constant the rest of conditions, the amount of virus used for infections is what determines the bacteria concentration that renders the maximal virus yield. To test this idea, we carried out an experiment in which two concentrations of bacteria (3 x 10⁸ cfu/mL and 3 x 10⁵ cfu/mL) were infected with different amounts of the virus QβAnc (104, 105, 106, and 107 pfu). The result was that, for the high bacteria concentration, the logarithm of the virus yield increased almost linearly as a function of the logarithm of the number of pfu used in the infection. However, for the low bacteria concentration, the virus yield was maximum when 106 or 107 pfu were used for infections, with non-significant differences between both conditions (Supplementary Figure 1).
An additional finding that suggested that the virus had changed its properties upon propagation at decreased cell densities was that the size of the plaques became smaller than that observed for the lineages propagated at the optimal bacterial density.
Populations Adapted to Low Host Density Show in Their Consensus Sequences a Non-Synonymous Change in the A1 Protein
The determination of the consensus sequences of all evolutionary lineages analyzed in this work showed the presence of several mutations either fixed or polymorphic (Table 1). Mutations present in the lineages propagated at the optimal host density had previously been detected in several experiments of propagation of Qβ carried out in our lab (22–24). In the case of the lineages propagated at decreased host density, the most relevant observation was the presence in all of them of the non-synonymous change C2011A (T222N in the A1 protein).
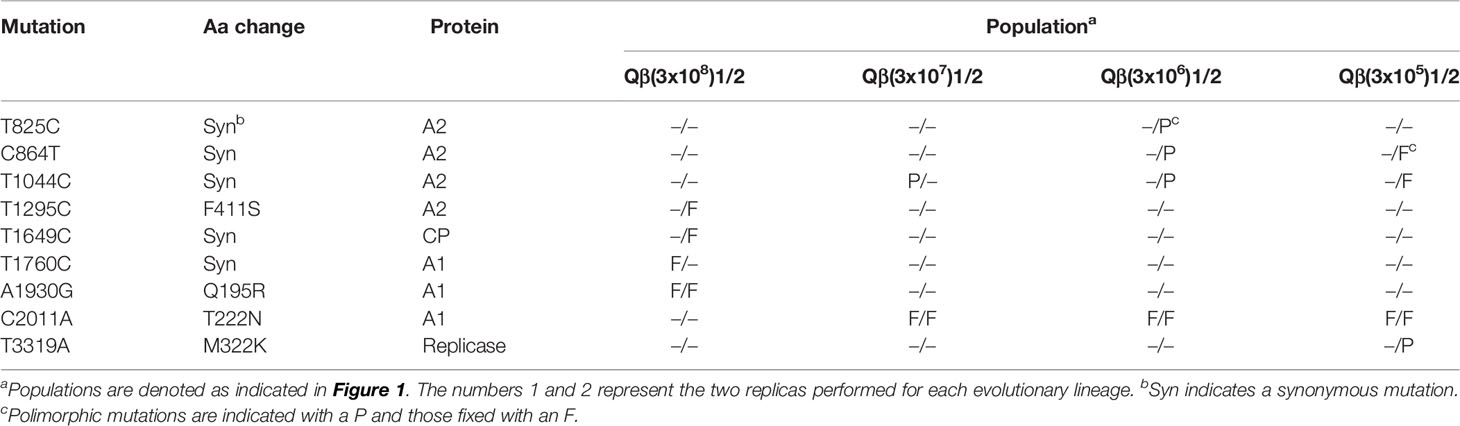
Table 1 Mutations present in the consensus sequences of the evolutionary lineages analyzed.
To analyze the effect of C2011A in the replication of Qβ, we prepared a single mutant containing this mutation (QβT222N) and determined its replicative ability at different host densities in comparison with that of the virus QβAnc (Figure 4).
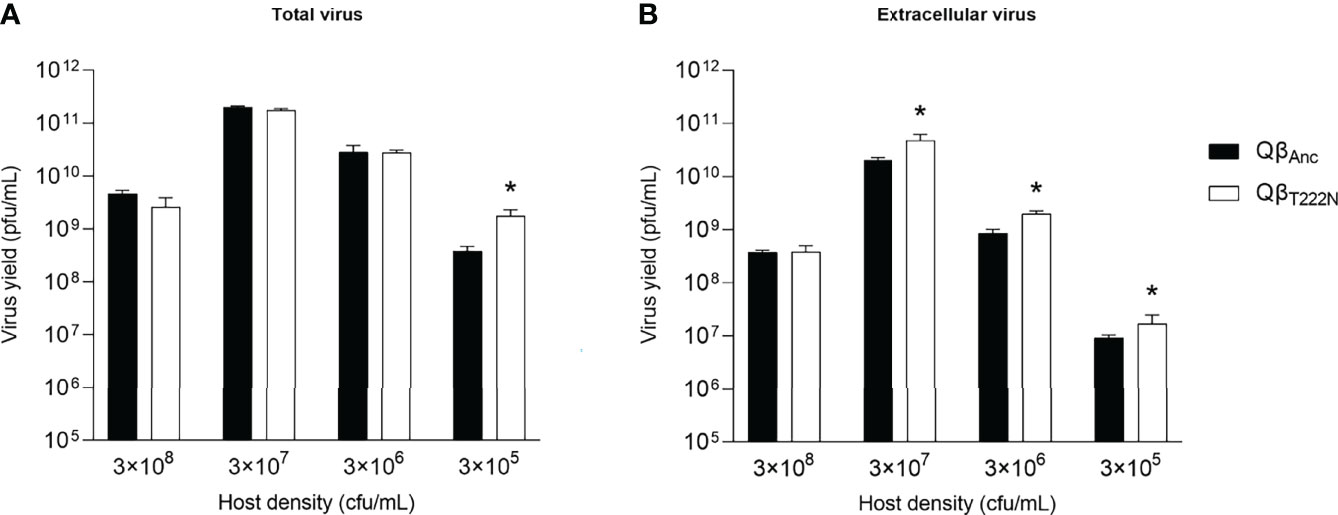
Figure 4 Replicative ability of the viruses QβAnc and QβT222N. Each bar represents the average of three replicas for either QβAnc (black) or QβT222N (white). Both viruses were assayed at the bacteria density indicated at the bottom of the figure. (A) Total virus. (B) Extracellular virus. Asterisks above the bars indicate that the result is significantly different from the value obtained for the virus QβAnc (p < 0.05) according to a Mann Whitney test. The absence of asterisk indicates that the value obtained did not significantly differ from that of the ancestor.
We observed that the mutant QβT222N presented a behavior similar to that of the evolutionary lineages propagated at decreased bacteria density (Figure 3). The mutant significantly increased the total virus yield at only the lowest host density assayed (3x 10⁵ cfu/mL) (p < 0.05, Mann Whitney test) (Figure 4A). However, when the extracellular virus was determined, the titers obtained for the mutant were significantly higher than those produced by the virus QβAnc at all lower-than-optimal host densities (p < 0.05, Mann Whitney test for all comparisons carried out between the ancestor and the mutant assayed at the same host density) (Figure 4B). In general, differences between the ancestor and the mutant were of lower magnitude than between the ancestor and the evolutionary lineages (compare Figures 3, 4), which in part could be due to the effect of the rest of mutations that are present in the consensus sequences of the latter (Table 1).
To further analyze the selective advantages of substitution C2011A at low host density, we carried out competition experiments in which the viruses QβAnc and QβT222N were mixed in equal amounts and propagated at bacteria concentrations of 3 x 10⁸, 3 x 10⁷, 3 x 10⁶, and 3 x 10⁵ cfu/mL. After only 5 transfers the mutant was dominant at all host concentrations below 3 x 10⁸ cfu/mL, indicating that mutation C2011A has an advantage under these conditions (Figure 5). The fact that the mutation was selected against when competitions were carried out at 3 x 10⁸ cfu/mL, suggests that it has a fitness cost at this host density. The result is consistent with the slightly lower titers observed for the mutant than for the wild virus in the replication assay carried out at this bacteria concentration (Figure 4A).
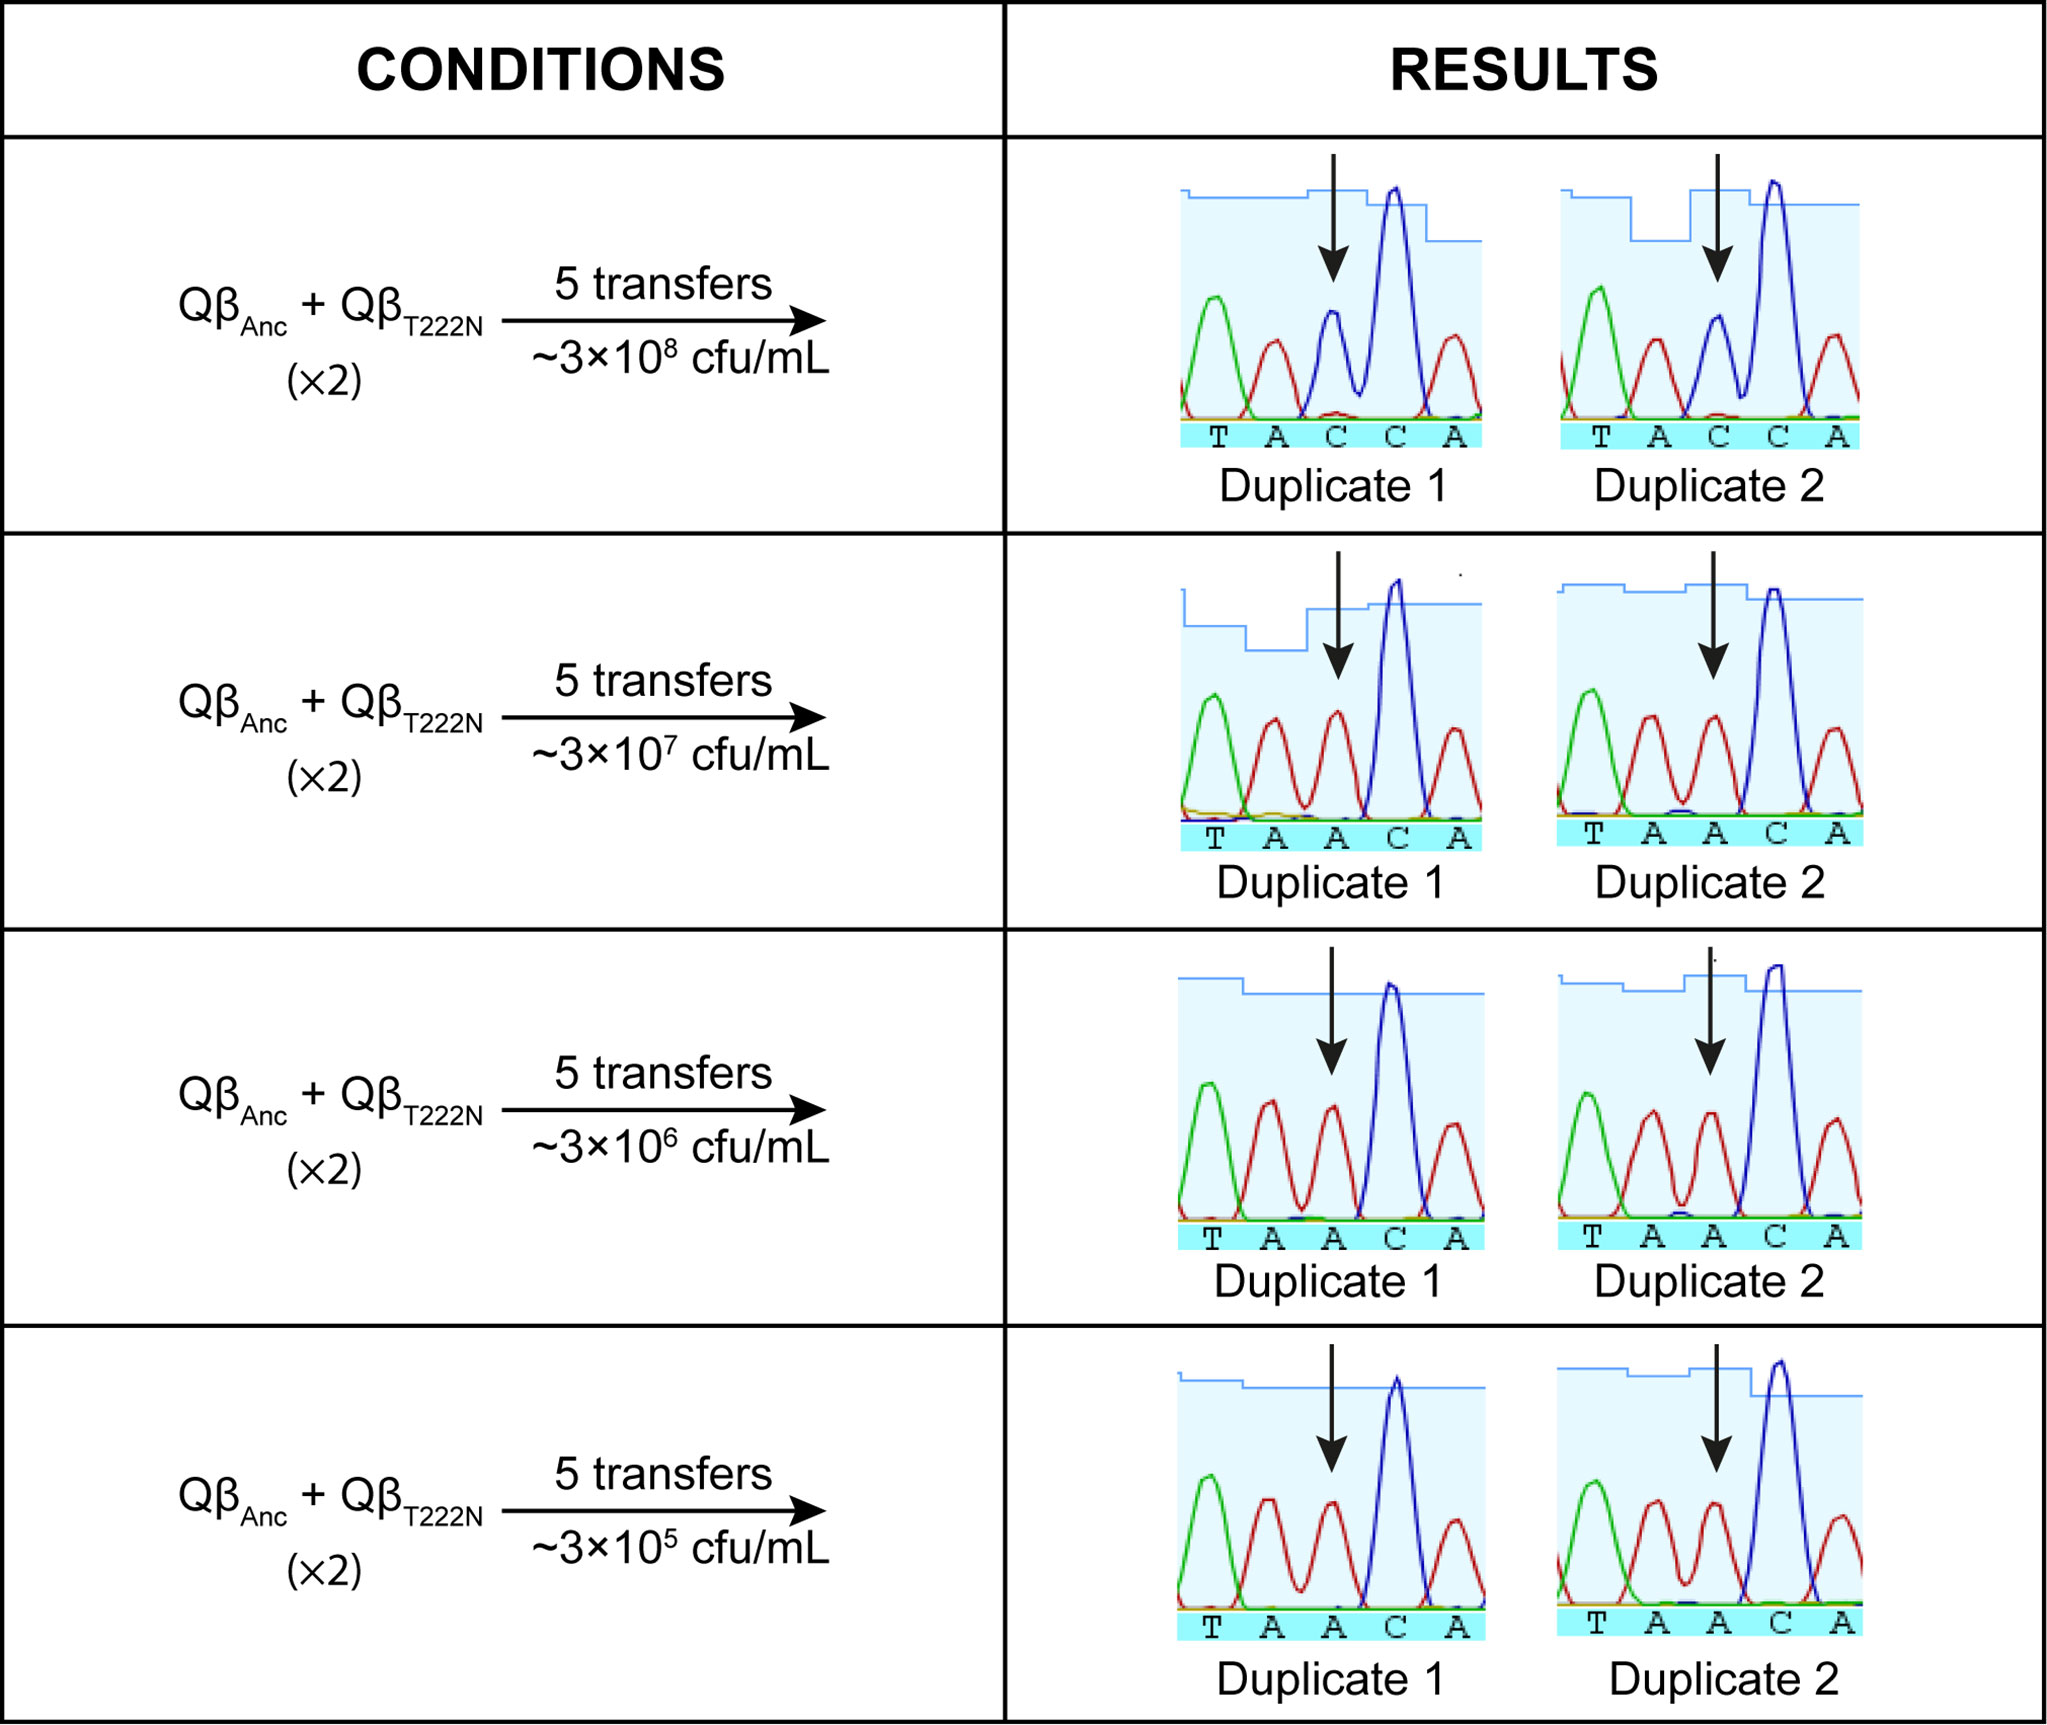
Figure 5 Competition experiment between the viruses QβAnc and QβT222N. The left part of the figure shows the conditions for the competition (described also in Materials and Methods). The right part shows the chromatograms of the populations obtained after the competition around nucleotide position 2011 (marked with an arrow). The presence of a C at this position indicates that the mutant has not an advantage over the wild-type virus, whereas the presence of an A indicates the opposite.
The mutant QβT222N also produced smaller plaques than the virus QβAnc, indicating that this mutation is also responsible for this phenotypic change that was observed in all evolutionary lineages propagated at lower-than-optimal host density. To confirm this observation, we determined the area of 70 lytic plaques produced by each of the viruses QβAnc and QβT222N using the Software Image Lab Software. The average of the plaque areas produced by QβAnc was 3.04 ± 1.31 mm2, which is significantly higher than that of the plaques produced by QβT222N (1.49 ± 0.88 mm2) (p = 1.51271 x 10⁻¹², Mann Whitney test)
Mutation T222N in the A1 Protein Does Not Increase Virus Thermostability at 37°C
At low host availability, the period that the phage spends in the environment until it finds a susceptible bacteria increases with respect to conditions of high host density. Therefore, it is exposed to environmental conditions for a longer time, which can damage its infective capacity. To analyze this possibility, we designed an experiment in which triplicate cultures contained ~ 8 x10⁵ pfu of either the virus QβAnc or QβT222N were incubated at 37°C in 1 mL of NB medium in the same conditions of the transfers but in the absence of bacteria. We took samples at 1 and 2 hours post-incubation and determined the virus titers, verifying that in no case had they decreased. The conclusion, therefore, is that the effect of mutation T222N is not to increase the stability of the phage in the external environment.
Mutation T222N in the A1 Protein Increases Virus Entry at All Bacteria Densities Assayed
The location of the mutation T222N in the A1 protein, a structural protein of the capsid, suggested that its effect could be to enhance the virus entry into the cell. To test this idea, we determined the rate of virus entry for the viruses QβAnc and QβT222N (Figure 6A) using a high bacteria concentration (3 x 10⁸ cfu/mL). The experimental points were fitted to a model of the form:
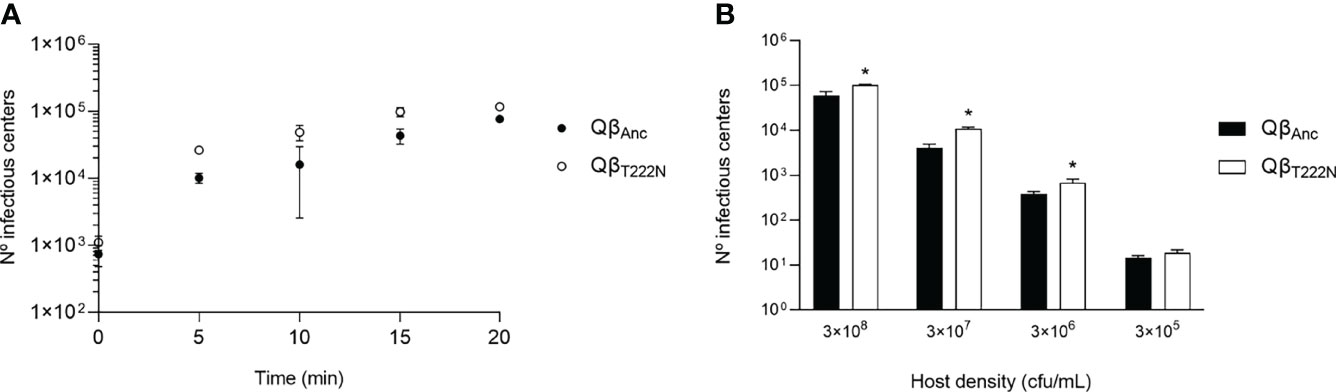
Figure 6 Virus entry into the bacteria. (A) Kinetics of virus entry. 105 pfu of either the virus QβAnc (black circles) or QβT222N (white circles) were incubated with ~ 3 x 10⁸ cfu in a volume of 1 mL. After the times indicated, the samples were processed (see Materials and Methods) to determine the number of infectious centers. Each determination was carried out in triplicate (B) Number of infectious centers produced upon a 10 min incubation. 105 pfu of either the virus QβAnc (black bars) or QβT222N (white bars) were incubated with different concentrations of bacteria (indicated at the bottom of the figure). Each bar represents the average of three determinations. Asterisks above the bars indicate that the result is significantly different from the value obtained for the virus QβAnc (p < 0.05) according to a Mann Whitney test. The absence of asterisk indicates that the value obtained did not significantly differ from that of the ancestor.
where P is the amount of phage that has adsorbed or penetrated into the bacteria, P0 is the number of pfu used in the experiment (100000 in this case), N is the bacterial density, and k represents the adsorption constant. The variable time is indicated by t.
We obtained a value for the exponent kN of 0.043 (standard error = 0.009, R2 = 0.97) for the virus QβAnc and of 0.11 (standard error = 0.04, R2 = 0.89) for the virus QβT222N. Since each value was out of the confidence interval of the other, we can conclude that they differ significantly. The values of k for the ancestor and the mutant were 1.3 x 10⁻¹⁰ mL/min and 3.7 x 10⁻¹⁰ mL/min respectively, which indicates that the mutation enhances the rate of virus entry by a factor of about 3.
An additional determination of the virus entry at different host densities for a fixed time period (10 min) also showed that the virus QβT222N entered better into the bacteria than the ancestor (Figure 6B). The differences were significant for all bacteria densities but 3 x 10⁵ cfu/mL (p < 0.05, Mann Whitney test).
The fact that, despite that mutation T222N enhances the entry of the virus at high host density (3 x 10⁸ cfu/mL), it was selected against in competition experiments carried out under this condition reinforced the idea that it has a fitness cost. Thus, we analyzed the possible differences in the latent period and the burst size of the viruses QβAnc and QβT222N.
One Step Growth Curves Do Not Show Differences in the Latent Period Between the Mutant and the Ancestor
To determine the duration of the latent periods of the viruses QβAnc and QβT222N, we carried out one-step growth curves. To reduce differences that could be due to the faster entry of the mutant, virus interaction with bacteria in the undiluted culture was allowed for only 5 min, after which it was diluted 10000-fold to prevent new infections. The curves obtained (Figure 7) show great similarities between both viruses, which presented a latent period estimated in 29 minutes for the ancestor and 27 minutes for the mutant (see Materials and Methods), a result that agrees with previous estimations (25). Since the period for virus entry was of 5 min, differences lower than this time cannot be considered significant. The estimation of the maximal growth rate during the rise period of the curves (see Materials and Methods) was 0.34 ± 0.06 for the mutant and 0.32 ± 0.05 for the ancestor. Since each value was included in the confidence interval of the other, we can conclude that they do not differ significantly.
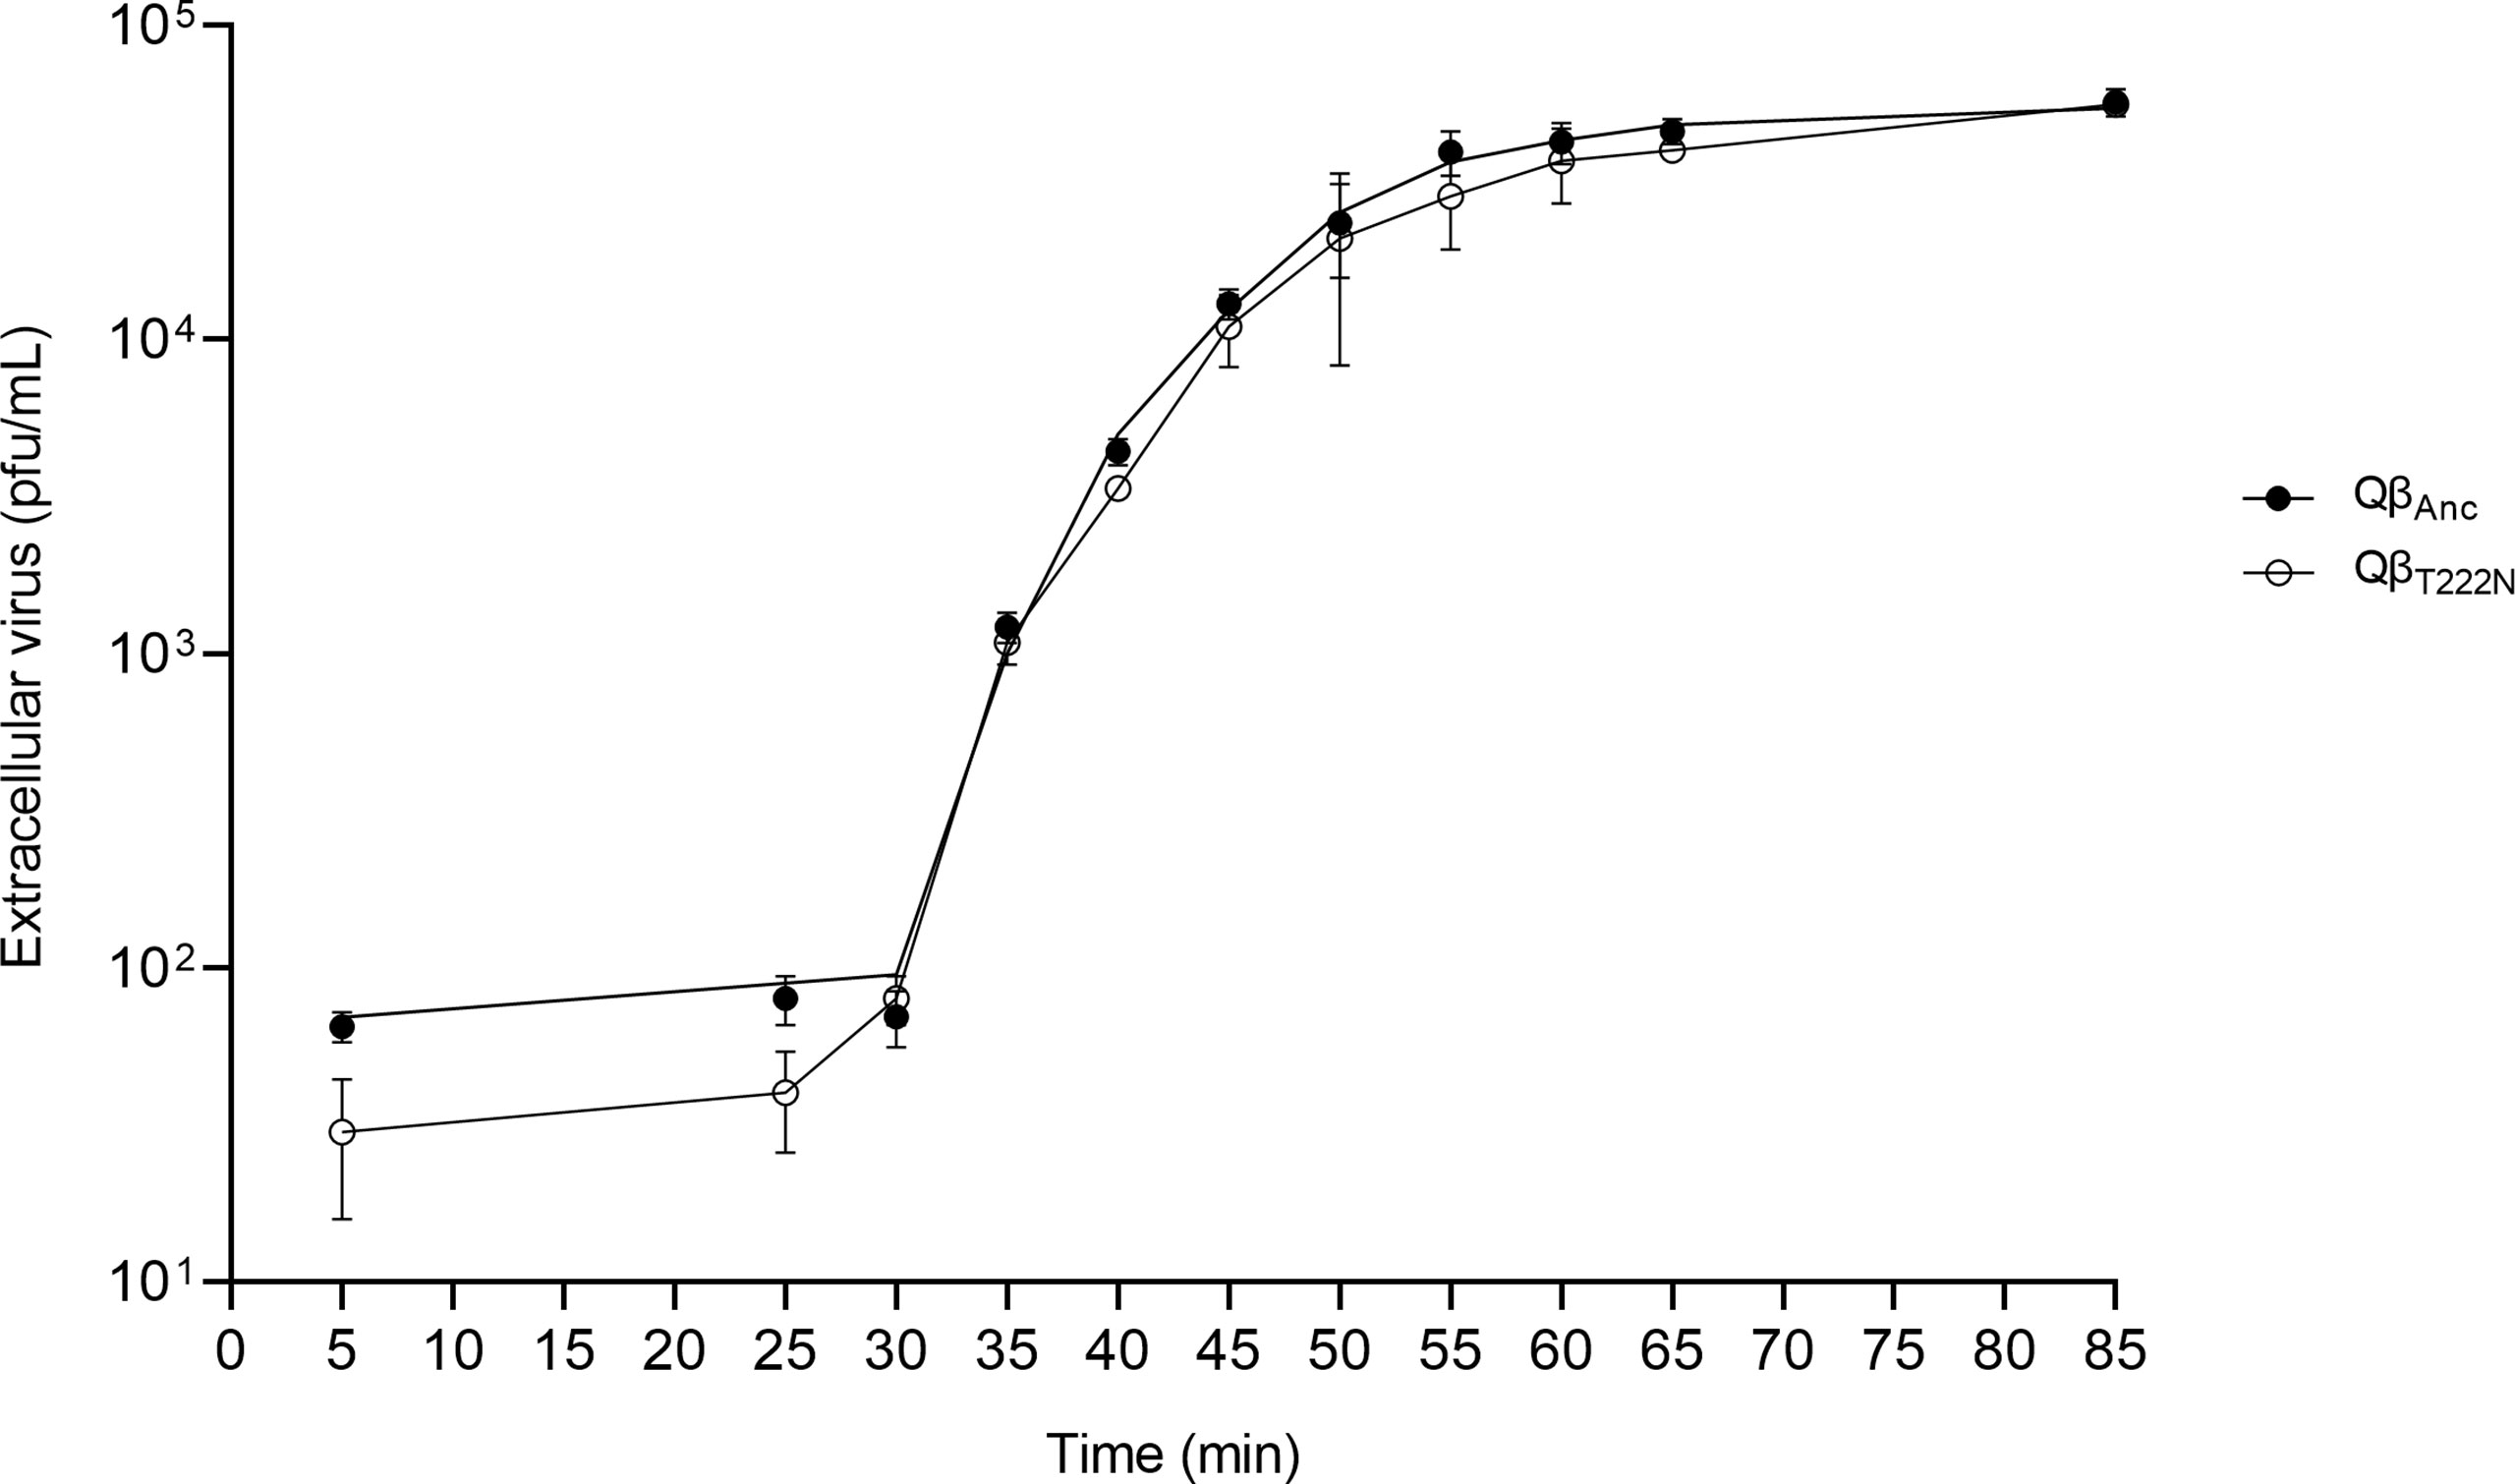
Figure 7 One step growth curve for the viruses QβAnc and QβT222N. 106 pfu of each virus were pre- incubated for 5 min with ~ 3 x 10⁸ cfu in a volume of 1 mL. The first sample (time 5 min in the curves) was taken just after dilution of the cultures (see Materials and Methods). Black circles refer to the virus QβAnc and white circles to the virus QβT222N. Each point represents the average of two replicas.
Mutation T222N Does Not Induce Significant Changes in the Burst Size of Qβ
To determine the burst size of viruses QβAnc and QβT222N, we carried out an assay in which the viruses were allowed to entry into the bacteria for 10 min, after which the culture was diluted 100000-fold to prevent further virus entry. The estimation of the extracellular virus yield at 55 min post-dilution (a time that according to the results shown in Figure 7 is enough for all the virus produced to have been released) gave a value for the burst size of the virus QβAnc of 877 ± 381 pfu/bacteria, which was not significantly different (p > 0.05, Mann Wihtney test) from that obtained for the virus QβT222N (609 ± 281 pfu/bacteria). Due to the high values of the standard deviation obtained for the three replicas of each determination, we repeated the experiment. This time, we obtained a bust size value for the virus QβAnc of 764 ± 75 and of 411 ± 27 for the virus QβT222N. Despite the standard deviation of the triplicates were lower than in the previous experiment, the differences between both viruses were still non-significant (p > 0.05, Mann Wihtney test). Nevertheless, it is noteworthy that in the two experiments carried out, the burst size of the ancestor was greater than that of the mutant.
Mutation T222N in the A1 Protein Delays Virus Extinction at Low Host Density
Since mutation T222N in the A1 protein is beneficial at low host density, we wonder whether its presence could avoid virus extinction when it is propagated at a host concentration (3 x 10⁴ cfu/mL) that is incompatible with the preservation of infectivity for a prolonged number of transfers (Figure 2). To answer this question, we propagated the viruses QβAnc and QβT222N through serial transfers carried out with 3 x 10⁴ bacteria at each transfer (Supplementary Figure 2). In this case the first transfer was performed infecting with 107 pfu. Whereas in the two replicas carried out with the virus QβAnc the infectivity was extinguished at transfers 10 and 11, the mutant could be propagated until transfers 16 and 19, after which we also could not recover infectious virus.
Discussion
One of the strategies used by viruses to be successfully transmitted in a host population is the improvement of its entry into the susceptible cells, which frequently occurs through the optimization of the interaction with the cell receptor. As a response to the infection, the host population develops defense mechanisms that can be extremely diverse (26–28). For many viruses infecting vertebrates, it is quite common that the viral protein that interacts with the cellular receptor is the same against which the antibodies produced by the immune system are directed. This means that frequently both properties cannot be optimized at the same time, since a worse neutralization by antibodies would imply a less optimal interaction with the receptor and vice versa (29).
In this work, we have carried out an experiment with a bacteriophage to study to what extent the limitation in the number of hosts influences virus evolution, in absence of the confounding factor of the selection of defense mechanisms. Our results show that, under the experimental conditions used, there was a critical bacterial density (between 3 x 10⁴ cfu/mL and 3 x 10⁵ cfu/mL) separating sustained virus propagation from extinction. At 3 x 10⁵ cfu/mL or above, the virus improved its ability to enter the bacteria at all concentrations assayed. All virus lineages propagated at bacterial densities lower than 3 x 10⁸, which was the optimal one under the conditions used from transfer 3 in the evolution experiment, showed the presence of substitution T222N in the A1 protein. This high degree of evolutionary convergence suggests that either this is the only option that Qβ has to adapt to low host density or that the alternatives have fitness costs that make them unviable.
Mutations analyzed correspond only to those that were detectable in the consensus sequence of the evolutionary lineages. Besides T222N, all lineages presented other mutations fixed or polymorphic (see Table 1). The beneficial effects of some of them could be responsible of the greater differences in replicative ability observed between the ancestor and the evolved lineages than between the ancestor and the mutant containing only T222N. In addition, there may be other mutations present in minority genomes, which may also be exerting an effect and be relevant for the subsequent evolution of the virus. The analysis of these low-frequency mutations is out of the scope of this work. Nevertheless, for future work we plan to carry out a deep sequencing analysis of all the evolutionary lineages obtained here, with the aim of determining whether the genetic diversity contained in a virus population, as well as its structure (in particular the genotype networks within the quasispecies), are modified as a consequence of evolution at low host density.
Our assay to determine viral entry was the quantification of infectious centers. Therefore, we cannot distinguish whether the process affected by the mutation is the interaction with the cell receptor or the transference of the viral genome into the cell. It is described that Qβ infects E. coli by initially attaching to the sides of the conjugative F pilus (30) through the protein A2, which is also bound to the genomic RNA (31). Studies carried out with the related phage MS2 (32) indicate that pilus retraction brings the phage close to cell surface, causing its breakage at the point of entry. After detachment of the pilus, further retraction of the protofilament, which extends through the central channel that traverse the plasma membrane at the basis of the pilus, would introduce the virus genomic RNA, together with the maturation protein, into the channel. According to this, we would have expected that mutations favoring the entry of Qβ were located in the A2 protein, instead of A1.
Protein A1 is present in the capsid in a number of around 10 copies placed at non-defined positions (33). Its precise function is unknown, although it was early demonstrated that it is essential for virus infectivity (34). The protein consists of the full-length coat domain connected by a 35 Å flexible linker to the read-through domain, an extension of 196 amino acids at the C-terminal end (35) that is located on the exterior of the capsid (36–38). In contrast to this, protein A2 is present in a single copy that replaces a coat protein dimer at a two-fold axis of the capsid (39). The A2 protein consists of an α-region (inserted into the capsid, where it binds to the genomic RNA) and a β-region, exposed outside the virion (40). Because both A1 and A2 proteins are required for infectivity, it seems possible that they interact with each other. The interaction could be facilitated by the long linker of A1 that would allow the read-through domain to reach the β-region of A2, influencing its interaction with the F pilus. If this idea were true, specific mutations in A1 could affect this interaction, modifying the ability of the virus to enter the bacteria. An alternative is that A1 provides initial binding to non-specific sites of the F-pilus. Substitution of Threonine 222 by an asparagine implies the incorporation of an amino acid with a lateral chain with one additional carbon atom and an amide group, instead of a hidroxyl group, which could modify the affinity of the hypothetical interaction between A1 and A2 or between A1 and the F pilus.
In addition to favoring virus entry, A2 protein has other functions. It is used by Qβ to bind and inhibit Mur A, an enzyme involved in bacterial cell wall biosynthesis (41), which leads to cell lysis and the release of the virus progeny (42–44). It is also described that interaction of A2 with hairpin structures in the genomic RNA could work as a nucleation center for virion assembly (45). This multi-functionality of the A2 protein probably causes it to have great restrictions to accept changes, since improving one of its functions could imply deteriorating of others. If adaptation to decreased host availability could be achieved through changes in a different protein (A1 in this case), in which mutations had less fitness costs, it is reasonable to think that this would be the pathway chosen by natural selection. The fact that, despite mutation T222N increases virus entry at the highest host density assayed, it is selected against under this condition, indicates that it also has a fitness cost, although it is expected that it will be of lower intensity than that of the possible changes in A2 that could have favored adaptation to low host density.
According to our estimations, the fitness cost of mutation T222N in the A1 protein is not caused by a change in the latent period. It is described that the optimal duration of the latent period changes in response to environmental conditions, the host density being the most relevant. At low densities, bacteria are more effectively exploited by producing more phage progeny per infected bacterium, which happens at the expense of longer latent periods. On the contrary, high bacterial densities should select for short latent periods that permit them to initiate many new infections. According to this, Abedon et al. found that a mutant of the phage RB69 displaying shorter latent period than the wild type was dominant in competitions carried out at high bacterial density, whereas it was outcompeted by the wild type at low bacterial density (46). Other studies also found that bacteriophages T7 and PhiX174 evolved at low host density increased the latent period and the burst size (47, 48). In contrast to these results, evolution of Qβ at low host density selected for phages with no apparent changes in the duration of the latent period and a non-significant, although repetitive, decrease in the burst size. Our findings show that the influence of host density on phage evolution is also mediated through its effect on the time necessary to initiate an infection (the search time). An environment with low host density is equivalent to a phage with a low adsorption rate. Thus, optimization of virus entry can be an adaptive solution under this condition. In good agreement with this idea, a previous study showed that adsorption rate had a much larger impact on phage fitness than lysis time (49).
The main conclusion of our study is that the reduction in the number of available hosts during the propagation of an RNA bacteriophage leads to the selection of a mutation that increases the virus entry into the cell. This happens in the absence of confounding circumstances, such as the emergence of defense mechanisms, which might arise in the host population as a response to infection. Although it is difficult to extrapolate our results to more complex situations, as it could be the spread of epidemics in the human population, they provide support for the idea that containment measures based on the reduction of contacts between people (the equivalent to reducing the number of hosts in our system) constitute a selective pressure that may lead to adaptive changes in viruses.
Data Availability Statement
The original contributions presented in the study are included in the article/Supplementary Material. Further inquiries can be directed to the corresponding author.
Author Contributions
EL designed the study and wrote the paper. ML-C performed the experiments. All authors interpreted the results and reviewed the manuscript. All authors contributed to the article and approved the submitted version.
Funding
This work was funded by the Spanish Ministry of Science and Innovation/ Spanish State Research Agency (MICINN/AEI/10.13039/501100011033) through project numbers PID2020-113284GB-C22 and MDM-2017-0737.
Conflict of Interest
The authors declare that the research was conducted in the absence of any commercial or financial relationships that could be construed as a potential conflict of interest.
Publisher’s Note
All claims expressed in this article are solely those of the authors and do not necessarily represent those of their affiliated organizations, or those of the publisher, the editors and the reviewers. Any product that may be evaluated in this article, or claim that may be made by its manufacturer, is not guaranteed or endorsed by the publisher.
Acknowledgments
María Arribas is acknowledged for technical assistance.
Supplementary Material
The Supplementary Material for this article can be found online at: https://www.frontiersin.org/articles/10.3389/fviro.2022.858227/full#supplementary-material
References
1. Anderson RM, May RM. Infectious Diseases of Humans: Dynamics and Control. Oxford University Press (1992).
2. Hudson P, Rizzoli A, Grenfell B, Heesterbeek H, Dobson A. Ecology of Wildlife Diseases. Oxford University Press (2002).
3. Smith C, Skelly C, Kung N, Roberts B, Field H. Flying-Fox Species Density-a Spatial Risk Factor for Hendra Virus Infection in Horses in Eastern Australia. PloS One (2014) 9(6):e99965. doi: 10.1371/journal.pone.0099965
4. Lavigne DM, Schmitz OJ. Global Warming and Increasing Population Densities: A Prescription for Seal Plagues. Mar. Pollut Bull (1990) 21:280–4. doi: 10.1016/0025-326X(90)90590-5
5. Caristia S, Ferranti M, Skrami E, Raffetti E, Pierannunzio D, Palladino R, et al. Effect of National and Local Lockdowns on the Control of COVID-19 Pandemic: A Rapid Review. Epidemiol Prev (2020) 44(5-6 Suppl 2):60–8. doi: 10.19191/EP20.5-6.S2.104
6. Drake JW, Holland JJ. Mutation Rates Among RNA Viruses. Proc Natl Acad Sci USA (1999) 96:13910–3. doi: 10.1073/pnas.96.24.13910
7. Sanjuán R, Nebot MR, Chirico N, Mansky LM, Belshaw R. Viral Mutation Rates. J Virol (2010) 84:9733–48. doi: 10.1128/JVI.00694-10
8. Domingo E, Perales C. Viral Quasispecies. PloS Genet (2019) 15(10):e1008271. doi: 10.1371/journal.pgen.1008271
9. Andino R, Domingo E. Viral Quasispecies. Virology (2015) 479-480:46–51. doi: 10.1016/j.virol.2015.03.022
10. Chakraborty C, Sharma AR, Bhattacharya M, Agoramoorthy G, Lee S-S. Evolution, Mode of Transmission, and Mutational Landscape of Newly Emerging SARS-CoV-2 Variants. MBio (2021) 12(4):e0114021. doi: 10.1128/mBio.01140-21
11. Kandeel M, Mohamed MEM, Abd El-Lateef HM, Venugopala KN, El-Beltagi HS. Omicron Variant Genome Evolution and Phylogenetics. J Med Virol (2021) 94:1627–32. doi: 10.1002/jmv.27515
12. Khan A, Khan T, Ali S, Aftab S, Wang Y, Qiankun W, et al. SARS-CoV-2 New Variants: Characteristic Features and Impact on the Efficacy of Different Vaccines. BioMed Pharmacoth (2021) 143:112176. doi: 10.1016/j.biopha.2021.112176
13. Goldhill DH, Turner PE. The Evolution of Life History Trade-Offs in Viruses. Curr Opin Virol (2014) 8:79–84. doi: 10.1016/j.coviro.2014.07.005
14. Bera S, Fraile A, García-Arenal F. Analysis of Fitness Trade-Offs in the Host Range Expansion of an RNA Virus, Tobacco Mild Green Mosaic Virus. J Virol (2018) 92(24):e01268-18. doi: 10.1128/JVI.01268-18
15. Elena SF, Lenski RE. Evolution Experiments With Microorganisms: The Dynamics and Genetic Bases of Adaptation. Nat Rev Genet (2003) 4:457–69. doi: 10.1038/nrg1088
16. Olsthoorn RCL, Van Duin J. Leviviridae-Positive Sense RNA Viruses-Positive Sense RNA Viruses. London, UK: International Committee on Taxonomy of Viruses (ICTV). Available at: https://talk.ictvonline.org/ictv-reports/ictv_9th_report/positive-sense-rna-viruses-2011/w/posrna_viruses/263/leviviridae (Accessed January 19, 2022).
17. Bradwell K, Combe M, Domingo-Calap P, Sanjuán R. Correlation Between Mutation Rate and Genome Size in Riboviruses: Mutation Rate of Bacteriophage Qβ. Genetics (2013) 195:243–51. doi: 10.1534/genetics.113.154963
18. Taniguchi T, Palmieri M, Weissmann C. QB DNA-Containing Hybrid Plasmids Giving Rise to QB Phage Formation in the Bacterial Host. Nature (1978) 274:223–8. doi: 10.1038/274223a0
19. Barrera I, Schuppli D, Sogo JM, Weber H. Different Mechanisms of Recognition of Bacteriophage Q Beta Plus and Minus Strand RNAs by Q Beta Replicase. J Mol Biol (1993) 232:512–21. doi: 10.1006/jmbi.1993.1407
20. Arribas M, Aguirre J, Manrubia S, Lázaro E. Differences in Adaptive Dynamics Determine the Success of Virus Variants That Propagate Together. Virus Evol (2018) 4(1):vex043. doi: 10.1093/ve/vex043
21. Paranchych W. Stages in Phage R17 Infection: The Role of Divalent Cations. Virology (1966) 28:90–9. doi: 10.1016/0042-6822(66)90309-6
22. Arribas M, Kubota K, Cabanillas L, Lázaro E. Adaptation to Fluctuating Temperatures in an RNA Virus Is Driven by the Most Stringent Selective Pressure. PloS One (2014) 9(6):e100940. doi: 10.1371/journal.pone.0100940
23. Arribas M, Lázaro E. Intra-Population Competition During Adaptation to Increased Temperature in an RNA Bacteriophage. Int J Mol Sci (2021) 22(13):6815. doi: 10.3390/ijms22136815
24. Somovilla P, Manrubia S, Lázaro E. Evolutionary Dynamics in the RNA Bacteriophage Qβ Depends on the Pattern of Change in Selective Pressures. Pathogens (2019) 8(2):80. doi: 10.3390/pathogens8020080
25. Inomata T, Kimura H, Hayasaka H, Shiozaki A, Fujita Y, Kashiwagi A. Quantitative Comparison of the RNA Bacteriophage Qβ Infection Cycle in Rich and Minimal Media. Arch Virol (2012) 157:2163–9. doi: 10.1007/s00705-012-1419-3
26. Koonin EV, Makarova KS, Wolf YI. Evolutionary Genomics of Defense Systems in Archaea and Bacteria. Annu Rev Microbiol (2017) 71:233–61. doi: 10.1146/annurev-micro-090816-093830
27. Obbard DJ, Gordon KHJ, Buck AH, Jiggins FM. The Evolution of RNAi as a Defence Against Viruses and Transposable Elements. Philos Trans R Soc Lond Ser B Biol Sci (2009) 364:99–115. doi: 10.1098/rstb.2008.0168
28. Aoshi T, Koyama S, Kobiyama K, Akira S, Ishii KJ. Innate and Adaptive Immune Responses to Viral Infection and Vaccination. Curr Opin Virol (2011) 1:226–32. doi: 10.1016/j.coviro.2011.07.002
29. Beaty SM, Lee B. Constraints on the Genetic and Antigenic Variability of Measles Virus. Viruses (2016) 8(4):109. doi: 10.3390/v8040109
30. Brinton CC, Beer H. The Interaction of Male-Specific Bacteriophages With F Pili. New York: Academic Press Inc. (1967). 251–89 p.
31. Kozak M, Nathans D. Translation of the Genome of a Ribonucleic Acid Bacteriophage. Bacteriol Rev (1972) 36:109–34. doi: 10.1128/br.36.1.109-134.1972
32. Harb L, Chamakura K, Khara P, Christie PJ, Young R, Zeng L. ssRNA Phage Penetration Triggers Detachment of the F-Pilus. Proc Natl Acad Sci USA (2020) 117:25751–8. doi: 10.1073/pnas.2011901117
33. Weber K, Konigsberg W. Proteins of the RNA Phages. In: Zinder N, editor. RNA Phages. Cold Spring Harbor: Cold Spring Harbor Laboratory (1975). p. 51–84.
34. Hofstetter H, Monstein HJ, Weissmann C. The Readthrough Protein A1 Is Essential for the Formation of Viable Q Beta Particles. Biochim Biophys Acta (1974) 374:238–51. doi: 10.1016/0005-2787(74)90366-9
35. Rumnieks J, Tars K. Crystal Structure of the Read-Through Domain From Bacteriophage Qβ A1 Protein. Protein Sci (2011) 20(10):1707–12. doi: 10.1002/pro.704
36. Strauss EG, Kaesberg P. Acrylamide Gel Electrophoresis of Bacteriophage Q Beta: Electrophoresis of the Intact Virions and of the Viral Proteins. Virology (1970) 42(2):437–52. doi: 10.1016/0042-6822(70)90287-4
37. Radloff RJ, Kaesberg P. Electrophoretic and Other Properties of Bacteriophage Q : The Effect of a Variable Number of Read-Through Proteins. J Virol (1973) 11:116–28. doi: 10.1128/JVI.11.1.116-128.1973
38. Vasiljeva I, Kozlovska T, Cielens I, Strelnikova A, Kazaks A, Ose V, et al. Mosaic Qbeta Coats as a New Presentation Model. FEBS Lett (1998) 431:7–11. doi: 10.1016/s0014-5793(98)00716-9
39. Cui Z, Gorzelnik KV, Chang J-Y, Langlais C, Jakana J, Young R, et al. Structures of Qβ Virions, Virus-Like Particles, and the Qβ-MurA Complex Reveal Internal Coat Proteins and the Mechanism of Host Lysis. Proc Natl Acad Sci USA (2017) 114:11697–702. doi: 10.1073/pnas.1707102114
40. Rumnieks J, Tars K. Crystal Structure of the Maturation Protein From Bacteriophage Qβ. J Mol Biol (2017) 429:688–96. doi: 10.1016/j.jmb.2017.01.012
41. Brown ED, Vivas EI, Walsh CT, Kolter R. MurA (MurZ), the Enzyme That Catalyzes the First Committed Step in Peptidoglycan Biosynthesis, Is Essential in Escherichia Coli. J Bacteriol (1995) 177:4194–7. doi: 10.1128/jb.177.14.4194-4197.1995
42. Karnik S, Billeter M. The Lysis Function of RNA Bacteriophage Qbeta Is Mediated by the Maturation (A2) Protein. EMBO J (1983) 2(9):1521–6. doi: 10.1002/j.1460-2075.1983.tb01617.x
43. Bernhardt TG, Wang IN, Struck DK, Young R. A Protein Antibiotic in the Phage Qbeta Virion: Diversity in Lysis Targets. Science (2001) 292:2326–9. doi: 10.1126/science.1058289
44. Reed CA, Langlais C, Wang I-N, Young R. A(2) Expression and Assembly Regulates Lysis in Qβ Infections. Microbiology (2013) 159:507–14. doi: 10.1099/mic.0.064790-0
45. Rūmnieks J, Tārs K. Protein-RNA Interactions in the Single-Stranded RNA Bacteriophages. Subcell Biochem (2018) 88:281–303. doi: 10.1007/978-981-10-8456-0_13
46. Abedon ST, Hyman P, Thomas C. Experimental Examination of Bacteriophage Latent-Period Evolution as a Response to Bacterial Availability. Appl Environ Microbiol (2003) 69:7499–506. doi: 10.1128/AEM.69.12.7499-7506.2003
47. Heineman RH, Bull JJ. Testing Optimality With Experimental Evolution: Lysis Time in a Bacteriophage. Evolution (2007) 61:1695–709. doi: 10.1111/j.1558-5646.2007.00132.x
48. Chantranupong L, Heineman RH. A Common, Non-Optimal Phenotypic Endpoint in Experimental Adaptations of Bacteriophage Lysis Time. BMC Evol Biol (2012) 12:37. doi: 10.1186/1471-2148-12-37
Keywords: bacteriophage Qβ, experimental evolution, host density, RNA viruses, epidemics, adaptation, A1 protein
Citation: Laguna-Castro M and Lázaro E (2022) Propagation of an RNA Bacteriophage at Low Host Density Leads to a More Efficient Virus Entry. Front.Virol. 2:858227. doi: 10.3389/fviro.2022.858227
Received: 19 January 2022; Accepted: 11 April 2022;
Published: 09 May 2022.
Edited by:
Jaime Iranzo, National Institute of Agricultural and Food Research and Technology, SpainReviewed by:
Ramon Lorenzo-Redondo, Northwestern University, United StatesLauro Velazquez-Salinas, United States Department of Agriculture, United States
Copyright © 2022 Laguna-Castro and Lázaro. This is an open-access article distributed under the terms of the Creative Commons Attribution License (CC BY). The use, distribution or reproduction in other forums is permitted, provided the original author(s) and the copyright owner(s) are credited and that the original publication in this journal is cited, in accordance with accepted academic practice. No use, distribution or reproduction is permitted which does not comply with these terms.
*Correspondence: Ester Lázaro, lazarole@cab.inta-csic.es