Department of Neurology, Laboratory of NeuroImaging, School of Medicine, University of California Los Angeles, Los Angeles, CA, USA
Digital brain atlases are useful as references, analytical tools, and as a data integration framework. As a result, they and their supporting tools are being recognized as potentially useful resources in the movement toward data sharing. Several projects are connecting infrastructure to these tools which facilitate sharing, managing, and retrieving data of different types, scale, and even location. With these in place, we have the ability to combine, analyze, and interpret these data in a manner not previously possible, opening the door to examine issues in new and exciting ways, and potentially leading to speedier discovery of answers as well as new questions about the brain. Here we discuss recent efforts in the use of digital mouse atlases for data sharing.
Many neuroscientists have been calling for a system for the mouse brain where digital atlases serve as the framework used to traverse the brain and information linked to it (Baldock et al., 2003
; Bjaalie, 2002
; Boline et al., 2007
; MacKenzie-Graham et al., 2003
; Martone et al., 2004
; Toga, 2002
). In contrast to data repositories, which allow simple access to data through a single interface, sophisticated digital atlases backed by the appropriate technology can act as a neuroinformatics hub facilitating access to different databases, information sources, and related documents and annotations. They may act as the scaffold in which otherwise unrelated data may be housed and correlated, providing an intuitive interface to share, visualize, analyze, and mine data of multiple modalities, scales, and dimensions.
The semantic and spatial information tied to an atlas can add a dimension to data in a manner that exponentially increases its potential use and reusability. Semantic linking of data to the atlas requires the data provider to register it with an ontology or controlled vocabulary, while spatial registration requires alignment of an image to the atlas. This information is then used to place data into the context of the atlas, allowing it to inherit information tied to the spatial coordinates of the atlas. A perfect example of this is gene expression image data. Spatial information in this type of slice data is key to interpreting results, yet these images lose anatomical context during the data collection process. Thus atlas-based tools for organizing and analyzing this and related types of data may be used to create a system ideal for sharing data.
Several projects offer access to gene expression image data with differing levels of spatial mapping in the mouse nervous system. These projects have been comprehensively reviewed (Brumwell and Curran, 2006
; Koester and Insel, 2007
; Sunkin, 2006
; Sunkin and Hohmann, 2007
) and among others, include the Allen Brain Atlas (ABA, www.brain-map.org), BGEM (www.stjudebgem.org), GENSAT (www.gensat.org), GenePaint (www.genepaint.org), EurExpress (www.eurexpress.org), MGI (http://www.informatics.jax.org/) and EMAP/EMAGE (http://genex.hgu.mrc.ac.uk). Several of these projects are geared toward the developmental stages of the mouse. As illustrated by the images from GENSAT and MGI in Figure 1
, the ability to examine spatial and temporal expression patterns is crucial for developing correlations between genotype and phenotype as well as for interpreting and comparing findings across experiments. Also illustrated, is that the anatomical information tends to be sparse in these data sources, as is also the case with BGEM, GenePaint, and EurExpress (Sunkin and Hohmann, 2007
). ABA and EMAP/EMAGE differ from these sources in that in addition to linking the images to semantic information, they have also linked their images to spatial information by registering their images to a reference atlas (Baldock et al., 2003
; Lein et al., 2007
). While this extra step can be both difficult and time consuming, it adds the potential for a great deal of analytical power and the ability to generate spatial queries (Carson et al., 2005
; Christiansen et al., 2006
; Leergaard and Bjaalie, 2007
).
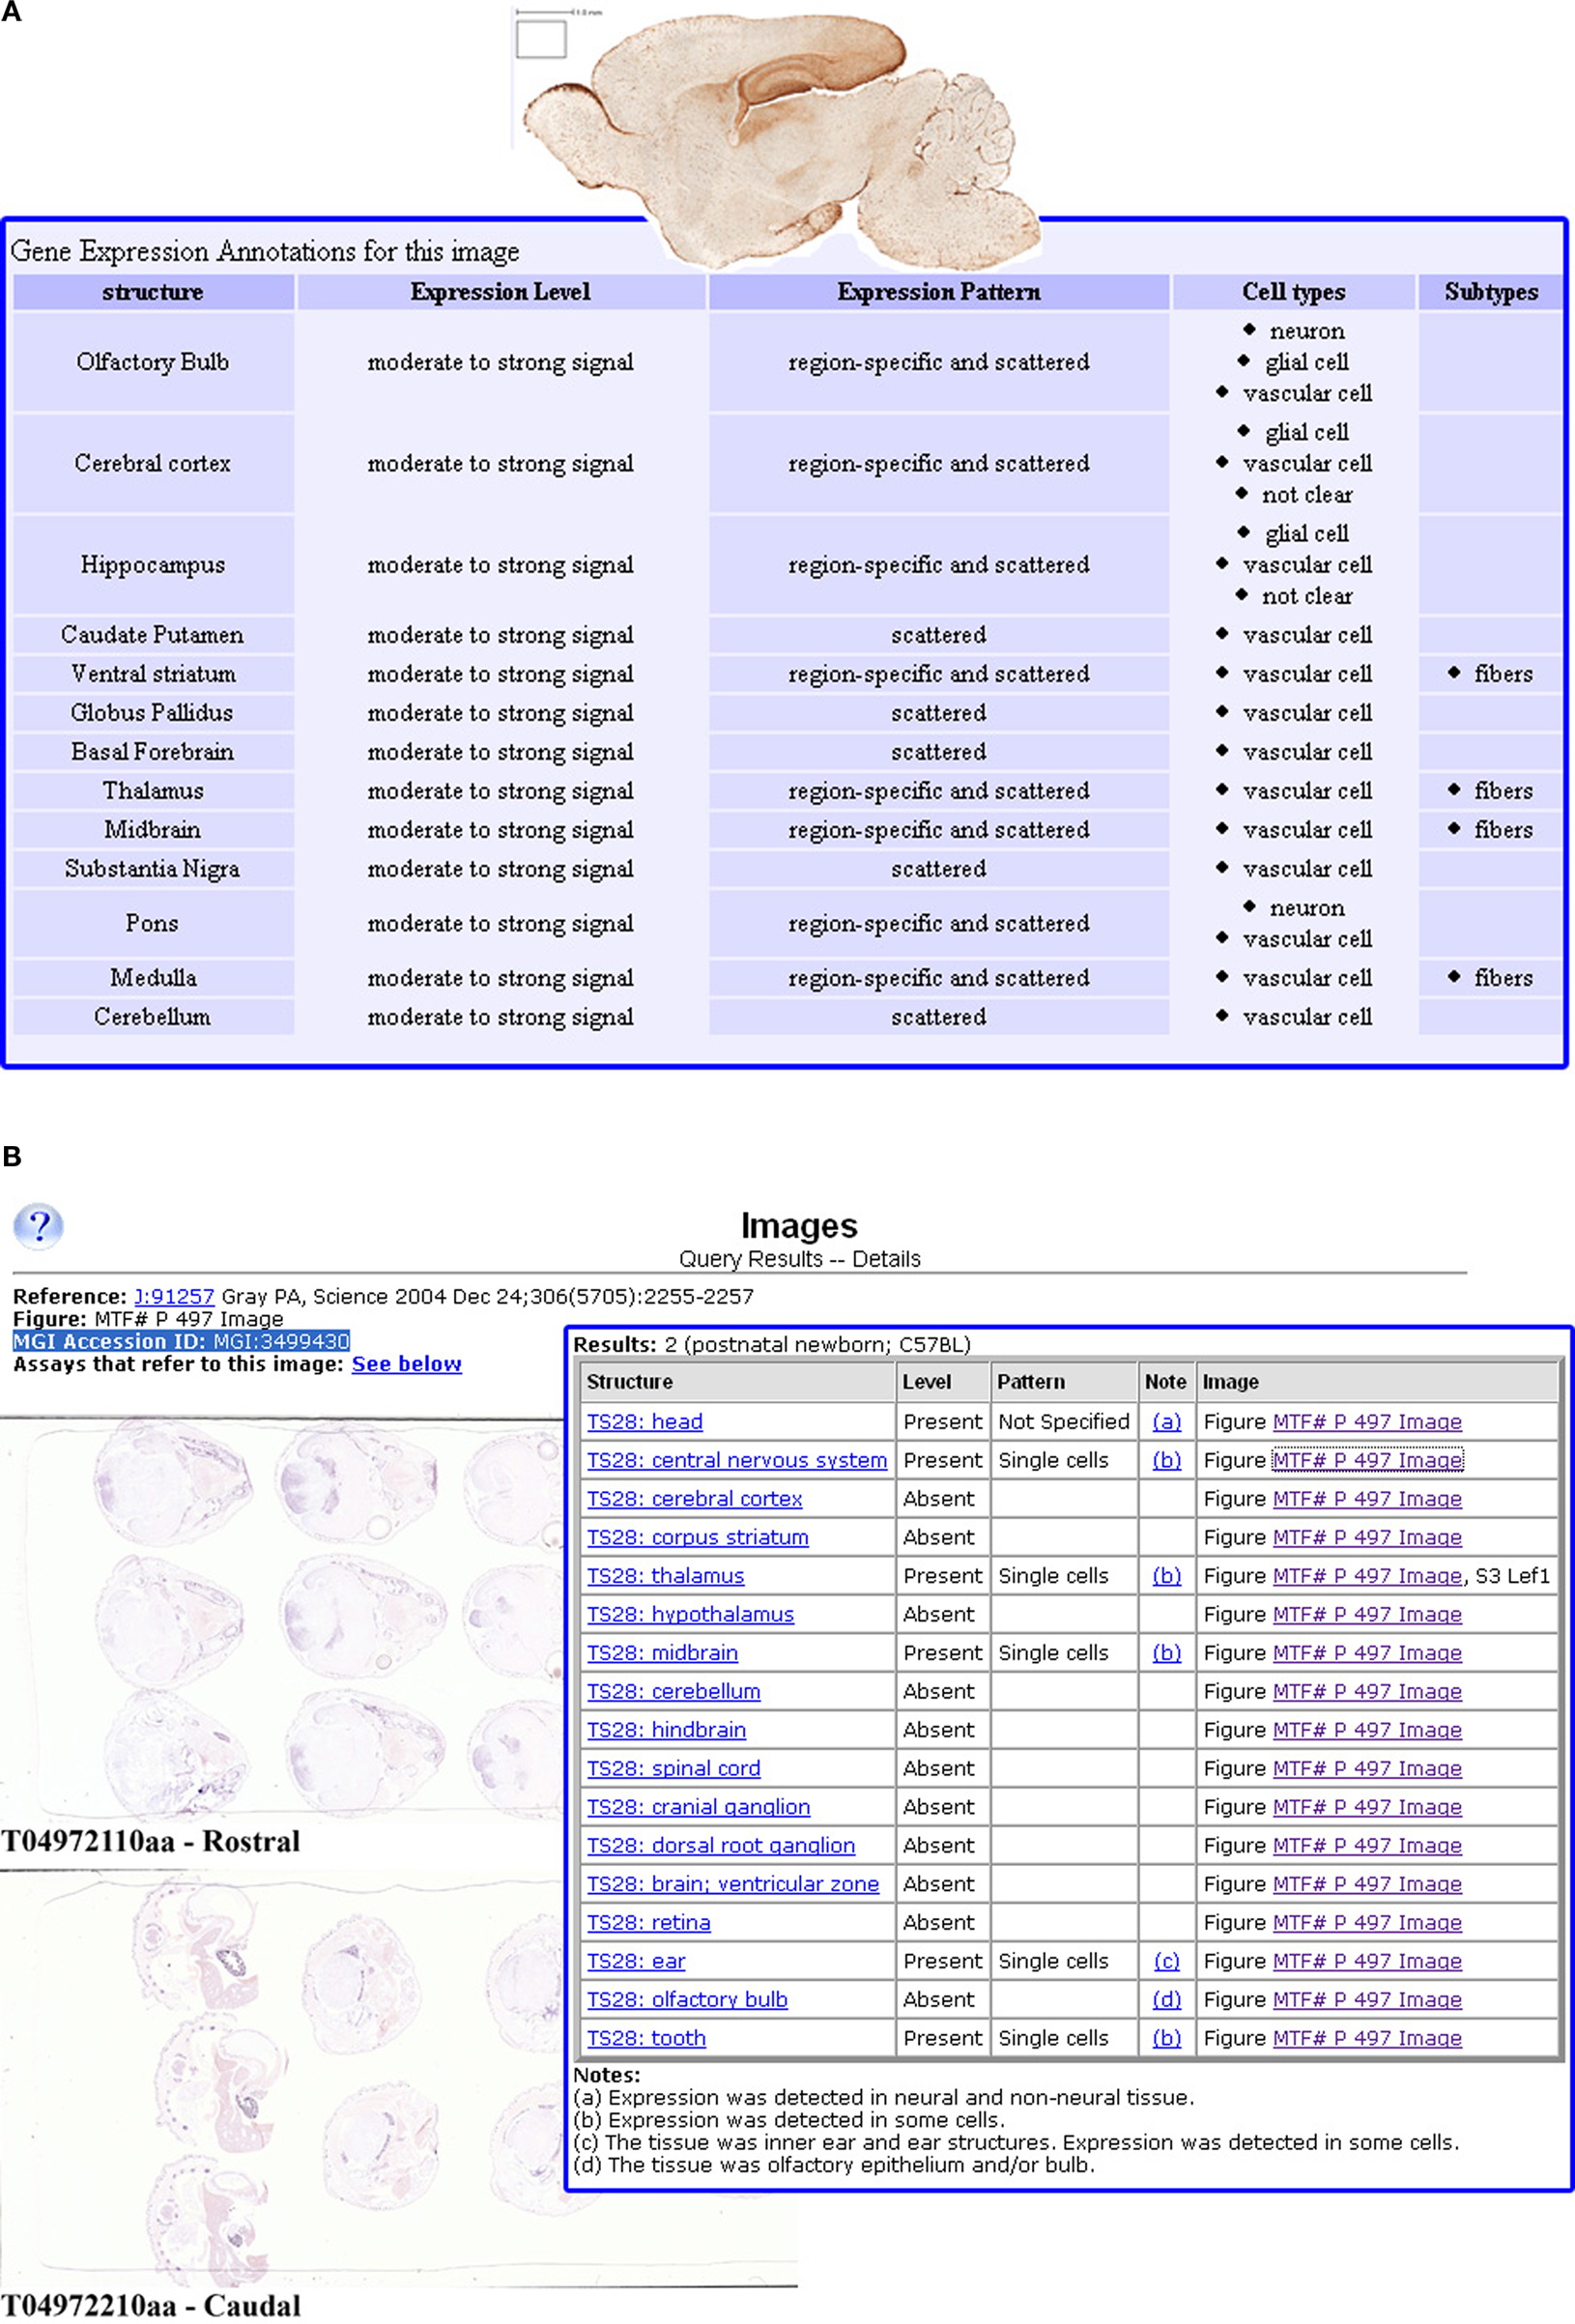
Figure 1. Examples of databases which manage gene expression image without an anatomical framework. GENSAT and MGI both provide a rich repository of image data for gene expression. Neither uses a standard framework for data organization, rather, both describe the pattern and location of gene expression revealed by the image. GENSAT (A) describes the expression pattern for major structures in each image, while the MGI (B) summarizes a batch of assays (the MGI dataset shown here were used to derive the Lef1 gene examples shown in Lee et al., 2007
). While these annotations aid interpretation, the ability to query or analyze these data in this format is very limited.
As most resources are built for sharing a specific set of data, most discussed above are not yet set up to easily link their data to that offered by other groups, adding a barrier to analyzing data across experiments. Also, with the exception of EMAGE, mechanisms are not readily available for an individual to easily put data into a semantic and spatial framework that facilitates comparison of their own data to others. For these reasons, it still requires a great deal of research and work to compare data collected in different experiments, which is one of our communities greatest desires, but also most difficult tasks. These are some of the recent drivers for the call to create interoperability across data resources and offering access to this system to any scientist, within the context of a digital atlasing framework.
Integrating these and other data sources via such a framework would allow a researcher to easily query across these resources. One could look for studies of different collection modalities, strains, developmental stages, or disease models, or examine the expression patterns of genes or regions of interest across multiple studies. For example, a scientist investigating a disease model of Parkinson’s with the microarray technique finds that an unexpected gene in the caudate/putamen area seems to have a reverse correlation with motor deficits. Wanting to know more, he uses this system to find data from other experiments that have examined the same disease model. He finds a MRI dataset illustrating a change in the shape and decrease in the volume of that area in later stages of the disease, and a high-resolution confocal dataset from this same region shows abnormal cell morphology with disease progression. In addition, he finds that expression of this gene in this region in normal animals decreases with age and that it is expressed at a higher level throughout life in a different mouse strain which shows resistance to Parkinson’s. Compiling and analyzing data from these different experiments, many of which he did not even realize were applicable to his situation, allows him to more fully examine the potential role of this gene and to better inform his next experiments.
While individual researchers often do a similar type of information gathering on their own, it can be difficult to examine other datasets, or we miss a relevant dataset because the data producers published it in relation to a very different topic. As diverse data generation continues to grow at an accelerated rate, we are in dire need of systems that make it easy for our community to contribute, organize, and find relevant data. While we are a long way from a fully implemented system that could perform the previous example, different groups have already created many of its components.
For atlases to be used to query and access spatially indexed data, they must be backed by databases, spatial and semantic registration methods, and a client that allows query and access to the data. Building a digital atlas mapping framework to facilitate experimentation and hypothesis generation was a focus of the Human Brain Project. As a result, atlas resources besides those discussed above, developed with the purpose of placing mouse gene image data within a context of an atlas and offering it to the public. These include a joint project between the Mouse Brain Library (MBL, www.mbl.org/) and NeuroTerrain (www.neuroterrain.org), the Mouse Atlas Project (www.loni.ucla.edu/MAP/), and the Smart Atlas (https://portal.nbirn.net).
Each of these projects has strengths in complementary areas. The MBL consists of high-resolution histological images and associated databases of brains from many genetically characterized strains of mice (Rosen et al., 2003
). NeuroTerrain offers a high-resolution 3D Nissl atlas in Macrovoxel format that may be accessed over the network and viewed in an arbitrary plane (Gustafson et al., 2004
) and has much of the MBL data registered to it. The Mouse Atlas Project developed tools to bring together brain architecture, gene expression, and 2D and 3D imaging information into a single interface (MacKenzie-Graham et al., 2003
) and offers several 3D MR atlases that may be used interchangeably in these tools. The Smart Atlas integrates data using both semantic and spatial geographical information systems (GIS) methods (Martone et al., 2008
). It is based on coronal and sagittal plates from the Paxinos and Franklin (2001)
atlas and includes functionality that allows a user to register image slices to the atlas plates and allows spatial query of these data (Zaslavsky et al., 2004
).
To go a step farther and build a system where atlases act as a point of access to data from multiple sources of different type and scale requires more than just connection to more databases. It requires a large community effort, and it is now a focus of collaboratives including the Mouse Biomedical Informatics Research Network (BIRN, www.nbirn.net and http://www.loni.ucla.edu/BIRN/Projects/Mouse; Martone et al., 2004
) and the International Neuroinformatics Coordinating Facility (INCF, www.incf.org; Boline et al., 2007
).
The BIRN project has been focused on building infrastructure supporting data sharing through a federated model and the focus of Mouse BIRN has been on developing and applying this infrastructure to promote data sharing through an atlasing framework. As a result, the Mouse BIRN Atlasing Toolkit (MBAT, www.nbirn.net/tools/mbat_2.0 and http://cms.loni.ucla.edu/MBAT/) has been built to offer easy access to this infrastructure to the public. The MBAT project builds on the complementary strengths and functionality of the MBL, NeuroTerrain, MAP, and Smart Atlas projects and is shaped by experimental mouse models of neurodegenerative disease studied in the Mouse BIRN project.
If a system such as this is to grow in a flexible and extensible manner (Figure 2
), it requires support by a large set of integration resources, such as standard terminologies and/or ontologies, database integration resources (such as the BIRN mediator, www.nbirn.net/research/data_integration), standard schemas for data exchange (such as MAGE, www.mged.org/Workgroups/MAGE/mage.html, or XCEDE, www.xcede.org), database webservices, and standard application programming interfaces (APIs). Finally, bringing together resources that are registered to different atlases requires additional spatial and semantic integration resources that can facilitate interoperability between these atlases (such as an atlas interoperability server and API, www.loni.ucla.edu/twiki/bin/view/MouseBIRN/AtlasStateExchange). These integration resources give an entryway for groups other than BIRN to participate in creating interoperable data and tools which can allow linkage to data they offer in other projects. Ideally, multiple methods may be employed for interested collaborators to share their data through this framework, whether it is via their own database, or through upload processes.
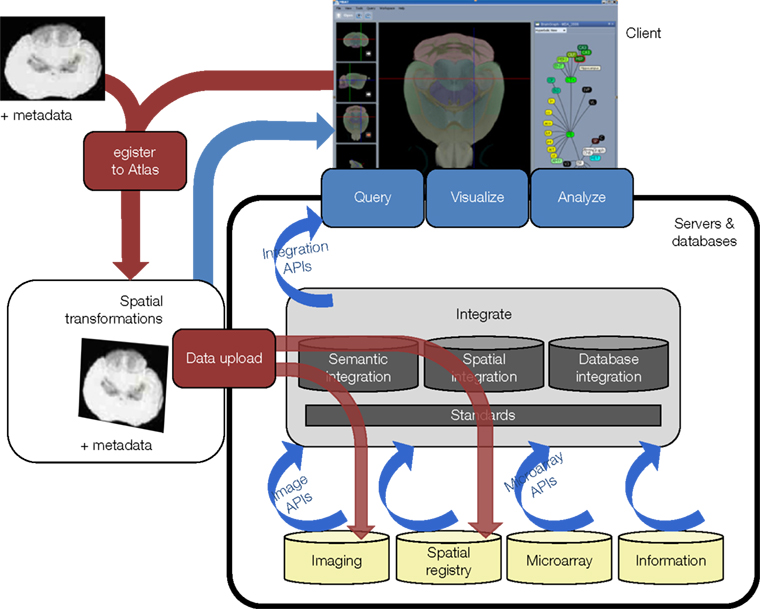
Figure 2. An extensible and flexible atlas based framework for data sharing. Data and client are located on a user’s computer. Red describes a workflow for data contribution. Gray elements are specialized servers, databases, tools, and standards built by the scientific community that facilitate integration of data. Yellow cylinders represent data sources that offer a certain data type (i.e., GeneNetwork and the BIRN Microarray Database are both Microarray databases with services that allow access to their data). Blue describes a path for data retrieval. Standardized application program interfaces (APIs-blue arrows) allow the creation of tools that access services offered by a source.
However, expanding even a flexible system with a new data type requires its own community-driven approach to modify these existing resources to set standards, web-services, APIs, and application of their own unique combination of integration methods. For instance, the preferred approach discussed for gene expression images has been spatial registration, but so far, the main approach for integrating Microarray data is primarily semantic, with the exception of voxelized data registered to an atlas (Chin et al., 2007
). Moreover, bridging the gap between different developmental stages (i.e., embryonic and adult) as well as that between species will require at least an initial reliance on semantic mapping due to the huge variations in spatial differences between species and some developmental stages.
From the user’s point of view, the framework allows a simple, but complete cycle of data sharing. A user may enter this path by registering their data within the client or via other server resources. She manages and visualizes her data in the client, where she can compare her data to an atlas and some other sets of data. However, she also has the option to share her data set by uploading it through resources that take advantage of an integration infrastructure and stores the data and its associated information in the appropriate databases. This upload process requires semantic and spatial integration methods (gray elements) to give the appropriate context to the data. Once the data are uploaded, the integration infrastructure allows other users to query and retrieve her dataset through a client that accesses the infrastructure through APIs.
The current version of MBAT (2.0 Beta) integrates data using both semantic and spatial methods. It points a user to accessible Mouse BIRN upload interfaces and even includes tools for a user to create their own atlas. It allows spatial-based queries, but its current focus is to allow semantic queries and access to data from multiple distributed sites (Figure 2
, yellow cylinders and Table 1
).
Currently MBAT does not completely fulfill the complete atlas-based framework outlined in Figure 2
. However, we continue to develop, and offer access to tools and resources that aid in moving toward this goal. We recently reported the use of a high-resolution atlas as an anatomical framework for localizing gene expression data for the mouse brain at postnatal day 0 (P0) (Lee et al., 2007
) along with new tools that help register, manage, and analyze gene expression image data (Figure 3
).
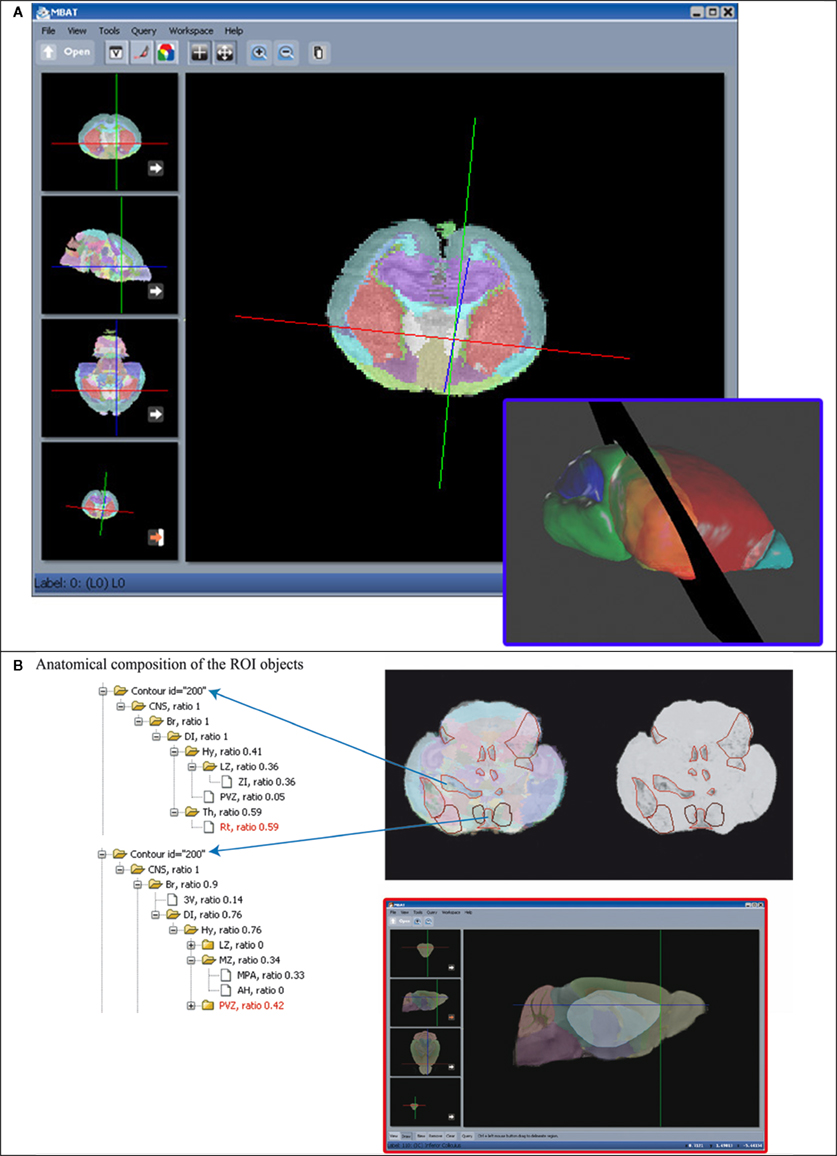
Figure 3. Local atlas-based data management facilitates data correlation via several atlas tools developed in the BIRN project. (A) MBAT allows spatial query with manually drawn polygons. Based on the intersection of the polygon and the anatomical delineation provided by the atlas, the anatomical composition within the ROI can be determined, thus enabling the retrieval of information associated with the atlas coordinates or anatomical concepts. Once the user’s data is brought into the atlas space, the contours outlining the regions of interest can be mapped to the brain anatomy. (B) The ROI management described in Lee et al. (2007)
employed a similar vector organization as the polygon method used for spatial query in MBAT (inset). Bringing the data into a common standard space not only facilitates data visualization, but also allows one to use the atlas as an interface for reusing and correlating other data derived from the same location.
This publication shows that a management document specifying the linear data-to-atlas spatial transformation is sufficient for relating local gene expression image data to a predefined atlas space. To setup the atlas-based data management and interaction with atlas-associated resources, it only requires an application that reports the atlas transformation in an offline management document.
Once registered, the gene expressions patterns may be mapped into the atlas space. Since MBAT uses a coordinate system and integration resources to associate with multiple resources (i.e., Paxinos’ canonical templates, microarray data), atlas-associated data relating to the region of interest (ROI, area with enriched gene expression) may be retrieved by a spatial query. This registration also maps the ROI to the brain anatomy, thus data correlation may also be examined using anatomical structure names.
It is important to note that the methods discussed in this publication are not focused on pushing forward registration methods. As the field of image registration is problematic with no simple solutions for all data types, the management tools need not be dependent on a single registration method. Instead, the creators of registration tools may be able to take advantage of these management methods in order to interact with this framework.
Even with these advances, there are still many pieces of the puzzle missing. Groups with components of this framework already in place may wish to contribute to, and shape the direction and specifics of the infrastructure. Others may wish to make available and link tools to this framework that facilitate registration, query, visualization, or analysis. Ideally the system is built in a model that allows tool-builders to easily add to or create new tools for the framework. Data rich resource groups may wish to develop services for the type of data they offer so their resources may also be easily accessed by this sharing infrastructure.
Individuals may also wish to help shape the direction and specifics of the developing infrastructure and tools. As they begin to use these resources to share their data with the rest of the scientific community, they may find gaps that can only be filled with their expertise. Finally, since the complexity of such a system must be hidden from those using it, feedback from both the research and programming community is essential to creating usable interfaces and points of integration.
In addition to these technical issues it is obvious that conceptual differences related to anatomies, terminologies, and ontologies will exist as long as there are neuroscientists. However, an advantage of this framework is the flexibility offered by the “Integrate” layer. This can be shaped by the community so scientists can map their own well-defined atlases, terms, and ontologies into this system and for a user to choose any of these to define their own data. In fact, a system such as this would be an ideal platform for facilitating these types of discussions and debates.
As we begin to close in on such a framework and add accessible resources, we will find that we have developed powerful mapping tools that help us find and analyze diverse information about the brain of different scale and type from different laboratories across the world. If we succeed in building such a powerful, intuitive, and flexible framework, we may help spread access to data and speed discovery as never before possible.
The authors declare that the research was conducted in the absence of any commercial or financial relationships that could be construed as a potential conflict of interest.
This work was supported by NIH Grant U24 RR021760 to the Mouse Biomedical Informatics Research Network (BIRN, http://www.nbirn.net), which is funded by the National Center for Research Resources at the National Institutes of Health (NIH).
Baldock, R. A., Bard, J. B., Burger, A., Burton, N., Christiansen, J., Feng, G., Hill, B., Houghton, D., Kaufman, M., Rao, J., Sharpe, J., Ross, A., Stevenson, P., Venkataraman, S., Waterhouse, A., Yang, Y., and Davidson, D. R. (2003). EMAP and EMAGE: a framework for understanding spatially organized data. Neuroinformatics 1, 309–325.
Lein, E. S., Hawrylycz, M. J., Ao, N., Ayres, M., Bensinger, A., Bernard, A., Boe, A. F., Boguski, M. S., Brockway, K. S., Byrnes, E. J., Chen, L., Chen, L., Chen, T. M., Chin, M. C., Chong, J., Crook, B. E., Czaplinska, A., et al. (2007). Genome-wide atlas of gene expression in the adult mouse brain. Nature 445, 168–176.
Martone, M. E., Zaslavsky, I., Gupta, A., Memon, A., Tran, J., Wong, W. W., Fong, L. L., Larson, S. D., and Ellisman, M. H. (2008). The smart atlas: spatial and semantic strategies for multiscale integration of brain data. In Anatomy Ontologies for Bioinformatics: Principles and Practice, Vol. 6, A. Burger et al. eds (London, Springer), pp. 267–286.
Zaslavsky, I., Haiyun, H. E., Tran, J., Martone, M. E., and Gupta, A. (2004). Integrating Brain Data Spatially: Spatial Data Infrastructure and Atlas Environment for Online Federation and Analysis of Brain Images. Database and Expert Systems Applications, 15th International Workshop on (DEXA’04), pp. 389–393.