Synaptic NR2A- but not NR2B-containing NMDA receptors increase with blockade of ionotropic glutamate receptors
1
Department of Clinical Neurobiology, University of Heidelberg, Heidelberg, Germany
2
Department of Molecular Neurobiology, Max-Planck-Institute for Medical Research, Heidelberg, Germany
NMDA receptors (NMDAR) are key molecules involved in physiological and pathophysiological brain processes such as plasticity and excitotoxicity. Neuronal activity regulates NMDA receptor levels in the cell membrane. However, little is known on which time scale this regulation occurs and whether the two main diheteromeric NMDA receptor subtypes in forebrain, NR1/NR2A and NR1/NR2B, are regulated in a similar fashion. As these differ considerably in their electrophysiological properties, the NR2A/NR2B ratio affects the neurons’ reaction to NMDA receptor activation. Here we provide evidence that the basal turnover rate in the cell membrane of NR2A- and NR2B-containing receptors is comparable. However, the level of the NR2A subtype in the cell membrane is highly regulated by NMDA receptor activity, resulting in a several-fold increased insertion of new receptors after blocking NMDAR for 8 h. Blocking AMPA receptors also increases the delivery of NR2A-containing receptors to the cell membrane. In contrast, the amount of NR2B-containing receptors in the cell membrane is not affected by ionotropic glutamate receptor block. Moreover, electrophysiological analysis of synaptic currents in hippocampal cultures and CA1 neurons of hippocampal slices revealed that after 8 h of NMDA receptor blockade the NMDA EPSCs increase as a result of augmented NMDA receptor-mediated currents. In conclusion, synaptic NR2A- but not NR2B-containing receptors are dynamically regulated, enabling neurons to change their NR2A/NR2B ratio within a time scale of hours.
Functional NMDA receptors (NMDAR) are heteromeric assemblies of two NR1 and two NR2 subunits (Kutsuwada et al., 1992
; Hollmann, 1999
). Of the four NR2 subunits, the NR2A and NR2B subunits are the most abundant ones in the forebrain. NR2B is highly expressed early in development, whereas NR2A expression commences postnatally (Monyer et al., 1994
). Receptors containing NR2A or NR2B subunits differ substantially in their electrophysiological properties, with the NR2A subtype characterized by faster deactivation and desensitization kinetics (Monyer et al., 1994
). Triheteromeric NMDARs comprised of NR1, NR2A and NR2B receptors also exist, but their kinetic properties have not been determined due to lack of selective antagonists (Hatton and Paoletti, 2005
). As of today, the role of NMDAR subtypes in synaptic plasticity, such as long-term potentiation (LTP) and depression (LTD), remains controversial (Liu et al., 2004
; Massey et al., 2004
; Berberich et al., 2005
). Neurons can influence their NMDAR dependent reaction to glutamate by differential NR2A and NR2B expression. Synaptic AMPA receptor (AMPAR) expression is regulated within minutes (Passafaro et al., 2001
), commensurate with the ability of synapses to undergo LTP and LTD. Synaptic NMDARs on the other hand are thought to be rather stable in the membrane, at least in the adult brain (Wenthold et al., 2003
). There is however increasing evidence that the level of membrane NMDARs is also regulated by activity. Blocking NMDAR activity in cultured neurons for several days significantly increases NMDAR levels on the cell surface (Rao and Craig, 1997
; Liao et al., 1999
; Crump et al., 2001
). Also, in neurons of the visual cortex in dark-reared animals, there is a change in the NR2A/NR2B ratio, which resets after only few hours of light exposure (Quinlan et al., 1999
). Conversely, visual experience is needed for the maturational change of NR2A/NR2B ratio in the visual cortex, and this change can be slowed by blocking synaptic activity with tetrodotoxin (Carmignoto and Vicini, 1992
; Quinlan et al., 1999
; Chen and Bear, 2007
). LTP of AMPAR EPSCs is accompanied by a potentiation of NMDAR EPSCs (Bashir et al., 1991
; Berretta et al., 1991
; Aniksztejn and Ben-Ari, 1995
; Clark and Collingridge, 1995
; Watt et al., 2004
). Synaptic NMDAR levels can be regulated by insertion of new receptors into the membrane, but also by lateral movement of extrasynaptic receptors into and out of the synapse (Tovar and Westbrook, 2002
; Zhao et al., 2008
). NR2B-type receptors are highly mobile, whereas NR2A-type receptors are fairly stable in the synapse (Groc et al., 2006
). The regulation of lateral movement is also different for NR2A and NR2B subunits. The extracellular matrix protein Reelin for example decreases synaptic NR2B levels but has no influence on synaptic NR2A levels (Groc et al., 2007
).
To study the regulation of NMDAR membrane insertion and its dependence on activity, we used a surface cleavage assay. A similar approach has been used to investigate membrane insertion of adrenergic (Daunt et al., 1997
) or AMPAR (Passafaro et al., 2001
), which requires the presence of an extracellular receptor tag that can be cleaved off by thrombin. Our results show that NMDARs have a turnover time constant in the range of 10 h, and that NMDAR and AMPAR activation differentially regulate the number of NR2A-and NR2B-containing receptors in the membrane. Moreover, our analysis of excitatory synaptic currents in CA1 neurons of acute hippocampal slices demonstrates that more NR2A- but not NR2B-containing receptors are functionally integrated into the synapse after NMDAR blockade.
Construction of Tagged NMDAR
The coding sequence for enhanced green fluorescent protein (EGFP) and for the thrombin cleavage site (LVPRGS) were inserted by standard cloning techniques 3′ to the initial 66 bp of the NR2A coding sequence and to the initial 78 bp of the NR2B coding sequence (thus 3′ of the predicted signal peptide sequences). To test for unspecific effects of thrombin, an EGFP-NR2B fusion construct lacking the thrombin cleavage site was generated. The tagged NMDARs were expressed using the cytomegalovirus promoter containing pRK as an expression vector.
Preparation and Transfection of Cell Cultures
Primary hippocampal cell cultures were prepared as described (Brewer et al., 1993
). Dissociated hippocampal cells from E17 C57Bl/6 mice were plated on poly-D-lysine (Sigma, St Louis, MO, USA) coated coverslips in 24-well culture dishes at a density of 3 × 10⁵ cells per well. Cultures were incubated at 37°C in a humidified atmosphere of 5% CO2. Cells were fed by changing 1/2 medium to fresh Neurobasal medium every 4 days (Neurobasal medium, supplemented with 0.5 mM L-glutamine, 1% B27 Supplement and Penicillin/Streptomycin, all from Gibco, Karlsruhe, Germany). After 5–7 days in vitro (DIV), growth of non-neuronal cells was halted by a 24-h exposure to 5-fluor-2-deoxyuridine (5 μM uridine and 5 μM (+)-5-fluor-2′-deoxyuridine, Sigma). Neurons were transfected at 7 DIV using the Lipofectamin Transfection Kit.
HEK 293 cells were grown on glass coverslips coated with fibronectin (5 μg/cm2, Roche, Penzberg, Germany) in MEM (Gibco) supplemented with fetal calf serum, glutamine (Gibco) and Penicillin/Streptomycine (Gibco). 24 h after plating, cells were transfected using the calcium phosphate precipitation method. 10 μM D-2-amino-5-phosphonovaleric acid (D-APV, Tocris Bioscience, Bristol, UK) was added to prevent NMDA toxicity. Experiments were performed 48 h after transfection.
Electrophysiology
Recordings from HEK293 cells were performed 24–48 h after transfection with (1) pRK-NR2A/pRK-NR1, (2) pRK-EGFP-NR2A/pRK-NR1, (3) pRK-NR2B/pRK-NR1, (4) pRK-EGFP-NR2B/pRK-NR1. pCS2dt-Tomato was always co-transfected for identification of transfected cells. Patch pipettes had a resistance of 3–5 MΩ when filled with the following solution (in mM): 120 Cs-gluconate, 10 CsCl, 8 NaCl, 10 HEPES, 10 phosphocreatine-Na, 0.3 Na3GTP, 2 MgATP, 0.2 EGTA (pH 7.3, adjusted with NaOH). Fast application of 100 μM NMDA (Sigma)/10 μM glycine onto lifted HEK293 cells was performed as described (Jonas and Sakmann, 1992
) using theta glass tubing mounted on a piezo translator (P-239.90, PI, Germany). Application pipettes were tested by perfusing solutions with different salt concentrations through the two barrels onto open patch pipettes and recording current changes with 500 ms moves of the application pipette. Only application pipettes were used with current change 20–80% rise times below 100 μs and with a reasonable symmetrical on- and offset. The application solution contained (in mM): 135 NaCl, 5.4 KCl, 1.8 CaCl2, 5 HEPES and 0.01 glycine (Sigma), adjusted to pH 7.25 with NaOH. NMDAR-mediated currents were evoked with 100 μM NMDA (Sigma).
Primary hippocampal cell cultures were recorded at DIV 17–20. Cells were continuously superfused with artificial cerebrospinal fluid (ACSF) (22–24°C) containing (in mM): 125 NaCl, 2.5 KCl, 2 CaCl2, 1 MgCl2, 1.25 NaH2PO4, 25 NaHCO3, 25 glucose and 0.01 glycine, pH 7.2 (maintained by continuous bubbling with carbogen). Whole-cell recordings were performed at room temperature (22–25°C) using pipettes with resistance of 3–5 MΩ when filled with the following solution for the presynaptic cell (in mM): 105 K-gluconate, 30 KCl, 10 HEPES, 10 phosphocreatine-Na, 0.3 Na3GTP, 4 MgATP, (pH 7.3, adjusted with KOH), and the following solution for the postsynaptic cell (in mM): 120 Cs-gluconate, 10 CsCl, 8 NaCl, 10 HEPES, 10 phosphocreatine-Na, 0.3 Na3GTP, 2 MgATP, 0.2 EGTA (pH 7.3, adjusted with NaOH). Action potentials (APs) were evoked by current injection into a presynaptic cell (0.1 Hz), and EPSCs were recorded in a postsynaptic cell at a holding potential of +40 mV for NMDAR-mediated currents and −70 mV for AMPAR-mediated currents (for paired pulse ratio experiments). Averages of 30–100 sweeps were analyzed. GABA-A currents were blocked with 10 μM SR95531 hydrobromide (gabazine, Biotrend, Wangen, Switzerland), AMPA currents (during NMDA current recording) with 10 μM 6-cyano-7-nitroquinoxaline-2,3-dione (CNQX, Tocris), NMDAR currents (during AMPA current recording) with 50 μM D-APV (50 μM, Tocris). Sensitivity for ifenprodil (10 μM, NR2B selective antagonist, Sigma) and NVP-AAM07 (50 nM, NVP, NR2A preferring antagonist, Novartis Pharmaceuticals, Basel, Switzerland) of NMDAR-mediated EPSCs was tested by measuring the change of the average amplitude of 30 sweeps (0.1 Hz) before and after incubation with ifenprodil or NVP. After washout of the blockers, 30 sweeps were recorded to rule out that amplitude changes were the result of unspecific rundown. Paired-pulse ratio (PPR) experiments were performed by evoking APs in a presynaptic cell with inter-event intervals (IEI) of 25, 50, 100, 200, and 1000 ms and by recording AMPAR-mediated EPSCs in a postsynaptic cell (averages of 25 EPSCs).
Two hundred fifty micrometer transverse slices were prepared from brains of P14–P17 C57Bl/6 mice. Whole-cell recordings in current- and voltage-clamp mode were performed at room temperature (22–25°C) using pipettes with resistance of 5 MΩ when filled with the following solution (in mM): 120 Cs-gluconate, 10 CsCl, 8 NaCl, 10 Hepes, 10 phosphocreatine-Na, 0.3 Na3GTP, 2 MgATP, 0.2 EGTA (pH 7.3, adjusted with NaOH). Slices were continuously superfused with ACSF (22–24°C) containing (in mM): 125 NaCl, 2.5 KCl, 2 CaCl2, 1 MgCl2, 1.25 NaH2PO4, 25 NaHCO3, 25 glucose and 0.01 glycine, pH 7.2 (maintained by continuous bubbling with carbogen). NMDA currents were evoked by extracellular activation of Schaffer collaterals and recorded in CA1 neurons that were held at a membrane potential of +40 mV. 50–150 sweeps were averaged and NMDAR current amplitude was measured 25 ms after stimulation. GABA-A currents were blocked with 10 μM SR95531 hydrobromide (gabazine, Biotrend, Wangen, Switzerland). An individual experiment comprised recordings from two pyramidal cells serving for normalization and recordings from two to three pyramidal cells, after the slices had been incubated in ACSF for 8 h in the absence (control) or presence of D-APV (50 μM, Tocris). In control experiments, D-APV was added to the ACSF for 30 min after the 8-h incubation and then washed out prior to recording. All cells were in immediate proximity of each other. The position of the stimulation pipette and the stimulation strength remained constant during the whole experiment. The constant position of the slice and stimulation pipette was verified by infrared-differential interference contrast (DIC) images. For PPR experiments, AMPAR-mediated EPSCs were evoked by extracellular activation of Schaffer collaterals (100 ms IEI) and recorded in CA1 neurons that were held at −70 mV (+50 μM D-APV and 10 μM gabazine to block NMDARs and GABA-A receptors, respectively). Neurons were visually identified at an upright microscope (Axioskop FS2; Zeiss, Oberkochen, Germany) equipped with DIC and standard epifluorescence.
NR2A/NR2B ratio was investigated by incubating slices for 8 h in ACSF in the absence (control) or presence of D-APV (50 μM). Control slices were incubated for 30 min in D-APV containing ACSF prior to the recording. NMDA currents were evoked by Schaffer collateral stimulation in CA1 pyramidal cells that were held at −70 mV. The extracellular solution was Mg2+ free and contained (in mM): 125 NaCl, 25 NaHCO3, 1.25 NaH2PO4, 2.5 KCl, 3 CaCl2, 25 glucose, 0.01 glycine, 0.005 bicuculline methiodide (Tocris, Bristol, UK), bubbled with 95% O2/5% CO2 (pH 7.4). AMPA currents were blocked with 10 μM 6-cyano-7-nitroquinoxaline-2,3-dione (CNQX, Tocris). Ifenprodil sensitivity of synaptic NMDA currents in CA1 pyramidal cells was tested by measuring the change of the average amplitude of 50–150 sweeps before and after incubation with 10 μM ifenprodil. Stimulus delivery and data acquisition were performed using Pulse software (Heka Elektronik, Lambrecht, Germany). Signals were filtered at 5 kHz, sampled at 10 kHz and analyzed off-line with IGOR Pro (Wavemetrics, Lake Oswego, OR, USA).
Thrombin Surface Cleavage Assay and Immunocytochemistry
The assay was as described (Hein et al., 1994
) with small modifications. Bovine thrombin was applied at a concentration of 0.1 U/ml (Roche, Mannheim, Germany), and its activity was blocked after 30 min with 0.4 mg/ml lepirudine (Refludan®, Schering, Berlin, Germany). The following chemicals were used: 10 μM MK801 (NMDA antagonist, Sigma), 100 μM D-APV (NMDA antagonist, Tocris), 10 μM ifenprodil, 50 nM NVP, 10 μM NMDA plus 10 μM glycine, 10 μM CNQX, 2 μM nimodipine (voltage gated calcium channel blocker, Sigma), and 1 μM tetrodotoxin (TTX, Tocris). For membrane staining of NMDARs, rabbit anti-EGFP antibody (1:10000, Molecular Probes, Eugene Oregon) in phosphate buffer saline (PBS) with 5% normal goat serum and 4% bovine serum albumin were added onto the non-permeabilized non-fixed cells for 1 h at 4°C. Cells were cooled to 4°C for 10 min before adding the anti-EGFP antibody to prevent receptor-antibody internalization. After several washing steps, cells were fixed with 4% paraformaldehyde and 3% sucrose in PBS for 8 min, and secondary anti-rabbit antibody (Alexa Fluor 555 goat anti rabbit IgG (H + L), 1:1000, Molecular Probes) in PBS was added for 24 h at 4°C. Cell identification based on staining of surface bound receptors was not possible directly after cleavage of the extracellular tag and difficult 2–24 h thereafter. Thus, transfected cells were identified based on the positivity for intracellularly localized tagged receptors. The intrinsic intensitiy of the EGFP-tag was often too low to unequivocally identify positive cells. Hence, we performed an anti-EGFP immunocytochemistry with a green secondary antibody after permeabilization of the cells with 0.2% Triton in PBS for 5 min at room temperature. The subsequent steps were similar to those used for the staining of surface bound receptors, with the exception that a different secondary antibody was used (Alexa Fluor 488 goat anti rabbit IgG (H + L), 1:1000, Molecular Probes). HEK293 cells were stained in a similar way. For quantification of total cell staining intensity Z-stacks of four images per cell were acquired with a Leica DM IRE2 confocal microscope using a 40× lens (Leica, Wetzlar, Germany). For quantification of NMDAR clusters 3–5 dendrites of each cell were chosen for analysis (30–180 μm for each dendrite).
Metamorph software (Universal Imaging Cooperation, West Chester, Pennsylvania) was used to quantify the intensity of the EGFP staining. A maximum projection of each z-stack was generated, background subtraction was performed, and all images were similarly thresholded. The total signal-intensity of the thresholded area was quantified for each cell. For cluster analysis we measured the area, integrated intensity and number of clusters. Total intensity of clusters per 100 μm dendrite was calculated as the product of integrated cluster intensity and cluster number/100 μm dendrite. Measurements were analyzed using Microsoft Excel. To calculate the time course of the subunit reappearance, data were fitted with a mono-exponential association equation using IGOR Pro.
Statistics
Data are presented as mean ± SEM unless noted otherwise. Statistical analyses were performed using SigmaStat 3.11. Differences between groups were examined using Student’s t-test, one-way ANOVA with Boferroni t-test for multiple comparisons, Mann–Whitney rank sum test, or Kruskall–Wallis one-way analysis of variance with a Dunn’s posttest for multiple comparisons. p values <0.05 were considered statistically significant.
EGFP-Tagged Receptors are Electrophysiologically Functional and are Transported to the Cell Membrane
To quantify the turnover of NMDAR subunits, we N-terminally tagged NR2A and NR2B subunits with EGFP and a cleavage site for the extracellular protease thrombin. EGFP might change the correct folding of the receptor or interfere with the binding of agonists and thus alter the receptor function. To investigate if the tagged receptors are targeted to the cell membrane, HEK293 cells were co-transfected with NR1 and EGFP-NR2A or EGFP-NR2B, and cell surface-bound receptors were visualized by immunostaining with EGFP antibodies under non-permeabilizing conditions (Figure 1
A). As previously shown (Fukaya et al., 2003
), co-expression of the NR1 subunit was necessary for NR2 insertion into the membrane.
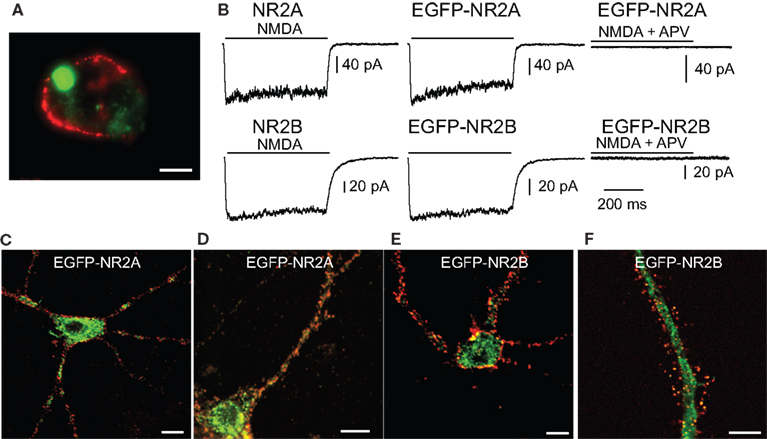
Figure 1. EGFP-tagged NMDARs are transported to the cell membrane and are functional. (A) HEK293 cells were co-transfected with NR1 and EGFP-tagged NR2A or NR2B. The surface staining of extracellular EGFP (red) under non-permeabilizing conditions shows tagged NMDA receptors transported to the cell membrane. Scale bar: 5 μm. (B) Application of 100 μM NMDA and 10 μM glycine (500 ms) induced an inward current in HEK293 cells co-transfected with NR1 and EGFP-NR2A or EGFP-NR2B. These currents could be blocked with the NMDAR antagonist APV and were similar to the currents in HEK293 cells co-transfected with NR1 and wildtype NR2A or NR2B. (C,D) Primary hippocampal cultures were transfected with vectors for EGFP-NR2A (C/D) or EGFP-NR2B (E/F). Surface staining of extracellular EGFP (red) under non-permeabilizing conditions shows that tagged NMDARs are transported to the cell membrane also in neurons. (C/E) Higher magnification shows that EGFP-NR2A and EGFP-NR2B receptors can be observed in spine-like structures (D/F). Scale bar: 8 μm.
We tested whether tagged receptors were functional by recording currents during fast application of NMDA (100 μM, 500 ms) application onto transfected HEK293 cells (Figure 1
B). Currents mediated by tagged and untagged receptors were similar in amplitude (NR1/NR2A wt: 152 ± 56 pA, n = 16; NR1/EGFP-NR2A: 160 ± 37 pA, n = 12; NR1/NR2B wt: 73 ± 25 pA, n = 22; NR1/EGFP-NR2B: 52 ± 14 pA, n = 11, p > 0.05), 20–80% rise time (NR1/NR2A wt: 6.1 ± 0.8 ms, n = 13; NR1/EGFP-NR2A: 5.8 ± 0.5 ms, n = 12; NR1/NR2B wt: 11.7 ± 1.7 ms, n = 12; NR1/EGFP-NR2B: 10.5 ± 1 ms, n = 10, p > 0.05), deactivation time constant after the 500 ms NMDA pulse (τw: NR1/NR2A wt: 23.2 ± 6.9 ms, n = 10; NR1/EGFP-NR2A: 22.4 ± 4.7 ms, n = 12; NR1/NR2B wt: 43.7 ± 3.4 ms, n = 13; NR1/EGFP-NR2B: 45.8 ± 4.1 ms, n = 8, p > 0.05), and steady state current at the end of the 500 ms NMDA pulse (as a percentage of peak current: NR1/NR2A wt: 67 ± 4%, n = 13; NR1/EGFP-NR2A: 67 ± 4%, n = 12; NR1/NR2B wt: 74 ± 4%, n = 15; NR1/EGFP-NR2B: 79 ± 3%, n = 9, p > 0.05). Deactivation kinetics were much faster than those of glutamate-evoked currents (Monyer et al., 1994
) or synaptic NMDAR-mediated currents (see below), as expected for the lower affinity agonist NMDA (Patneau and Mayer, 1990
). Normal properties of tagged NR2A and NR2B subunits (although without the thrombin cleavage site) have been previously reported (Luo et al., 2002
).
Importantly, the tagged receptors were targeted to the cell membrane in HEK293 cells and in transfected neurons of hippocampal primary cell cultures (Figures 1
C,E). Higher magnification revealed that the tagged receptors in neurons were localized in spine-like structures (Figures 1
D,F). We investigated by paired recordings of a presynaptic non-transfected cell and a postsynaptic EGFP-NR2A or EGFP-NR2B expressing cell if over-expression of EGFP-NR2A and EGFP-NR2B changes synaptic NMDAR-mediated currents in hippocampal primary cell cultures (Figure 2
A). There was no change in the peak amplitude of NMDAR-mediated currents (measured at +40 mV holding potential) when compared to postsynaptic control cells (peak ctr: 15 pA [7–42], n = 28, EGFP-NR2A: 19 pA [10–36], n = 17, EGFP-NR2B: 21 pA [11–53], n = 18, median ± interquartile range (IQR), >0.05, Kruskall–Wallis one-way analysis of variance, Figure 2
C). Since NR2A- and NR2B-containing NMDARs differ considerably in their deactivation kinetics (Monyer et al., 1994
), we also quantified the weighted tau (τw) of NMDAR-mediated EPSCs (Figure 2
B). NMDAR-mediated currents decayed significantly faster in cells expressing EGFP-NR2A (τw ctr: 288 ± 61 ms, n = 31, EGFP-NR2A: 129 ± 20 ms, n = 12, EGFP-NR2B: 290 ± 35 ms, n = 10, <0.05 ctr vs. EGFP-NR2A, one-way ANOVA, Figure 2
C), indicating that over-expression of tagged subunits changed the composition of synaptic NMDARs without changing their absolute number. Similar results for changes in EPSC kinetics but not amplitudes were reported for synaptic NMDAR-mediated currents in cerebellar granule cells over-expressing NR2A and NR2B subunits (Prybylowski et al., 2002
).
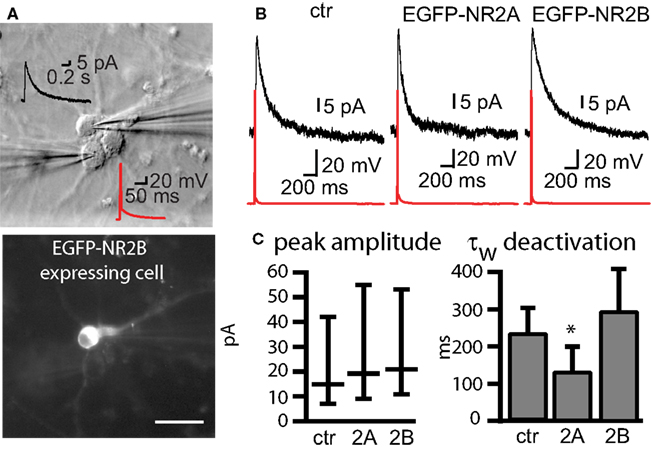
Figure 2. Changes of NMDAR-mediated currents observed in cells expressing tagged receptors. (A) Infrared DIC image of three cultured hippocampal cells of which two were connected. Current injection into the lower cell evoked an AP (red), and an NMDAR-mediated EPSC (black, +40 mV) could be recorded in the upper cell. The fluorescence image below shows that the upper cell expressed EGFP-NR2B. Scale bar = 50 μm. (B) Example traces of NMDAR-mediated currents in control (ctr) cells and cells expressing EGFP-NR2A and EGFP-NR2B (C) Expression of tagged receptors did not change the peak amplitude of NMDAR-mediated EPSCs median ± IQR) but expression of EGFP-NR2A significantly decreased the weighted tau (τw) of the EPSC deactivation (mean ± SEM). Control = ctr, EGFP-NR2A = 2A, EGFP-NR2B = 2B.
Turnover of NR2A and NR2B Subunits
NR2A-containing NMDARs are developmentally regulated in vivo (Monyer et al., 1994
) and in vitro (Li et al., 1998
). To investigate the turnover rate of NR2A- and NR2B-containing receptors in the cell membrane, experiments were performed at DIV 17–18, a time point at which both NMDAR subtypes are expressed (Li et al., 1998
). The extracellular EGFP-tag was cleaved off enzymatically by a 30-min thrombin treatment. After incubating the neurons for 2, 4, 6, 8 and 24 h following thrombin treatment, newly inserted receptors were visualized immunocytochemically under non-permeabilizing conditions (anti-EGFP antibody for 1 h at 4°C before fixing the cells with paraformaldehyde), using as a secondary antibody Alexa Fluor 555 goat anti rabbit IgG. We observed that vigorous washing of the cells to remove the thrombin caused a strong reduction of receptor insertion during the first hours post washing. Vigorous washing is stressful for neurons and can cause cell death and subsequent over-activation of NMDAR by glutamate (unpublished observations), which might explain the reduced insertion of new receptors. Thus, rather than removing thrombin by washing, we added lepirudine, a small peptide that binds thrombin at the active site and blocks protease activity (Nowak, 2002
). Combined thrombin and lepirudine treatment for 8 h per se had no effect, since the intensity of EGFP-NMDAR surface staining was not different from that of untreated cells. In contrast, near-complete absence of staining was observed after 30 min thrombin treatment (Figure 3
E), demonstrating that the thrombin cleavage site engineered into the NR2 subunits was functional and that no antibody internalization occurred during surface staining of tagged receptors. Insertion of new EGFP-tagged NR2A and NR2B receptors into the cell membrane was investigated over a time period of 24 h. After this time, the staining intensity of cell membrane-inserted receptors was 75 ± 9% and 42 ± 4% of the control staining for tagged NR2A- and NR2B-containing receptors respectively. The mono-exponential fit of the data shows that the time constants of reappearance were virtually the same for NR2A and NR2B receptors with 9.2 and 9.7 h, respectively. Interestingly, the maximum of the monoexponential fit was 81% for NR2A- and 46% for NR2B-type receptors. This might indicate that NMDARs whose EGFP-tags had been removed by thrombin and had been internalized, became subsequently reinserted into the cell membrane (Figures 3
A–D). To test for unspecific influence of thrombin on NMDAR expression in the cell membrane, we generated EGFP-NR2B fusion constructs lacking the thrombin cleavage site. Transfected cultures were treated for 30 min with thrombin, followed by application of lepirudine. The intensity of EGFP surface staining 24 h later was not significantly different in these cultures when compared to cultures simultaneously treated with thrombin and lepirudine (ctr: 100 ± 8%, n = 40, thrombin: 94 ± 6%, n = 80, p > 0.05, ±SEM) (Figure 3
F), indicating that 30 min thrombin-treatment does not affect the expression of NMDAR in the cell membrane. Thus, the differential levels of reinsertion indicate that NR2B-type NMDARs undergo less degradation after internalization than NR2A-types.
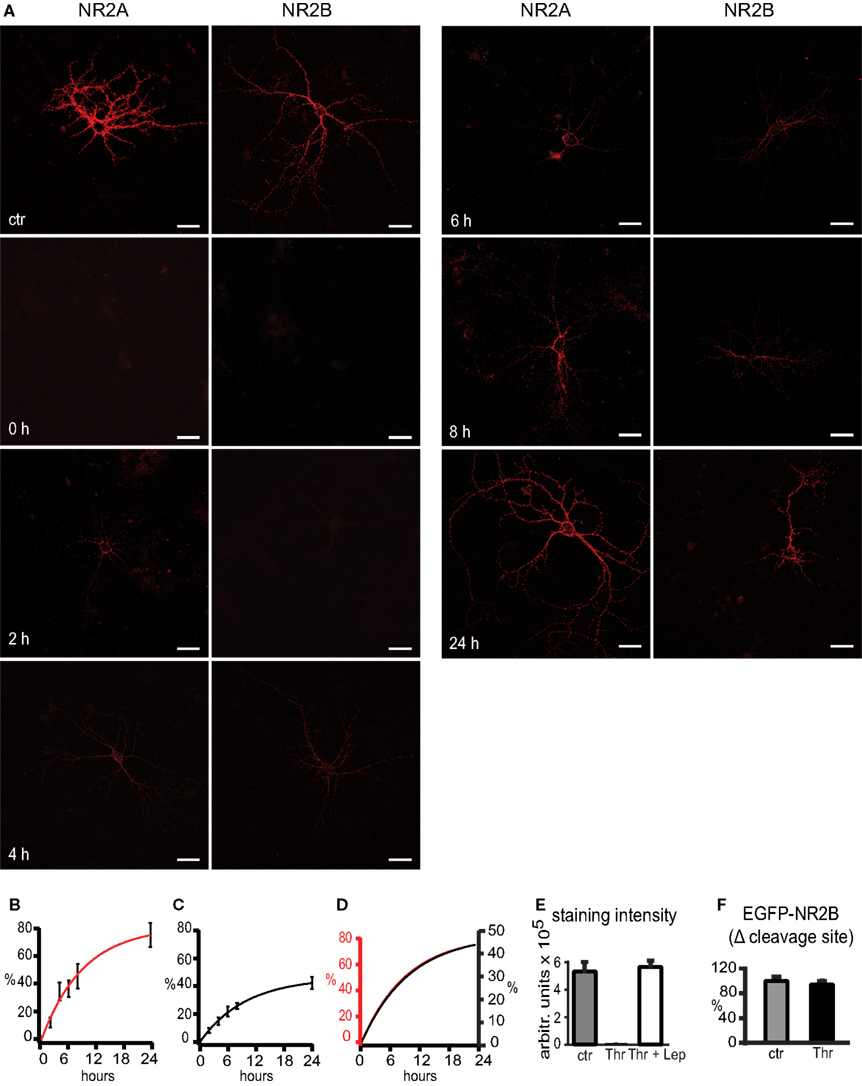
Figure 3. Turnover of NR2A and NR2B receptors in the cell membrane occurs in the range of several hours. (A) In control condition (ctr), thrombin and lepirudine were added simultaneously. Surface staining of the EGFP-tag under non-permeabilizing conditions shows strong staining of cell membrane-bound receptors, confirming the potency of lepirudine in blocking the thrombin activity. Thrombin treatment for 30 min effectively cleaved off the extracellular EGFP, as revealed by loss of EGFP immunoreactivity (0 h). With the insertion of new receptors into the cell membrane, EGFP immunoreactivity increased between 2 and 24 h (2–24 h). Scale bars: 40 μm. (B,C) After 24 h the signal was 75% and 42% of the control signal for NR2A- (B) and NR2B-type (C) receptors respectively. In (D) the mono-exponential fits for the NR2A (red, left y-axis) and NR2B (black, right y-axis) data are scaled to the extrapolated maximal intensity, showing that turnover time constants were similar for both NMDAR subtypes. (E) Thrombin (Thr) effectively cleaves the EGFP-tag (EGFP-NR2A), and this cleavage can be blocked with lepirudine (Lep) for many hours. The extracellular EGFP was visualized with an EGFP antibody and a Cy3-coupled secondary antibody under non-permeabilizing conditions. (F) To test for unspecific influence of thrombin on the surface expression of NMDARs, cells were transfected with an EGFP-NR2B control construct lacking the thrombin cleavage site and were treated with thrombin (30 min). After 24 h, the intensity of the EGFP surface stain was not different from that of cells simultaneously treated with thrombin and lepirudine (ctr) (mean ± SEM).
Influence of Glutamate Receptor Agonists and Antagonists on NMDAR Surface Expression
Treatment of neuronal cultures with NMDA antagonists for several days significantly increases synaptic NR1 receptors clusters (Rao and Craig, 1997
). We investigated if blocking of NMDARs leads to up-regulation of NR2A- and NR2B-containing receptors, and whether such up-regulation is mediated by the blockade of either NR2A- or NR2B-type receptors or both. Treatment of transfected neurons with the NMDA antagonist MK-801 or APV for 8 h increased the surface expression of NR2A-type receptors by approximately twofold (242 ± 22% and 177 ± 20% for MK801 and APV respectively, n = 46 and 25 cells, p < 0.001) (Figure 4
A). A significant increase of membrane-bound NR2A-type receptors to 150% of baseline level could be observed already after 4 h of treatment with MK801 (152 ± 17%, n = 30 cells, p < 0.001, data not shown). Blocking for 8 h NR2A- or NR2B-containing receptors with 50 nM NVP or 10 μM ifenprodil, respectively, did not change the amount of cell membrane-bound NR2A-type receptors (NVP: 109 ± 15%, 31 cells; ifenprodil: 106 ± 16%, 32 cells, p > 0.05) (Figure 4
A). Thus, the activation of either subtype is sufficient to keep NR2A-containing receptors in the cell membrane at baseline levels.
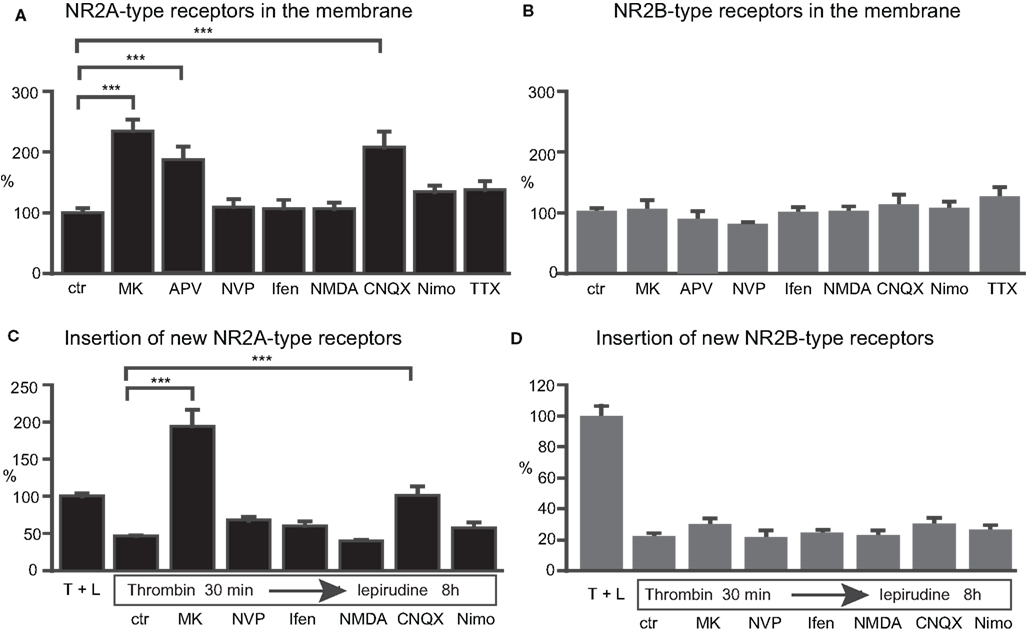
Figure 4. Activation of NMDARs and AMPARs regulates the number of NR2A- but not NR2B-type receptors in the cell membrane. Blocking NMDARs with MK-801 (MK), APV and CNQX for 8 h increased the surface staining for the tagged NR2A- (A) but not NR2B-subtype (B). (C,D) The increase in membrane-bound NR2A-type receptors can be explained by increased insertion of new receptors during the treatment with MK-801 and CNQX (C). No change in the insertion of NR2B-type receptors could be observed (D). The subtype preferring blockers NVP and ifenprodil (Ifen), NMDA, and the blocking of VGCC with nimodipine (Nimo) had no effect on the levels of NR2A-type (A) and NR2B-type receptors (B) in the cell membrane, and these agents failed to affect the insertion of new receptors into the cell membrane (C,D). The intensity of the membrane stain in these experiments was normalized to the intensity of the membrane stain of cultures simultaneously treated with thrombin and lepirudine (T + L) (mean ± SEM).
If NMDAR blockade can change the cell surface receptor expression, NMDAR activation could have the opposite effect. However, after 8-h treatment with 10 μM NMDA (+10 μM glycine), no significant change was observed in the surface expression of NR2A (105 ± 11%, n = 28 cells, p > 0.05). Hence, decreased but not increased NMDAR activitation regulates the NMDAR levels (Figure 4
A). Surprisingly, in contrast to the strong increase of NR2A-type receptors during MK-801 and APV treatment, no significant change of NR2B-type receptor surface levels could be observed (MK-801: 105 ± 15% n = 27, p > 0.05; APV: 87.3 ± 5% n = 75, p > 0.05) (Figure 4
B). Furthermore, the use of NVP, ifenprodil and NMDA failed to change the surface staining intensity of NR2B (NVP: 80 ± 4%, 156 cells; ifenprodil: 100 ± 9%, 51 cells; NMDA: 100 ± 10% 25 cells, p > 0.05) (Figure 4
B). Thus, blocking NMDAR activity differentially regulates the expression of the two NMDAR subtypes in the cell membrane.
Moreover, blocking AMPARs, but not voltage-gated Ca2+-channels (VGCC), significantly increased the expression of NR2A-type receptors (10 μM CNQX: 207 ± 27%, 40 cells; 2 μM nimodipine: 134 ± 10%, 96 cells, p < 0.05). No significant change in the amount of NR2B-containing receptors could be observed (CNQX: 112 ± 17%, 45 cells; nimodipine: 107 ± 12%, 32 cells, p > 0.05) (Figures 4
A,B). Thus, the selective regulation of NR2A-type NMDARs occurs by activity blockade of NMDARs and AMPARs.
NMDAR and AMPAR Activity Regulates the Membrane Insertion of New Receptors
Different scenarios can account for the above-described effect on NMDAR surface expression: altered receptor levels could result from increased insertion of new receptors, decreased receptor internalization, or both. Thus, following cleavage of the EGFP-tag of the membrane-bound receptors, the insertion of new receptors was investigated under the same blocking or activating conditions used before. Data were normalized to the values obtained from cultures simultaneously treated with thrombin and lepirudine. MK-801 for 8 h caused a strong increase in new NR2A-type receptor insertion (control: 46 ± 4%, 128 cells; MK-801: 194 ± 22%, 30 cells, p < 0.001) (Figure 4
C). The augmented insertion of new NR2A-containing receptors from 46% (control) to 194% (MK-801) is the most parsimonious explanation for the increase in total NR2A-type surface receptors from 100% (control) to 242% (MK-801), although we cannot rule out that NMDAR block also changes receptor internalization. No significant increase in NR2A-type receptor insertion could be seen when the NR2A- or NR2B-type receptors were blocked singly (NVP: 67 ± 7%, 89 cells; ifenprodil: 60 ± 6%, 91 cells, p > 0.05) (Figure 4
C). Consistent with the increase in the total number of receptors after blocking AMPAR with CNQX, the same treatment significantly increased the insertion of new NR2A-type receptors (101 ± 13%, n = 37 cells, p < 0.001; Figure 4
C). No significant increase in the insertion of NR2A-type receptors was observed when blocking VGCC or activating the cells with 10 μM NMDA (nimodipine: 58 ± 7%, 84 cells; NMDA: 40 ± 13%, 24 cells, p > 0.05) (Figure 4
C).
In contrast to the highly regulated insertion of NR2A-type receptors, there was no altered insertion of NR2B-type receptors upon activity change. Neither the blocking of NMDARs (control: 22 ± 2%, 82 cells; MK-801: 30 ± 4%, 43 cells; NVP: 22 ± 5%, 42 cells; ifenprodil: 25 ± 2%, 27 cells, p > 0.05) nor the use of CNQX, nimodipine or NMDA (CNQX: 27 ± 3%, 35 cells; nimodipine: 30 ± 5%, 34 cells; NMDA: 23 ± 4%, 28 cells, p > 0.05) (Figure 4
D), changed the insertion of new NR2B-containing receptors significantly. This finding is consistent with a lack of influence of activity on the total amount of membrane-inserted NR2B-type receptors.
Quantification of changes in NMDAR number was performed in all the above experiments by visualizing NMDAR on the cell surface and measuring the total intensity of the EGFP staining for each cell. Hence, a change in the intensity reflects a change in the total number of NMDAR on the surface. Since it is unclear if this change in cell surface NMDARs includes a change in synaptic or extrasynaptic NMDARs (or both), we performed an analysis of NMDAR clusters that should mainly reflect synaptic NMDARs. There was a trend to an increase in the integrated intensity (NR2A ctr: 3457 ± 778 units, 15 cells; 8 h APV: 4590 ± 565 units, 14 cells, p > 0.05) and area (NR2A ctr: 0.21 ± 0.04 μm2, 15 cells; 8 h APV: 0.26 ± 0.03 μm2, 14 cells, p > 0.05) of NR2A cluster staining and a significant increase in the number of NR2A clusters per 100 μM dendrite (NR2A ctr: 108 ± 7, 15 cells; 8 h APV: 154 ± 8, 14 cells, p < 0.001) in cells that had been treated for 8 h with APV when compared to control cells. There was also a significant increase in the total staining intensity per 100 μm dendrite (number of clusters per 100 μM × mean integrated intensity of clusters) in cells treated with APV for 8 h (NR2A ctr: 383,701 ± 99,006 units, 15 cells; 8 h APV: 677,682 ± 78,165 units, 14 cells, p < 0.05), consistent with the increase of the total staining intensity of the entire cell (Figure 5
A). In contrast to the observed changes in NR2A clusters, there was no difference in integrated intensity/cluster (NR2B ctr: 4481 ± 920 units, 10 cells; 8 h APV: 5061 ± 807 units, 12 cells, p > 0.05) area/cluster (NR2B ctr: 0.26 ± 0.04 μm2, 10 cells; 8 h APV: 0.26 ± 0.04 μm2, 12 cells, p > 0.05) cluster number/100 μM (NR2B ctr: 115 ± 6, 10 cells; 8 h APV: 105 ± 6, 12 cells, p > 0.05) and total staining intensity/100 μM dendrite (NR2B ctr: 538,538 ± 129,024 units, 10 cells; 8 h APV: 532,486 ± 78,878 units, 12 cells, p < 0.05) for NR2B clusters in control and 8 h APV treated cells. In summary, cluster analysis showed that APV treatment influenced the localization of NR2A subunits without changing the distribution of NR2B subunits and indicated that the number of synaptic NR2A subunits might increase (Figure 5
B).
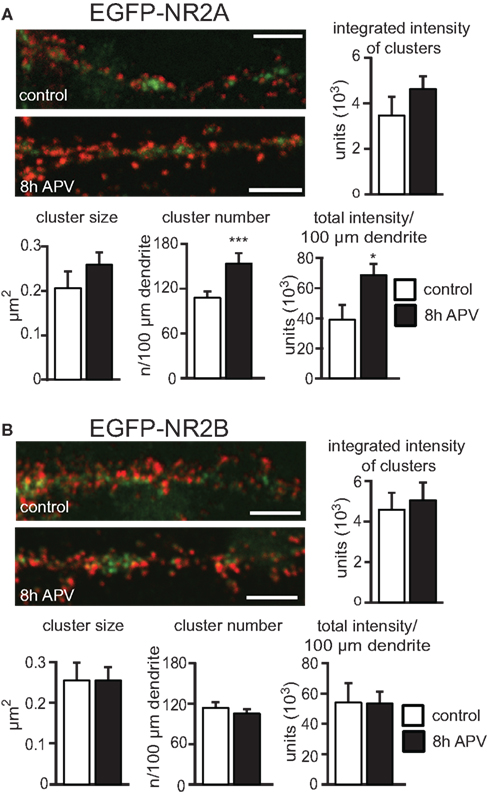
Figure 5. APV treatment increases number and total staining intensity of NR2A but not NR2B clusters. Sample images show EGFP-NR2A (A) and EGFP-NR2B (B) clusters on dendrites of control and APV (8 h) treated cells. Clusters were visualized under non-permeabilizing conditions with an anti-EGFP antibody (red). Intracellular EGFP-NR2A and EGFP-NR2B subunits can be seen in green. Scale bar = 5 μm. (A) Quantification of clusters shows that APV treatment leads to an increase in number and total staining intensity of NR2A clusters (per 100 μm dendrite). There was a trend for an increase in size and integrated intensity of NR2A clusters on cells treated with APV. (B) No difference in any of these parameters could be observed for NR2B clusters, when comparing control and APV-treated cells (mean ± SEM).
NMDA Receptor Activation Regulates Synaptic NMDA EPSCs in Primary Hippocampal Cell Cultures
The immunocytochemical experiments on cell cultures had shown that the number of NR2A- receptors increases on the cell surface, and cluster analysis indicated that number of synaptic NR2A subunits increases during NMDAR blockade. Since not all NMDAR clusters on the cell surface reflect synaptic NMDARs, we sought to corroborate these data by electrophysiological measurements and investigated if newly inserted receptors contribute to synaptic currents. We thus recorded NMDAR-mediated currents (at a holding potential of +40 mV) of connected cell pairs in primary hippocampal cell cultures. 8-h treatments with APV significantly increased the peak amplitude of NMDAR-mediated EPSCs compared to control (30 min APV) cells (EPSC peak control: 17 pA [6–33], 30 pairs, EPSC peak after 8 h APV: 31 pA [20–59], 28 pairs, median ± interquartile range (IQR), p = 0.002, Mann–Whitney rank sum test), indicating that the synaptic NMDAR number increased (Figure 6
A). Consistent with an increase in the synaptic NR2A/NR2B ratio we observed after 8 h of APV treatment a decrease in the EPSC decay (τw), when compared to the EPSC decay τw in control cells (τw control: 234 ms [181–267], 31 pairs, τw after 8 h APV: 153 ms [134–193], 24 pairs, median ± IQR, p = 0.008, Mann–Whitney rank sum test, Figure 6
A). A change in the NR2A/NR2B ratio should also alter the NMDAR current sensitivity to the NR2B selective and the NR2A preferring NMDAR blockers ifenprodil and NVP. Ifenprodil (10 μM) decreased by more than 60% the peak amplitude of NMDAR-mediated currents in paired recordings. The reduction in ifenprodil-mediated peak amplitude was significantly smaller in cell pairs treated for 8 h with APV (% remaining current with ifenprodil, control: 34 ± 5%, 7 pairs; after 8 h APV: 51 ± 3%, 8 pairs, p > 0.01, Student’s t-test, Figure 6
B). NMDAR-mediated peak current amplitudes recovered nearly completely after ifenprodil washout (% current after washout, control: 89 ± 13%, 7 pairs; after 8 h APV: 94 ± 8%, 8 pairs, p > 0.05, Student’s t-test, Figure 6
B). In contrast to the decrease in ifenprodil sensitivity there was an increase in the sensitivity for the NR2A-preferring blocker NVP (50 nM) after treatment with APV for 8 h (% remaining current with NVP, control: 66 ± 5%, 6 pairs; after 8 h APV: 46 ± 6%, 6 pairs, p > 0.05, Student’s t-test, Figure 6
C). The NMDAR-mediated currents recovered also nearly completely after NVP-washout (% current after washout, control: 97 ± 6%, 6 pairs; after 8 h APV: 91 ± 7%, 6 pairs, p > 0.05, Student’s t-test, Figure 6
C).
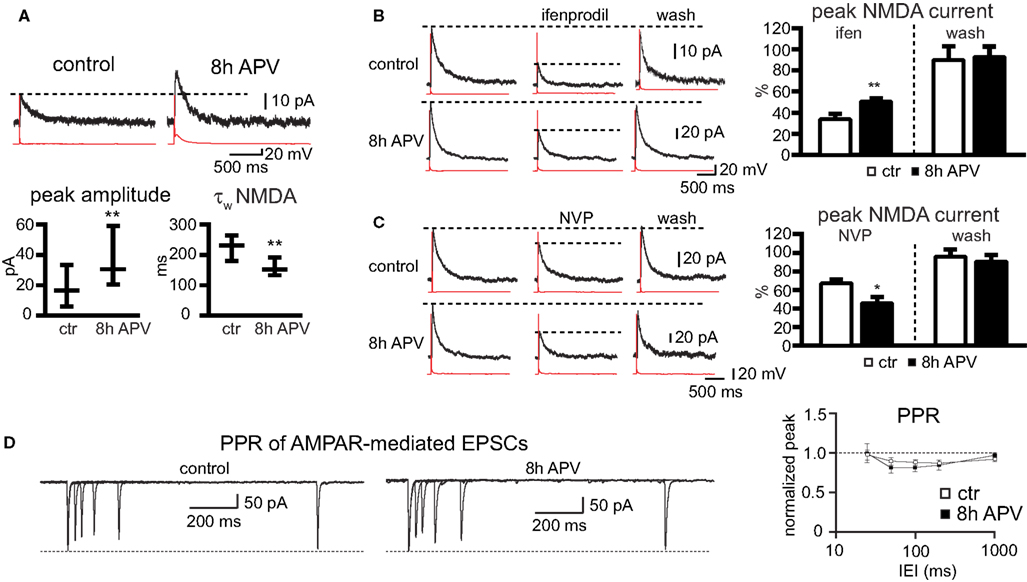
Figure 6. APV treatment increases synaptic NMDAR-mediated EPSCs in cultured cells. (A) Paired recordings were performed in primary hippocampal cultures. APs (red) were evoked in a presynaptic cell, and NMDAR-mediated EPSCs (black) were recorded in a postsynaptic cell at a holding potential of +40 mV. Cultures were treated either for 30 min with APV (control) or for 8 h with APV before recording. 8 h-APV increased the peak amplitude of NMDAR-mediated EPSCs and decreased the τw of the EPSC deactivation (median ± IQR). (B) Example traces of NMDAR-mediated currents without and with ifenprodil and after washout of the NR2B-selective blocker. The quantification shows the decrease in ifenprodil sensitivity in cells treated for 8 h with APV compared to control cells (mean ± SEM). (C) Example traces of NMDAR-mediated currents without and with NVP and after washout of the NR2A-preferring blocker. The quantification shows the increase in NVP sensitivity in cells treated for 8 h with APV compared to control cells (mean ± SEM). (D) 8 h of APV treatment did not change the PPR of AMPAR-mediated EPSCS. EPSCs were evoked with IEI of 25, 50, 100, 200, and 1000 ms (mean ± SEM).
A change in current amplitude can reflect an increase in the number of synaptic receptors or an increase in the release probability. To test for changes in presynaptic function, we measured the PPR of AMPAR-mediated EPSCs (20, 50, 100, 200, and 1000 ms IEI) of connected pairs in hippocampal cell cultures. There was no difference in the PPR between pairs in control cultures (30 min APV) and APV (8 h) treated cultures (PPR control, 25 ms IEI: 0.96 ± 0.06, 50 ms IEI: 0.89 ± 0.05, 100 ms IEI: 0.88 ± 0.03, 200 ms IEI: 0.87 ± 0.03, 1000 ms IEI: 0.91 ± 0.1, n = 16; after 8 h APV, 25 ms IEI: 0.98 ± 0.12, 50 ms IEI: 0.8 ± 0.06, 100 ms IEI: 0.81 ± 0.05, 200 ms IEI: 0.84 ± 0.06, 1000 ms IEI: 0.96 ± 0.04, n = 13; p > 0.05, Student’s t-test, Figure 6
D). Hence, a change in the release probability does not account for the difference in the current amplitude in control and APV-treated slices.
These experiments indeed show that the treatment of cultures with APV increases the amount of NR2A-type NMDAR on the cell surface of cultured cells and also increases the number of NMDAR in the synapse, primarily by increasing synaptic NR2A-type receptors, consistent with the immunocytochemical experiments. Moreover, these experiments, performed with non-transfected cells, indicate that the results obtained with transfected cells are unlikely to reflect an unphysiological reaction of cells over-expressing tagged NMDARs.
NMDA Receptor Activation Regulates Synaptic NMDA EPSCs in CA1 Neurons of Acute Hippocampal Slices
The cell culture experiments showed that the amount of NR2A-containing membrane-bound receptors increases by NMDAR blockade and that these receptors are integrated into the synapse. To rule out that these changes reflect an artifact of the primary cell culture system, we performed additional electrophysiological experiments in acute hippocampal slices, which are physiologically more relevant than cultured neurons. NMDA currents were evoked in CA1 pyramidal cells (membrane potential of +40 mV) by Schaffer collateral/commissural fiber stimulation. NMDA EPSCs of two control cells were recorded without changing position of the stimulation pipette or the stimulation strength and were compared to the current amplitudes of 1–3 cells that were adjacent to the control cells, after incubating the slices for 8 h in extracellular solution in the presence or absence of APV. In control experiments, NMDA EPSCs did not change significantly after 8 h (before incubation: 100 ± 9.2%, 8 cells; after 8 h: 92 ± 12.2%, 14 cells, p > 0.05). In contrast, there was a significant increase of the NMDA EPSCs after 8-h incubation in APV (before incubation: 100 ± 10.6%, 8 cells; after 8 h + APV: 188 ± 30.1%, 10 cells, p < 0.05) (Figure 7
A). Similar to our experiments in cell cultures we tested for changes in presynaptic function that could explain a change in NMDAR-mediated current amplitudes. We measured the PPR of AMPAR-mediated EPSCs (100 ms interval). There was no significant change in the PPR after 8 h in control solution (PPR before incubation: 1.49 ± 0.09, 7 cells; after 8 h + APV: 1.34 ± 0.05, 14 cells, p > 0.05) and in APV-treated slices (before incubation: 1.46 ± 0.05, 10 cells; after 8 h + APV: 1.34 ± 0.07, 10 cells, p > 0.05, Figure 7
B). Hence, a change in the release probability does not account for the difference in the current amplitude in control and APV-treated slices.
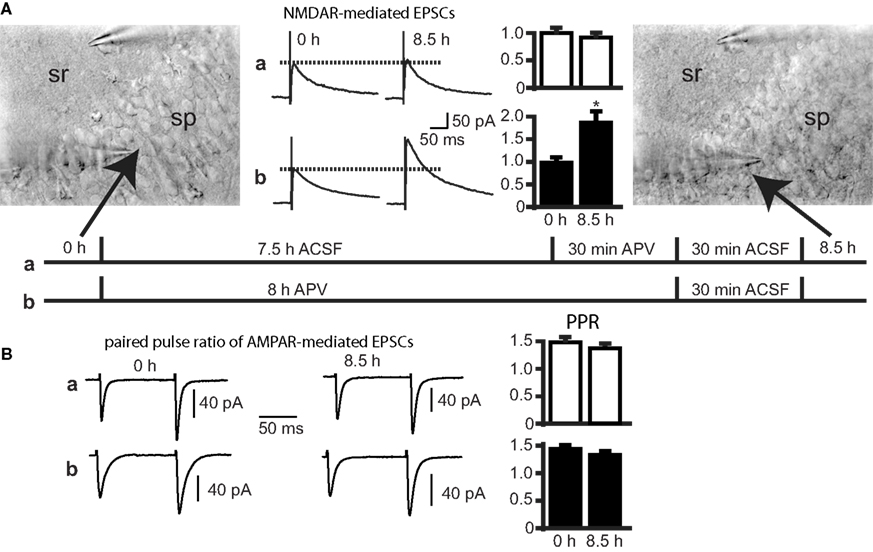
Figure 7. APV treatment increases synaptic NMDAR-mediated EPSCs in CA1 neurons of acute hippocampal slices. (A) Synaptic EPSCs were evoked in hippocampal slices by stimulation of Schaffer collateral/commissural fibers. EPSCs were recorded in adjacent pyramidal cells at a holding potential of +40 mV. Control slices (condition a) were incubated in ACSF for 7.5 h, followed by 30 min ACSF + APV (APV) and an APV-free ACSF-step for 30 min prior to recording. This treatment did not change the EPSC amplitude. In contrast, 8 h of APV treatment (condition b) induced an increase in the EPSC amplitude. EPSC amplitudes recorded in two adjacent cells at the beginning of the experiments were used for normalization (mean ± SEM). Also shown are infrared DIC images to control for the invariant position of the stimulation pipette throughout the experiment in stratum radiatum (sr) and to guarantee recordings from neighboring cells at the beginning and end of the experiments in stratum pyramidale (sp). (B) There was no change in PPR of AMPAR-mediated EPSCs (recorded at −70 mV) during condition a or condition b (mean ± SEM).
To investigate whether the NR2A/NR2B ratio changes during APV treatment also in slices, we tested the ifenprodil sensitivity of synaptic NMDAR-mediated EPSCs in CA1 neurons during Schaffer collateral/commissural fiber stimulation (Mg2+-free extracellular solution, holding potential of −70 mV). The ifenprodil block of NMDAR EPSCs was significantly smaller in slices treated with APV for 8 h than in control slices (% remaining current with ifenprodil; ctr: 60.7% (51.9–78), 24 cells; after 8 APV: 84.4% (67.2–93.2) 22 cells, median ± IQR, p < 0.005) (Figure 8
). The EPSC decay was significantly faster in neurons of slices treated for 8 h with APV than in those kept for 8 h in control solution [τw control: 104.1 ms (83.7–123.3), 24 cells; τw + APV: 83.6 ms (77.2–110.3), 22 cells, median ± IQR, p < 0.05], consistent with increased synaptic NR2A/NR2B ratios (Figure 8
). Thus, prolonged NMDAR blockade results in the selective upregulation of synaptic NR2A-containing NMDARs.
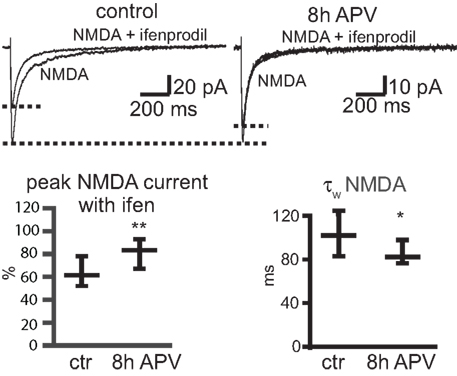
Figure 8. APV treatment leads to a decrease in ifenprodil sensitivity and deactivation kinetics of synaptic NMDAR-mediated EPSCs. Synaptic EPSCs in CA1 pyramidal cells were evoked in hippocampal slices by stimulations of Schaffer collateral/commissural fibers. Slices were incubated for 8 h in ACSF without (control) or with APV (8 h APV). NMDAR-mediated EPSCs were recorded at a holding potential of −70 mV in Mg2+-free ACSF. The ifenprodil (10 μM) sensitivity was significantly smaller in slices incubated for 8 h in APV than in control (ctr) slices (median ± IQR). There was also a significant reduction in the τw of NMDAR-mediated EPSCs in cells of APV-treated slices, consistent with an increase in the synaptic contribution of NR2A-type containing NMDARs (median ± IQR).
The NR2A and NR2B subunits mark the principal NMDAR subtypes in the forebrain. These differ in developmental expression (the NR2B-type receptor is present already early in development, whereas expression of the NR2A subtype starts postnatally) and electrophysiological properties (Monyer et al., 1994
). Differences in the role of NR2A- and NR2B-type receptors in LTP and LTD induction have been proposed (Tang et al., 1999
; Liu et al., 2004
; Massey et al., 2004
; Berberich et al., 2005
; Weitlauf et al., 2005
; Bartlett et al., 2007
; Morishita et al., 2007
), but conclusive evidence has not yet been obtained. Indeed, NMDAR expression changes, and particularly the differential synaptic regulation of the two NMDAR subtypes, may be crucial for the subsequent induction of distinct downstream signaling cascades. Such differential regulation may well be important for modifying cellular responses upon NMDAR activation.
To investigate whether and how the insertion of NMDAR subtypes in the cell membrane is regulated, we first measured turnover rates. In contrast to a fast turnover rate of AMPARs with time constants around 30 min (Passafaro et al., 2001
), NMDAR insertion into the cell membrane occurred much slower. Indeed, the intensity of newly inserted tagged NR2A- and NR2B-type receptor staining reached 75% and 42% of control values, respectively, 24 h after cleaving off the EGFP-tag. The mono-exponential fit of the data shows that the turnover time constants are virtually the same, with 9.2 and 9.7 h respectively for NR2A- and NR2B-type receptors. The maximum of the monoexponential fit was not 100%, but 81% and 46% respectively for the two subtypes. This can be expected if internalized receptors, whose tag was cleaved off, are recycled and reinserted into the cell membrane. In fact, it was shown that after internalization, NR2B-containing receptors are not only targeted to endosomes for degradation but also reinserted into the cell membrane (Scott et al., 2004
). Our data indicate that the recycling of NR2B-type receptors exceeds that of NR2A-containing receptors. These results are consistent with previous findings, indicating that approximately 50% of NR2B-type receptors were sorted to recycling endosomes after internalization, whereas the NR2A subtype was preferentially targeted to late endosomes (Lavezzari et al., 2004
). It is not clear though, whether the EGFP-tag itself has an influence on the turnover, targeting to endosomes and recycling of NMDARs. It is possible that the tag changes the proportion of receptors that are either degraded or recycled after internalization. The tag could thus influence the maximal surface staining intensity observed after un-tagging NMDARs. It is similarly unclear if endogenous receptors can form with tagged receptors heteromeric assemblies that might show a different turnover rate when compared with pure endogenous receptors.
Related studies have addressed several issues pertinent to our results. Thus, studies on biotinylated receptors in cultured neurons showed that the turnover-rate of NMDAR is developmentally regulated. In young cultures (DIV 4), >50% of the NR1 subunit was internalized after 5 min (Washbourne et al., 2004
). Also, the percentage of cortical NR2B-type receptors that were endocytosed within 30 min was high at DIV 7 (22%), but significantly lower (5%) in DIV 18 neurons (Roche et al., 2001
), and hence comparable to the turnover-rate determined in our hippocampal cultures at DIV 17. The developmental stabilization of NMDARs in the cell membrane reaching a turnover time constant of approximately 10 h established here is in line with an NMDAR degradation process also in the range of several hours, as shown for NR2A protein in DIV 8–9 cerebellar granule cells. Huh and Wenthold (1999)
demonstrated that the half-life of total NR2A protein is 16 h and that of cell membrane-bound NR2A 20 h.
Previous studies indicated that NMDAR blockade of cultured cells increases the total number of NMDAR on neurons (Rao and Craig, 1997
; Liao et al., 1999
; Crump et al., 2001
). Chronic APV treatment of low-density hippocampal cultures increases several times the number of synaptic NR1 clusters per dendritic length (Crump et al., 2001
). We demonstrate that NMDAR blockade differentially affects the regulation of NMDAR subtype trafficking. NR2A-containing receptors in the cell membrane are strongly up-regulated after blocking NMDARs and AMPARs, whereas NR2B-containing receptors are not affected. Previous studies indicated that the regulation of NMDAR expression is dependent on age and brain-region. Quantitative electron microscopy studies indicated that in vivo cortical application of APV in adult rats alters the NR2A/NR2B ratio by increasing the number of synaptic NR2A-type receptors and decreasing the number of synaptic NR2B-type receptors (Aoki et al., 2003
; Fujisawa and Aoki, 2003
). However, opposite results were reported when neuronal activity was decreased by dark-rearing of animals during the critical period for ocular dominance, which prevented the developmentally regulated increase of the NR2A/NR2B ratio in the visual cortex (Carmignoto and Vicini, 1992
; Quinlan et al., 1999
; Chen and Bear, 2007
). One needs to keep in mind though that these experiments are difficult to compare with ours since dark-rearing induced neuronal activity changes are most likely dissimilar to a complete blockade of NMDARs. Regional differences in the control of NR2A and NR2B protein might also explain why APV treatment caused an increase of NR2B protein only in cultures obtained from occipital cortex (Chen and Bear, 2007
), but increased protein levels of both subtypes in hippocampal cultures (Rao and Craig, 1997
). Furthermore, the duration of NMDAR blockade might be yet another factor accounting for the different results obtained in some of the studies. Thus, APV treatment of DIV 4–5 slice cultures for 60 h prevented the synaptic delivery of recombinant NR2A-but not NR2B-containing NMDAR (Barria and Malinow, 2002
). Also most of the aforementioned studies investigated the influence on NMDAR expression by reducing cortical activity or blocking NMDARs for several days. In contrast, short NMDA blockade by in vivo cortical application of APV for 30–120 min in adult rats induced an increase of synaptic NR2A-containing NMDAR and a decrease of synaptic NR2B-containing NMDAR (Aoki et al., 2003
; Fujisawa and Aoki, 2003
).
Synaptic NMDAR levels are not only regulated by membrane insertion or internalization of NMDARs but also by lateral movement of extrasynaptic NMDARs into the synapse (Tovar and Westbrook, 2002
; Zhao et al., 2008
). Our immunocytochemical experiments did not differentiate between extrasynaptic and synaptic NMDARs, but quantified the increase in total NMDARs levels and in the insertion of new receptors into the membrane. Hence, lateral movement of NMDARs into the synapse cannot account for the changes observed in the immunocytochemical experiments. However, we cannot exclude that lateral diffusion contributed at least in part to the observed electrophysiological changes (see below). Groc and colleagues showed that lateral movement is very different for NR2A and NR2B subunits. NR2A subunits reside fairly stably in the synapse, whereas NR2B subunits are highly mobile and move in and out of the synapse. This lateral movement of NR2B subunits is not activity-dependent (Groc et al., 2006
; Zhao et al., 2008
), but is regulated in a subunit-dependent fashion by the extracellular matrix protein Reelin (Groc et al., 2007
). Hence, we believe that activity-independent lateral movement of NMDARs and activity-dependent insertion of new receptors into the synapse are two independent mechanisms accounting for synaptic NMDAR metaplasticity. The immunocytochemical experiments of our study showed a change of total NR2A receptor content in the cell membrane upon NMDAR and AMPAR blockade. The physiologically relevant question as to whether these receptors are also integrated into the synapse was addressed by electrophysiological measurements. An 8-h treatment with APV in culture and slice experiments clearly showed a significant increase of the NMDA current amplitude and faster deactivation kinetics. NMDAR-mediated current kinetics are modulated by many parameters and mechanisms, including temperature (Hestrin et al., 1990
; Cais et al., 2008
), voltage (Konnerth et al., 1990
; Clarke and Johnson, 2008
), phosphorylation (Lu et al., 1999
; Skeberdis et al., 2006
), spermine (Rumbaugh et al., 2000
), the extent of glutamate spillover with activation of extrasynaptic NMDARs (Diamond, 2001
; Lozovaya et al., 2004
), and alternative splicing of exon 5 of the NR1 subunit transcript (Rumbaugh et al., 2000
). Some of these parameters (temperature and voltage) were constant in our experiments. It is possible that, e.g. phosphorylation/dephosphorylation contributes to the changes in EPSC decay kinetics. However, the concomitant decrease of ifenprodil sensitivity and increase of NVP sensitivity indicate that the synaptic N2RA/NR2B ratio is increased by 8 h of APV treatment. It is therefore likely that this ratio increase is the main cause of the changed EPSC kinetics. These functional data are in line with the immunocytochemical results, showing that NMDAR activation increases the number of NR2A- but not NR2B-containing NMDAR in the cell membrane and increases the intensity and number of NR2A clusters. More NR2A-type receptors in the membrane can result from increased insertion of new receptors or decreased internalization. Both the rate of insertion (Dunah and Standaert, 2001
; Lan et al., 2001a
,b
; Skeberdis et al., 2001
) and internalization (Vissel et al., 2001
; Nong et al., 2003
) can be regulated. Quantification of new NR2A-type receptor insertion during NMDAR blockade indicated that the higher levels of NR2A-containing receptors in the membrane might reflect increased insertion, with decreased internalization playing rather a minor role. In contrast, the increase during AMPAR blockade cannot be explained solely by more receptor insertion. The experiments with NVP and ifenprodil demonstrated that the activity of either NMDAR subtype was sufficient to keep normal NMDAR levels. However, the interpretation of data resulting from experiments with these antagonists is not straightforward, given their suboptimal subunit specificity. Whilst 10 μM ifenprodil blocks most NR1/NR2B receptors (>80%) and nearly no NR1/NR2A receptors (Williams, 1993
), 50 nM NVP blocks approximately 75% of NR1/NR2A receptors but also 25% of NR1/NR2B receptors (Berberich et al., 2005
). In addition, both drugs are barely effective at blocking triheteromeric NR1/NR2A/NR2B receptors (Paoletti and Neyton, 2007
), which appear to constitute a significant proportion of the NMDARs (Sheng et al., 1994
; Stephenson, 2001
; Cull-Candy and Leszkiewicz, 2004
). Thus, it is so far not possible to selectively block all NR2A- or NR2B-containing NMDAR receptors with pharmacological tools. It is of note that blocking activity with TTX, in contrast to NMDAR blockade, led only to a small, insignificant increase in the total number of cell membrane NR2A-type receptors. Groc et al. had previously also shown that chronic treatment of cultures (DIV 10–12) with TTX has no influence on the ifenprodil sensitivity of NMDAR-mediated EPSCs (Groc et al., 2007
). Thus, receptor activation by spontaneously released glutamate is sufficient to prevent an up-regulation of NR2A-containing receptors, independent of AP generation. Moreover, a reduction of activity during AMPAR blockade and the consecutive decrease in NMDAR activation are unlikely to be the only explanations for the pronounced effect on surface NR2A-type receptor levels by CNQX.
In summary, our study demonstrates that the number of synaptic NR2A- but not NR2B-type receptors is dependent on activation of ionotropic GluRs. Blockade for few hours leads to an increase in NR2A-type receptors in the cell membrane, mainly by up-regulation of new receptor insertion. The receptors are functionally integrated into the synapse and result in synaptic EPSCs with characteristics indicative of an increased NR2A/NR2B ratio. Thus, cellular activity affects the ratio of synaptic NR2A/NR2B-type receptors, enabling the neuron to react to reduced NMDAR and/or AMPAR activation, not only by an increased NMDA component, but also by faster kinetics of NMDA EPSCs.
The authors declare that the research was conducted in the absence of any commercial or financial relationships that could be construed as a potential conflict of interest.
We thank Anne Herb for help with the EGFP-NR2B construct, Regina Hinz-Herkommer for help with cell culture work, Dr. Yves P. Auberson (Novartis Pharma AG, Basel, Switzerland) for NVP-AAM077 and Pfizer (Groton, CT) for CP-101,606. Supported in part by BMBF grant 01GS0117 to HM and PHS, MWFK Baden-Württemberg grant 23-7532.22-20-12/1 to HM and JVE and a grant from the European Commission to the EUSynapse project (LSHM-CT-2005-019055) to HM and PHS.
Bartlett, T. E., Bannister, N. J., Collett, V. J., Dargan, S. L., Massey, P. V., Bortolotto, Z. A., Fitzjohn, S. M., Bashir, Z. I., Collingridge, G. L., and Lodge, D. (2007). Differential roles of NR2A and NR2B-containing NMDA receptors in LTP and LTD in the CA1 region of two-week old rat hippocampus. Neuropharmacology. 52, 60–70.