1
FRSQ Groupe de Recherche en Neurobiologie Comportementale (CSBN), Concordia University, Canada
2
Centre de Recherche en Sciences du Sport (EA 647), Université Claude Bernard-Lyon 1, France
3
FRSQ Groupe de Recherche sur le Système Nerveux Central (GRSNC), Université de Montréal, Canada
The cerebellar cortex is remarkable for its organizational regularity, out of which task-related neural networks should emerge. In Purkinje cells, both complex and simple spike network patterns are evident in sensorimotor behavior. However, task-related patterns of activity in the granule cell layer (GCL) have been less studied. We recorded local field potential (LFP) activity simultaneously in pairs of GCL sites in monkeys performing an active expectancy (lever-press) task, in passive expectancy, and at rest. LFP sites were selected when they showed strong 10–25 Hz oscillations; pair orientation was in stereotaxic sagittal and coronal (mainly), and diagonal. As shown previously, LFP oscillations at each site were modulated during the lever-press task. Synchronization across LFP pairs showed an evident basic anisotropy at rest: sagittal pairs of LFPs were better synchronized (more than double the cross-correlation coefficients) than coronal pairs, and more than diagonal pairs. On the other hand, this basic anisotropy was modifiable: during the active expectancy condition, where sagittal and coronal orientations were tested, synchronization of LFP pairs would increase just preceding movement, most notably for the coronal pairs. This lateral extension of synchronization was not observed in passive expectancy. The basic pattern of synchronization at rest, favoring sagittal synchrony, thus seemed to adapt in a dynamic fashion, potentially extending laterally to include more cerebellar cortex elements. This dynamic anisotropy in LFP synchronization could underlie GCL network organization in the context of sensorimotor tasks.
The structure of the cerebellar cortex is remarkably regular (Bloedel, 1992
; Eccles et al., 1967
), an organization out of which must ultimately emerge task-related cerebellar neural networks. Anatomical features such as afferent and efferent organization will partly determine the network organization, outlining the potential information processing units (Apps and Garwicz, 2005
; Oscarsson, 1979
; Voogd and Glickstein, 1998
). In addition, methods for assessing neural network organization in physiological terms, such as the recording of local circuit activity at multiple sites will provide information about the way in which the different elements of the network are dynamically linked (Miller and Wilson, 2008
). A preliminary evaluation of such dynamical networks can include the assessment of local field potential (LFP) activity and synchronization in identified areas (Buzsaki, 2006
; Schnitzler and Gross, 2005
; Singer et al., 1997
). Focusing on cerebellar cortex 10–25 Hz LFP oscillations (Courtemanche et al., 2002
; Pellerin and Lamarre, 1997
) in the paramedian lobule, we measured the LFP synchronization occurring in the cerebro-cerebellar networks, and found task-dependent modulation of this activity in an active sensorimotor task (Courtemanche and Lamarre, 2005
). An open question is how this activity is shaped within the cerebellar cortex.
In search of cerebellar cortex population activity, task-related multiple-electrode recordings have mostly focused on the Purkinje cell simple and complex spikes. For example, olivocerebellar activity is synchronized into parasagittal bands (Lang et al., 1999
), and presents a population-level mosaic pattern in relation with movement (Welsh et al., 1995
). Simple spikes also show population patterns of activity (Bell and Grimm, 1969
; Shin and De Schutter, 2006
), and a medio-lateral (on-beam) preferential synchrony pattern emerges during movement (Heck et al., 2007
). Complex and simple spike population activity could interact in determining these network patterns (Schwarz and Welsh, 2001
). Bearing some spatio-temporal similarities in signal to field potentials (Gao et al., 2003
; Qiu et al., 2008
; Rockni et al., 2007
), neural activity-dependent imaging, such as in the use of activity-dependent fluorescent dyes to assess neural activity across tissue, also provides a window into network interactions. Applied to the cerebellar cortex, one of the main results was the physiological identification of parasagittal bands to the stimulation of the inferior olive or climbing fibers in the underlying white matter (Brown and Ariel, 2009
; Gao et al., 2003
; Rockni et al., 2007
, 2008
). Using pH-sensitive dyes, Gao et al. (2003)
found that beams of parallel fiber stimulation could monitor the link between parasagittal bands via Purkinje cell postsynaptic LTD, after conjunctive parallel fiber-climbing fiber stimulation. Rockni et al. (2007)
identified parasagittal bands following climbing fiber stimulation, but also identified a patch-like activation through the stimulation of identified mossy fiber responses. Finally, parasagittal band zonation with inferior olive stimulation, and a relatively patchy response to granule cell layer stimulation using similar dyes was also emphasized in Brown and Ariel (2009)
, in the turtle cerebellar cortex. Using those methods, network interactions at the surface of the cerebellar cortex are starting to be documented.
Despite recent important advances in the understanding in the organization of the granule cell layer local circuit organization (D’Angelo, 2008
; D’Angelo and de Zeeuw, 2009
), multi-site task-related activity in the granule cell layer (GCL) has been less studied. Local circuit properties, such as the granule-Golgi cell interaction (De Schutter and Bjaalie, 2001
; Geurts et al., 2003
) have been investigated, but a more general organization of the granule cell layer based on the relations between distant local circuits has not been firmly established. Here we address the multi-site relationship in the primate GCL by focusing on the 10–25 Hz LFP oscillations present at rest, which are modulated during a motor task (Courtemanche et al., 2002
; Pellerin and Lamarre, 1997
). GCL oscillations have also been found in the resting rodent, strongest at ∼7 Hz (Dugué et al., 2009
; Hartmann and Bower, 1998
; O’Connor et al., 2002
). The goal of this study was to identify synchronization patterns, by recording simultaneous GCL LFP pairs oriented in a sagittal or coronal stereotaxic fashion, as monkeys were at rest or performed active and passive expectancy tasks. GCL LFP synchronization was anisotropic at rest, and dynamic during active expectancy, across our recording pairs: this LFP synchronization could represent inherent influences in cerebellar cortex cell population selection and task-related sensorimotor processing.
Animals
Three adult Macaca mulatta, one female (K, 4.7 kg) and two males (F, 7.8 kg and Z, 7.0 kg) were implanted with a recording chamber placed over the left posterior parietal cortex, to access the cerebellum, following known procedures (Lamarre et al., 1970
). Animals were seated in a primate chair, unrestrained except for head fixation. All animal handling, care and surgical procedures were in accordance with the guidelines of the Canadian Council on Animal Care, and were approved by the Université de Montréal Institutional Animal Care and Use Committee.
Recordings and Behavioral Conditions
An elaborate description of the basic recording procedures is given in Courtemanche et al. (2002)
. The main changes here are the modifications to permit simultaneous deep LFP recordings, which require a sturdy system to drive the microelectrodes through the dura and tentorium. Briefly, cerebellar cortex activity was recorded with two glass-coated tungsten microelectrodes (0.2–1 MΩ) lowered carefully to record primate GCL 10–25 Hz oscillations, aiming for the paramedian lobule (Pellerin and Lamarre, 1997
). Electrode arrangements for monkeys F and Z were either sagittal or coronal, using a multi-electrode holder controlled digitally; this holder permitted an inter-electrode distance of 3 or 6 mm, and the plane of orientation could be aligned with either the stereotaxic sagittal or coronal plane. The depth of each microelectrode could be controlled independently. For monkey K, the two microelectrodes were held diagonally by two separate holders, before the multi-electrode holder had been designed; however, these holders’ characteristics only permitted dual recordings in a ‘diagonal’ orientation. Signal was band-pass filtered at 3–70 Hz for LFPs (sampled at 1000 Hz) and 0.3–10 kHz for monitoring multi-unit activity, the latter used to locate the layers. The reference electrode was a copper wire located in a 0.9% saline solution filling the recording chamber. Upon reaching deep GCL activity corresponding to 10–25 Hz oscillations, recordings were made in three blocked conditions: (1) active expectancy (monkeys F and Z, with lever and juice pipette), (2) passive expectancy (monkeys F and Z, sitting quietly, no lever but with juice pipette) and (3) rest (all three monkeys, sitting quietly and attentive, for successive 5 s periods, no lever, no juice pipette). In the active expectancy condition, the monkeys pressed a lever with the left (ipsilateral) hand, after a delay of 1.1–1.5 s following a tone (400 Hz, 35 dB, duration 1.5 s), rewarded with drops of juice. In the passive expectancy condition, the monkey remained seated with the pipette available, but did not produce any stereotypical movement except readiness to receive juice. At rest, the monkey remained seated, and shifted the body occasionally. Monkeys were repeatedly exposed to the behavioral conditions, and following training, the monkeys adopted a stereotypical movement pattern in the active expectancy condition. The lever signal was sampled at 1000 Hz. For passive expectancy, the lever was removed and reward was given without any required action, in the same percentage of trials (70%) as the active condition, after a 1.1–1.5 s delay after stimulus onset.
Analyses
LFPs were analyzed using Fast Fourier Transforms (FFT) for rhythmicity, and the cross-correlation coefficient function for synchronization between the recording sites.
Rest
In the rest condition, we calculated the proportion of the signal within 10–25 Hz (Courtemanche et al., 2002
) for consecutive 200-ms windows, overlapped by 50% to better catch oscillation episodes. To measure the relation between oscillatory spindle co-occurrence at both sites, which we called concomitance, we calculated the linear correlation between the 10–25 Hz rhythmicity at each site, over consecutive windows. This measure provides an estimate of the tightness of the relation in oscillatory content at the two electrodes in a stationary condition, i.e., ‘if site 1 has strong oscillations, does site 2 also have the same?’ (Courtemanche and Lamarre, 2005
; Courtemanche et al., 2003
). Measurements of the rhythmicity between the different orientations were compared with t-tests. Across the same time windows, we also calculated the cross-correlation coefficient (zero-lag value, which was appropriate for our LFP-LFP relations), providing a measure of the synchronization between the two LFPs (Courtemanche and Lamarre, 2005
; Murthy and Fetz, 1996
). In contrast to the quantification of the similarity in oscillatory profile, this is a measurement that evaluates the degree of simultaneous change in the signal (Gerstein and Nicolelis, 1999
; Roelfsema et al., 1997
). For statistical analysis, t-tests compared the pairs across the different orientations, for all windows and each monkey (in one case, we used nonparametric tests, as the assumption of normality was violated, Kolmogorov–Smirnov p > 0.05). Thus, group values for synchronization and concomitance were compared across all windows, per pair orientation, per monkey.
Active and passive expectancy
In the active and passive conditions, rhythmicity was evaluated with the temporal spectral evolution (TSE) (Salmelin and Hari, 1994
), which addresses the occurrence and amplitude of oscillations relative to the task. This consists in band-pass filtering (10–25 Hz) the LFPs, rectifying this filtered signal, and then averaging this new product across trials. For evaluation and illustration of the LFP-LFP synchronization, the cross-correlation coefficient was calculated similar to the rest condition, on 200-ms time windows shifted by 100 ms across the trial. In addition, for statistical analysis, TSE and cross-correlation coefficient values were determined over four different epochs: pre-stimulus (Ps), a 500-ms time window immediately preceding the onset of the stimulus, delay1 (Dl1), a 400-ms window starting 300 ms after stimulus onset, delay2 (Dl2), a 400-ms time window occurring 400 ms before the lever press up to the time of the press, and delay3 (Dl3), a 400-ms time window starting at 4000 ms after the stimulus. Multivariate analyses of variance were performed on the relative TSE values (Ps at 0% change) and on the cross-correlation values (same as Courtemanche and Lamarre, 2005
), with each epoch as a repeated measure, and comparing the sagittal/coronal orientations, and the active/passive/rest conditions.
Histology
In the last recording session, electrolytic lesions were made in the cerebellum at sites showing oscillatory activity. Two days later, monkeys were deeply anesthetized and perfused through the heart using a buffered 9% formaline–8% saline solution. Recording sites were controlled on 50-μm sagittal sections of the cerebellum stained with cresyl violet.
Database
We recorded 15 sessions which had either stereotaxic sagittal or coronal electrode arrangements (monkeys F and Z), and for monkey K, diagonal electrode arrangements. A total of 27 recording pairs were recorded in the three monkeys. Raw LFP data were screened for removal of artifacts; for active and passive expectancy conditions, only the rewarded trials were kept. The average number of trials per session for each monkey, pooled for the active, passive, and rest conditions, were: monkey F (75 trials), Z (73 trials), and K (30 trials, rest only). The recording sites were principally localized, and aimed, to the paramedian lobule and caudal Crus II; in the case of coronal pairs, the medial site sometimes touched the lateral vermis.
Oscillations and Synchronization During Rest
Two LFP pairs, sagittal and coronal, are described first; the sagittal pair sites were both located in the paramedian lobule (Figure 1
A), while for the coronal pairs, the medial site touched the caudal vermis, and the lateral site was in the paramedian lobule (Figure 1
B). The recording pairs were separated by 6 mm, one following the stereotaxic sagittal plane (Figure 1
A), and the others following the stereotaxic coronal plane (Figure 1
B). Site localization was based on the reconstruction from the electrolytic lesions. The oscillations simultaneously waxed and waned on both microelectrodes, with periods of weak (yellow box), and strong oscillations (green box). During periods of strong oscillations, the LFP pairs would display a similar main peak frequency, evident for both the sagittal pair and the coronal pair (Figures 1
C,F, ∼17 Hz). Periods of strong oscillations would also be accompanied by an increased LFP synchronization, for both pairs, at zero lag (Figures 1
D,E). In the presented example, the sagittal pair presented a stronger cross-correlation coefficient (∼0.9 at zero-lag) than the cross-correlation coefficient for the coronal pair (∼0.4), a distinction that remained for both strong and weak oscillations.
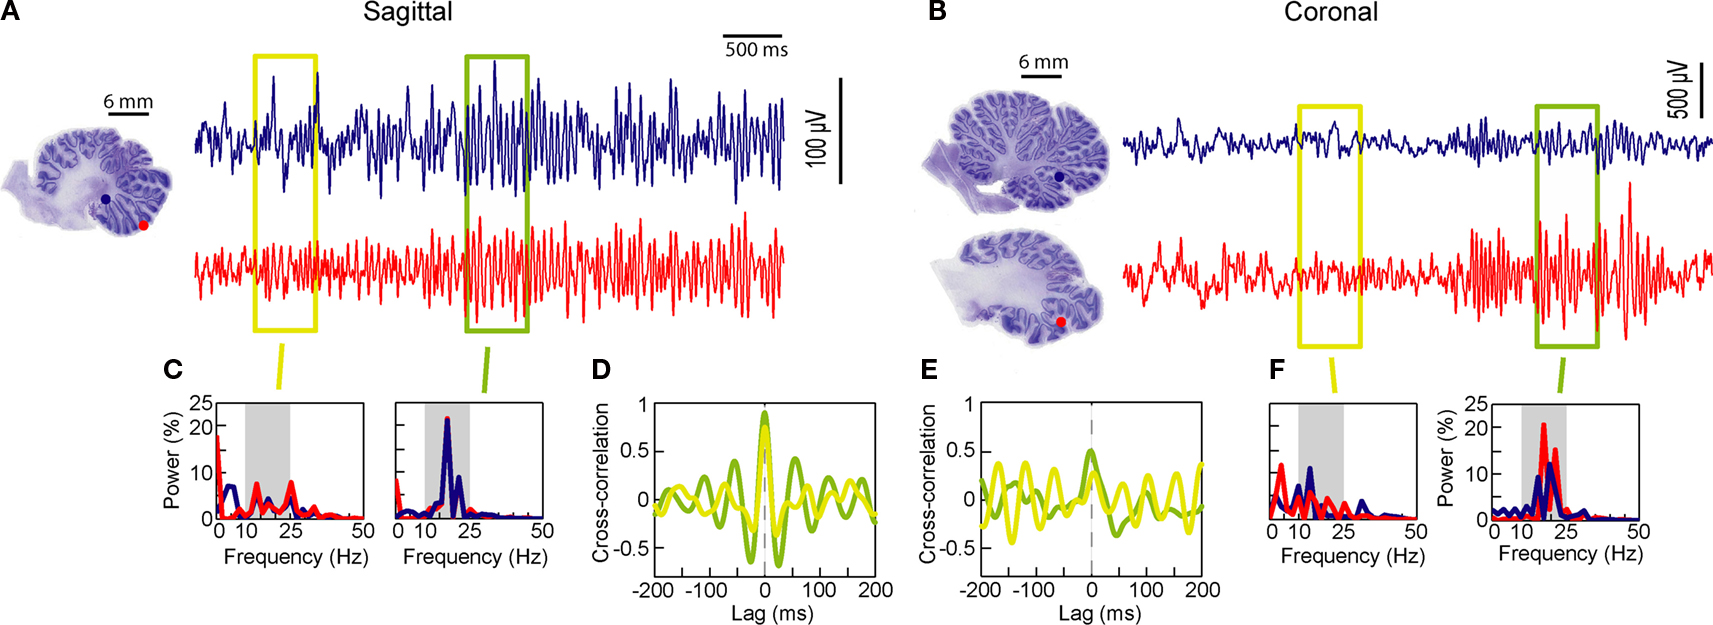
Figure 1. Cerebellar cortex GCL simultaneous LFP recordings at rest, monkey F. (A,B) Simultaneous LFPs recorded sagittally or coronally. Estimated positions of the recording pairs shown, based on reconstruction from electrolytic lesions. Two periods are highlighted, one with low (yellow box) and one with strong (green box) oscillations. (C,F) Fast Fourier Transforms (FFT) for each recording site, for each selected period. (D,E) Cross-correlation for each selected period. Recording sites, field potential and FFT traces are color-matched.
During rest, to assess how oscillations would co-occur on both traces, we measured the 10–25 Hz relative power (%) at both sites, the ‘concomitance’. Figures 2
A,B shows the relative power for multiple windows (n = 792) between two simultaneously recorded LFPs in monkey F. The relationship shows a stronger linear correlation (‘concomitance coefficient’) between the 10–25 Hz content for the sagittal pair [r = 0.71, F(1,790) = 798.79, p < 0.001] than for the coronal pair [r = 0.39, F(1,790) = 145.81, p < 0.001]. As a control for chance simultaneity, comparing site 1 of the coronal pair with site 2 of the sagittal pair (thus on different days, disjointed in time) did not provide a significant linear correlation [F(1,790) = 0.006, p = 0.87]. When looking at a larger dataset, group measures on oscillation concomitance (10 pairs, 5 coronal, 3 sagittal, 2 diagonal, total of 13351 windows, in 3 monkeys), are shown in Figure 2
D, for each monkey. Monkeys F and Z had stereotaxic sagittal and coronal pairs tested; we represent here the sagittal pairs with a lateral distance of zero, and coronal pairs were tested at a lateral distance of 6 mm in monkey F, and 3 mm in monkey Z. Sagittal distances were the same as for the coronal tests. These comparisons reveal a greater concomitance of 10–25 oscillations for sagittal pairs over coronal pairs, [monkey F, t(82) = −5.32, p < 0.001, monkey Z, t(20) = −4.54, p < 0.001], while concomitance for diagonal pairs in monkey K was not different when comparing a lateral distance of 2 and 6 mm [t(20) = −1.08, p = 0.294]. The sagittal pairs thus had a greater tendency to oscillate simultaneously than coronal, even if the effective distance separating the pair elements was the same.
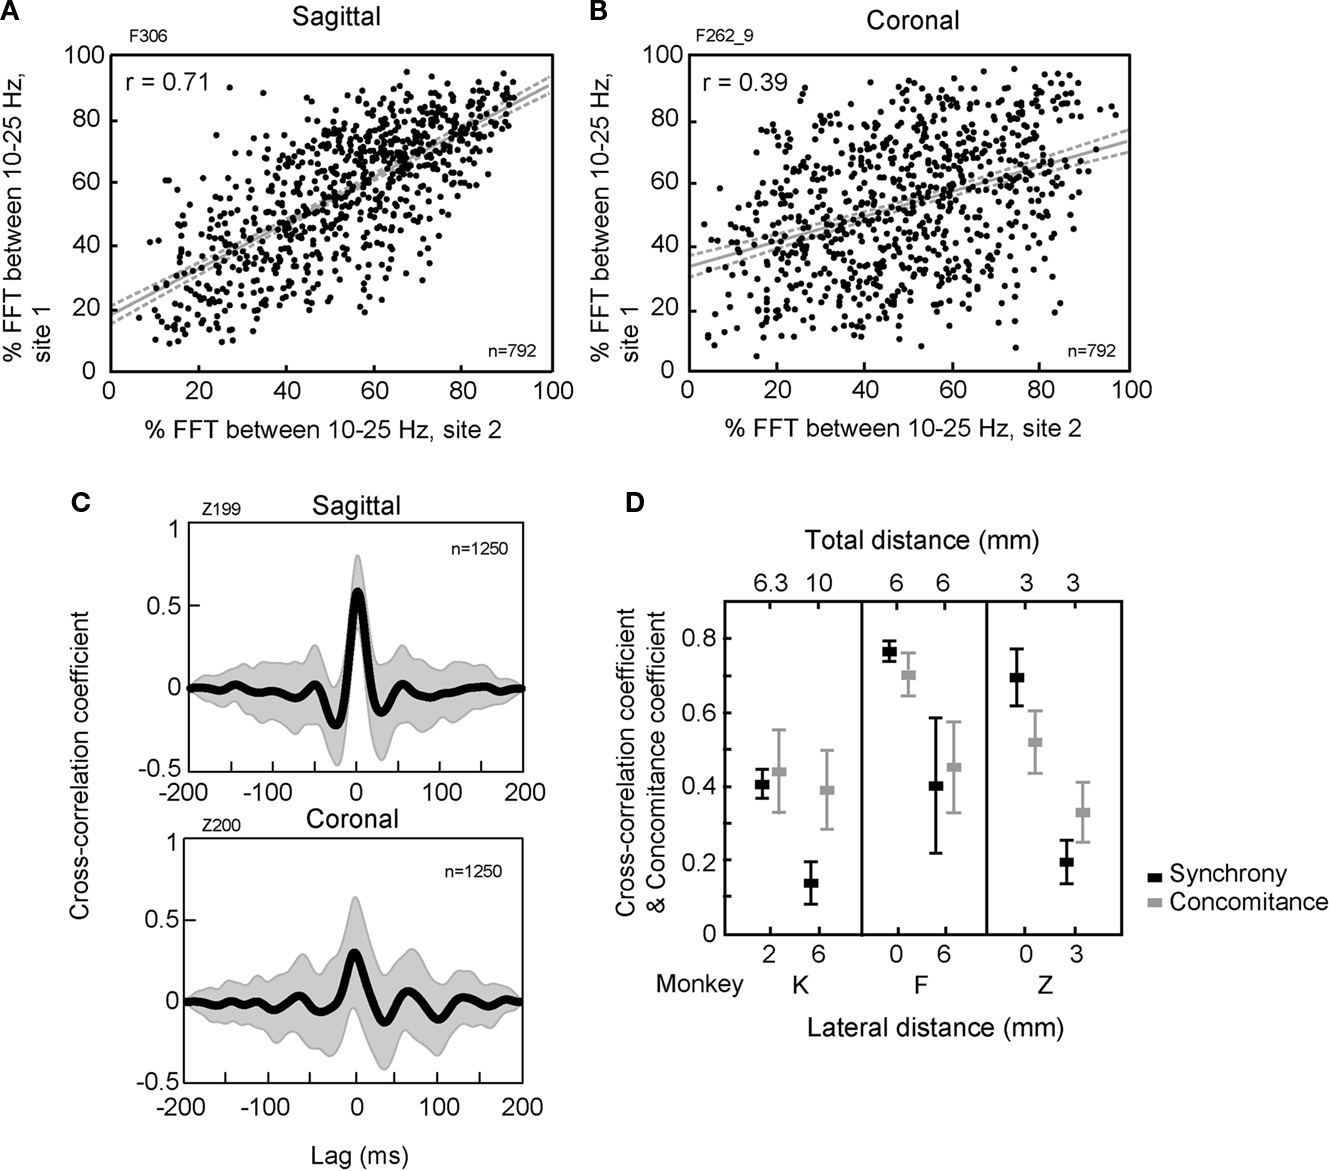
Figure 2. Oscillation and synchronization properties of cerebellar GCL LFPs during rest. (A,B) Relationship between the 10–25 Hz oscillatory content (% of the LFP signal between 10–25 Hz) at both recording sites for a sagittal and a coronal pair in monkey F. Linear correlation value (r), regression line and 95% confidence interval indicated. (C) Averaged cross-correlograms (s.d., gray area) for multiple windows (n = 1250) for a sagittal and a coronal pair in monkey Z. (D) Mean and standard deviation for cross-correlation and concomitance coefficients in relation to both the lateral and the total distances between the two recorded sites for each monkey (K, F, and Z).
For the same pairs, LFP cross-correlation coefficients across the same multiple 200-ms time windows were measured to evaluate synchronization (Figures 2
C,D). The example shown for two pairs from monkey Z (Figure 2
C, 1250 windows) present a greater sagittal than coronal synchronization, at zero lag, and regular across windows, as can be evaluated from the overlaid standard deviation. From the whole dataset, for monkeys F and Z, cross-correlation coefficient values for sagittal pairs (zero mm lateral distance on the abscissa) were twice as high as those of coronal pairs (3 or 6 mm lateral distance), as shown in Figure 2
D [monkey F, Kruskal–Wallis test, H t(1,245) = 116.81, p < 0.001; monkey Z, t(145) = −39.71, p < 0.01]. In monkey K, with diagonally-oriented pairs, the cross-correlation coefficients were between the values of coronal and sagittal pairs [t(96) = −27.03, p < 0.01, higher for a lateral distance of 2 mm vs. 6 mm].
These concomitance and synchronization results provide evidence that LFP-LFP relations in the rest condition showed anisotropy, with greater similarities in the signals recorded at each site when the electrodes were arranged sagittally, in contrast to the other orientations. A striking feature here is that sagittal concomitance and cross-correlation were much higher than the coronal values, despite having the same effective distance separating the LFP recording sites.
Oscillations and Synchronization During Active and Passive Expectancy
The 10–25 Hz GCL LFP oscillations and synchronization between recorded sites were also evaluated during active expectancy (the lever-press task), and passive expectancy (free rewards). In active expectancy, the monkey had to wait until the appropriate time window to press the lever, while in passive expectancy, the lever was taken away, and the monkey did not have to move at all; in this condition, both monkeys (F and Z) remained immobile. Results are shown in Figures 3
A–F (one experimental session in sagittal and one in coronal for monkey F, and G,H group data, for monkeys F and Z). For both monkeys, LFP oscillations were modulated during the active task (see Figures 3
A,B for a typical result obtained in monkey F): for most oscillatory sites, TSE values showed a decrease/re-increase pattern between stimulus onset and lever press, similar for both LFPs of either the sagittal or the coronal pairs. This mirrors the results showed in Courtemanche et al. (2002)
. The movements made by both monkeys to achieve the lever-press were stereotypical: in the time period leading to Dl2, the decrease in the LFP oscillations was related to the period when the hand position was most variable on the lever. The Dl2 period corresponds to the time when the monkey was generating the force to depress the lever. This is the same behavior as described by our group (Courtemanche and Lamarre, 2005
; Courtemanche et al., 2002
). For the synchronization values in-task, cross-correlation coefficients measured throughout the trials were greater for the sagittal pair than for the coronal pair (Figures 3
C,D), as they were during rest. A dynamical aspect also appeared for the coronal pair, as cross-correlation coefficients clearly increased during the task (Figure 3
D); coefficients during Dl1 and Dl2 increased to ∼0.60 from initially ∼0.47 during the Ps period. The 3-D color-coded correlograms in Figures 3
E,F show that the maximal correlation was always at zero-lag.
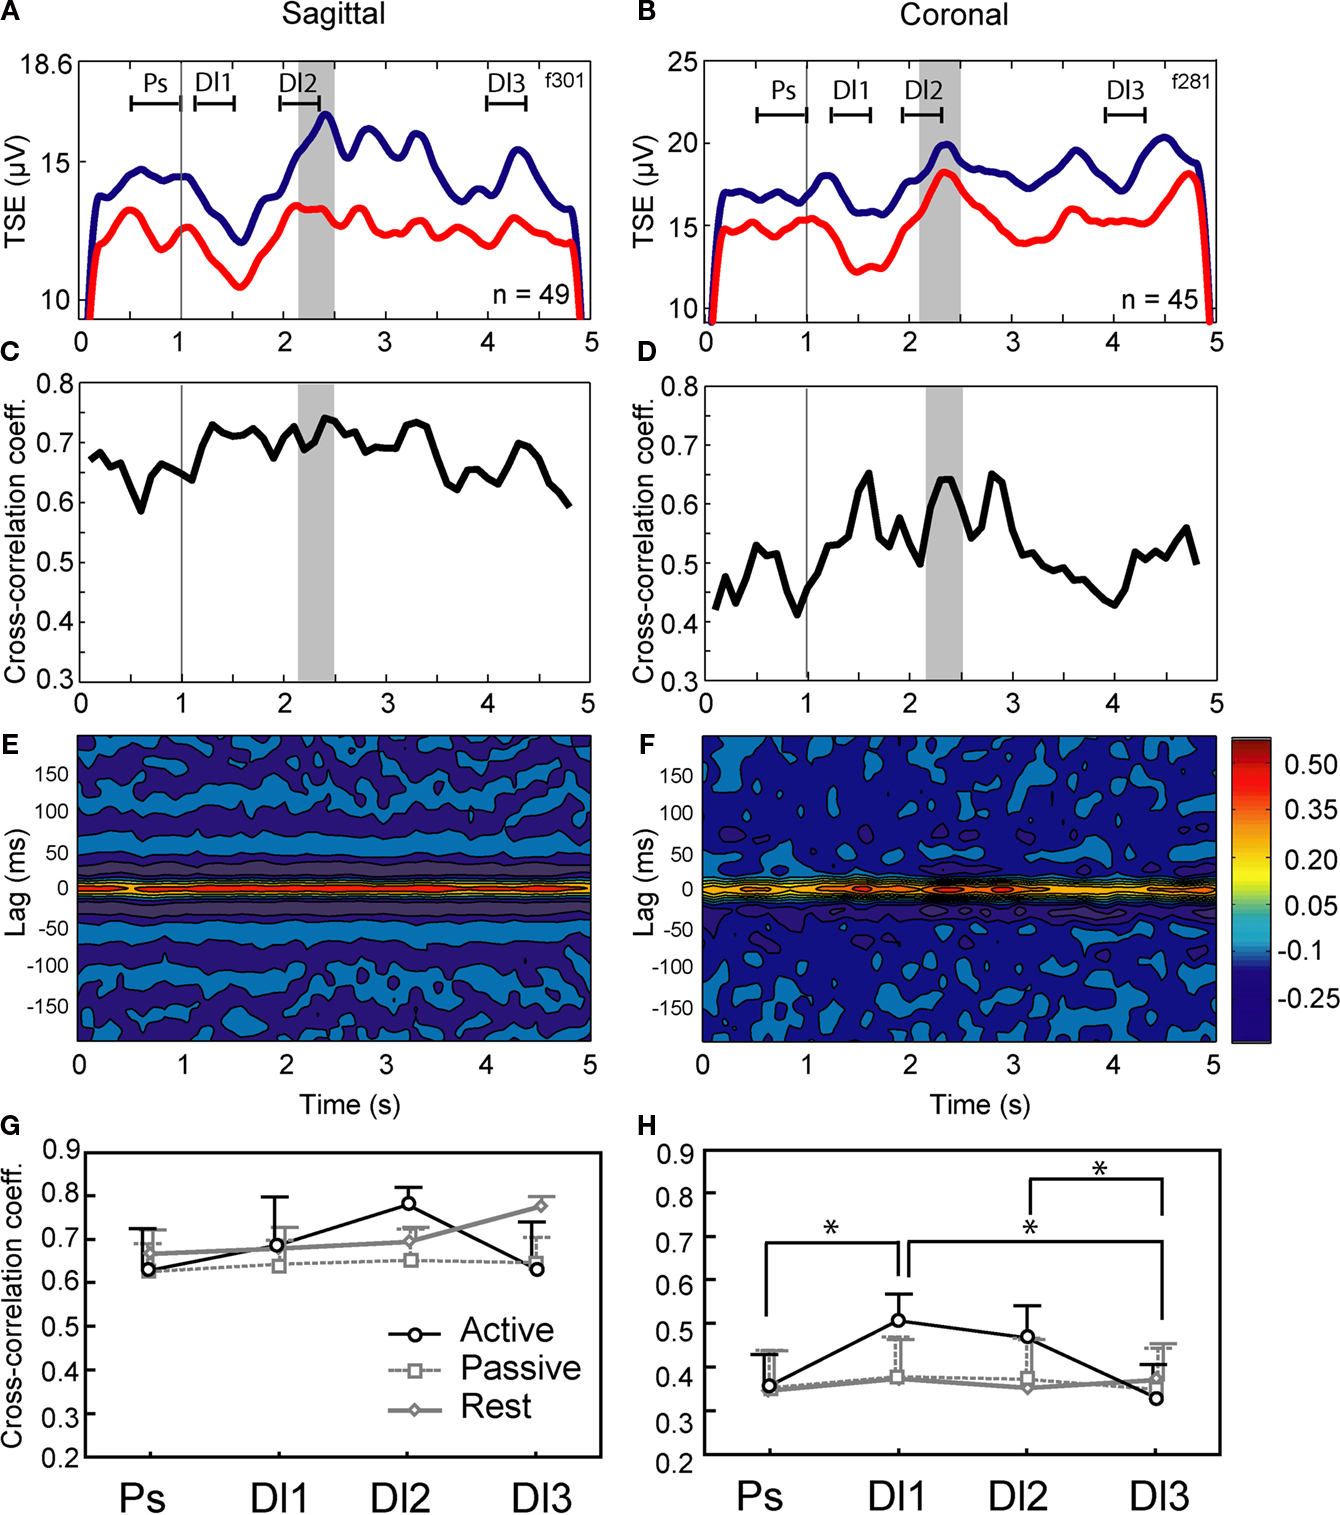
Figure 3. Modulation of cerebellar LFP oscillations and synchronization of LFPs in the active condition, for a sagittal pair and a coronal pair. (A,B) Modulation of the 10–25 Hz oscillations across the trial, as shown by the temporal spectral evolution (TSE). Grey area: reward window, vertical line, stimulus onset. Line colors: A. blue-anterior, red-posterior; B. blue-medial, red-lateral. The different delays Ps, Dl1, Dl2, and Dl3 are indicated. (C,D) Cross-correlation coefficients for the same experiments. (E,F) Cross-correlogram for the same experiments (abscissa: time in the trial; ordinate: lag; color: height in the correlogram). Parts A to F: typical results illustrated by data recorded in monkey F. (G,H) Cross-correlation of LFPs in all conditions (active, passive, and rest), for each delay (Ps, Dl1, Dl2, and Dl3), for both monkeys F and K. Means and s.e.m. indicated; *p < 0.05 (Tukey post-hoc) of this value (active condition) vs. other active condition delays, and passive and rest conditions.
LFP synchronization during the task was compared across the three experimental conditions, across multiple sessions (range 3–7 sessions per condition × orientation) in monkeys F and Z (Figures 3
G,H). For monkey F, a MANOVA on the cross-correlation coefficients for the three conditions (active and passive expectancy, rest) × two orientations (sagittal and coronal) × four delays (Ps, Dl1, Dl2, Dl3) shows a main effect of electrode orientation [F(1,12) = 10.86, p < 0.01, sagittal > coronal], and a condition × delay interaction [F(6,36) = 2.68, p < 0.05]. For monkey Z, the MANOVA showed main effects of electrode orientation [F(1,3) = 68.53, p < 0.01, sagittal > coronal], delay [F(3,9) = 9.61, p < 0.01], condition × delay [F(6,9) = 14.56, p < 0.001], orientation × delay [F(3,9) = 12.98, p < 0.01], and condition × orientation × delay [F(6,9) = 11.65, p < 0.001] interactions. A MANOVA with the sessions from both monkeys showed a main effect of electrode orientation [F(1,21) = 17.77, p < 0.001, sagittal > coronal], of delay [F(3,63) = 4.66, p < 0.01], and a condition × delay interaction [F(6,63) = 5.06, p < 0.001]. Figures 3
G,H shows the results of pairwise comparisons performed by post-hoc Tukey HSD on condition x orientation × delay interaction. In the active expectancy task, for coronal pairs (Figure 3
H), the cross-correlations values was significantly superior in the Dl1 period compared to Ps and Dl3 (p < 0.01, Tukey HSD post-hoc) and also, significantly superior in the Dl2 period compared to Dl3 (p < 0.05). For the sagittal pairs, a weaker effect was observed (Figure 3
G, Dl2 vs. Dl3, Tukey HSD post-hoc, p = 0.096). Overall, for both animals, (1) sagittally oriented pairs provided the greatest synchronization; (2) rest and passive expectancy did not show increased synchronization across the delays, both in sagittal and coronal (no statistical difference, Tukey HSD post-hoc); but (3) in active expectancy, a dynamic evolution of synchronization was observed during the task, strongly for coronal pairs: it increased from Ps to Dl1 then remained identical between Dl1 and Dl2, to decrease between Dl2 and Dl3.
The results show that, while the sagittal synchronization bias remains when the animals are in-task in comparison to rest, the task-related synchronization between LFPs shows a dynamic increase in LFP synchronization during active expectancy. This effect is especially noticeable for distant sites in the coronal plane, in view of their weaker LFP synchronization at the beginning of the task period.
We found anisotropy in the GCL synchronization patterns at rest, and dynamic changes during an active expectancy lever-press task. This network synchronization could represent a mechanism to define task-related network activity in the cerebellar cortex, complementing the dynamic task-related organization of the Purkinje cell complex spikes (Welsh et al., 1995
), and simple spikes patterns (Heck et al., 2007
).
Oscillation and Synchronization at Rest
One of our main results was the high synchronization in pairs of sagittal GCL LFPs. This mirrors the sagittal bands found in the optical imaging signal following climbing fiber stimulation (Brown and Ariel, 2009
; Gao et al., 2003
; Rockni et al., 2007
). However, what could be GCL-specific variables that could affect this synchronization pattern? Local circuit properties and afferent input patterns within the GCL could interact in creating this basic anisotropy. Considering initially intrinsic mechanisms, a first element of rhythmicity would be local circuit interaction through granule cell-Golgi cell loops. This putative oscillator comprises the necessary active elements: First, mossy fiber afferents contact both granule and Golgi cells, leading to feedforward and feedback loops (Llinás et al., 2004
). Second, Golgi cells connect each granule cell with three to four inhibitory synapses through both the parallel fibers and the granule cell dendritic ending (Hámori and Somogyi, 1983
; Jakab and Hámori, 1988
). Last, Golgi cell dendrites obey a sagittal zonation (Sillitoe et al., 2008
), and influence GCL discharge sagittally (Barmack and Yakhnitsa, 2008
). These characteristics of Golgi cell connectivity within granule cell layer suggest how these neurons could play a substantial role both in generating beta oscillations and sagittal synchronization (for a review, see D’Angelo, 2008
). Indeed, in realistic cerebellar network modeling, granule cells can generate a variety of temporal dynamics under inhibitory control of Golgi cells (Medina and Mauk, 2000
), especially within the 10–50 Hz band (Maex and De Schutter, 1998
, 2005
). In addition, combining experiments and modeling, Dugué et al. (2009)
show that gap-junction among Golgi cells play an important role in low-frequency oscillations (5–30 Hz) and resonance in the GCL. Cellular properties to resonance at targeted frequencies is seen within the GCL, in both granule cells (D’Angelo et al., 2001
) and Golgi cells (Solinas et al., 2007
). Taken together, these local circuits combined with the afferent input could bring the GCL to generate or at least maintain oscillatory activity, and have a preference for the sagittal orientation.
Additionally, extracerebellar influences could contribute to the sagittal basic rhythmicity. Afferents to the GCL, the mossy fiber input, terminate antero-posteriorly along the cerebellar cortex folia (Heckroth and Eisenman, 1988
; Scheibel, 1977
). Mossy fiber input coming from spino-cerebellar or cerebro-cerebellar sources could potentially influence the circuitry (Voogd and Glickstein, 1998
). On the one hand, the influence could be rhythmic itself, and dictate the internal rhythm; however, we have shown that under rest conditions, rhythms in certain cerebral areas are not optimally synchronous with rhythms in the paramedian lobule GCL (Courtemanche and Lamarre, 2005
), so the influence is not direct. On the other hand, as Dugué et al. (2009)
have shown, the Golgi cell oscillations in vitro are aided by a general increase in excitability; in the context of whole systems, such an increase could certainly be triggered via an input external to the GCL. However, this also shows that the external input does not specifically need to be a phasic rhythm to entrain the Golgi cells. An external tonic drive could be sufficient in triggering the local circuit to become oscillatory.
Oscillation and Synchronization in Active Expectancy
Our second result in qualifying the LFP synchronization anisotropy was the increased LFP synchronization during active expectancy, more evident in the coronal pairs. This was different from passive expectancy and rest, and even though oscillations were sometimes present in rest and often present in passive expectancy (Courtemanche et al., 2002
), these condition did not produce a steady increase in LFP synchronization. Thus, the mere fact that oscillations are present does not predict synchronization: however, when they are present, this does appear to facilitate synchronization (Buzsaki, 2006
; Schnitzler and Gross, 2005
).
With our setup, it would have been difficult to descend more than two electrodes in the monkey cerebellar cortex in vivo because it is so deep. Elements such as electrode holder strength and intracranial pressure were a consideration. However, given our results, the increased coronal LFP synchronization could possibly mean an expansion of the initial sagittal zones of GCL LFP synchronization. An intracerebellar mechanism for the coronal expansion could depend on parallel fibers, which course as much as 6 mm wide (Brand et al., 1976
). Such a mechanism is reminiscent of the well-known cerebellar cortex beams (Eccles et al., 1967
), shown during stimulation of the parallel fibers at the surface of the cerebellar cortex (Brown and Ariel, 2009
; Gao et al., 2003
; Qiu et al., 2008
; Rockni et al., 2007
). These parallel fibers contact Golgi cells, which can show coherent discharge along a transverse orientation (Volny-Luraghi et al., 2002
). and their activity recorded in vivo shows ‘loose synchrony’ over hundreds of micrometers along the transverse axis (Maex et al., 2000
; Volny-Luraghi et al., 2002
; Vos et al., 1999
). Our synchronization increase in the coronal orientation could be due to parallel fiber–mediated changes in connectivity, in the same way that beams of activity could unite parallel parasagittal modules (Rockni et al., 2008
).
Additionally, the Lugaro cells could also sustain increased coronal synchrony, with axons that courses both coronally and sagittally (Lainé and Axelrad, 1996
), potentially influencing GCL LFPs via an effect on Golgi cells and/or through an interaction with the serotonin afferent system (Dieudonné, 2001
). Finally, extracerebellar circuits could also increase LFP synchronization in the coronal plane. For rat GCL 7-Hz oscillations, Hartmann and Bower (1998)
found interhemispheric Crus IIa LFP synchronization, likely dependent on overall somatosensory circuit resonance. Synchronization variations we found here were within one hemisphere; interhemispheric relations in primate cerebellar GCL LFPs would have to be addressed.
The cerebellar multi-site LFP synchronization could highlight a functional process taking place. In addition to a contribution in preparation to action, there could be a direct role in the processing of task-related sensory information. In particular, the periods of increased synchronization in our task correspond to the time when the monkey’s hand was in contact with the lever, as shown by Courtemanche and Lamarre (2005)
. Indeed, the period from start of Dl1 to the end of Dl2 corresponds to when the monkey rests the fingers on the lever, waiting for the proper time to press. There could be a direct somatosensory role for linking two coronal sites, as GCL activity has a definite relation with somatosensory processing (Courtemanche and Lamarre, 2005
; Hartmann and Bower, 2001
). In fact, the coronal LFP synchronization extension is in accord with the results of Volny-Luraghi et al. (2002)
, who showed that Golgi cells are synchronized in a coronal (beam-like) fashion with controlled stimulation of the whiskers. The equivalent has been found in modeling of cerebellar circuits: oscillatory activity in modeled GCL circuits can indeed serve to synchronize distinct patches of GCL (Franck et al., 2001
). In this aspect, whether or not the LFP oscillations themselves carry any identifiable information, they can certainly contribute in bringing distant cerebellar sites together, relating together contextual information from distant sites (Nelson and Bower, 1990
).
The synchronization in the cerebellum could also serve to bring together cerebro-cerebellar elements more efficiently. As an example, both cerebellum and neocortex receive input from the somatosensory system. Interaction between these regions has been proposed to underpin the correct selection and execution of motor commands. Population rhythms, especially in beta (15–30 Hz) and gamma (30–80 Hz) oscillations, common to these structures, could act as a common spatiotemporal code within which these cerebro-cerebellar interactions may occur (Salenius and Hari, 2003
; Schnitzler and Gross, 2005
). Indeed, cerebral cortex (mainly primary somatosensory, but also primary motor) and cerebellar cortex LFPs synchronize during the same active expectancy task described here (Courtemanche and Lamarre, 2005
). In addition, during performance of a precision grip task in monkeys, Soteropoulos and Baker (2006)
observed significant coherence between deep cerebellar nuclei units and primary motor cortex LFP oscillations bilaterally, at approximately 10–40 Hz. So, the increased coronal GCL LFP synchronization observed in our task, by extending the parts of cerebellum that potentially interact with networks in the sensorimotor cerebral cortex, could have functional importance in sensorimotor processing.
Experimental Limitations
Certain elements limit the interpretation of our results: (1) our electrodes were aligned relative to the stereotaxic sagittal plane (parallel or orthogonal), which could be misaligned with the mossy or Golgi ‘sagittal’ orientation, mainly when more lateral; however, such an error was minimized by our attempt at recording in the paramedian lobule proper. Our sagittal misalignment should be slight when within or close to the paramedian lobule (∼4–13° from sagittal, estimated from Ozol and Hawkes, 1997
). Also, (2) our sagittal and coronal intra-pair distance (3 and 6 mm) might have covered more than one lobule. These distances were bound by our electrode carrier, which had the rigidity needed to go deep to the paramedian lobule (Courtemanche et al., 2002
). Interestingly, in Figure 2
D, LFP synchronization was more related to lateral than total distance, even if the latter could definitely influence lobule crossings; this provides support for a medio-lateral anisotropy. Additionally, our synchronization at the 3 mm lateral distance was lower than for the 6 mm distance (even if in different monkeys), the 3 mm distance certainly could have recorded sites within one lobule.
Cerebellar Cortex Modularity
Our results complement electrophysiological and anatomical evidence for basic parasagittal modularity, such as in Purkinje cell complex spike synchrony patterns (Lang et al., 1999
), and defined chemoarchitectonically and with molecular markers (Herrup and Kuemerle, 1997
; Voogd and Glickstein, 1998
). These bands are present across cerebellar cortex layers, including the posterior lobe GCL (Ozol and Hawkes, 1997
), and are on the order of 0.5 mm wide in the primate (Hess and Voogd, 1986
; Leclerc et al., 1990
). These bands appear to represent a processing unit, as GCL-Purkinje cell relations seem to obey a privileged vertical organization (Lu et al., 2005
). At rest, our GCL LFP pairs showed a good correlation for separations in the mm range: the difference could be due to the averaging nature of the LFP signal. During active expectancy, the increased coronal synchronization we found is in line with evidence where Purkinje cell simple spikes synchrony favors the coronal (beam-like) orientation during movement (Heck et al., 2007
). As oscillatory phenomena would likely determine cerebellar cortex patterns of activity in vivo (de Solages et al., 2008
; de Zeeuw et al., 2008
), our results show a dynamic GCL anisotropy which is related to sensorimotor performance. Thus, part of the basic functional modularity in the cerebellar cortex, e.g., microzones (Apps and Garwicz, 2005
; Oscarsson, 1979
), could be shaped by the GCL activity patterns, but in a dynamic fashion.
The authors declare that the research was conducted in the absence of any commercial or financial relationships that could be construed as a potential conflict of interest.
We gratefully thank Marie-Thérèse Parent, Michelle Yeates, Christian Valiquette, and Gaétan Richard for technical work; Elaine Chapman, Trevor Drew, Allan Smith, and Jean-Pierre Pellerin for help and discussions.
This project was supported by grants from the Canadian Institute for Health Research, Fonds pour les Chercheurs et l’Aide à la Recherche (Québec), and the National Alliance for Autism Research (USA) to YL. The work was also supported by fellowships and grants from the Natural Sciences and Engineering Research Council of Canada, the Fonds de Recherche en Santé du Québec-FCAR-Santé, and the National Alliance for Autism Research/Autism Speaks (USA) to RC.