Reducing Emissions From Degraded Floodplain Wetlands
 Katy E. Limpert
 Paul E. Carnell
 Stacey M. Trevathan-Tackett
 Peter I. Macreadie
- School of Life and Environmental Sciences, Centre for Integrative Ecology, Deakin University, Burwood, VIC, Australia
Globally, freshwater wetlands are significant carbon sinks; however, altering a wetland’s hydrology can reduce its ability to sequester carbon and may lead to the release of previously stored soil carbon. Rehabilitating a wetland’s water table has the potential to restore the natural process of wetland soil carbon sequestration and storage. Further, little is known about the role of microbial communities that mediate carbon cycling during wetland rehabilitation practices. Here, we examined the carbon emissions and microbial community diversity during a wetland rehabilitation process known as “environmental watering” (rewetting) in an Australian, semi-arid freshwater floodplain wetland. By monitoring carbon dioxide (CO2) and methane (CH4) emissions during dry and wet phases of an environmental watering event, we determined that adding water to a degraded semi-arid floodplain wetland reduces carbon emissions by 28–84%. The watering event increased anoxic levels and plant growth in the aquatic zone of the wetland, which may correlate with lower carbon emissions during and after environmental watering due to lower anaerobic microbial decomposition processes and higher CO2 sequestration by vegetation. During the watering event, areas with higher inundation had lower CO2 emissions (5.15 ± 2.50 g CO2 m–2 day–1) compared to fringe areas surrounding the wetland (11.89 ± 4.25 g CO2 m–2 day–1). CH4 flux was inversely correlated with CO2 emissions during inundation periods, showing a 38% (0.013 ± 0.061 g CO2-e m–2 day–1) increase when water was present in the wetland. During the dry phases of environmental watering, there was CH4 uptake within the fringe and aquatic zones (−0.013 ± 0.063 g CO2-e m–2 day–1). A clear succession of soil microbial community was observed during the dry-wet phases of the environmental watering process. This suggests that wetland hydrology plays a large role in the microbial community structure of these wetland ecosystems, and is consequently linked to CO2 and CH4 emissions. Overall, the total carbon emissions (CO2 + CH4) were reduced within the wetland during and after the environmental watering event, due to increasing vegetative growth and subsequent CO2 sequestration. We, therefore, recommend environmental watering practices in this degraded arid wetland ecosystem to improve conditions for wetland carbon sequestration and storage. Further use of this management practice may improve wetland carbon storage across other arid freshwater wetland ecosystems with similar hydrologic regimes.
Introduction
Freshwater wetlands are highly productive environments that supply a number of ecosystem services (Strayer and Dudgeon, 2010) such as: nutrient cycling, improving water quality, regulating floods, providing wildlife habitat, and improving plant and animal biodiversity (Mitra et al., 2005; Bernal and Mitsch, 2012). Freshwater wetlands play an essential role in mitigating climate change by sequestering carbon through wetland plant photosynthesis and storing carbon by accumulating organic matter in plant biomass, sediments, and soil (Cole et al., 2007; Lal, 2009; Kayranli et al., 2010). Despite their small terrestrial global surface area of 6–9%, freshwater wetlands contain up to 33% of the world’s soil carbon, capturing 1.9–2.2 Gt C year–1 (Cole et al., 2007; Limpens et al., 2008; Nahlik and Fennessy, 2016).
In the past few decades, rising temperatures, resulting from anthropogenic carbon emissions, have increased government and industry interest in the ability of freshwater wetlands to sequester and store organic carbon (Bernal and Mitsch, 2012). Quantifying freshwater wetland carbon dynamics is a complex process, with different conditions allowing for variation in carbon storage and release. In general, wetland ecosystems show accelerated plant growth and slower decomposition rates compared to terrestrial ecosystems, both of which facilitate carbon storage (Sun and Liu, 2007). However, anaerobic wetland conditions have the potential to increase methane (CH4) emissions, a potent greenhouse gas that has a radiative forcing 87 times higher than carbon dioxide (CO2) over a 20 year time-scale (Neubauer and Megonigal, 2015). Despite this, many freshwater wetlands are typically net annual carbon sinks (Kayranli et al., 2010). The balance between wetland carbon sinks and sources can be attributed to several processes and pathways (Figure 1). Wetland soil carbon cycling is influenced by (1) inundated soils that limit oxygen (O2) diffusion into sediment, (2) anaerobic conditions caused by higher water levels reducing decomposition rates compared to aerobic soils, and (3) the relative reduction in remineralization, providing wetlands with the potential to store large amounts of soil organic carbon (Kayranli et al., 2010; Figure 1).
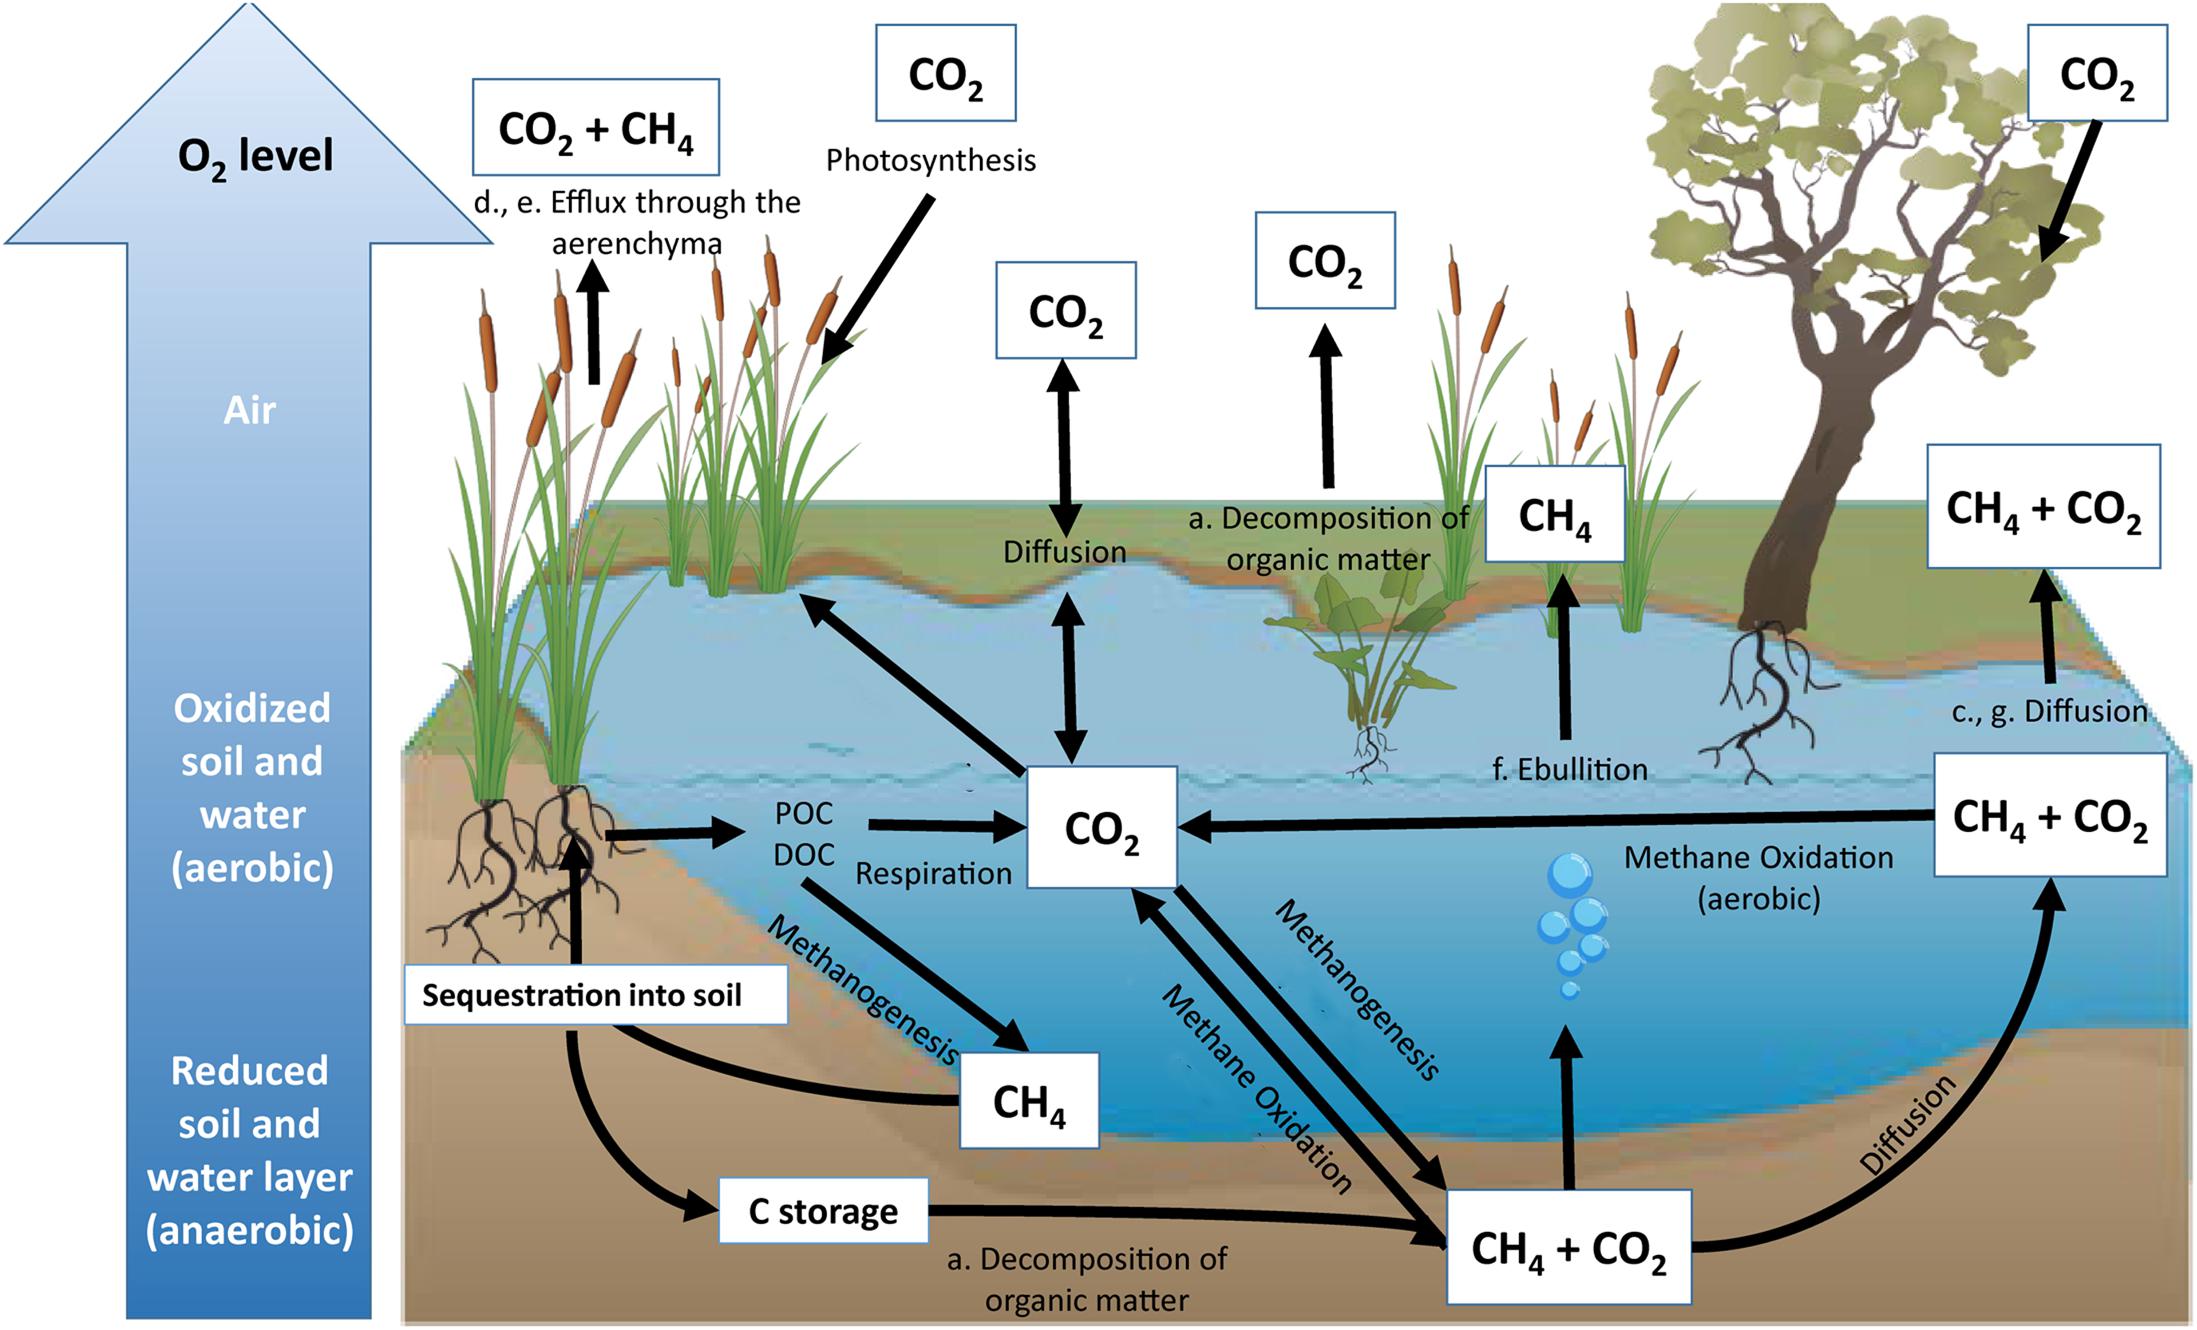
Figure 1. Representation of the inland wetland carbon cycle. Major pathways of carbon sequestration include photosynthesis and organic carbon accumulation through particulate organic carbon (POC) and dissolved organic carbon (DOC). Major pathways of CO2 emissions include respiration during decomposition of organic matter (a), oxidation of CH4 (b), diffusion (c), and release of greenhouse gases through plant aerenchyma (d). Major pathways of CH4 emissions include methanogenesis via efflux through plant aerenchyma (e), ebullition (f), and diffusion (g). All sequestered carbon has the potential to be stored within the soil profile for centuries (Bernal and Mitsch, 2012) unless the wetland is altered.
Variable inundation conditions resulting from changing water levels can create aerobic and anaerobic zones that allow for soil carbon to be remineralized by various microbial processes that determine carbon storage and release (Olefeldt et al., 2017). For instance, microbial and vegetative respiration, as well as CH4 oxidation, occur within aerobic zones, while methanogenesis and fermentation occur under anaerobic conditions (Nahlik and Mitsch, 2011; Figure 1). Aerobic soil conditions are more predominant during dry or lower water level periods. A lower water table favors aerobic respiration while creating conditions that increase the availability of fresh, and often labile, organic matter (Yarwood, 2018). The result of these conditions is the promotion of rapid microbial decomposition of plant litter (Rasilo et al., 2017; Yarwood, 2018). During periods of inundation and predominantly anaerobic soil conditions, methanogenesis is a key biogeochemical pathway for carbon remineralization and therefore a source of CH4 production in many freshwater wetlands (Kayranli et al., 2010).
Hydrological changes, particularly alterations in water table level in freshwater wetlands, influence carbon emissions by altering oxidation and reduction processes. The availability of alternative electron acceptors, such as nitrate, manganese, iron, and sulfate, causes competition between methanogens and other microbes (i.e., denitrifying and sulfate reducing bacteria) for organic substrates within wetland ecosystems (Boon et al., 1997; Ettwig et al., 2010; Zhu et al., 2012). The production of CO2 and CH4 is therefore affected by redox reactions driven by water level. For instance, anaerobic oxidation of CH4 (which is often coupled to SO4 and NO3 reduction) within inundated wetlands has been documented to consume potential CH4 emissions by over 50% (Segarra et al., 2015).
The frequency of fluctuating moisture content within soils has been documented to cause a significant increase of microbial respiration (i.e., the “Birch Effect”; McComb and Qiu, 1998; Wilson and Baldwin, 2008). The mechanisms that alter microbial activity during wetting and drying cycles involve microbial stress and variation in substrate availability for microbial respiration (Xiang et al., 2008). Within dry soils, specifically during prolonged drought conditions, microbes retain high concentrations of solutes to help store water within the cell as a means to prevent dehydration (Schimel et al., 2007). When water enters the system, stored solutes are released from the cell, leading to rapid metabolism of microbial compounds (Halverson et al., 2000; Schimel, 2007). In addition, the physical process of wetland rewetting leads to the redistribution of organic matter (that was previously unavailable) to increase microbial breakdown within the wetland soil profile (Denef et al., 2001; Miller et al., 2005; Cosentino et al., 2006).
Understanding the biogeochemical cycling of wetland ecosystems during various stages of inundation is imperative to inform carbon management in wetland ecosystems. The scenario represented in Figure 1 assumes little to no alteration to wetland ecosystems; however, on a global scale, 50% of wetland ecosystems have been lost since the 1900s due to land-use changes, agricultural impacts, and hydrologic alterations (Davidson, 2014). Human activity and development continue to have detrimental impacts to carbon storage and often revert wetland ecosystems from sinks into carbon sources (Nahlik and Fennessy, 2016; Hemes et al., 2018). Altering wetland soil conditions has the potential to release significant amounts of soil organic carbon that was previously stored within the wetland soil profile (Lal, 2007; Page and Dalal, 2011). Manipulating water levels, such as creating dams and reservoirs, has contributed to 12% of global CH4 emissions (St. Louis et al., 2000; Figure 1).
The increasing demand for global carbon markets has the Australian government, industry, and research groups considering the incentive potential of rehabilitating freshwater ecosystems for carbon sequestration, storage, and emission reduction. While wetland carbon stocks and sequestration rates are relatively well understood in semi-arid regions of Victoria, Australia (Carnell et al., 2018; Pearse et al., 2018), there is no data on carbon fluxes and the corresponding microbial communities that are responsible for carbon release during rehabilitation practices. To maintain environmental benefits such as increased carbon storage and reduced carbon emissions, further research is required to understand how rehabilitation through environmental watering alters floodplain carbon dynamics. Allocating water in an effort to recreate the natural inundation regime of wetland ecosystems for improving biodiversity and wetland functionality is expensive. According to the National Water Commission (2008), the Australian government allocated $50 million in purchasing 35 GL of water access entitlements at $1131 per ML. Under the Australian emission reduction fund, the average price per ton of carbon is $11.90 (Clarke et al., 2014). Due to the high costs of water rights, determining whether environmental watering can reduce carbon emissions, and by doing so, help pay for the cost of rewetting, would be beneficial to the parties involved in environmental watering management practice. The aim of this study was to determine (1) the magnitude of CO2 and CH4 diffusive fluxes from an environmental watering management event and (2) the microbial communities that are potentially responsible for carbon fluxes within a degraded floodplain wetland. The microbial community succession was measured during the watering event to better understand shifts in bacterial and archaeal community diversity and structure while simultaneously measuring CO2 and CH4 fluxes. We hypothesized that adding water to this wetland would increase anaerobic microbial respiration and subsequent CH4 emissions during inundation, while reducing aerobic bacterial communities and CO2 emissions. The outcomes of this research will provide additional guidance as to whether rehabilitation through environmental watering can maximize carbon offset opportunities, or whether this process promotes carbon emissions in semi-arid floodplain ecosystems.
Materials and Methods
Climate
Semi-arid and arid bioregions encompass 70% of the Australian landscape (Byrne, 2008; Figure 2), with our study site, Duck Creek North, located in the semi-arid bioregion (Figure 2A). The climate of the study area is typical of semi-arid environments, with hot dry summers, cold arid winters, and decreased precipitation over summer (Bsk-Köppen Climate Classification; Peel et al., 2007). The long-term mean annual precipitation in the area is approximately 364.5 mm and the mean annual temperature is 22.9°C (measured at the nearby town, Kerang: 35.72°S, 143.91°E, Bureau of Meteorology [BOM], 2017). Precipitation is higher in the winter and spring months from May to October (32.1 mm month–1, Bureau of Meteorology [BOM], 2017) compared to summer and autumn months from November to April (17.5 mm month–1, Bureau of Meteorology [BOM], 2017).
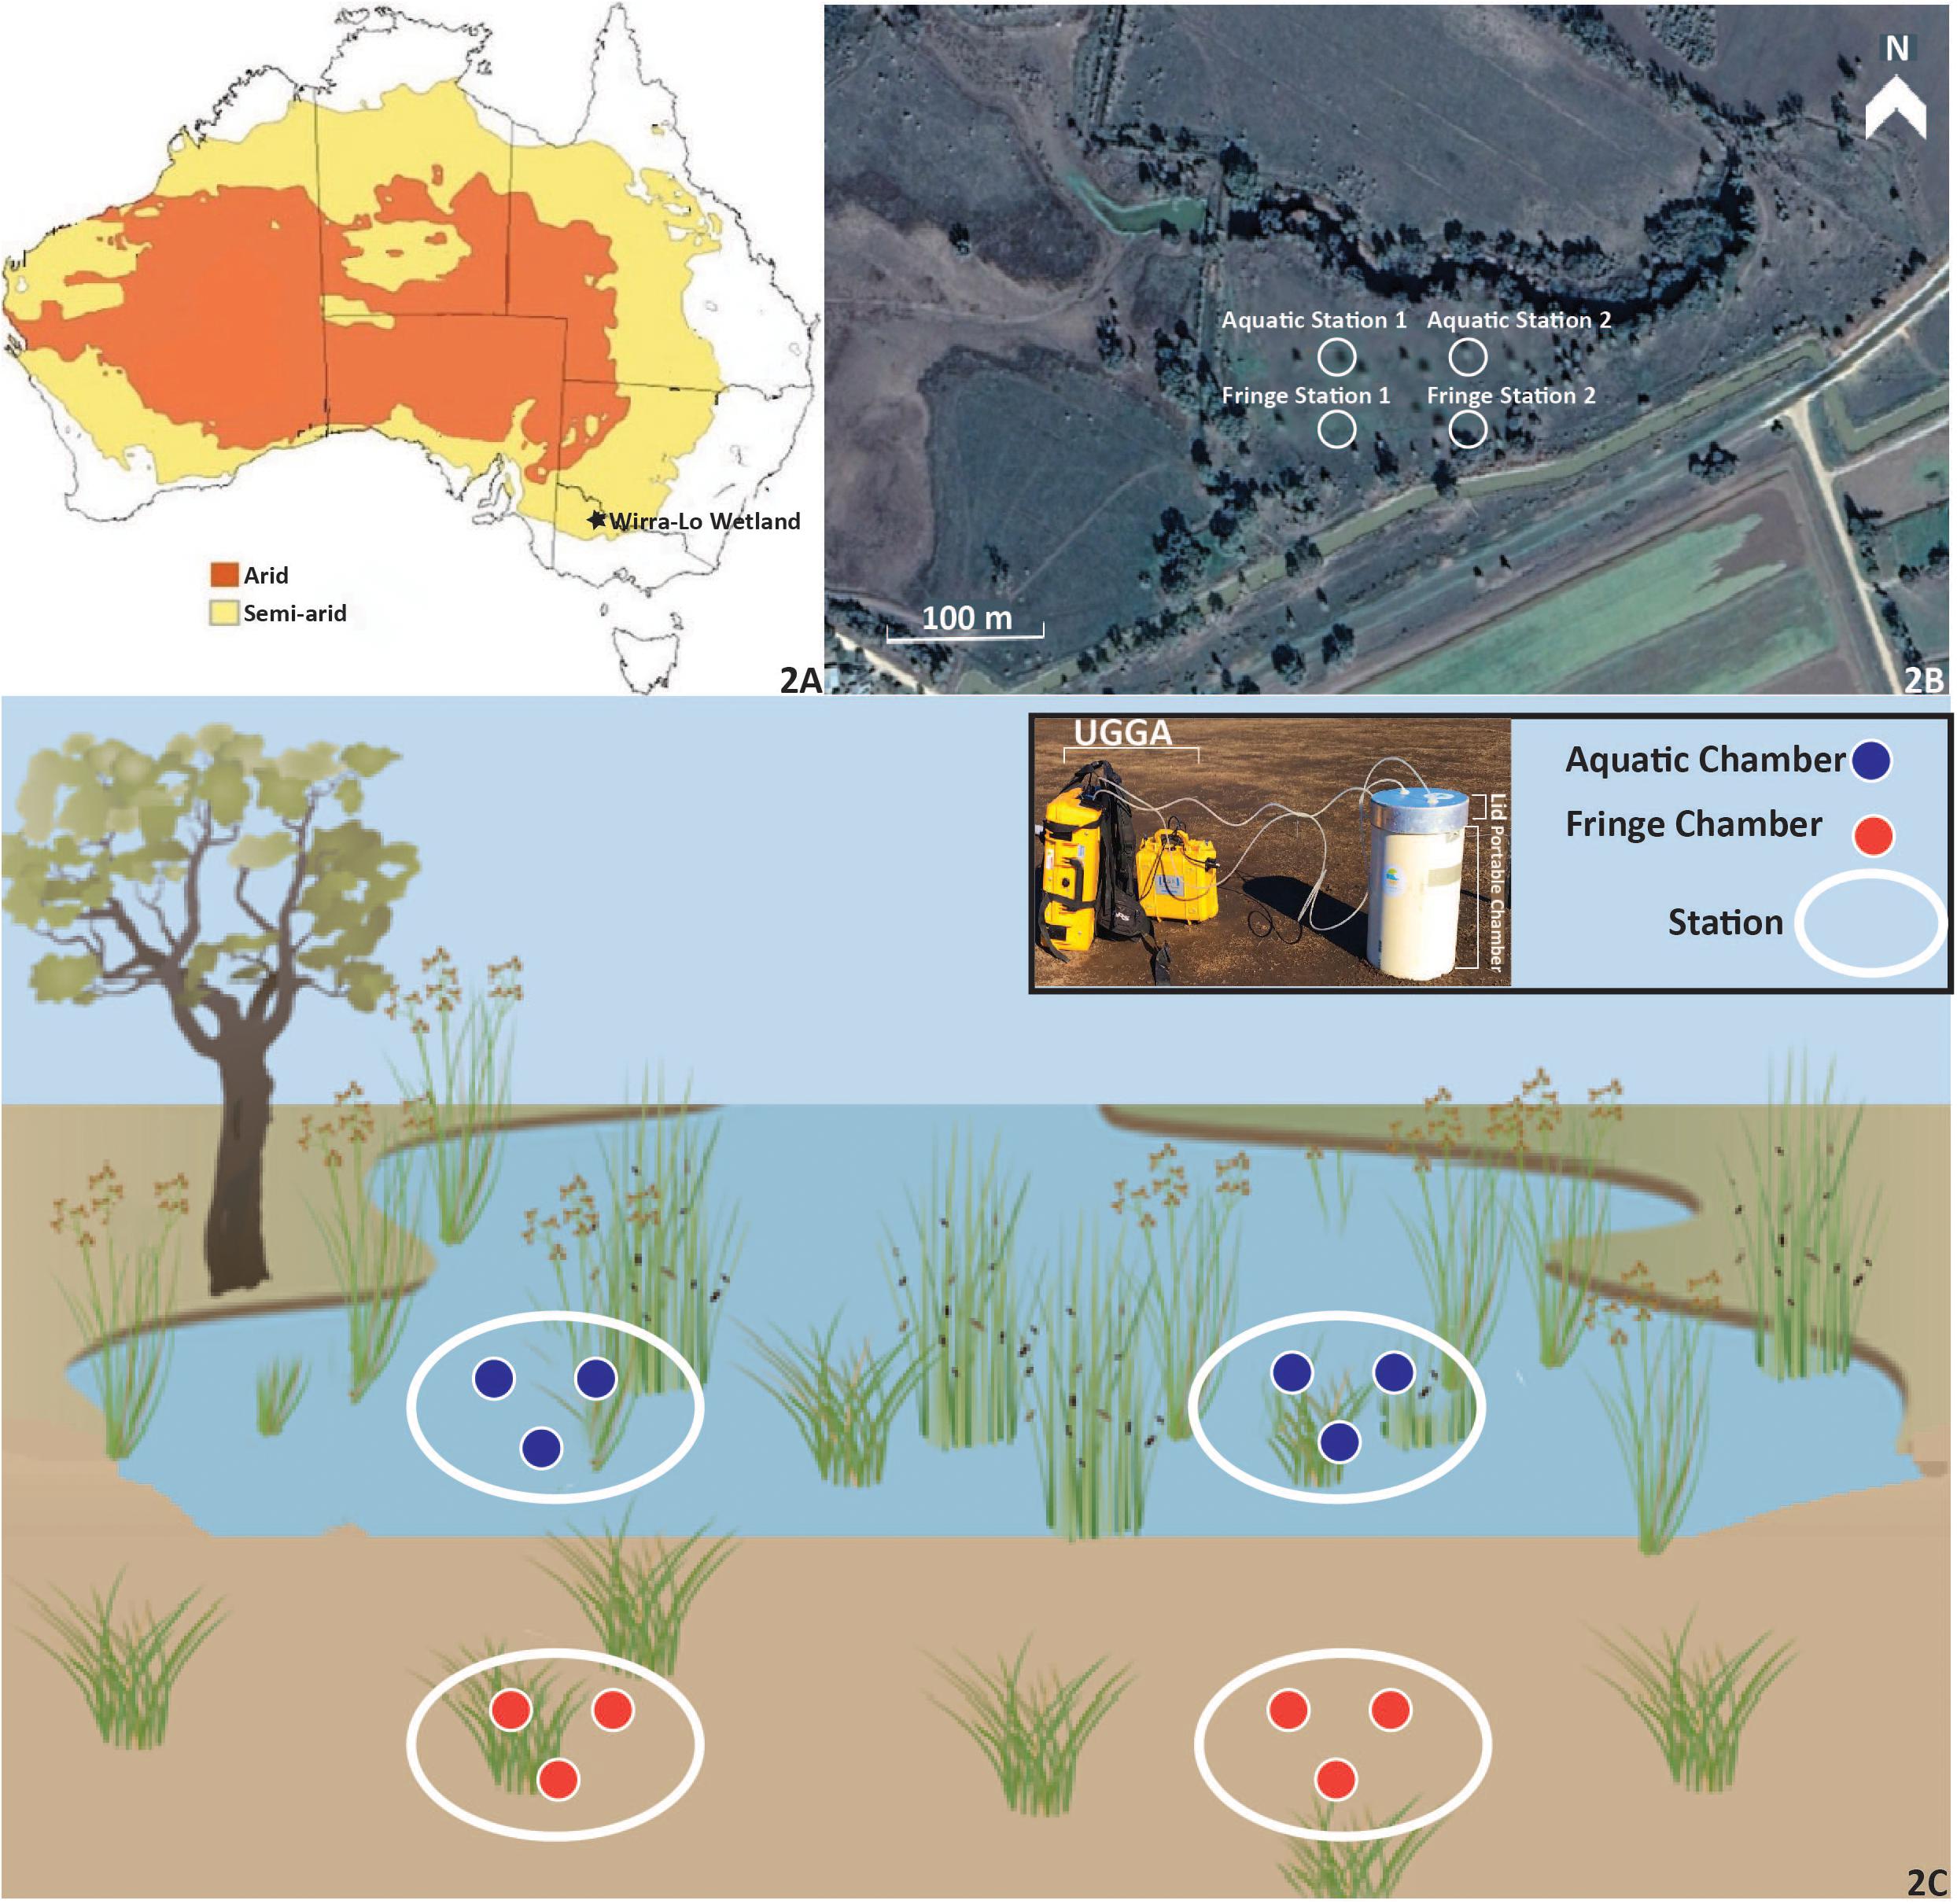
Figure 2. The Wirra-lo wetland complex located in the semi-arid climate of North Central Victoria, Australia (−35.503353, 143.873565). Arid and semi-arid regions of Australia (A) are low in annual precipitation (100–500 mm year–1) and experience high evaporation. Duck Creek North (B), a semi-arid floodplain wetland, was measured for carbon emissions within this complex for an entire watering event. The Fringe Zone (samples taken in this zone are shown as orange circles on the edge of the wetland) and Aquatic Zone (samples taken in this zone are shown as blue circles in the inundated portion of the wetland) were identified using wetland delineation techniques (elevation and vegetation type; C). Two stations were placed within each zone for further carbon dynamic measurements. Within each of the stations that were nested within each zone, three portable closed-chambers (C) were used to measure carbon emissions at Pre, During, Post, and 1 Month phases of environmental watering. The design of each chamber, lid and UGGA used for carbon emission measurements can be seen in the legend of C. The water used for the environmental watering event was released from the surrounding irrigation channel. The location of the three chambers within each station can be seen in B and C. Aquatic Station 1 and 2 and their corresponding chambers were filled with water during the experiment, whereas station and chambers within Fringe Station 1 and 2 remained dry.
Duck Creek North
The wetland investigated in this study is the 3.0 ha semi-arid floodplain wetland Duck Creek North, located at the Wirra-Lo wetland complex (Figure 2; −35.503353, 143.873565). The geomorphology of this region is described as the Northern Riverine Plains (Conacher, 2002). The soil in Duck Creek North is composed of a gray silty clay called the Yando Clay, which extends from the soil surface to a depth of 60 m (North Central CMA Report, 2015). Antecedent soil conditions within Duck Creek North were documented to be low in nutrient availability and high in clay content. Total percent phosphorus was 0.008% and nitrogen levels within sub and topsoil were 0.088% (McKenzie et al., 2000; Supplementary Table S1). Soils were primarily clay content (62%) with lower silt and sand content (16 and 22%; Supplementary Table S1). Bulk density was 1.5 g cm–3 within the subsoil and 1.3 g cm–3 in the topsoil. pH levels were slightly basic in the subsoil (7.7) whereas topsoils were slightly acidic (6.6; McKenzie et al., 2000). Encompassing the Wirra-Lo wetland complex are levees intended for crop irrigation and maintaining flood control. During environmental watering events, these levees are opened to allow water into the Wirra-Lo wetland complex. The water for these levees is sourced from the Loddon River.
Prior to European settlement, Duck Creek North would have been regularly inundated due to the close proximity of this wetland to three major waterways (Barr Creek, Loddon River, and Murray River floodplain; Camp Scott Furphy Pty Ltd, 1985; SKM, 2005). In an assessment by the Rakali Ecological Consulting group in 2014, the water regime of the site would have varied between being intermittent and seasonal (Cook, 2014).
Duck Creek North and the surrounding area has been significantly modified since European settlement. The catchment was altered for irrigation; levee banks and roads have disturbed natural flow paths throughout the catchment area (North Central CMA Report, 2015). Artificial levee banks along the major waterways have completely disconnected the complex from flood sources, thus leaving Duck Creek North to only receive flood water in very large (one in 20–50 years) flooding events (North Central CMA Report, 2015). As such, the wetland complex is now largely reliant on the provision of water through the local irrigation system infrastructure (North Central CMA Report, 2015). Duck Creek North received irrigation water and winter precipitation runoff from irrigated pastures within the property as well as from surrounding farms (North Central CMA Report, 2015). By 2006–07, water allocations were significantly reduced and the wetland complex did not receive water until extensive flooding that occurred in January 2011 (North Central CMA Report, 2015). In 2015, a partial watering event (amount of water added was not specified) was implemented in autumn to provide water for stressed river redgum (Eucalyptus camaldulensis) trees and aquatic vegetation (North Central CMA Report, 2015). In 2017, from 28 to 30 September, a spring environmental watering event (this study) occurred within Duck Creek North to increase habitat for the growling grass frog (Litoria raniformis). Due to the alteration of Duck Creek North’s topology by the construction of the surrounding levees, the system is now lotic and has been documented to drain water into the adjacent creek bed within weeks to a couple of months (North Central CMA Report, 2015; observations in the field).
Environmental Watering Measurements
Environmental water from these levees was added to Duck Creek North over 4 days at 10 ML day–1. All measurements occurred during four phases of environmental watering: 2 days of Pre environmental watering, 4 days During environmental watering, 2 days after watering ceased (Post environmental watering), and 2 days after a month from the initial watering date (1 Month). The “Pre” environmental watering (dry) phase measurements were taken before water was released into the wetland. The “During” environmental watering (wetting) phase was identified by the measurements taken while the levee was releasing water into the wetland and water levels were rising in the Aquatic Zone. The “Post” environmental watering (wet) phase was described as the time in which the levee was closed and water levels lowered in Duck Creek North. Finally, the “1 Month” (dry) phase measurements were taken a month after water had left Duck Creek North. During the watering event, dissolved oxygen (DO) measurements were taken using a Hach LDO101 Field Luminescent/Optical DO sensor.
Soil Carbon Analysis
Soil organic carbon content was collected from Duck Creek North before environmental watering and analyzed to determine how much soil organic carbon is currently stored within the wetland, how much soil carbon could potentially be released if further wetland degradation continued, and how this soil could be responsible for variation in fluxes and microbial communities between stations. At each of the four stations, two 4.5 cm (inner-diameter) metal soil cores were hammered into the soil using a petrol-powered corer until a depth of 1 m was reached.
In the laboratory, all soil cores were extruded and sectioned into 5 cm increments from 0 to 20 cm for soil carbon stock calculations. These depths were chosen as an accurate assessment for the amount of soil organic carbon stock and potential carbon flux from the wetland. Soil core samples were then dried at 50°C, measured for dry weight, and used to calculate soil bulk density. Each 5 cm section was then ground to ensure homogeneity of the soil sample using an RM200 Electric Mortar Grinder equipped with a stainless steel mortar and pestle. To determine total organic carbon content for the soil samples, elemental carbon analysis was performed using a EuroVector MicroElemental CN Analyzer. The CN analyzer was equipped with Callidus v.5.1 software. Carbon density (g cm–3) in the top 20 cm of soil was calculated by multiplying the proportion of organic carbon by the dry bulk density value.
CO2 and CH4 Flux Measurements
Measurements of CO2 and CH4 flux (release and uptake) were taken in situ using a Los Gatos ultra-portable greenhouse gas analyzer (UGGA) with a closed-collar dark chamber method (Figure 2; Van Huissteden et al., 2011; Musarika et al., 2017). The UGGA reports measurements of CO2 and CH4 using cavity enhanced absorption techniques (Baer et al., 2002; Gerardo-Nieto et al., 2019). Each chamber collar (30 cm diameter, 55 cm height, 35 L volume) was made of PVC coupled with a PVC lid. Each chamber was placed over an area with both wetland soil and vegetation to capture total wetland carbon fluxes (Oertel et al., 2016; Ma et al., 2018). Chambers were hammered into the ground (∼1–2 cm) to ensure a complete seal. To avoid altering environmental conditions (i.e., soil and vegetation disturbance) related to inserting the PVC chamber collar into the ground, chambers were installed by inserting them into the wetland soil several hours prior to the initial measurement and remaining in place for the duration of the experiment (Rochette et al., 2011). A small fan powered by a 12 V battery was placed inside the chamber lid for even air circulation. The PVC lid was connected to the UGGA by two transparent tubes; one taking air to the UGGA and the other delivering it back to the chamber, creating a closed loop. Concentrations of CH4 and CO2 were logged by the UGGA every 5 s during 5–10 min intervals on each chamber. The lid was removed when measurements were completed to allow for light and gas exchange to occur within the chamber similar, returning them to ambient environmental conditions (Rochette et al., 2011).
Flux measurements were taken in two zones: the Fringe and the Aquatic Zone (Figure 2). The Fringe Zone refers to the edge of the wetland, as identified by higher elevation gradients and a mix of terrestrial and aquatic vegetation. The Aquatic Zone refers to the area located in the lower elevation gradient of the wetland, dominated by aquatic vegetation such as rushes and sedges. Both the fringe and aquatic zones were dominated by graminoid species. A higher abundance of common wallaby grass (Austrodanthonia caespitosa) and Spiny Rush (Juncus acutus) were found in the aquatic zone whereas pasture grasses and Buckbush (Salsola tragus) were abundant in the fringe zone (identified by the Rakali Ecological Consulting group). These zones were chosen due to their influence on the amount and frequency of water received and proximity to terrestrial inputs, both of which may alter wetland carbon fluxes (Altor and Mitsch, 2008; Jimenez et al., 2012).
Two randomly selected stations were nested within each zone to test for spatial variability in response within the wetland. The Aquatic Zone included Aquatic Station 1 and Aquatic Station 2, and the Fringe Zone included Fringe Station 1 and Fringe Station 2. Each station consisted of three 35 L replicate chambers (n = 12; Figure 2). All measurements occurred during four phases of environmental watering: 2 days of Pre environmental watering, 4 days During environmental watering, 2 days after watering ceased (Post environmental watering), and a month from the Post environmental watering measurements (1 Month). Each day of CO2 and CH4 measurements comprised of two sampling times at each collar: once during the day (1–4 pm) and once during the night (3–6 am), to account for any gas flux variation due to light levels (Justine et al., 2015). At each chamber, CH4 and CO2 measurements were taken for 5–10 min each.
The regression lines representing carbon fluxes over time were accepted as carbon flux rates from the wetland when the r2 value was > 0.70 (Repo et al., 2007). Measurements exhibiting negative CO2 and CH4 fluxes represent a net uptake (or sequestration) of atmospheric carbon. To prevent a bias toward rapid flux rate measurements, slower flux rates from −0.001 to 0.001 g CH4 m–2 d–1 and −0.1 to 0.1 g CO2 m–2 d–1 were included in the dataset regardless of their r2 values. Within this range, r2 values were limited by the accuracy of the UGGA system and did not necessarily reflect the quality of the measurement (Repo et al., 2007).
CO2 and CH4 vary in radiative forcing, which can be represented in measurements of global warming potential (GWP). GWP is a conversion of CH4 emissions into CO2 equivalents (CO2-e) over a projected 20-year period (87 times CO2), 100-year period (32 times CO2), or a 500-year period (11 times CO2). GWP was recently used to calculate the gas pulse decay for global freshwater wetlands over 20 years, to determine whether these systems are net carbon sources or sinks (Neubauer and Megonigal, 2015). To allow for comparison, we also calculated CH4 flux using the radiative forcing of CO2-e over a 20-year period (multiplying CH4 emissions by 87).
Microbial DNA Extraction and Bioinformatics
A 60 mL syringe modified with surface (0–1 cm) and subsurface (3–4 cm) sampling ports was used to extract depth-specific soil microbial samples from each aquatic station during each phase, during both the day and night sampling periods (Figure 2). The two sampled soil depths (0–1 cm depth and 3–4 cm depth) were homogenized before microbial analysis. Soil microbes were sampled in close proximity (1–2 cm) to the flux collars, to ensure that the microbes accurately corresponded with the carbon emissions for that time period, but so that taking microbial samples themselves would not disturb the soil within the fixed collars. Two cores per aquatic station (two samples per core during the day and night sampling periods) were collected during each environmental watering phase [Pre (22/09/2017), During (28–29/09/2017), Post (01/10/2017), 1 Month (08/11/2017); n = 4 per phase]. Pre and 1 Month phases (Pre 1–4 and Mon 1–4) had no water in the wetland whereas During and Post phases (Dur 1–6 and Pos 1–3) were inundated. More samples were taken in the During phase (n = 6) as the presence of CH4 was detected after the initial During phase sampling period. Therefore, extra sampling ensured that bacteria producing CH4 were captured during this experiment. Samples were placed in vials, stabilized using 1 mL RNA later (Poulos, 2015), and kept cool until the vials could be stored at the laboratory at −80°C.
Due to cost and time constraints, one Aquatic Zone sample per phase of environmental watering was sequenced for identifying soil microbial community composition. A sample in the Post phase was unable to be sequenced (n = 3). Genomic DNA was extracted using the Qiagen DNasey PowerSoil kit. The extracted DNA was normalized to 5 ng μL–1 prior to performing triplicate PCRs (Caporaso et al., 2012). To ensure DNA extraction and PCR efficiency from each microbial sample, a Qubit fluorometer was used to determine the concentration of nucleic acids after performing each of these steps (Supplementary Table S2). Amplification of the 16S rRNA gene was preformed using the 515f–806r primers (Caporaso et al., 2012), with the modified forward primer (Parada et al., 2016). The PCR product was pooled then cleaned with the ZYMO DNA Clean and Concentrator Kit, with modified elution using 10 mM Tris buffer, prior to sequencing on the Illumina MiSeq at Deakin University, Burwood. 16S rRNA amplicon data processing techniques and diversity estimates were performed using the QIIME2 software (Bolyen et al., 2018), while using Divise Amplicon Denoising Algorithm (DADA2) for the bioinformatic analyses (Callahan et al., 2016). In QIIME 2, raw sequence reads went through the process of demultiplexing, sequence quality control, and merging paired-end reads. DADA2 was used to produce amplicon sequence variants (ASVs; Callahan et al., 2016). This algorithm was further used to perform quality control with chimera detection and elimination, remove sequence errors, singleton exclusion, as well as trimming sequences based on the per-base-pair sequence quality graphs (sequences 25-260 forward, 25-220 reverse). The sequences were then classified against the Greengenes database.
Statistical Analyses
Soil Carbon Stock and Emissions
The flux data from individual collars were analyzed using a repeated measures analysis of variance (ANOVA; IBM SPSS Inc, 2017). The effect of environmental watering on each day’s carbon emissions (CO2 and CH4) was analyzed by zone, station, and light (day/night) for interactions. To achieve homogeneity of variance among all categorical variables, soil carbon emissions underwent a log transformation prior to statistical analyses. Significance was evaluated at the 0.05 level, and the Bonferroni test was used for comparisons of means between variables. Relationships between each gas flux and environmental parameters, such as air temperature, DO, and water depth, were evaluated using Pearson correlation analyses (IBM SPSS Inc, 2017). A paired sample t-test was used to compare soil carbon stock between the Fringe and Aquatic Zones of the wetland ecosystem. When comparing means, a t-test adjusted for unequal variance was used when the assumption of equal variances was not satisfied, and the Mann–Whitney U-test was used when data were not normally distributed.
Microbial Communities
QIIME2 was used to calculate the alpha diversity indices (ASV richness, Shannon diversity, Faith’s phylogenetic diversity, and Pielou’s evenness) within each sample across each watering phase and between day/night measurements. A one-way ANOVA was used to compare each diversity indices for each soil sample within the aquatic zones. Varying microbial community structures were analyzed with the weighted UNIFRAC resemblance matrix using q2-diversity beta-group-significance across each phases, station, and between day/night cycles using a two-way (fixed factor) non-parametric permutational multivariate ANOVA (PERMANOVA; Supplementary Table S3). Unifrac data were also visualized with a non-metric multi-dimensional scaling (nMDS) plot. A Monte Carlo correction was used for any comparisons with low permutations (<200). SIMPER analyses were performed on the operational taxonomic units (OTUs, 62%) for any significant comparisons, to identify which OTUs were driving the significant differences.
Results and Discussion
Soil Carbon Density
Soil carbon density prior to watering showed no significant difference between the Aquatic Zone and the Fringe Zone (0.039 ± 0.020 g cm–3 p = 0.475, 0.038 ± 0.032 g cm–3; p = 0.259; Supplementary Table S4). This suggests that any potential differences in CO2 and CH4 fluxes were not due to the availability of organic carbon in the soil. These soil carbon density values are relatively low, but are in a similar range to those reported for comparable wetland types in semi-arid regions of south-eastern Australia (Carnell et al., 2018). To detect any impacts of environmental watering on soil carbon, we would expect it would take multiple years and multiple watering events, due to the low rates of soil accumulation in wetlands of the region (Carnell et al., 2018). Past studies suggest that further soil analysis [i.e., lead-210 (210Pb) dating to examine sediment accumulation rates) after multiple years of re-wetting may result in significantly higher soil carbon stock within aquatic areas of wetlands. For instance, soil carbon storage in experimental wetlands in Ohio, United States, increased by an average of 14% per year and doubled within the first 10 years, which correlated with increased hydrology and wetland vegetation growth (Bernal and Mitsch, 2013; Waletzko and Mitsch, 2013).
Environmental Watering Succession: Carbon Emissions and Microbial Communities
The impact of wetland drying-rewetting cycles on soil microbial activity, organic matter decomposition, and subsequent carbon emissions (CO2 and CH4) have been comprehensively examined (Cosentino et al., 2006; Batson et al., 2015; Nedrich and Burton, 2017). However, research pertaining to the environmental watering management plan in regard of improving degraded freshwater wetland ecosystems has had less attention. Various studies have found that water level fluctuation increases microbial activity and thus carbon emissions through microbial respiration (Fromin et al., 2010; Foulquier et al., 2013). Enhanced soil respiration caused by drying-rewetting cycles potentially releases soil aggregates that were previously unable to be accessed and decomposed by microbes (Moyano et al., 2013; Morillas et al., 2015). As a result, dry and rewetting cycles in freshwater wetlands have been noted to release carbon emissions, SO4 (sulfide oxidation), and PO4 (dissolution of iron phosphates) through organic matter decomposition (Venterink et al., 2002; Mikha et al., 2005; Muhr et al., 2010; Baldwin et al., 2013). In this study, we found that drying-rewetting cycles through an entire environmental watering event significantly altered microbial diversity, CO2 flux, and CH4 flux (Supplementary Tables S5, S6).
Pre Environmental Watering
The degraded wetland conditions of Duck Creek North during the Pre environmental watering phase proved to have the highest release of CO2 emissions and small levels of CH4 uptake. CO2 emissions fluctuated between 6.0 and 9.0 g CO2 m–2 day–1, while there was uptake of CH4 emissions ranging from −0.03 to −0.1 g CO2-e m–2 day–1 (Table 1). Prior to environmental watering, there were significantly higher CO2 emissions during the daylight hours compared to at night (Figure 3 and Supplementary Table S7). CH4 emissions were inversely correlated with CO2 emissions during this phase, showing CH4 emission uptake during the day and a net zero CH4 flux during the night, throughout each station and zone (Figure 3, Table 1, and Supplementary Table S7).
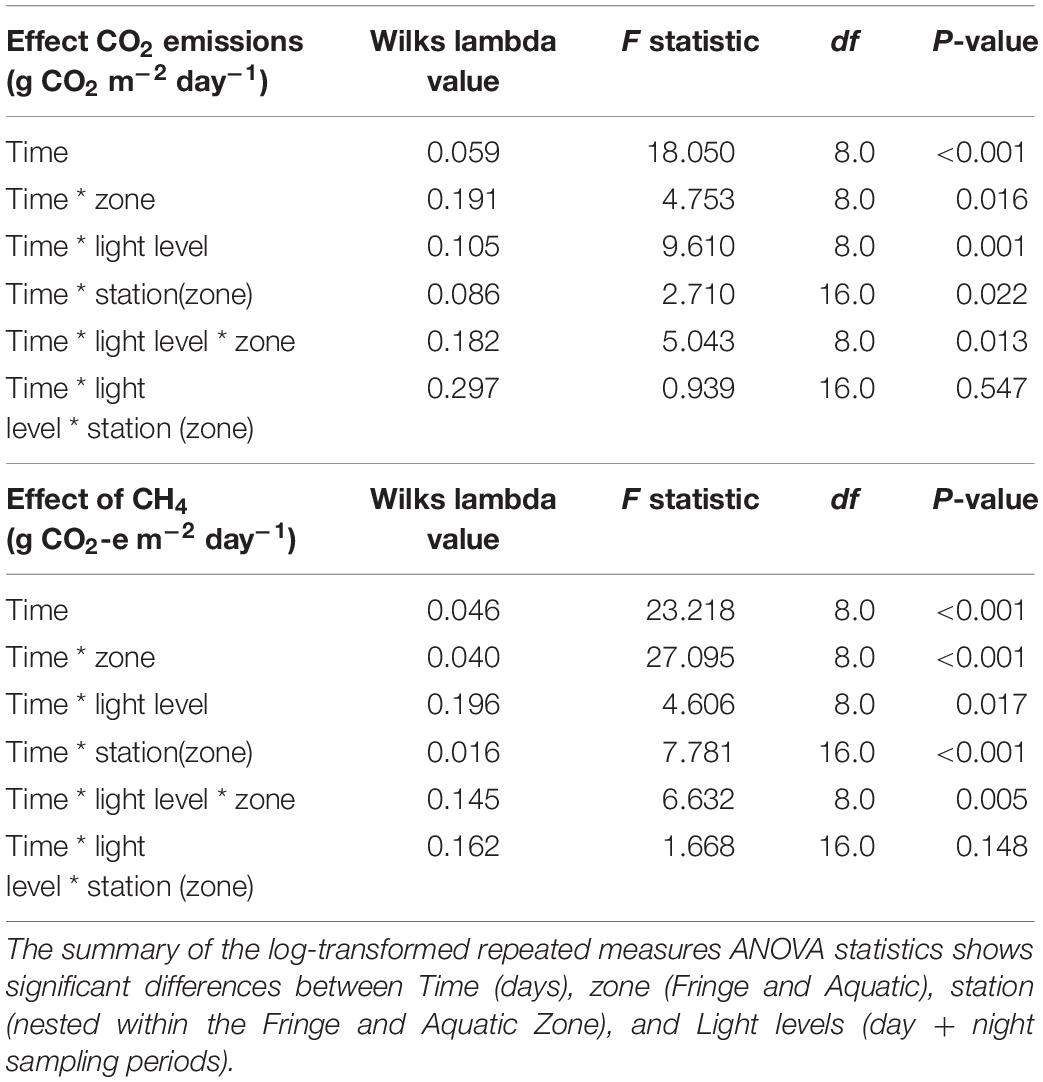
Table 1. Testing the influence of each main factor [zone, light level (day/night), station (zone)] and their interactions against each carbon emission (CO2 and CH4) across the environmental watering event.
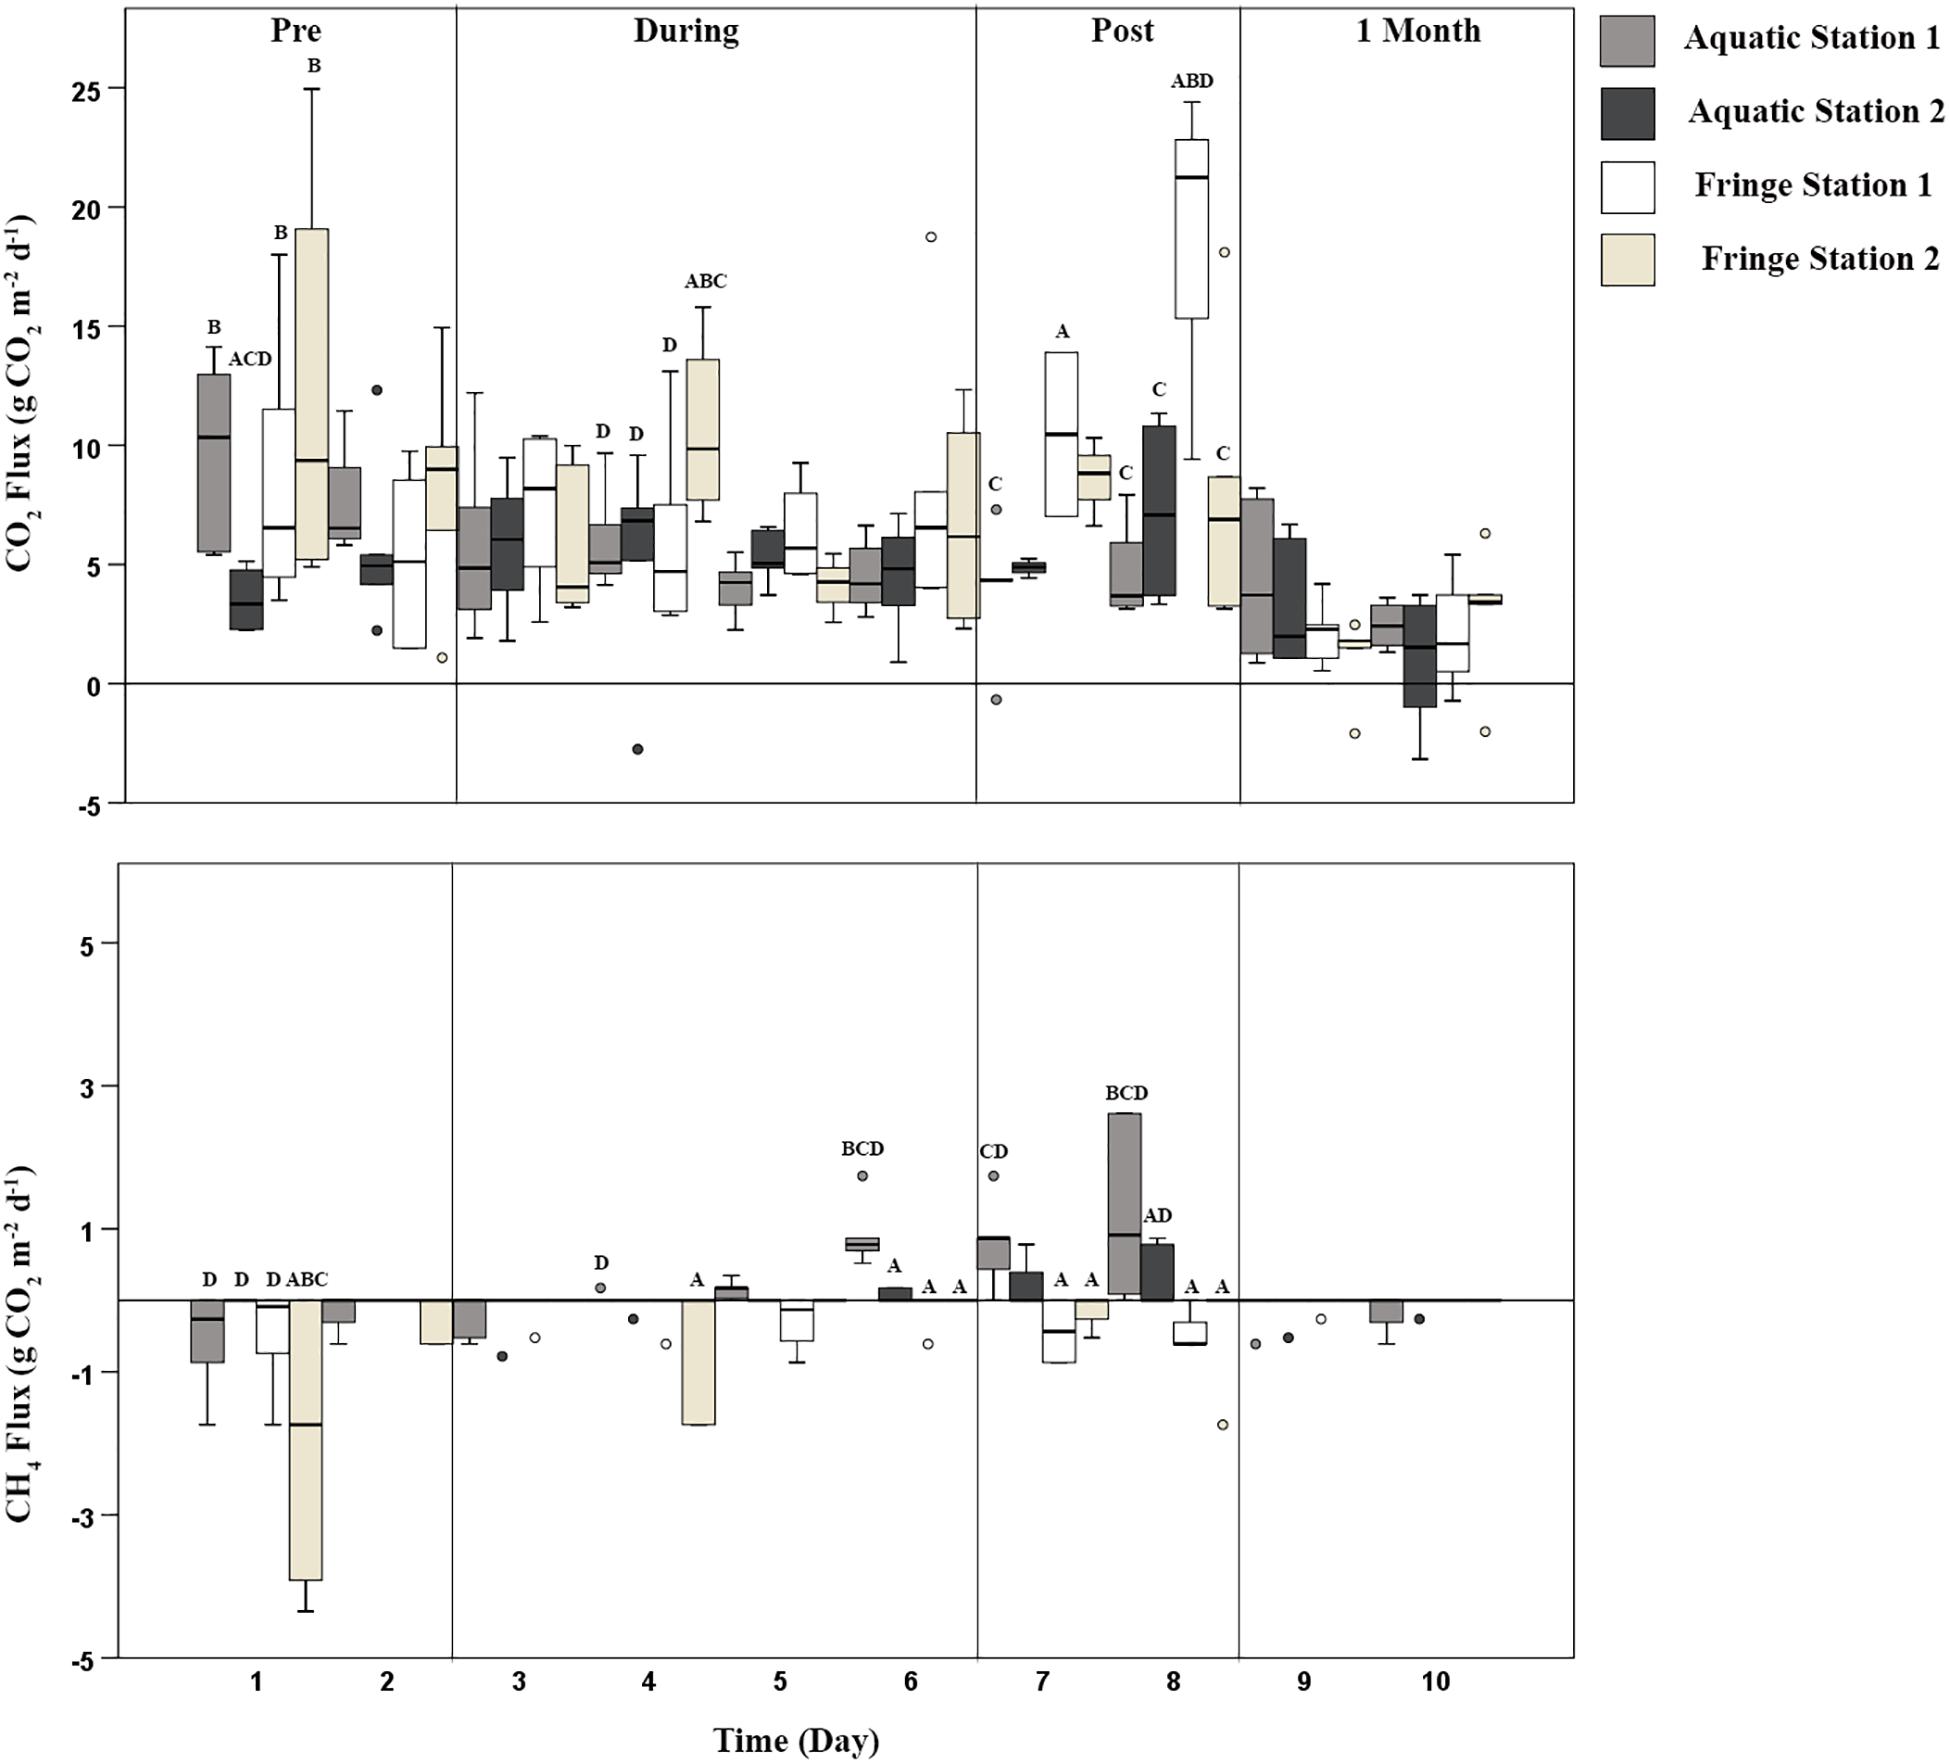
Figure 3. CO2 (g CO2 m–2 day–1) and CH4 (g CO2-e m–2 day–1) emissions across the entire watering event. Station significantly altered carbon emissions over time. Time represented the calendar day of measurement (pooled day and night sampling periods). Vertical lines within the figure represent divisions between different phases across time. Pre environmental watering occurred during days 1–2, during environmental watering occurred during days 3–6, post environmental watering occurred during days 7–8, and 1 month after water left the wetland, flux measurements were taken for 2 days (shown here as day 9–10). Two stations were nested within each zone; the Aquatic Station 1 (light gray box), Aquatic Station 2 (darker gray box), Fringe Station 1 (white box), and Fringe Station 2 (light brown box). Letters above bars denote significant variation across each station at that specific time. If Aquatic Station 1 (A), Aquatic Station 2 (B), Fringe Station 1 (C), and Fringe Station 2 (D) were significantly different from one another, the letters corresponding with their significant variation were placed above that station.
The higher levels of CO2 emissions and net CH4 uptake detected in the Pre environmental watering phase compared to all other phases presumably occurred due to low soil moisture content from the previously drained wetland conditions of Duck Creek North (North Central CMA Report, 2015). Drained conditions allow for higher potential O2 penetration within the soil profile that increases aerobic microbial carbon mineralization and subsequent CO2 emissions (Batson et al., 2015; Evans et al., 2016). Previous research noted that drier soil sediments in a lake produced high CO2 emissions because stored organic carbon within dry sediments was more susceptible to microbial decomposition processes than in wet sediments (Weise et al., 2016).
There were several taxonomic groups present during the Pre phase that may be responsible for higher CO2 emissions. In total, soil microbial community sequencing produced a sum of 955,540 sequences from each soil core (day + night within the Aquatic Zone) across all four phases of the environmental watering event (average soil microbial samples had 56,208 sequences; Supplementary Tables S7, S8). There were no significant differences in alpha diversity among phase, station and light levels (Supplementary Table S8); however, the pairwise PERMANOVA showed that the Pre phase of microbial beta diversity varied significantly from both wet phases (During and Post; Supplementary Table S9; t-value = 1.848–2.095; p = 0.002–0.006). There were no significant differences in microbial beta diversity between light level and aquatic stations. Microbial community structure was not expected to change on the short time scale of hours; however, results from the flux data show that there were likely changes in activity (e.g., increased CO2 in the day compared to night; Supplementary Figure S1 and Supplementary Table S10). Thus, community changes between light and dark sampling might not be expected. However, the repeated day-night samples provide increased sampling density that could potentially be used to help evaluate within-site variability. The results from this study show a higher relative abundance of Actinobacteria and Oscillatoriophycideae during dry conditions; both of which have functional traits for soil organic carbon decomposition and subsequent CO2 emissions (Figures 4, 5 and Table 2). Past research in boreal and arctic peatlands shows members of the Actinobacteria can play a significant contribution to two major parts of the carbon cycle: degradation of complex polymers and decomposition of organic matter (Tveit et al., 2013). Micromonosporaceae, a family within Actinobacteria found during this phase, have been isolated from habitats including freshwater soil sediments and are composed of species that degrade chitin, cellulose, lignin, and pectin (Wang et al., 2013). Micromonosporaceae have also been noted to play an important role in the turnover of organic plant material in a mangrove wetland ecosystem (Wang et al., 2013). Phormidiaceae bacteria, a family within Oscillatoriophycideae, have been found to provide subsurface carbon and nitrogen by breaking down complex organic matter thus making it more easily available for heterotrophic bacteria consumption in lake ecosystems of Africa (Glaring et al., 2015). The higher relative abundance of these taxonomic groups within the microbial communities during the dry Pre phase may therefore be the contributing to the breakdown of organic matter, resulting in higher CO2 emissions in this floodplain wetland.
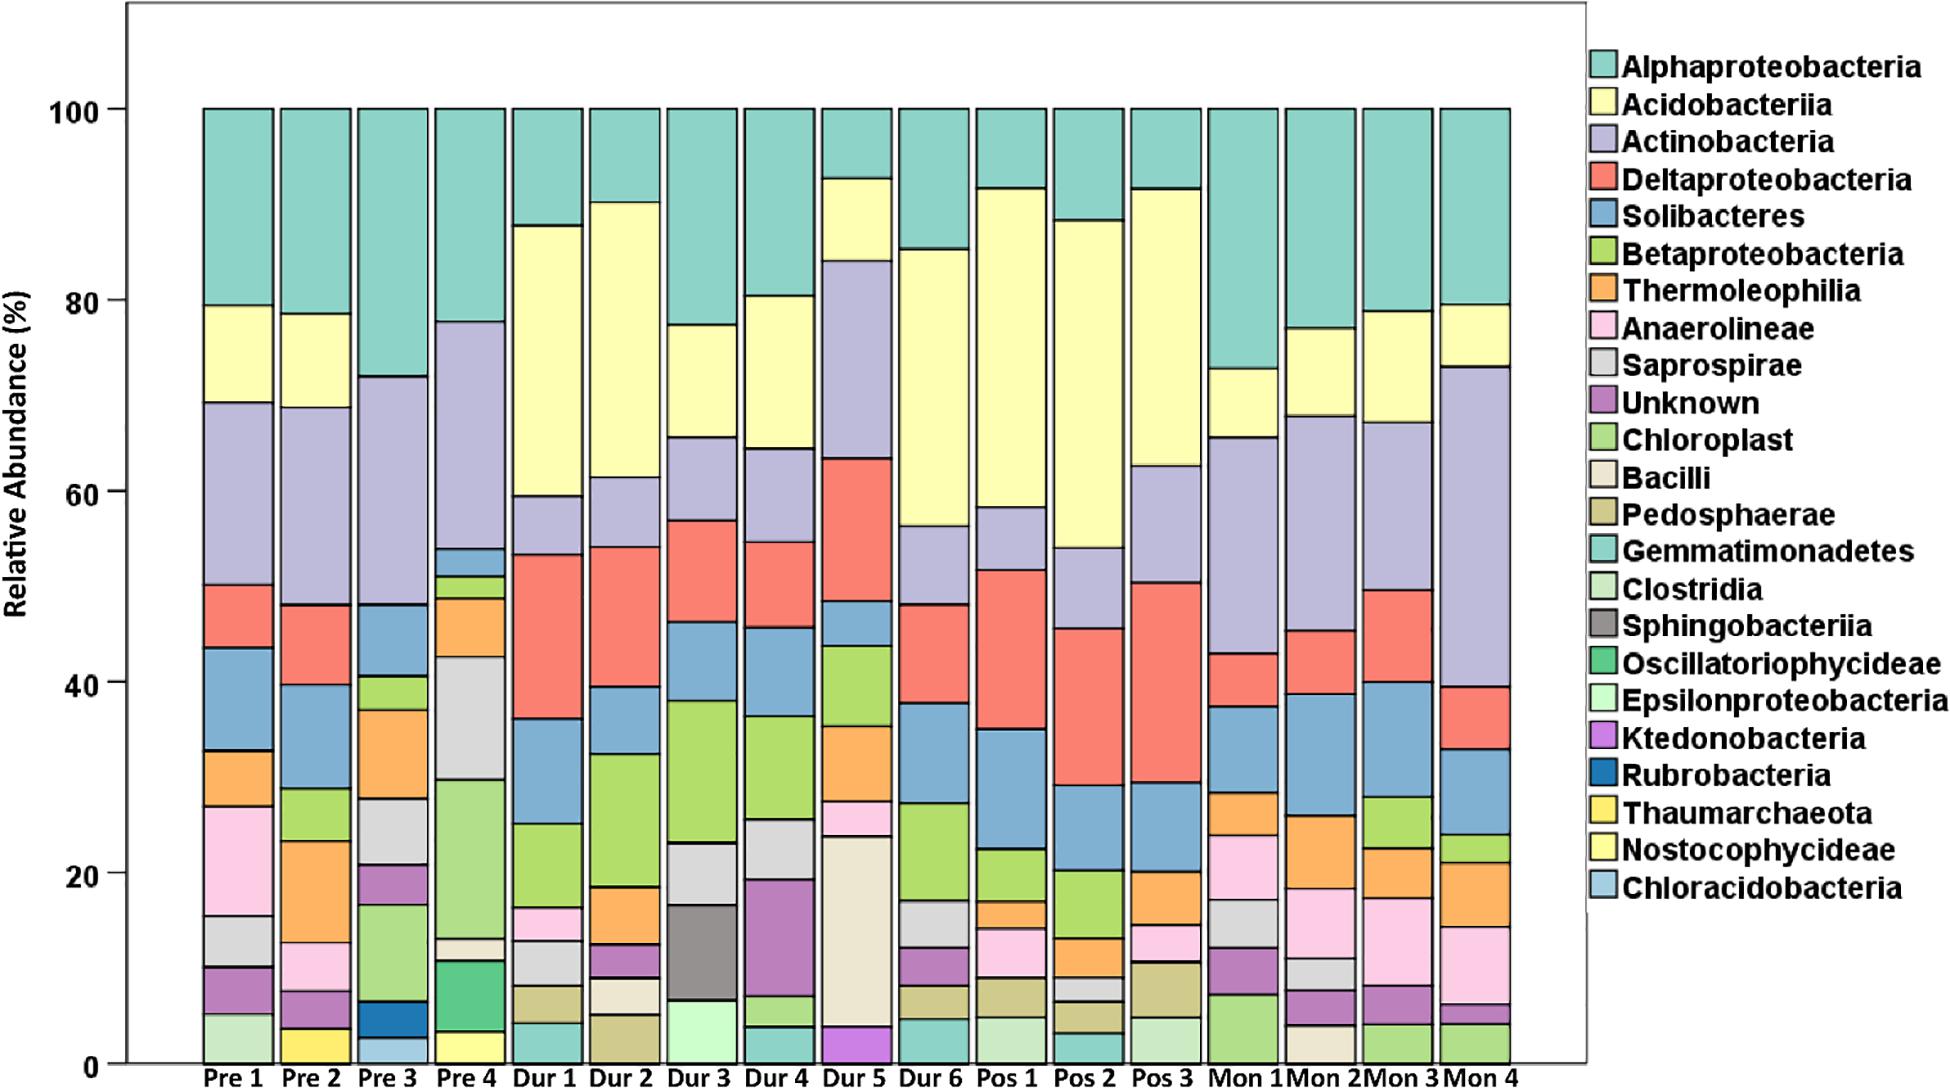
Figure 4. Microbial community composition of the top 10 most abundant classes within each sample. Two soil samples were taken within the Aquatic Zone across day and night sampling for each environmental phase (n = 4 per phase). At the Pre and 1 Month phases (Pre 1–4 and Mon 1–4), there was no water in the wetland, whereas at the During and Post phases (Dur 1–6 and Pos 1–3), soils were inundated. More samples were taken in the During phase (n = 6), as the presence of CH4 emissions was detected during this phase. Therefore, extra sampling ensured that bacteria producing CH4 were captured for this experiment. One sample in the Post phase was unable to be sequenced (n = 3).
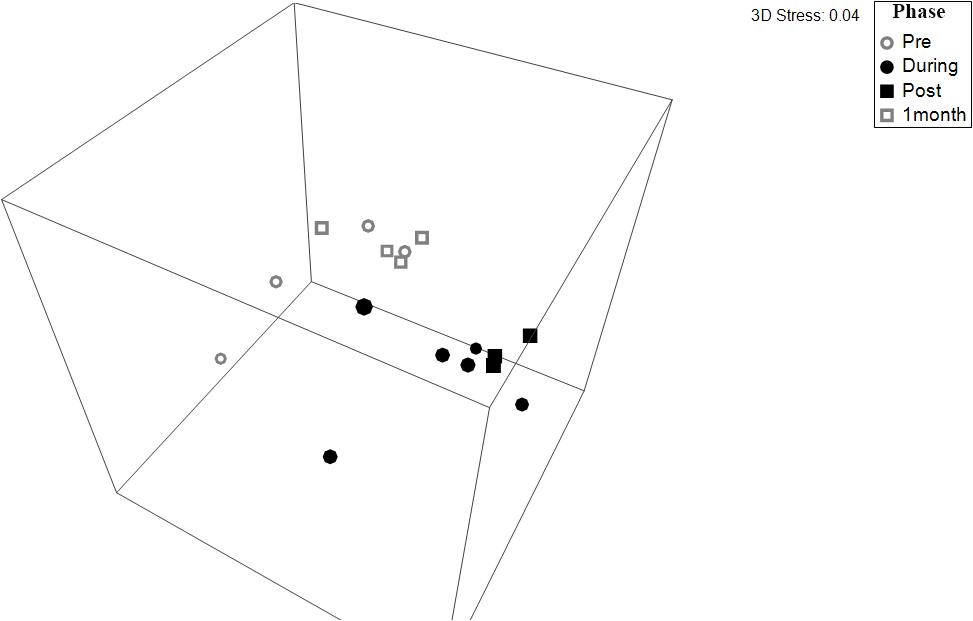
Figure 5. Non-dimensional plot of multidimensional scaling (NMDS) of prokaryotic communities in freshwater wetland soils across each phase of environmental watering, derived from the UNiFRAC matrix of the 16S rRNA gene fragments (stress = 0.04). Points that are closer in the NMDS plot indicate samples with more similar beta-diversity community structure. The pairwise PERMANOVA showed that microbial communities during the “Pre” dry phase (gray) were significantly different from the communities present in the wet phases (black) (p ≤ 0.006). The 1 Month phase was only marginally insignificant compared to the wet phases (p ≤ 0.081).
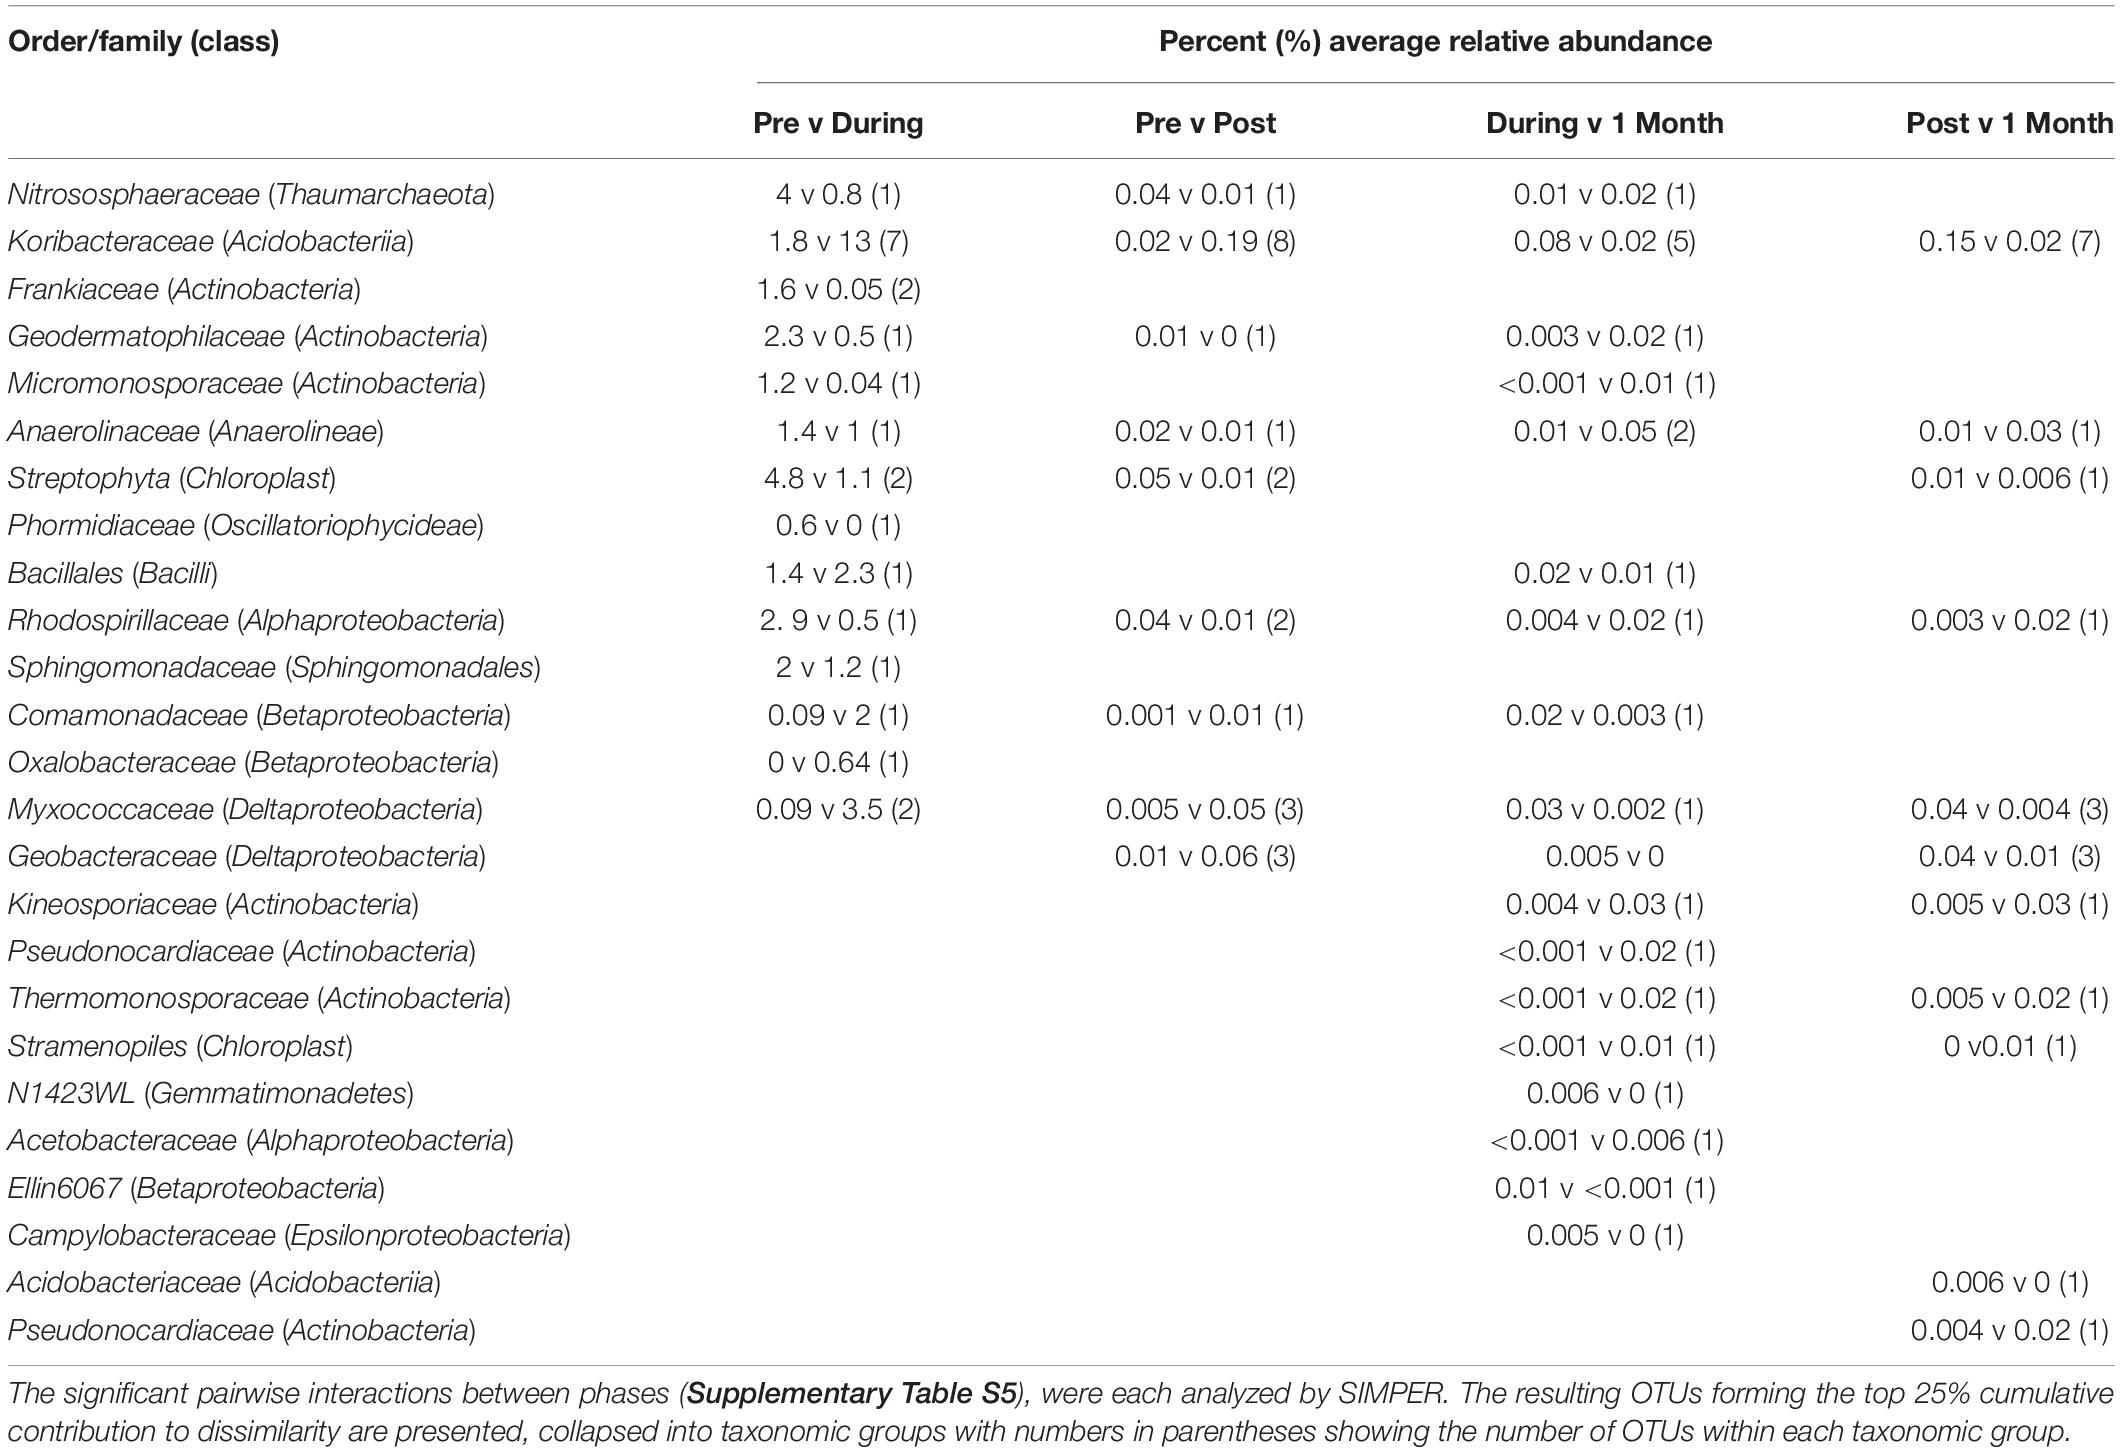
Table 2. The SIMPER table of OTUs driving microbial community differences between phases.
CH4 uptake in dry soil conditions has been linked to CH4 oxidation at the aerobic–anaerobic interface in surface soils, as well as the oxygenated area surrounding the roots of wetland plants (Cai et al., 2016), both of which could have been occurring at this phase. Further, microbes within the class Alphaproteobacteria were also in high relative abundance during this stage and are known to consist of various methanotrophic bacteria that could be responsible for CH4 uptake during this period of environmental watering (He et al., 2014; Cai et al., 2016). For instance, there was a higher relative abundance of Methylocystaceae (a type II methanotroph family; Nazaries et al., 2013) in this phase, which in part drove the differences between the Pre and dry phases in accordance to the SIMPER analyses (Table 2).
The association between higher CO2 emissions and CH4 uptake during the day compared to night within Pre environmental watering conditions is likely driven by environmental parameters, such as moisture and temperature. CO2 and CH4 emissions in the wetland positively correlate with temperature within the study period (p < 0.001; Supplementary Table S11). Temperatures throughout this experiment during daylight were 68% higher during the day, averaging 22.4°C, compared to 7.25°C at night (Supplementary Table S12). Higher diurnal temperature has been associated with increased aerobic microbial enzymatic activity that further contributes to wetland CO2 emissions (Lovelock, 2008); however, soil microbial communities were not significantly different between day and night (Pseudo F = 1.793; P-perm 0.080). Past research links diurnal patterns of CH4 emissions to soil temperature, affecting the rates of activity for CH4-cycling bacteria (Le Mer and Roger, 2001; Serrano-Silva et al., 2014). Within Duck Creek North, higher temperatures during the day may have been the reason for the increase in methanotrophic Methylocystaceae and subsequent CH4 uptake (Table 2 and Supplementary Table S10).
During Environmental Watering
The introduction of environmental water played a key role in altering microbial communities and subsequent carbon emissions. Once water was added to the wetland (depths ranging from 27.9–101 mm; Supplementary Table S12), the period in which each Aquatic Station was inundated significantly altered CO2 and CH4 flux, while Fringe Stations 3 and 4 stayed relatively similar to the Pre watering phase. Aquatic Station 1 received water on day 3; however, there was little to no change in carbon flux until 24 h after inundation (Figure 3). These patterns were consistent with Aquatic Station 2, where water arriving during the night of day 5 did not alter CO2 and CH4 flux until the night of day 6 (∼24 h after inundation; wetland depth 101 mm; Supplementary Tables S10, S12). Similar to the Pre environmental watering phase, daylight CO2 flux within the “During phase” remained higher in both zones compared to night until days 5 and 6 (Supplementary Figure S1 and Supplementary Table S10). After the Aquatic Zone was inundated for more than 24 h at each station, average CO2 emissions were suppressed by 24%, while average CH4 emissions doubled compared to Pre environmental watering conditions (Figure 3 and Supplementary Table S10). These results are similar to the 15–49% CH4 emission increase observed when adding water in reservoirs to an upland boreal forest (Matthews et al., 2005).
The lag in suppressed CO2 emissions from days 5–6 for both Aquatic Stations could be related to several bacterial families that were suppressed during the wet phases of this experiment, including carbon-degrading Micromonosporaceae and Phormidiaceae (Wang et al., 2011; Glaring et al., 2015), at the expense of increased relative abundances of Koribacteraceae and Geobacteraceae. The relative shifts observed in soil microbial communities could be linked to the shifts in metabolic outputs, i.e., fluctuating CO2 emissions between stations that were nested in the Fringe and Aquatic Zone (Figure 3). A similar study investigating microbial responses to inundation in a Victorian floodplain wetland found that leucine aminopeptidase concentrations, an enzyme produced by microbes for carbon degradation, was significantly lower in activity after 1–3 days of inundation (Wilson et al., 2011).
During environmental watering, CO2 emissions decreased while CH4 emissions increased, which may be due to the shift between primarily aerobic to primarily anaerobic conditions, thereby also causing a shift in microbial communities and metabolic processes related to CH4 release (Wilson et al., 2011). Biogeochemical processes influence which microbial communities and metabolic processes occur in wetland sediments. Within the surface of the soil profile, aerobic microbial populations gain energy by oxidizing carbon while utilizing O2 as the terminal electron acceptor (Macreadie et al., 2017; McCloskey et al., 2018). As wetland ecosystems become inundated and wetland soils develop more anoxic zones (due to reduced diffusion of O2), microbial communities require alternative electron acceptors for respiration processes, which affects carbon mineralization rates (Wiessner et al., 2017). Electron acceptors that are used below the oxic/aerobic interface include nitrogen dioxide (NO2–) and nitrate (NO3–), followed by nitric oxide (NO) and nitrous oxide (N2O), oxidized manganese (Mn) compounds, ferric oxides, sulfate (SO4), and finally CO2, which results in microbial respiration processes such as fermentation and methanogenesis (Bhaduri et al., 2017). We also saw a relative increase in the abundance and diversity of anaerobic microbial taxa within the soil communities, including Myxococcaceae, Nitrososphaeraceae, Koribacteraceae, Comamonadaceae, and Geobacteraceae. These taxa suggest that anaerobic microbial respiration processes were involved in fermentation, denitrification, sulfate, and carbon cycling, respectively (Hütsch et al., 2002; King and Weber, 2007; Morita et al., 2011; Zhou et al., 2014; He et al., 2015). Based on the average increase in CH4 emissions (0.01 ± 0.04 CO2-e m–2 day–1) and decrease in CO2 emissions (5.18 ± 2.55 g CO2 m–2 day–1) during this phase in the Aquatic Zone compared to Pre environmental watering conditions, we hypothesize that the shift of microbial communities was linked to a decline in redox potential when water was present (i.e., days 5–6; Supplementary Tables S5, S10).
Following the probable decrease in redox potential during this phase of environmental watering, Deltaproteobacteria became significantly more abundant during the wet phase (Figure 4 and Table 2). These bacteria typically comprised of putative anaerobic bacterial functional groups, such as iron reducers, sulfate reducers, and fermenting bacteria (Rawat et al., 2012). The presence of the Myxococcaceae bacterial family suggests the higher potential of sulfate reduction in this wetland ecosystem (Yousefi et al., 2014). Even with the shift to more anaerobic metabolic pathways after watering, methanogenesis was still less competitive than the other pathways. Inhibition of methanogenesis by sulfate reducing bacteria has been documented in wetland ecosystems (Borowski et al., 1996; Valentine and Reeburgh, 2000). Compared to a recent freshwater floodplain wetland study, CH4 emissions were low in Duck Creek North during high inundation levels, which may be in response to an increased abundance of sulfate reducing bacteria (Batson et al., 2015).
Koribacteraceae also increased in the During phase due their resilient nature in response to fluctuating temperatures (Kielak et al., 2016). A study providing genomic insights into the ecology of Acidobacteriia noted the importance of this bacterial class for the turnover of soil organic carbon within damp arctic and boreal environments (Rawat et al., 2012). Furthermore, Koribacteraceae, a family of bacteria within the Acidobacteriia class, were found to improve conditions for methanogens by providing a carbon substrate through the decay of organic matter, which is required for anaerobic hydrogenotrophic methanogenesis (King and Weber, 2007; Soman et al., 2017). The members within the Acidobacteriia bacterial class that were present in both dry and wet phases may be a key group involved in carbon emissions in semi-arid freshwater wetlands, regardless of the inundation level.
Overall, CH4 fluxes were greater at night during environmental watering across each station and zone (Figure 3 and Supplementary Table S10). The night time peaks averaged 0.006 CH4 whereas the day CH4 fluxes averaged −0.01 g CO2-e m–2 day–1, respectively. Drivers of diurnal variation in CH4 fluxes may be explained by a fluctuation in O2 levels caused by plant photosynthesis. A study measuring the plant-mediated oxygen supply by wetland vegetation Phragmites australis showed significant O2 declines within the rhizosphere at night (Faußer et al., 2016), thus implying a shift in the aerobic/anaerobic interface to more anaerobic conditions, which better suit methanogenic bacteria (Wagner, 2017). O2 levels for this experiment were only measured within the water profile; however, patterns during days 3–8 show light DO levels to be 0.5 mg L–1 or 40% higher than dark measurements, which may explain the higher CO2 emissions during those days and higher CH4 emissions at night during anoxic conditions (Supplementary Figure S1 and Supplementary Tables S10, S12).
Finally, the production of root exudates at night from previous photosynthetic activity during the day may provide labile carbon substrates to methanogens, therefore increasing their CH4 output at night (Dooling et al., 2018). This slight lag-time of increased root exudates at night compared to the day while vegetation is photosynthesizing has been noted in previous wetland research. For instance, isotopic studies following wetland carbon cycling noted lag times between photosynthate production, root exudates, and finally CH4 emissions to be between 2 and 24 h depending on the vegetation type (King and Reeburgh, 2002; Ström et al., 2003). A higher abundance in the Comamonadaceae family, found in the rhizosphere and specialized to degrade non-aromatic plant exudates (Hütsch et al., 2002), at the “During” phase, further suggests that the decomposition of root exudates increased during this phase. Additional research into the links between wetland vegetative O2 and root exudates to soil CH4 emissions is needed to definitively make this connection.
Post Environmental Watering
Carbon flux and microbial communities continued to vary as water receded (averaging 76.8 mm on day 7 and 29.7 mm on day 8; Supplementary Table S12) during the Post environmental watering phase. At this phase, increased anoxic conditions due to continual periods of inundation potentially favored methanogenesis and may have resulted in the 46% higher emission rate of CH4 seen within the Aquatic Zone (0.065 g CO2-e m–2 day–1) compared to the Fringe Zone (−0.035 g CO2-e m–2 day–1). These results are comparable to a past study analyzing marshland soil emission rates under both anoxic (0.007 g CO2-e day–1) and oxic (0.004 g CO2-e day–1) conditions that occurred simultaneously with higher counts of methanogenic species and increased CH4 flux during higher water levels (Wagner, 2017). In this study, CO2 and CH4 flux continued to follow a similar pattern within the Aquatic Zone as the water began to leave the floodplain wetland after 2 days. Patterns of higher CO2 emissions and lower CH4 emissions during the day compared to night found in the “During” phase also continued throughout the Post environmental watering phase (Supplementary Figure S1).
The highest abundance of CH4 cycling bacteria were present during this phase, including the Myxococcaceae, Nitrososphaeraceae, Koribacteraceae, Methylocystaceae, Hyphomicrobiaceae, and Geobacteraceae families (Table 2 and Supplementary Table S13). Myxococcaceae, Nitrososphaeraceae, Methylocystaceae, and Hyphomicrobiaceae microorganisms during this phase may be the reason for a relatively small amount of CH4 release during the wet phases of this experiment. For instance, anaerobic oxidation of CH4 occurs when different terminal electron acceptors are used during microbial respiration. Nitrososphaeraceae and Hyphomicrobiaceae are sulfate and nitrite reducing bacteria thus enhancing the conditions under which anaerobic oxidation can occur (Harrison et al., 2009; Ettwig et al., 2010). However, the presence of Koribacteraceae and Geobacteraceae bacteria may be the reason for the highest CH4 release during “Post” environmental watering compared to the other phases of this experiment (Table 2 and Supplementary Table S13). Geobacteraceae, for instance, are abundant in areas with aggregates of methanogenic archaea and may enable the rapid conversion of organic matter to CH4 (Morita et al., 2011). Research shows that Geobacteraceae have direct interspecies electron transfer between CH4-producing Methanosaetaceae (Zhang et al., 2017). Although methanogenic microbial communities were not within the top 10 most abundant classes, the highest sequences of methanogenic archaea (Methanomicrobia and Thermoplasmata) were found within the Post environmental watering phase and may be responsible for the highest CH4 release at this time period (Supplementary Table S13). Despite their low abundance, the microorganisms identified during this phase may play a key role in the carbon flux.
One Month After Environmental Watering
The introduction of environmental water significantly altered the carbon cycling processes in Duck Creek North, even a month after water was last present within the floodplain wetland ecosystem. One month after the water left the floodplain, CO2 and CH4 emissions were significantly lower in the Aquatic Zone compared to Pre environmental watering conditions (Figure 3, Supplementary Figure S1, and Supplementary Table S6). Patterns of CO2 emissions between the different zones and different light levels were not evident at the 1 Month phase; however, average CH4 emissions were much lower in the Aquatic Zone compared to the Fringe Zone during this phase (Figure 3, Supplementary Figure S1, and Supplementary Table S6). Lower carbon emissions could be connected with higher plant growth within the Aquatic Zone a month after watering in the degraded wetland ecosystem (Figure 3).
The increased vegetation within Duck Creek North at the 1 Month phase has the potential to improve carbon sequestration rates by reducing CO2 emissions and storing organic carbon matter in plant biomass. Several studies note the importance of wetland plants mediating carbon sequestration processes after restoring vegetative growth. For instance, past research described Typha sp. and Phragmites sp. dominated wetlands as carbon sinks because these vegetation types photosynthetically assimilated CO2 from the atmosphere and sequestered this carbon into biomass that eventually became organic matter stored in the wetland soil (Brix, 1993; Rocha et al., 2008; Strachan et al., 2015). Carbon emissions from a restored freshwater wetland were lower in areas with vegetation (3.84 g CO2-e m–2 day–1) compared to areas without vegetation (9.59 g CO2-e m–2 day–1; McNicol et al., 2017). Therefore, lower carbon emissions during the 1 Month phase compared to all other phases of environmental watering may be caused by the increase in vegetation in the aquatic zones of Duck Creek North.
Within Duck Creek North, microbial communities returned to reflect those of the Pre environmental watering phase, suggesting a circular successional change throughout the environmental watering event. The 1 Month phase was not significantly different (t-value 1.569–1.789; p = 0.059–0.081) to the wet phases; however, general trends show similar microbial community abundance between the Pre and 1 Month phases (Figure 3 and Table 2). For instance, relative abundances of Alphaproteobacteria and Actinobacteria during the Pre and 1 Month phases (5 and 8%; Table 2), where higher than Acidobacteriia and Deltaproteobacteria during the wet phases (10–13% higher; Figure 3 and Table 2).
Despite the overall community succession seen during the environmental watering process, there were several taxonomic groups that were present during the 1 Month phase that were not present prior to watering. During the 1 Month phase, the family Methylocystaceae in the Alphaproteobacteria class were in higher abundance compared to Pre environmental watering conditions. These Alphaprotobacteria have species that are methanotrophs; utilizing methanol or CH4 as their carbon source (Conrad, 2009). An increase in CH4 sequestration during the 1 Month phase compared to the other phases of environmental watering may be associated with the increased abundance of Methylocystaceae as well as the increase of abundance in Myxococcaceae and Nitrososphaeraceae. The bacterial class Actinobacteria was more abundant in the dry phases, specifically the family Micromonosporaceae. Because this microorganism plays an important role in the turnover of organic plant material (Wang et al., 2011), there are implications for higher CO2 release when they are in higher abundance. However, this bacterial family was less abundant in the 1 Month phase compared to the Pre phase which may be linked with the overall lower CO2 emissions in the Aquatic Zone and Stations at this time. Bacterial taxa associated with CH4 cycling, such as Koribacteraceae and Methylocystaceae, were more abundant in the 1 Month phase compared to the Pre phase. The relative abundance of these bacterial communities was still lower compared to during the wet phases of environmental watering (Table 2). Re-wetting has been known to quickly alter microbial abundance in wetland soils (Meisner et al., 2018). However, environmental watering may have permanently altered the microbial community and carbon cycling within this ecosystem, as some community differences were still seen after 1 Month of watering. Further research into the time-frame of microbial community variation would determine the overall effect of environmental watering and carbon emissions.
Global Warming Potential
Pre environmental watering carbon emissions were similar between zones, averaging 6.65 ± 3.67 g CO2-e m–2 day–1 in the Aquatic Zone and 8.29 ± 5.73 g CO2-e m–2 day–1 in the Fringe Zone. While water was present in the Aquatic Zone in the During and Post environmental watering periods, average carbon emissions decreased and were significantly lower than Pre environmental and Fringe Zone compared to the Aquatic Zone (p < 0.019; Figure 6 and Supplementary Tables S14, S15). Past research observed similar patterns of lower carbon emissions when water was present in the aquatic zone of wetland ecosystems (Blodau et al., 2007). Further, the CO2-e of the Aquatic and Fringe Zone after 1 Month of environmental watering was lower than pre-environmental watering conditions. Increased vegetation after the growing season and subsequent increased carbon sequestration likely caused the overall lower CO2-e during this phase (Zhou et al., 2009; Pelletier et al., 2015; Figure 6). However, the Aquatic zone was still 84% lower in the compared to the Fringe Zone. The underlying drivers of the emissions across each watering event could be related to differing water levels between the zones that influence soil temperature changes, O2 availability, microbial community composition, and vegetative growth.
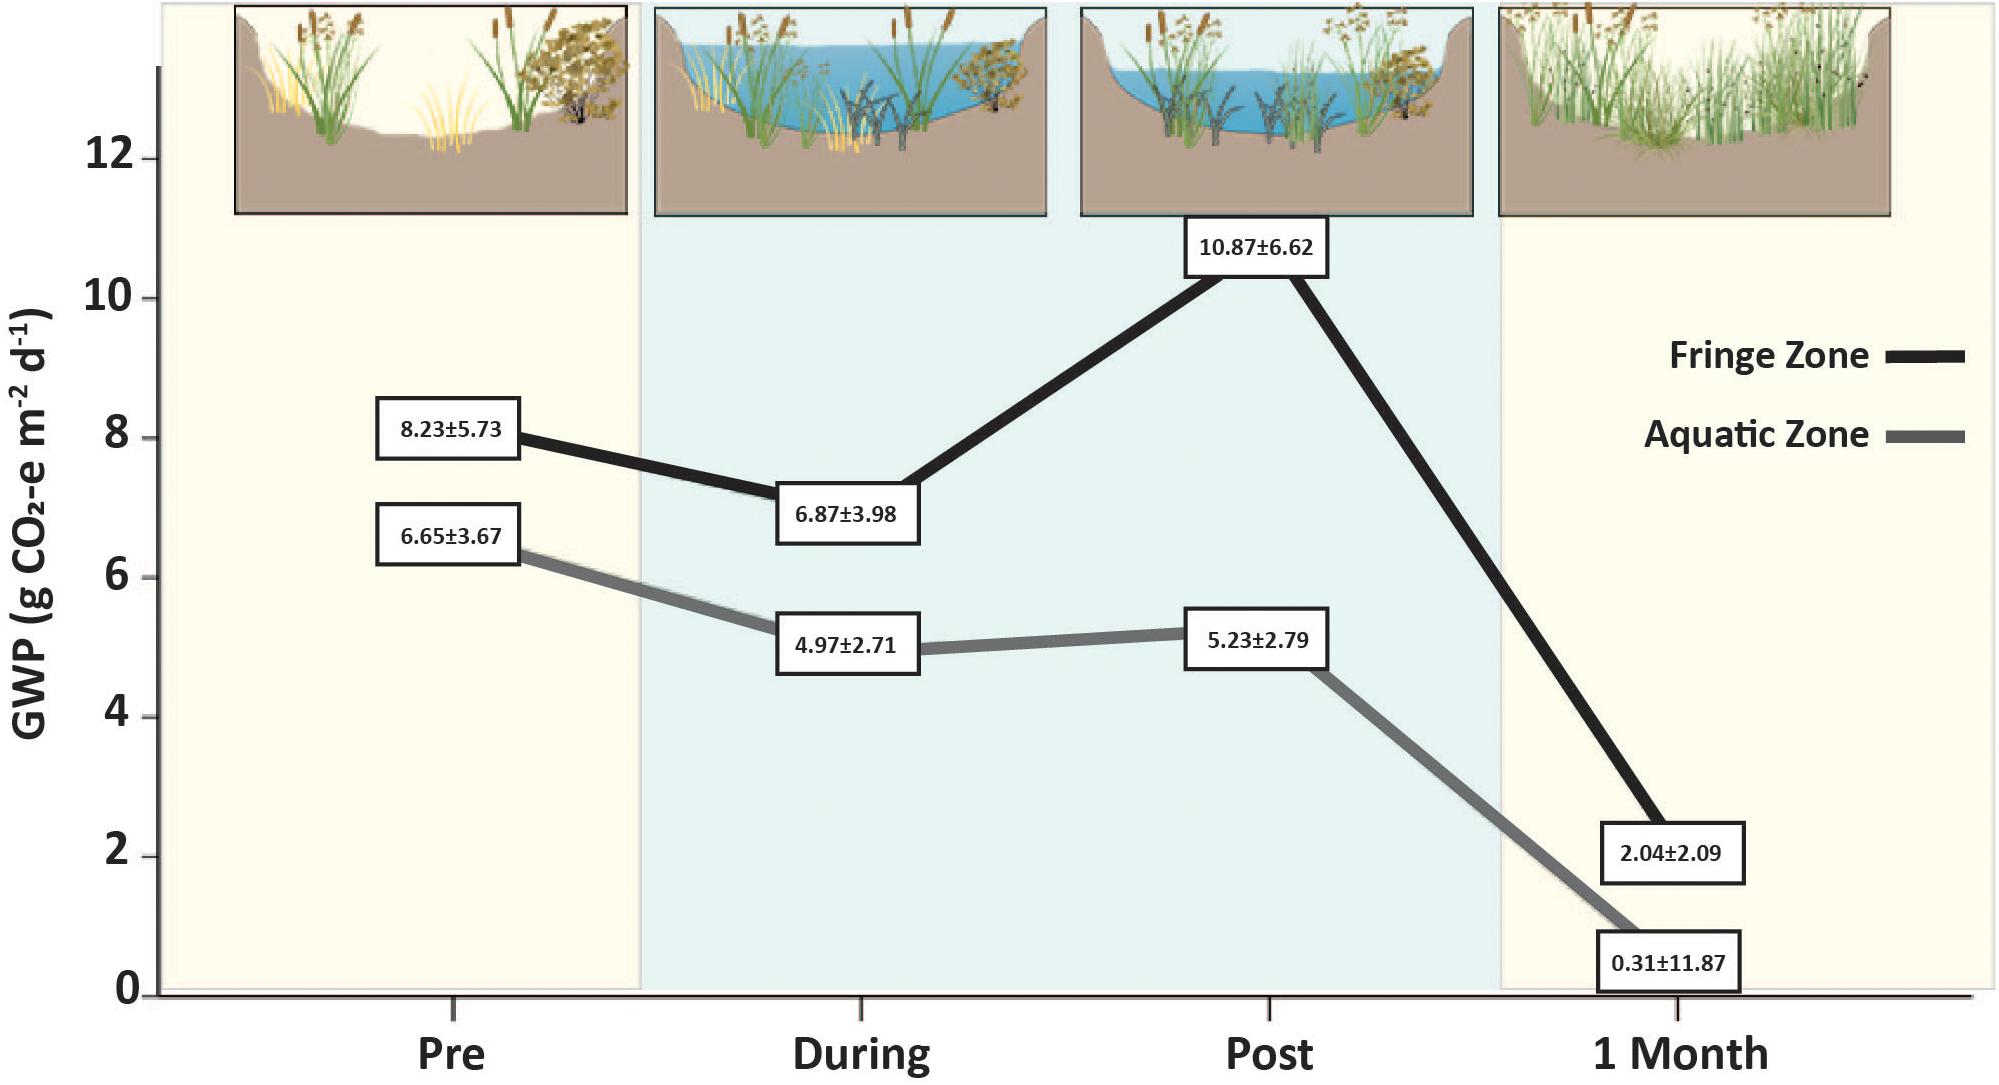
Figure 6. Total carbon emissions/global warming potential (CO2 + CH4 g CO2-e m–2 day–1) before (Pre), during (During and Post), and after watering (1 Month). Blue panels signify the presence of water in the wetland ecosystem whereas yellow panels indicate that no water was present at that time. Carbon emissions were 84% lower in the Aquatic Zone (gray line) compared to the Fringe Zone (black line) after the entire watering event. The lower emissions across the entire watering event could be correlated with presence of water in the During and Post phases which altered microbial composition and subsequent carbon emissions in the degraded wetland ecosystem. Higher vegetative growth in the Aquatic Zone compared to the Fringe Zone may have influenced the lower carbon emissions at this time.
Research concerning wetland management for carbon emissions reduction within degraded wetland ecosystems remains unclear as to whether rehabilitation processes, such as environmental watering, improve wetland carbon sequestration, and storage capacity (Morin et al., 2014; Mitsch and Gosselink, 2015). According to the results in this study, Duck Creek North remained a carbon source; however, carbon emissions were significantly reduced after the environmental watering event. Therefore, returning wetland conditions to previous floodplain water levels, in the short term, may reduce the GWP in degraded semi-arid wetlands in Australia. Further, carbon markets allow for carbon credits to be collected for avoided emissions (Vanderklift et al., 2019). The observed average emission reduction of 6.34 to 0.31 within the Aquatic Zone would equate to 22.8 tons of C ha–1 year–1 or 4.5 car’s worth of carbon emissions per ha–1 year–1 (Vanderklift et al., 2019). Managers would theoretically be able to apply for carbon credits at a rate of $11.90 with a return of $271 ha–1 year–1 after applying environmental watering practices for carbon emission reduction potential.
Limitations and Future Directions
Continued measurements of carbon stock assessments (i.e., 3–5 years) for this management practice would improve our understanding of the significance of environmental watering for long-term soil carbon storage in low soil carbon accumulation areas of semi-arid Australia. Due to the significant correlation between carbon emissions and temperature in this study, measurements should be taken further into other seasonal watering plans to account for differences of time since inundation, temperature, and day length. The short watering event may have altered this wetland for a longer period of time (i.e., 6, 12, and 18 months) thus, further measurements would capture this change. As the frequency and duration of inundation alters microbial activity and carbon emissions (particularly CH4 emissions; McComb and Qiu, 1998), further investigation of longer wetting periods should be measured to accurately assess how environmental watering management impacts emission reduction and soil carbon storage in degraded freshwater wetland ecosystems. In this study, temperature and DO were only measured within the water column and at ambient atmospheric levels. Direct measurements of O2 and temperature within the surface and subsurface soil layers may help further explain the variations of carbon emissions across an entire environmental watering event, as O2 levels were significantly correlated with CH4 emissions (Supplementary Table S11). Moreover, using targeted functional gene analyses would better link key microbial metabolic functions with greenhouse gas release during various environmental phases (Yarwood, 2018).
Conclusion
We found that the environmental watering plan in this semi-arid floodplain wetland lowered carbon emissions while water was present as well as a month after the entire watering event by increasing anoxic conditions and vegetation within the Aquatic Zone of this ecosystem. Environmental watering also significantly altered soil microbial communities, and we hypothesize that the circular succession we detected was linked to shifts in greenhouse gas emissions, thus highlighting the importance of soil microorganisms to wetland management strategies. Changes in diel temperatures and varying water levels could also attribute to altering soil O2 levels within the wetland, further altering the relative abundance of the microorganisms associated with soil organic carbon breakdown. This research shows that the effect of environmental watering on wetland ecosystem carbon emissions varies according to microclimatic environmental conditions and successive microbial community compositions. Overall, the carbon emission reduction benefits have been gained from the environmental watering program at this wetland ecosystem. Continuing this management practice will likely be required to prevent conditions from returning to Pre environmental watering and to further reduce carbon emissions in Duck Creek North.
Environmental watering is increasingly used for the improvement of water quality, riparian vegetation health, and enhancing fauna habitat and breeding opportunities within Australian catchments (VEWH 2018–2019). With increasing land-use change, there is greater risk of further loss of wetland carbon storage functionality and associated carbon emissions through wetland degradation. Freshwater wetlands have the ability to provide a sink for the atmospheric carbon pool but if not managed properly, wetlands such as Duck Creek North could become greater sources of CO2 and CH4. Difficulties in estimating the net carbon sequestration and storage potential are largely due to the complexity of carbon fluxes and corresponding microorganisms within wetland sediments. This research presents further insights pertaining to soil carbon emission reduction after wetland rehabilitation practices have occurred. These data will be instrumental in conveying efficient strategies for managers and policy makers to applying greenhouse gas emission reduction within semi-arid floodplain wetlands.
Data Availability Statement
This manuscript contains previously unpublished data. The name of the repository and accession number(s) are not available.
Author Contributions
KL, PC, ST-T, and PM conceived and planned the experiments. KL, PC, and ST-T carried out the experiments and contributed to the interpretation of the results. KL took the lead in writing the manuscript. All authors provided critical feedback and helped shape the research, analysis, and manuscript.
Funding
This research was supported by the North Central Catchment Management Authority, Wimmera Catchment Management Authority, and Deakin University.
Conflict of Interest
The authors declare that the research was conducted in the absence of any commercial or financial relationships that could be construed as a potential conflict of interest.
Acknowledgments
Special thanks to Giuditta Bonetti for her assistance with the bioinformatics. We are particularly grateful for the assistance from Sarah Treby and Muvindu Yudhara Liyanapathiranato during data collection and processing.
Supplementary Material
The Supplementary Material for this article can be found online at: https://www.frontiersin.org/articles/10.3389/fenvs.2020.00008/full#supplementary-material
References
Altor, A. E., and Mitsch, W. J. (2008). Methane and carbon dioxide dynamics in wetland mesocosms: effects of hydrology and soils. Ecol. Appl. 18, 1307–1320. doi: 10.1890/07-0009.1
Baer, D. S., Paul, J. B., Gupta, M., and O’Keefe, A. (2002). Sensitive absorption measurements in the near-infrared region using off-axis integrated-cavity-output spectroscopy. Appl. Phys. B 75, 261–265. doi: 10.1007/s00340-002-0971-z
Baldwin, D. S., Rees, G. N., Wilson, J. S., Colloff, M. J., Whitworth, K. L., Pitman, T. L., et al. (2013). Provisioning of bioavailable carbon between the wet and dry phases in a semi-arid floodplain. Oecologia 172, 539–550. doi: 10.1007/s00442-012-2512-8
Batson, J., Noe, G. B., Hupp, C. R., Krauss, K. W., Rybicki, N. B., and Schenk, E. R. (2015). Soil greenhouse gas emissions and carbon budgeting in a short-hydroperiod floodplain wetland. J. Geophys. Res. G 120, 77–95. doi: 10.1002/2014JG002817
Bernal, B., and Mitsch, W. J. (2012). Comparing carbon sequestration in temperate freshwater wetland communities. Glob. Change Biol. 18, 1636–1647. doi: 10.1111/j.1365-2486.2011.02619.x
Bernal, B., and Mitsch, W. J. (2013). Carbon sequestration in freshwater wetlands in Costa Rica and Botswana. Biogeochemistry 115, 77–93. doi: 10.1007/s10533-012-9819-8
Bhaduri, D., Mandal, A., Chakraborty, K., Chatterjee, D., and Dey, R. (2017). Interlinked chemical-biological processes in anoxic waterlogged soil - A review. Indian J. Agricult. Sci. 87, 1587–1599.
Blodau, C., Roulet, N. T., Heitmann, T., Stewart, H., Beer, J., Lafleur, P., et al. (2007). Belowground carbon turnover in a temperate ombrotrophic bog. Glob. Biogeochem. Cycles 21:GB1021. doi: 10.1029/2005GB002659
Bolyen, E., Rideout, J. R., Dillon, M. R., Bokulich, N. A., Abnet, C., Ghalith, G. A. A. L., et al. (2018). QIIME 2: reproducible, interactive, scalable, and extensible microbiome data science. PeerJ 6:e27295v2. doi: 10.7287/peerj.preprints.27295v2
Boon, P. I., Mitchell, A., and Lee, K. (1997). Effects of wetting and drying on methane emissions from ephemeral floodplain wetlands in south-eastern Australia. Hydrobiologia 357, 73–87. doi: 10.1023/A:1003126601466
Borowski, W. S., Paull, C. K., and Ussler, W. (1996). Marine pore-water sulfate profiles indicate in situ methane flux from underlying gas hydrate. Geology 24, 655–658.
Brix, H. (1993). “Macrophytes-mediated oxygen transfer in wetlands: transport mechanism and rate,” in Constructed Wetlands for Water Quality Improvement, eds G. A. Moshiri, and A. Arbor (London: Lewis).
Bureau of Meteorology [BOM] (2017). Average Annual, Seasonal and Monthly Rainfall. Available at: http://www.bom.gov.au/jsp/ncc/cdio/weatherData/av?p_nccObsCode=136&p_display_type=dailyDataFile&p_startYear=2017&p_c=-1280733113&p_stn_num=080023 (accessed August 20, 2018).
Byrne, M. (2008). Evidence for multiple refugia at different time scales during Pleistocene climatic oscillations in southern Australia inferred from phylogeography. Q. Sci. Rev. 27, 2576–2585. doi: 10.1016/j.quascirev.2008.08.032
Cai, Y., Zheng, Y., Bodelier, P. L. E., Conrad, R., and Jia, Z. (2016). Conventional methanotrophs are responsible for atmospheric methane oxidation in paddy soils. Nat. Commun. 7:11728. doi: 10.1038/ncomms11728
Callahan, B. J., McMurdie, P. J., Rosen, M. J., Han, A. W., Johnson, A. J. A., and Holmes, S. P. (2016). DADA2: high-resolution sample inference from Illumina amplicon data. Nat. Methods 13, 581–583. doi: 10.1038/nmeth.3869
Camp Scott Furphy Pty Ltd, (1985). Camp Scott Furphy Pty Ltd, and Associated Firms. Lower Loddon Flood Plain Management Study: Kerang to Little Murray R. Final Report Volume 1, Report prepared for the Rural Water Commission, Victoria and Lower Loddon Municipalities. Chatswood: Camp Scott Furphy Pty Ltd.
Caporaso, J. G., Lauber, C. L., Walters, W. A., Berg-Lyons, D., Huntley, J., Fierer, N., et al. (2012). Ultra-high-throughput microbial community analysis on the Illumina HiSeq and MiSeq platforms. ISME J. 6, 1621–1624. doi: 10.1038/ismej.2012.8
Carnell, P. E., Windecker, S. M., Brenker, M., Baldock, J., Masque, P., Brunt, K., et al. (2018). Carbon stocks, sequestration, and emissions of wetlands in south eastern Australia. Glob. Change Biol. 24, 4173–4184. doi: 10.1111/gcb.14319
Clarke, L., Jiang, K., Akimoto, K., Babiker, M., Blanford, G., Fisher-Vanden, K., et al. (2014). “Assessing transformation pathways,” in Climate Change 2014: Mitigation of Climate Change. Contribution of Working Group III to the Fifth Assessment Report of the Intergovernmental Panel on Climate Change, eds O. Edenhofer, R. Pichs-Madruga, Y. Sokona, E. Farahani, S. Kadner, K. Seyboth, et al. (Cambridge, MA: Cambridge University Press).
Cole, J. J., Prairie, Y. T., Caraco, N. F., McDowell, W. H., Tranvik, L. J., Striegl, R. G., et al. (2007). Plumbing the global carbon cycle: integrating inland waters into the terrestrial carbon budget. Ecosystems 10, 172–185. doi: 10.1007/s10021-006-9013-8
Conacher, A. (2002). A role for geomorphology in integrated catchment management. Aust. Geogr. Stud. 40, 179–195. doi: 10.1111/1467-8470.00173
Conrad, R. (2009). The global methane cycle: recent advances in understanding the microbial processes involved. Environ. Microbiol. Rep. 1, 285–292. doi: 10.1111/j.1758-2229.2009.00038.x
Cook, D. (2014). Vegetation Survey, Mapping and Analysis of Wirra-lo Wetland Complex, Benjeroop. A Report Commissioned by the North Central Catchment Management Authority. Castlemaine: Rakali Ecological Consulting Pty Ltd.
Cosentino, D., Chenu, C., and Le Bissonnais, Y. (2006). Aggregate stability and microbial community dynamics under drying-wetting cycles in a silt loam soil. Soil Biol. Biochem. 38, 2053–2062. doi: 10.1016/j.soilbio.2005.12.022
Davidson, N. C. (2014). How much wetland has the world lost? Long-term and recent trends in global wetland area. Mar. Freshw. Res. 65, 934–941. doi: 10.1071/MF14173
Denef, K., Six, J., Bossuyt, H., Frey, S. D., Elliott, E. T., Roel, M., et al. (2001). Influence of dry-wet cycles on the interrelationship between aggregate, particulate organic matter, and microbial community dynamics. Soil Biol. Biochem. 33, 1599–1611. doi: 10.1016/S0038-0717(01)00076-1
Dooling, G. P., Chapman, P. J., Baird, A. J., Shepherd, M. J., and Kohler, T. (2018). Daytime-Only Measurements Underestimate CH4 Emissions from a Restored Bog. Ecoscience 25, 259–270. doi: 10.1080/11956860.2018.1449442
Ettwig, K. F., Butler, M. K., Le Paslier, D., Pelletier, E., Mangenot, S., Kuypers, M. M. M., et al. (2010). Nitrite-driven anaerobic methane oxidation by oxygenic bacteria. Nature 464, 543–548. doi: 10.1038/nature08883
Evans, C. D., Renou-Wilson, F., and Strack, M. (2016). The role of waterborne carbon in the greenhouse gas balance of drained and re-wetted peatlands. Aquatic Sci. 78, 573–590. doi: 10.1007/s00027-015-0447-y
Faußer, A. C., Dušek, J., Čížková, H., and Kazda, M. (2016). Diurnal dynamics of oxygen and carbon dioxide concentrations in shoots and rhizomes of a perennial in a constructed wetland indicate down-regulation of below ground oxygen consumption. AOB Plants 8:lw025. doi: 10.1093/aobpla/plw025
Foulquier, A., Volat, B., Neyra, M., Bornette, G., and Montuelle, B. (2013). Long-term impact of hydrological regime on structure and functions of microbial communities in riverine wetland sediments. FEMS Microbiol. Ecol. 85, 211–226. doi: 10.1111/1574-6941.12112
Fromin, N., Pinay, G., Montuelle, B., Landais, D., Ourcival, J. M., Joffre, R., et al. (2010). Impact of seasonal sediment desiccation and rewetting on microbial processes involved in greenhouse gas emissions. Ecohydrology 3, 339–348. doi: 10.1002/eco.115
Gerardo-Nieto, O., Vega-Peñaranda, A., Gonzalez-Valencia, R., Alfano-Ojeda, Y., and Thalasso, F. (2019). Continuous measurement of diffusive and ebullitive fluxes of methane in aquatic ecosystems by an open dynamic chamber method. Environ. Sci. Technol. 53, 5159–5167. doi: 10.1021/acs.est.9b00425
Glaring, M. A., Vester, J. K., Lylloff, J. E., Al-Soud, W. A., Soørensen, S. J., and Stougaard, P. (2015). Microbial diversity in a permanently cold and alkaline environment in Greenland. PLoS One 10:e0124863. doi: 10.1371/journal.pone.0124863
Halverson, L. J., Jones, T. M., and Firestone, M. K. (2000). Release of intracellular solutes by four soil bacteria exposed to dilution stress. Soil Sci. Soc. Am. J. 64, 1630–1637. doi: 10.2136/sssaj2000.6451630x
Harrison, B. K., Zhang, H., Berelson, W., and Orphan, V. J. (2009). Variations in archaeal and bacterial diversity associated with the sulfate-methane transition zone in continental margin sediments (Santa Barbara Basin, California). Appl. Environ. Microbiol. 75, 1487–1499. doi: 10.1128/AEM.01812-08
He, G. X., Li, K. H., Liu, X. J., Gong, Y. M., and Hu, Y. K. (2014). Fluxes of methane, carbon dioxide and nitrous oxide in an alpine wetland and an alpine grassland of the Tianshan Mountains, China. J. Arid Land 6, 717–724. doi: 10.1007/s40333-014-0070-0
He, Z., Geng, S., Cai, C., Liu, S., Liu, Y., Pan, Y., et al. (2015). Anaerobic oxidation of methane coupled to nitrite reduction by Halophilic Marine NC10 bacteria. Appl. Environ. Microbiol. 81, 5538–5545. doi: 10.1128/aem.00984-15
Hemes, K. S., Chamberlain, S. D., Eichelmann, E., Knox, S. H., and Baldocchi, D. D. (2018). A biogeochemical compromise: the high methane cost of sequestering carbon in restored Wetlands. Geophys. Res. Lett. 45, 6081–6091. doi: 10.1029/2018GL077747
Hütsch, B. W., Augustin, J., and Merbach, W. (2002). Plant rhizodeposition - An important source for carbon turnover in soils. J. Plant Nutr. Soil Sci. 165, 479–486. doi: 10.1002/1522-2624(200208)165
Jimenez, K. L., Starr, G., Staudhammer, C. L., Schedlbauer, J. L., Loescher, H. W., Malone, S. L., et al. (2012). Carbon dioxide exchange rates from short- and long-hydroperiod Everglades freshwater marsh. J. Geophys. Res. G 117:G04009. doi: 10.1029/2012JG002117
Justine, M. F., Yang, W., Wu, F., Tan, B., Khan, N. M., Zhao, Y., et al. (2015). Biomass stock and carbon sequestration in a chronosequence of Pinus massoniana plantations in the upper reaches of the Yangtze River. Forests 6, 3665–3682. doi: 10.3390/f6103665
Kayranli, B., Scholz, M., Mustafa, A., and Hedmark, Å (2010). Carbon storage and fluxes within freshwater wetlands: a critical review. Wetlands 30, 111–124. doi: 10.1007/s13157-009-0003-4
Kielak, A. M., Barreto, C. C., Kowalchuk, G. A., van Veen, J. A., and Kuramae, E. E. (2016). The ecology of Acidobacteria: moving beyond genes and genomes. Front. Microbiol. 7:744. doi: 10.3389/fmicb.2016.00744
King, G. M., and Weber, C. F. (2007). Distribution, diversity and ecology of aerobic CO-oxidizing bacteria. Nat. Rev. Microbiol. 5, 107–118. doi: 10.1038/nrmicro1595
King, J. Y., and Reeburgh, W. S. (2002). A pulse-labeling experiment to determine the contribution of recent plant photosynthates to net methane emission in arctic wet sedge tundra. Soil Biol. Biochem. 34, 173–180. doi: 10.1016/S0038-0717(01)00164-X
Lal, R. (2007). Carbon management in agricultural soils. Mitigat. Adapt. Strateg. Glob. Change 12, 303–322. doi: 10.1007/s11027-006-9036-7
Lal, R. (2009). Sequestering atmospheric carbon dioxide. Crit. Rev. Plant Sci. 28, 90–96. doi: 10.1080/07352680902782711
Le Mer, J., and Roger, P. (2001). Production, oxidation, emission and consumption of methane by soils: a review;[Production, oxydation, emission et consommation de methane par les sols: revue]. Eur. J. Soil Biol. 37, 25–50. doi: 10.1016/s1164-5563(01)01067-6
Limpens, J., Berendse, F., Blodau, C., Canadell, J. G., Freeman, C., Holden, J., et al. (2008). Peatlands and the carbon cycle: from local processes to global implications - a synthesis. Biogeosciences 5, 1379–1419. doi: 10.5194/bgd-5-1379-2008
Lovelock, C. E. (2008). Soil respiration and belowground carbon allocation in mangrove forests. Ecosystems 11:342. doi: 10.1007/s10021-008-9125-4
Ma, W., Alhassan, A. R. M., Wang, Y., and Xhao, J. (2018). Greenhouse gas emissions as influenced by wetland vegetation degradation along a moisture gradient on the eastern Qinghai-Tibet Plateau of North-West China. Nutr. Cycl. Agroecosyst. 112, 335–354. doi: 10.1007/s10705-018-9950-6
Macreadie, P. I., Nielsen, D. A., Kelleway, J. J., Atwood, T. B., Seymour, J. R., Petrou, K. C., et al. (2017). Can we manage coastal ecosystems to sequester more blue carbon? Front. Ecol. Environ. 15:206–213. doi: 10.1002/fee.1484
Matthews, C. J. D., Joyce, E. M., St. Louis, V. L., Schiff, S. L., Venkiteswaran, J. J., Hall, B. D., et al. (2005). Carbon dioxide and methane production in small reservoirs flooding upland boreal forest. Ecosystems 8:267. doi: 10.1007/s10021-005-0005-x
McCloskey, T. A., Smith, C. G., Liu, K. B., Marot, M., and Haller, C. (2018). How could a freshwater swamp produce a chemical signature characteristic of a Saltmarsh? ACS Earth Space Chem. 1, 9–20. doi: 10.1021/acsearthspacechem.7b00098
McComb, A., and Qiu, S. (1998). “The effects of drying and reflooding on nutrient release from wetland sediments,” in Wetlands in a Dry Land: Understanding for Management, ed. W. D. Williams (Canberra: Environment Australia), 147–159.
McKenzie, N. J., Jacquier, D. W., Ashton, L. J., and Cresswell, H. (2000). Estimation of Soil Properties Using the Atlas of Australian Soils. Technical Report 11/00, CSIRO Land and Water, Canberra, ACT.
McNicol, G., Sturtevant, C. S., Knox, S. H., Dronova, I., Baldocchi, D. D., and Silver, W. L. (2017). Effects of seasonality, transport pathway, and spatial structure on greenhouse gas fluxes in a restored wetland. Glob. Change Biol. 23, 2768–2782. doi: 10.1111/gcb.13580
Meisner, A., Jacquiod, S., Snoek, B. L., Ten Hooven, F. C., and van der Putten, W. H. (2018). Drought legacy effects on the composition of soil fungal and prokaryote communities. Front. Microbiol. 9:294. doi: 10.3389/fmicb.2018.00294
Mikha, M. M., Rice, C. W., and Milliken, G. A. (2005). Carbon and nitrogen mineralization as affected by drying and wetting cycles. Soil Biol. Biochem. 37, 339–347. doi: 10.1016/j.soilbio.2004.08.003
Miller, A. E., Schimel, J. P., Meixner, T., Sickman, J. O., and Melack, J. M. (2005). Episodic rewetting enhances carbon and nitrogen release from chaparral soils. Soil Biol. Biochem. 37, 2195–2204. doi: 10.1016/j.soilbio.2005.03.021
Mitra, S., Wassmann, R., and Vlek, P. L. G. (2005). An appraisal of global wetland area and its organic carbon stock. Curr. Sci. 88, 25–35.
Mitsch, W. J., and Gosselink, J. G. (2015). Wetlands, 5th Edn. New York, NY: John Wiley and Sons, doi: 10.1017/CBO9781107415324.004
Morillas, L., Durán, J., Rodríguez, A., Roales, J., Gallardo, A., Lovett, G. M., et al. (2015). Nitrogen supply modulates the effect of changes in drying-rewetting frequency on soil C and N cycling and greenhouse gas exchange. Glob. Change Biol. 21, 3854–3863. doi: 10.1111/gcb.12956
Morin, T. H., Bohrer, G., Naor-Azrieli, L., Mesi, S., Kenny, W. T., Mitsch, W. J., et al. (2014). The seasonal and diurnal dynamics of methane flux at a created urban wetland. Ecol. Eng. 72, 74–83. doi: 10.1016/j.ecoleng.2014.02.002
Morita, M., Malvankar, N. S., Franks, A. E., Summers, Z. M., Giloteaux, L., Rotaru, A. E., et al. (2011). Potential for direct interspecies electron transfer in methanogenic wastewater digester aggregates. mBio 2:e00159-11. doi: 10.1128/mBio.00159-11
Moyano, F. E., Manzoni, S., and Chenu, C. (2013). Responses of soil heterotrophic respiration to moisture availability: an exploration of processes and models. Soil Biol. Biochem. 59, 72–85. doi: 10.1016/j.soilbio.2013.01.002
Muhr, J., Franke, J., and Borken, W. (2010). Drying-rewetting events reduce C and N losses from a Norway spruce forest floor. Soil Biol. Biochem. 42, 1303–1312. doi: 10.1016/j.soilbio.2010.03.024
Musarika, S., Atherton, C. E., Gomersall, T., Wells, M. J., Kaduk, J., Cumming, A. M. J., et al. (2017). Effect of water table management and elevated CO2 on radish productivity and on CH4 and CO2 fluxes from peatlands converted to agriculture. Sci. Total Environ. 58, 665–672. doi: 10.1016/j.scitotenv.2017.01.094
Nahlik, A. M., and Fennessy, M. S. (2016). Carbon storage in US wetlands. Nat. Commun. 7:13835. doi: 10.1038/ncomms13835
Nahlik, A. M., and Mitsch, W. J. (2011). Methane emissions from tropical freshwater wetlands located in different climatic zones of Costa Rica. Glob. Change Biol. 17, 1321–1334. doi: 10.1111/j.1365-2486.2010.02190.x
National Water Commission, (2008). Australian Water Market Report 2007-2008. Canberra: National Water Commission.
Nazaries, L., Murrell, J. C., Millard, P., Baggs, L., and Singh, B. K. (2013). Methane, microbes and models: fundamental understanding of the soil methane cycle for future predictions. Environ. Microbiol. 15, 2395–2417. doi: 10.1111/1462-2920.12149
Nedrich, S. M., and Burton, G. A. (2017). Indirect effects of climate change on zinc cycling in sediments: the role of changing water levels. Environ. Toxicol. Chem. 36, 2456–2464. doi: 10.1002/etc.3783
Neubauer, S. C., and Megonigal, J. P. (2015). Moving beyond global warming potentials to quantify the climatic role of ecosystems. Ecosystems 674, 67–89. doi: 10.1007/s10021-015-9879-4
North Central CMA Report (2015). North Central CMA Report. Available at: http://www.nccma.vic.gov.au/sites/default/files/publicationsnorth_central_cma_annual_report_2014-2015.pdf (accessed August 28, 2018).
Oertel, C., Matschullat, J., Zurba, K., Zimmermann, F., and Erasmi, S. (2016). Greenhouse gas emissions from soils—A review. Chem. Geochem. 76, 327–352. doi: 10.1016/j.chemer.2016.04.002
Olefeldt, D., Euskirchen, E. S., Harden, J., Kane, E., McGuire, A. D., Waldrop, M. P., et al. (2017). A decade of boreal rich fen greenhouse gas fluxes in response to natural and experimental water table variability. Glob. Change Biol. 23, 2428–2440. doi: 10.1111/gcb.13612
Page, K. L., and Dalal, R. C. (2011). Contribution of natural and drained wetland systems to carbon stocks, CO2, N2O, and CH4 fluxes: an Australian perspective. Soil Res. 49, 377–388. doi: 10.1071/SR11024
Parada, A. E., Needham, D. M., and Fuhrman, J. A. (2016). Every base matters: assessing small subunit rRNA primers for marine microbiomes with mock communities, time series and global field samples. Environ. Microbiol. 18, 1403–1414. doi: 10.1111/1462-2920.13023
Pearse, A. L., Barton, J. L., Lester, R. E., Zawadzki, A., and Macreadie, P. I. (2018). Soil organic carbon variability in Australian temperate freshwater wetlands. Limnol. Oceanogr. 18, 1403–1414. doi: 10.1002/lno.10735
Peel, M. C., Finlayson, B. L., and McMahon, T. A. (2007). Updated world map of the Köppen-Geiger climate classification. Hydrol. Earth Syst. Sci. 11, 1633–1644. doi: 10.5194/hess-11-1633-2007
Pelletier, L., Strachan, I. B., Roulet, N. T., and Garneau, M. (2015). Can boreal peatlands with pools be net sinks for CO2? Environ. Res. Lett. 10:035002. doi: 10.1088/1748-9326/10/3/035002
Poulos, B. (2015). RNAlater Recipe. Available at: https://www.protocols.io/view/RNAlater-Recipe-c56y9d (accessed May 17, 2019).
Rasilo, T., Hutchins, R. H. S., Ruiz-González, C., and del Giorgio, P. A. (2017). Transport and transformation of soil-derived CO2, CH4 and DOC sustain CO2 supersaturation in small boreal streams. Sci. Total Environ. 579, 902–912. doi: 10.1016/j.scitotenv.2016.10.187
Rawat, S. R., Männistö, M. K., Bromberg, Y., and Häggblom, M. M. (2012). Comparative genomic and physiological analysis provides insights into the role of Acidobacteria in organic carbon utilization in Arctic tundra soils. FEMS Microbiol. Ecol. 82, 341–355. doi: 10.1111/j.1574-6941.2012.01381.x
Repo, M. E., Huttunen, J. T., Naumov, A. V., Chichulin, A. V., Lapshina, E. D., Bleuten, W., et al. (2007). Release of CO2 and CH4 from small wetland lakes in western Siberia. Tellus Ser B 59, 788–796. doi: 10.1111/j.1600-0889.2007.00301.x
Rocha, A. V., Potts, D. L., and Goulden, M. L. (2008). Standing litter as a driver of interannual CO2exchange variability in a freshwater marsh. J. Geophys. Res. 113:G04020. doi: 10.1029/2008JG000713
Rochette, P., Ellert, B., Gregorich, E. G., Desjardins, R. L., Patty, E., Lessard, R., et al. (2011). Description of a dynamic closed chamber for measuring soil respiration and its comparison with other techniques. Can. J. Soil Sci. 77, 195–203. doi: 10.4141/s96-110
Schimel, D. (2007). Carbon cycle conundrums. Proc. Natl. Acad. Sci. U.S.A. 104, 18353–18354. doi: 10.1073/pnas.0709331104
Schimel, J., Balser, T. C., and Wallenstein, M. (2007). Microbial stress-response physiology and its implications for ecosystem function. Ecology 88, 1386–1394. doi: 10.1890/06-0219
Segarra, K. E. A., Schubotz, F., Samarkin, V., Yoshinaga, M. Y., Hinrichs, K.-U., Joye, S. B., et al. (2015). High rates of anaerobic methane oxidation in freshwater wetlands reduce potential atmospheric methane emissions. Nat. Commun. 6:7477. doi: 10.1038/ncomms8477
Serrano-Silva, N., Sarria-Guzmán, Y., Dendooven, L., and Luna-Guido, M. (2014). Methanogenesis and methanotrophy in soil: a review. Pedosphere 24, 291–307. doi: 10.1016/S1002-0160(14)60016-3
SKM, (2005). Kerang to Little Murray River Floodplain Management Plan: Assessment of options, report prepared for the North Central Catchment Management Authority by Sinclair Knight Merz. Melbourne: SKM.
Soman, C., Li, D., Wander, M. M., and Kent, A. D. (2017). Long-term fertilizer and crop-rotation treatments differentially affect soil bacterial community structure. Plant Soil 413, 145–159. doi: 10.1007/s11104-016-3083-y
IBM SPSS Inc, (2017). SPSS Statistics for Windows, version 24.0. IBM Corp. Released 2017. Armonk, NY: IBM Corp.
St. Louis, V. L., Kelly, C. A., Duchemin, É, Rudd, J. M., and Rosenberg, D. M. (2000). Reservoir surfaces as sources of greenhouse gases to the atmosphere: a global estimate. Bioscience 50, 766–775.
Strachan, I. B., Nugent, K. A., Crombie, S., and Bonneville, M. C. (2015). Carbon dioxide and methane exchange at a cool-temperate freshwater marsh. Environ. Res. Lett. 10:065006. doi: 10.1088/1748-9326/10/6/065006
Strayer, D. L., and Dudgeon, D. (2010). Freshwater biodiversity conservation: recent progress and future challenges. J. N. Am. Benthol. Soc. 29, 344–358. doi: 10.1899/08-171.1
Ström, L., Ekberg, A., Mastepanov, M., and Christensen, T. R. (2003). The effect of vascular plants on carbon turnover and methane emissions from a tundra wetland. Glob. Change Biol. 9, 1185–1192. doi: 10.1046/j.1365-2486.2003.00655.x
Sun, Z. G., and Liu, J. S. (2007). Development in study of wetland litter decomposition and its responses to global change. Shengtai Xuebao 86, 505–512. doi: 10.1189/jlb.0409230
Tveit, A., Schwacke, R., Svenning, M. M., and Urich, T. (2013). Organic carbon transformations in high-Arctic peat soils: key functions and microorganisms. ISME J. 7, 299–311. doi: 10.1038/ismej.2012.99
Valentine, D. L., and Reeburgh, W. S. (2000). New perspectives on anaerobic methane oxidation. Environ. Microbiol. 2, 477–484. doi: 10.1046/j.1462-2920.2000.00135.x
Van Huissteden, J., Berrittella, C., Parmentier, F. J. W., Mi, Y., Maximov, T. C., and Dolman, A. J. (2011). Methane emissions from permafrost thaw lakes limited by lake drainage. Nat. Clim. Change 2, 119–123. doi: 10.1038/nclimate1101
Vanderklift, M. A., Marcos-Martinez, R., Butler, J. R. A., Coleman, M., Lawrence, A., Prislan, H., et al. (2019). Constraints and opportunities for market-based finance for the restoration and protection of blue carbon ecosystems. Mar. Policy 107:103429. doi: 10.1016/j.marpol.2019.02.001
Venterink, H. O., Davidsson, T. E., Kiehl, K., and Leonardson, L. (2002). Impact of drying and re-wetting on N, P and K dynamics in a wetland soil. Plant Soil 243:119. doi: 10.1023/A:1019993510737
Wagner, D. (2017). Effect of varying soil water potentials on methanogenesis in aerated marshland soils. Sci. Rep. 7:14706. doi: 10.1038/s41598-017-14980-y
Waletzko, E. J., and Mitsch, W. J. (2013). The carbon balance of two riverine wetlands fifteen years after their creation. Wetlands 33, 989–999. doi: 10.1007/s13157-013-0457-2
Wang, C., Xu, X. X., Qu, Z., Wang, H. L., Lin, H. P., Xie, Q. Y., et al. (2011). Micromonospora rhizosphaerae sp. nov., isolated from mangrove rhizosphere soil. Int. J. Syst. Evol. Microbiol. 61(Pt 2), 320–324. doi: 10.1099/ijs.0.020461-0
Wang, X., Song, C., Sun, X., Wang, J., Zhang, X., and Mao, R. (2013). Soil carbon and nitrogen across wetland types in discontinuous permafrost zone of the Xiao Xing’an Mountains, norWang, X., Song, C., Sun, X., Wang, J., Zhang, X., & Mao, R. (2013). Soil carbon and nitrogen across wetland types in discontinuous permafrost. Catena 101, 31–37. doi: 10.1016/j.catena.2012.09.007
Weise, L., Ulrich, A., Moreano, K., Gessler, A., Kayler, Z., Steger, K., et al. (2016). Desiccation and rewetting of lake sediments causes enhanced carbon turnover and shifts in microbial community composition. FEMS Microbiol. Ecol. 92:fiw035. doi: 10.1093/femsec/fiw035
Wiessner, A., Kuschk, P., Nguyen, P. M., and Müller, J. A. (2017). The sulfur depot in the rhizosphere of a common wetland plant, Juncus effusus, can support long-term dynamics of inorganic sulfur transformations. Chemosphere 184, 375–383. doi: 10.1016/j.chemosphere.2017.06.016
Wilson, J. S., and Baldwin, D. S. (2008). Exploring the “Birch effect” in reservoir sediments: influence of inundation history on aerobic nutrient release. Chem. Ecol. 24, 379–386. doi: 10.1080/02757540802497582
Wilson, J. S., Baldwin, D. S., Rees, G. N., and Wilson, B. P. (2011). The effects of short-term inundation on carbon dynamics, microbial community structure and microbial activity in floodplain soil. River Res. Appl. 27, 213–225. doi: 10.1002/rra.1352
Xiang, S. R., Doyle, A., Holden, P. A., and Schimel, J. P. (2008). Drying and rewetting effects on C and N mineralization and microbial activity in surface and subsurface California grassland soils. Soil Biol. Biochem. 40, 2281–2289. doi: 10.1016/j.soilbio.2008.05.004
Yarwood, S. (2018). The role of wetland microorganisms in plant-litter decomposition and soil organic matter formation: a critical review. Microbiol. Ecol. 94:fiy175. doi: 10.1093/femsec/fiy175
Yousefi, A., Allahverdi, A., and Hejazi, P. (2014). Accelerated biodegradation of cured cement paste by Thiobacillus species under simulation condition. Int. Biodeterior. Biodegrad. 86, 317–326. doi: 10.1016/j.ibiod.2013.10.008
Zhang, S., Chang, J., Lin, C., Pan, Y., Cui, K., Zhang, X., et al. (2017). Enhancement of methanogenesis via direct interspecies electron transfer between Geobacteraceae and Methanosaetaceae conducted by granular activated carbon. Bioresour. Technol. 245(Pt A), 132–137. doi: 10.1016/j.biortech.2017.08.111
Zhou, L., Zhou, G., and Jia, Q. (2009). Annual cycle of CO2 exchange over a reed (Phragmites australis) wetland in Northeast China. Aquatic Bot. 91, 91–98. doi: 10.1016/j.aquabot.2009.03.002
Zhou, X. W., Li, S. G., Li, W., Jiang, D. M., Han, K., Wu, Z. H., et al. (2014). Myxobacterial community is a predominant and highly diverse bacterial group in soil niches. Environ. Microbiol. Rep. 6, 45–56. doi: 10.1111/1758-2229.12107
Keywords: 16S diversity, carbon sequestration, environmental watering, floodplains, greenhouse gas emissions, microbial communities, soil organic carbon
Citation: Limpert KE, Carnell PE, Trevathan-Tackett SM and Macreadie PI (2020) Reducing Emissions From Degraded Floodplain Wetlands. Front. Environ. Sci. 8:8. doi: 10.3389/fenvs.2020.00008
Received: 17 May 2019; Accepted: 13 January 2020;
Published: 07 February 2020.
Edited by:
Bernd Lennartz, University of Rostock, GermanyReviewed by:
Britt Dianne Hall, University of Regina, CanadaFereidoun Rezanezhad, University of Waterloo, Canada
Bijendra Man Bajracharya, University of Waterloo, Canada
Copyright © 2020 Limpert, Carnell, Trevathan-Tackett and Macreadie. This is an open-access article distributed under the terms of the Creative Commons Attribution License (CC BY). The use, distribution or reproduction in other forums is permitted, provided the original author(s) and the copyright owner(s) are credited and that the original publication in this journal is cited, in accordance with accepted academic practice. No use, distribution or reproduction is permitted which does not comply with these terms.
*Correspondence: Katy E. Limpert, klimpert@deakin.edu.au; Kelimpert@gmail.com