 E. Pandeeswari
 J. Ravi Sankar*
- Department of Mathematics, School of Advanced Sciences, Vellore Institute of Technology, Vellore, Tamil Nadu, India
Introduction: Breast cancer, one of the most prevalent malignancies in women begins in the milk ducts or lobules and is divided into invasive and non-invasive variants. The kind stage and molecular features of the cancer determine the treatment strategy which may include surgery, chemotherapy, and targeted drugs. Early identification through screening is critical to increasing patient survival rates.
Methods: In this study, we look at the efficacy of numerous breast cancer drugs, including Toremifene, Tucatinib, Ribociclib, Olaparib, Abemaciclib, Anastrozole, Letrozole, Thiotepa, Tamoxifen, and Megestrol Acetate. We investigate their chemical and physical properties, including molar volume (MV), polarizability (P), molar refractivity (MR), polar surface area (PSA), and surface tension (ST). We employ Quantitative Structure Property Relationship (QSPR) analytical approaches, including curvilinear regression and multiple linear regression (MLR), to model and predict the physicochemical properties of these medications by analyzing the impact of molecular descriptors on these properties.
Results: A comparison of the two regression techniques is done to see how accurate their predictions are and to find the best way to model the data. Furthermore, resolving topological indices examines the relationship between molecular structure and therapeutic effectiveness.
Discussion: The outcomes of these studies help to further our understanding of breast cancer treatments and the development of more focused and customized therapeutics.
1 Introduction
Chemical graph theory is an interdisciplinary study that uses principles from chemistry and graph theory to investigate the structural features of chemical molecules. Researchers can investigate molecular stability, reactivity, and spectrum features by portraying molecules as graphs with atoms as vertices and bonds as edges. This technique not only helps to comprehend complicated chemical processes, but it also makes it easier to develop novel materials and medications by shedding light on the links between molecular structure and function (Liu, 2022).
The investigation of resolving sets and metric dimensions in chemical graph theory provides important insights into the discovery and characterisation of molecular structures. A resolving set is a subset of vertices in a graph that can be uniquely recognized by its distances to the other vertices in the set. This idea is critical in understanding how distinct atoms within a molecule may be identified based on connectedness, which is required for predicting chemical behavior and reactivity. The metric dimension, which is defined as the smallest size of a resolving set for a given graph, measures the effectiveness of this identification method.
The concept of metric dimension in graph theory, proposed by (Slater, 1975), is closely related to the concept of a resolving set, which is a collection of vertices that uniquely identify all other vertices based on their distance (Harary and Melter, 1976). defined the metric dimension as the size of the smallest resolving set in a graph. This notion has implications in network theory and molecular graph analysis, where resolving sets aid in identifying chemical structures. Metric dimension and resolving sets remain significant techniques in graph theory, with applications in cheminformatics and structural biology. These significant materials continue to be important in the study of graph based models across a variety of scientific disciplines.
Degree based topological indices, which depend on vertex degrees in molecular networks, are widely used to predict chemical characteristics and biological activities (Randic, 1975). proposed the Randić index, which is defined as
Predicting the physicochemical characteristics of medicines using different regression models has been the subject of several papers. Linear regression models and degree-related topological indices are used to evaluate kidney cancer drugs. Havare recently used three regression models and degree-related metrics to assess cancer drugs (Havare, 2021). The characteristics of cancer drugs are closely connected, according to quadratic regression. Cancer characteristics, like molar volume, polarizability, and molar refractivity, are more strongly correlated than previously thought. Kirmani et al. identified 10 features of antiviral drugs by using 11 degree-related TIs (Kirmani et al., 2021). In 2021, Liu et al. studied the chemical structures of coronavirus treatments using 15 distinct indices (Liu and Singaraj, 2021). Rauf et al. examined the COVID-19 drug structure’s molar refractivity, polar surface area, and molar volume with basic and multiple linear regression (Rauf et al., 2023a; Rao et al., 2024). Similarly, regression models and topological indices are used to study the structures of many drugs (Kumar and Das, 2024). This work investigates the use of topological indices, namely, hydrogen representation, to predict the physicochemical features of TCA medications (Kour and Ravi Sankar, 2025). This study uses distance-based topological indices and QSPR analysis to analyze the physicochemical characteristics of tricyclic antidepressant medications, stressing their importance in structure-property prediction (Kour and Sankar, 2025). Machine learning with distance-based topological indices from hydrogen-depleted networks allows for reliable QSPR prediction of anticancer drug characteristics, which aids efficient drug development (Kour et al., 2024). In QSPR modeling, graph-theoretical descriptors have proven useful, as demonstrated by earlier research, such as our work on NSAIDs employing Degcity indices (Pandeeswari et al., 2025; Kara et al., 2025a) used topological polynomials and indices to analyze lung cancer medicines and found high connections with physicochemical attributes and prediction accuracy. These findings support the use of topological indices as credible descriptors in chemical graph theory. Similarly, Arockiaraj et al. (2025) used degree and neighborhood degree sum topological indices to analyze cancer drug structures, proving their great prediction abilities using QSPR models. These findings further support the use of topological indices as trustworthy descriptors in molecular property estimation (Hakeem et al., 2025). Topological modeling and QSPR analysis were utilized to forecast the physicochemical features of bioactive polyphenols. These results show that degree-based indices may successfully link molecular structure to physical characteristics, which aids medication design. Furthermore, Kara et al. (2025b) neighborhood eccentricity-based indices have been used to COVID-19 drugs, yielding good correlations with physicochemical parameters and confirming the use of topological descriptors in drug design. In our earlier study (Pandeeswari and Ravi Sankar, 2025), we used chemical graph theory to investigate the vertex and edge metric dimensions of several breast cancer drug structures in detail. This fundamental study establishes a formal framework for using metric dimension notions to define molecular structures and improve predictive modeling. This study also expands on previous research Sooryanarayana et al. (2022), such as the resolving topological indices created for standard networks and their use in silicate structures, by applying the approach to breast cancer drugs. Existing indices, such as the Zagreb indices and metric dimension ideas, serve as standards. The novelty is in using these indices for medicinal compounds and combining them with modern computational tools such as LR and MLR to improve predictive modeling. Collectively, these investigations demonstrate topological indices efficacy as trustworthy and cost-effective descriptors in chemical graph theory. In this work, we explore the use of resolving topological indices to examine the physicochemical properties of drugs used to treat breast cancer. These articles represent a link between mathematics and pharmaceuticals.
The purpose of this study is to investigate the possibility for resolving topological indices in the computational analysis of breast cancer medications. Resolving indices, developed from graph theory, offer new insights into molecule structures by capturing their topological characteristics. This study employs these indices along with QSAR/QSPR approaches to simulate important physicochemical properties of breast cancer drugs, which can serve as a basis for future studies aimed at predicting pharmacological efficacy. This work stresses the importance of mathematical modeling and computational approaches in aiding drug development and generating insights that may eventually lead to specific cancer treatment options.
To the best of our knowledge, this is the first systematic research that uses resolving topological indices in QSPR modeling of breast cancer drugs. By including these indicators into regression models, the current study not only demonstrates their predictive power, but also gives new perspectives on the structural determinants of breast cancer drug efficacy.
2 Preliminaries
This section introduces the fundamental ideas and terminologies used in the study of chemical graphs. This covers definitions for resolving sets, metric dimensions, and resolving degree-based topological indices, all of which are required to comprehend molecular graph structure analysis. Lemma 1 offers a theoretical basis for computing resolving degree-based topological indices. These indices are useful tools in molecular characterization, since they assist in predicting molecular behavior and bio activity.
2.1 Resolving set and metric dimensions in chemical graph
Let
1.
2. For each atom
is unique. Here,
A resolving set with the minimum cardinality is called a metric basis, and the size of this metric basis is referred to as the metric dimension of the molecular graph
2.2 Degree related resolving topological indices of molecular graphs
Lemma 1. Sooryanarayana et al. (2022) For every vertex v of a connected graph G,
2.3 Remark
In view of Lemma 1, the above Equations 1–5 can be written as.
Where
Theorem 1. Let
Proof. Let
Now we define, The resolving degree of a vertex
Let
For the graph
We calculate the following quantities:
Substituting the above values into the Equations 6-10 for resolving degree based topological indices, we get:
Thus, the resolving degree-based topological indices of
Similarly, for other well-known breast cancer drugs, the corresponding graph invariants are calculated and presented in Tables 1, 2.
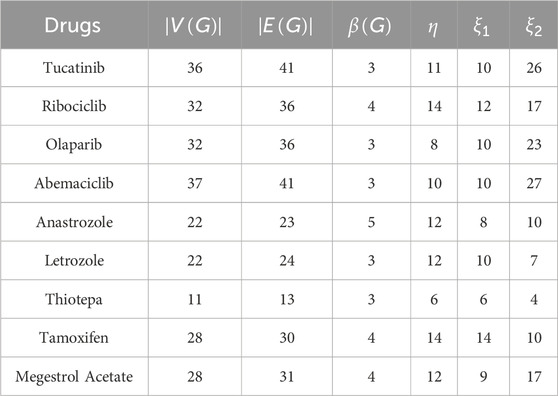
Table 1. Graph invariants for different breast cancer drugs.
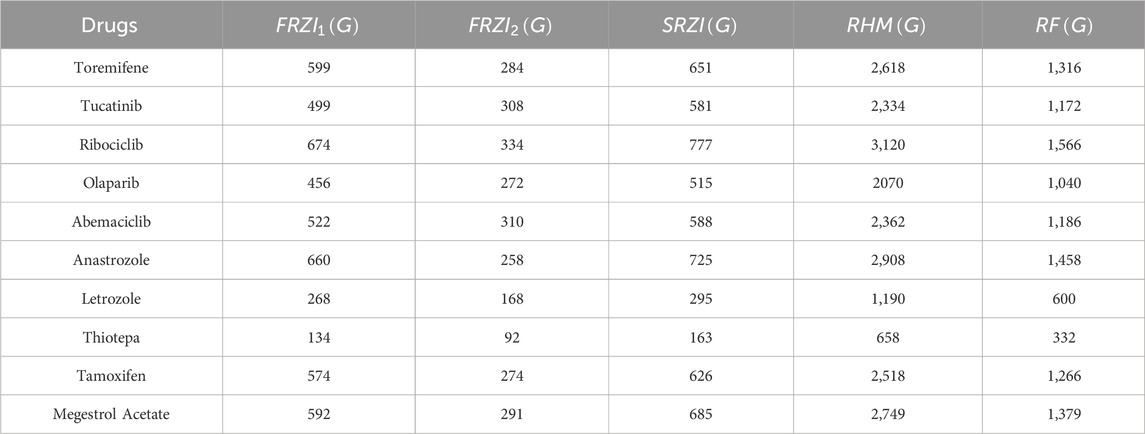
Table 2. Obtained values of the resolving degree-based topological indices of breast cancer drugs.
3 Materials and methods
Resolving degree-based topological indices (RTIs) and statistical analysis are the two types of computations used in this study. ChemSpider provides the experimental findings, while JMP software and Excel are used for the statistical analysis. We can gain a deeper comprehension of chemical structures and behavior by employing these techniques and tools. This work uses resolving degree-based topological indices to analyze the chemical structures of drugs used to treat breast cancer. These indices of QSPR analysis are discussed and the results show a striking relationship with the physical characteristics of the chemical compounds used to treat breast cancer. This study focuses on ten drugs: Toremifene, Tucatinib, Ribociclib, Olaparib, Abemaciclib, Anastrozole, Letrozole, Thiotepa, Tamoxifen, and Megestrol Acetate. Figure 1 illustrates the chemical structures of these compounds. The particular physicochemical properties of breast cancer drugs are included in Table 3, which also provides helpful details regarding the molecular structure and therapeutic use of these drugs.
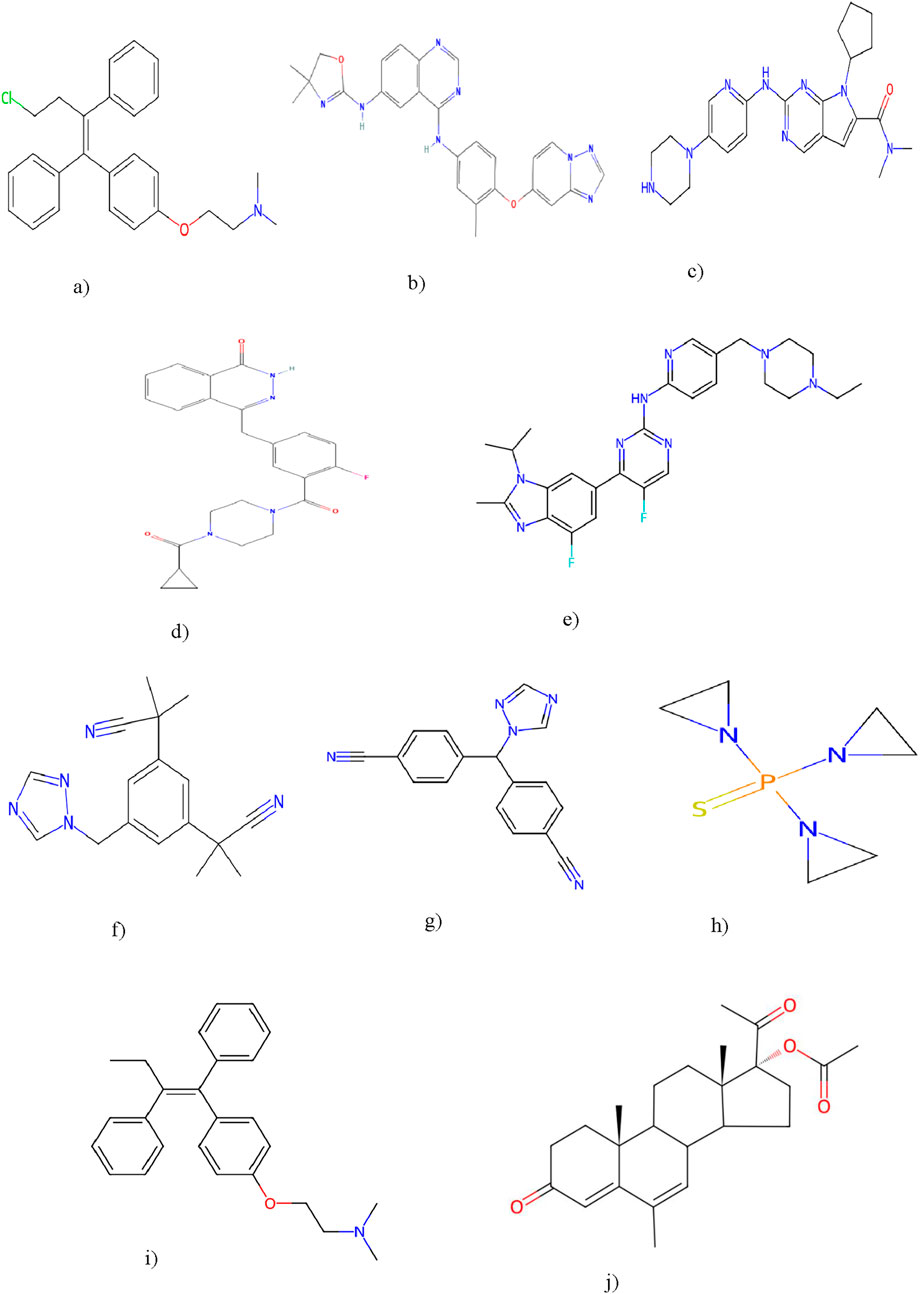
Figure 1. Breast cancer drugs: Toremifene, Tucatinib, Ribociclib, Olaparib, Abemaciclib, Anastrozole, Letrozole, Thiotepa, Tamoxifen, Megestrol Acetate. (a) Toremefine. (b) Tucatinib. (c) Ribociclib. (d) Olaparib. (e) Abemaciclib. (f) Anastrozole. (g) Letrozole. (h) Thiotepa. (i) Tamoxifen. (j) Megestrol acetate.
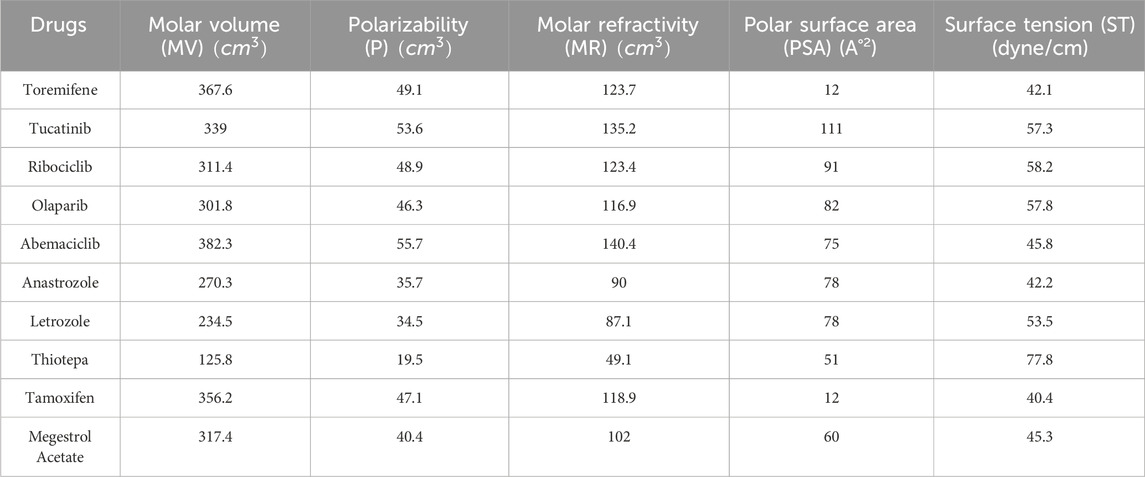
Table 3. Physicochemical properties of the breast cancer drugs.
3.1 Curvilinear regression analysis of drugs for breast cancer
The relationship between a dependent variable (represented by P) and one or more independent variables (represented by RTI) is described by a linear regression model. The independent variables are also called explanatory or predictive variables, and the dependent variable is also called the response variable. In statistical analysis, this model is frequently used to comprehend how one or more independent variables affect the dependent variable. Although this manuscript focuses on linear, quadratic, and cubic regression analysis and its associated parameters, there are other kinds of regression models as well. A variation of linear regression is the quadratic regression and cubic regression model. These model equations are described as follows:
Where RTI is the topological index,
Tables 4-6 present the correlation coefficients (R) obtained from linear, quadratic, and cubic regression models, respectively, highlighting the relationship between resolving topological indices and the physicochemical properties of breast cancer drugs. There are several parameters utilized to retrieve the findings. Tables 7–9 show the linear, quadratic, and cubic regression equations for the greatest fitting and predictability of resolving topological indices, including correlation coefficient value (R), F-statistics, and SE. The correlation coefficient (R) is a statistical metric that describes the strength and direction of a relationship between resolving topological indices and the physicochemical properties. It is expressed as a positive or negative integer between −1 and 1. The number’s value denotes the strength of the association; r = 0 means there is no relationship. All correlation coefficients are more than .7, indicating a significant positive association between the two quantities. The correlation values are negative, indicating an inverse relationship. The p-values measure the strength of the correlation. If the values of p are less than 0.05, the findings of the experiments are significant. Tables show that all resolving topological indices and breast cancer drug features have p-values
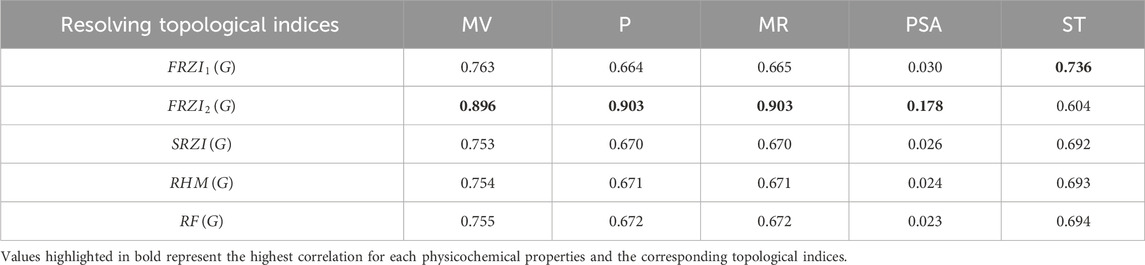
Table 4. The correlation coefficient (R) was obtained utilizing linear regression models.
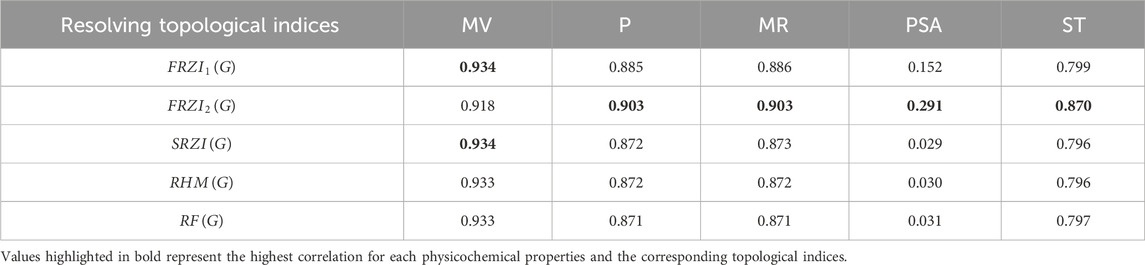
Table 5. The correlation coefficient (R) was obtained utilizing quadratic regression models.

Table 6. The correlation coefficient (R) was obtained utilizing cubic regression models.
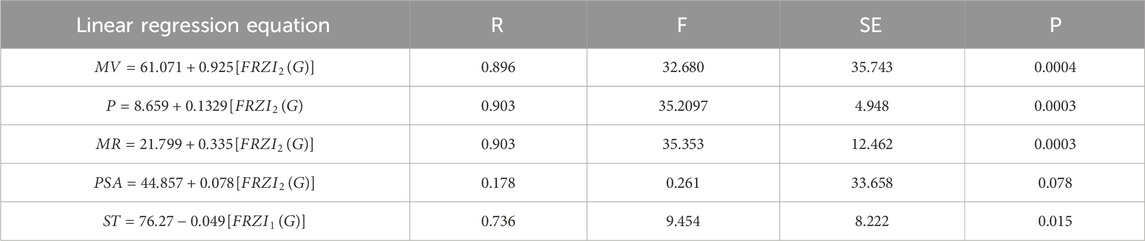
Table 7. Linear regression equations offer the most precise estimates of physicochemical properties.
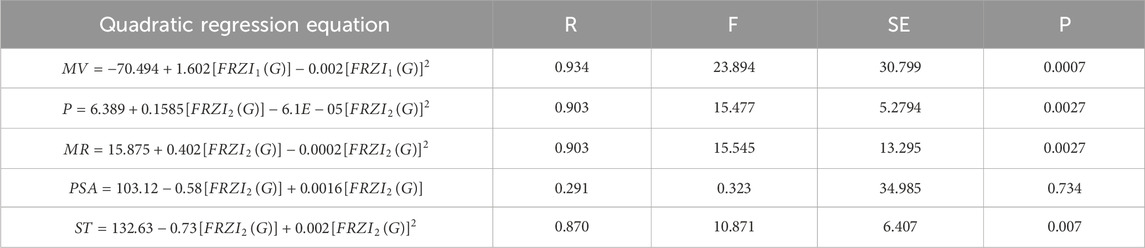
Table 8. Quadratic regression equations offer the most precise estimates of physicochemical properties.
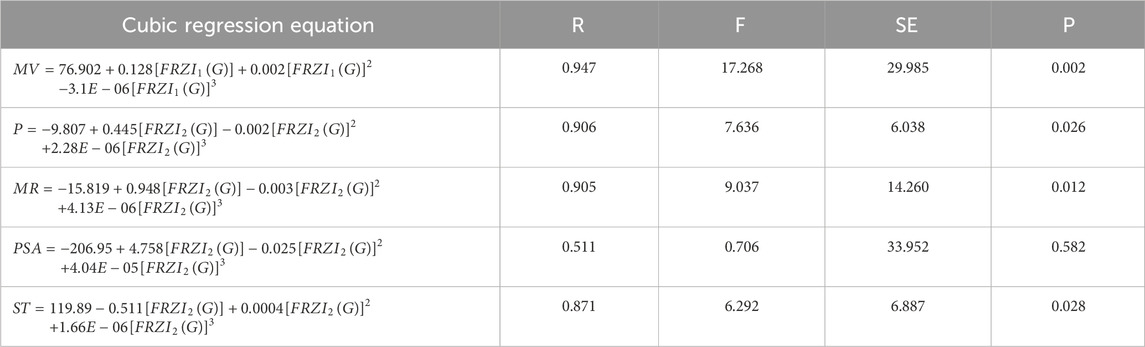
Table 9. Cubic regression equations offer the most precise estimates of physicochemical properties.
3.1.1 Results
In the linear regression model,
In the quadratic regression model,
For the cubic regression model,
When linear, quadratic, and cubic regression models are compared, the cubic regression model outperforms them all in terms of predicting physicochemical qualities based on resolving topological indices. As shown in Figure 2, the cubic model regularly produces the greatest correlation coefficients (R), especially for indices such as
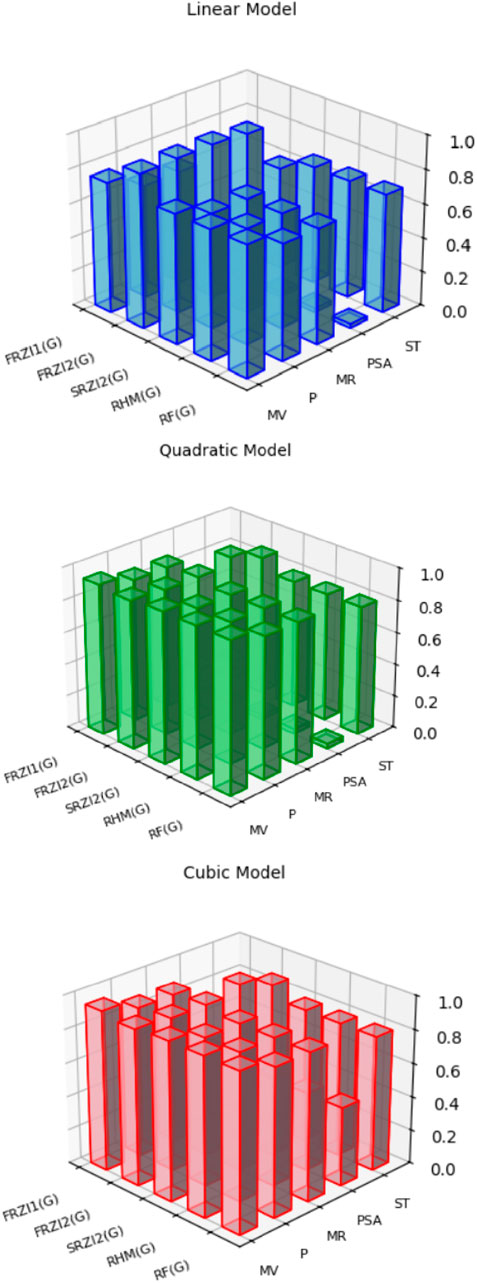
Figure 2. Graphical illustration of the correlation strength between resolving topological indices and physicochemical properties using linear, quadratic, cubic regression analysis.
3.2 Multiple linear regression model
Multiple linear regression is a statistical approach for examining the connection between a dependent variable and several independent variables, modeling how predictors impact the outcome, and quantifying their effects.
Using the Variance Inflation Factor (VIF), multicollinearity among the chosen topological descriptors was assessed in all MLR models. Multicollinearity occurs when two or more independent variables in a regression model are strongly correlated, affecting the predicted coefficients. The Variance Inflation Factor (VIF) detects multicollinearity and is computed as:
where
where
R = 0.90,
R = 0.968,
R = 0.953,
R = 0.365,
R = 0.744,
3.2.1 Results of multiple linear regression (MLR) analysis
The multiple linear regression (MLR) model was created to study the connection between the dependent variable and the chosen resolving topological indices.
These findings emphasize the distinct contributions of each descriptor to the model. Figure 3 shows predicted values for resolving topological indices and molecular descriptors such as MV, P, MR, PSA, and ST obtained from the MLR study, demonstrating the relationship between these variables and the model’s prediction accuracy.
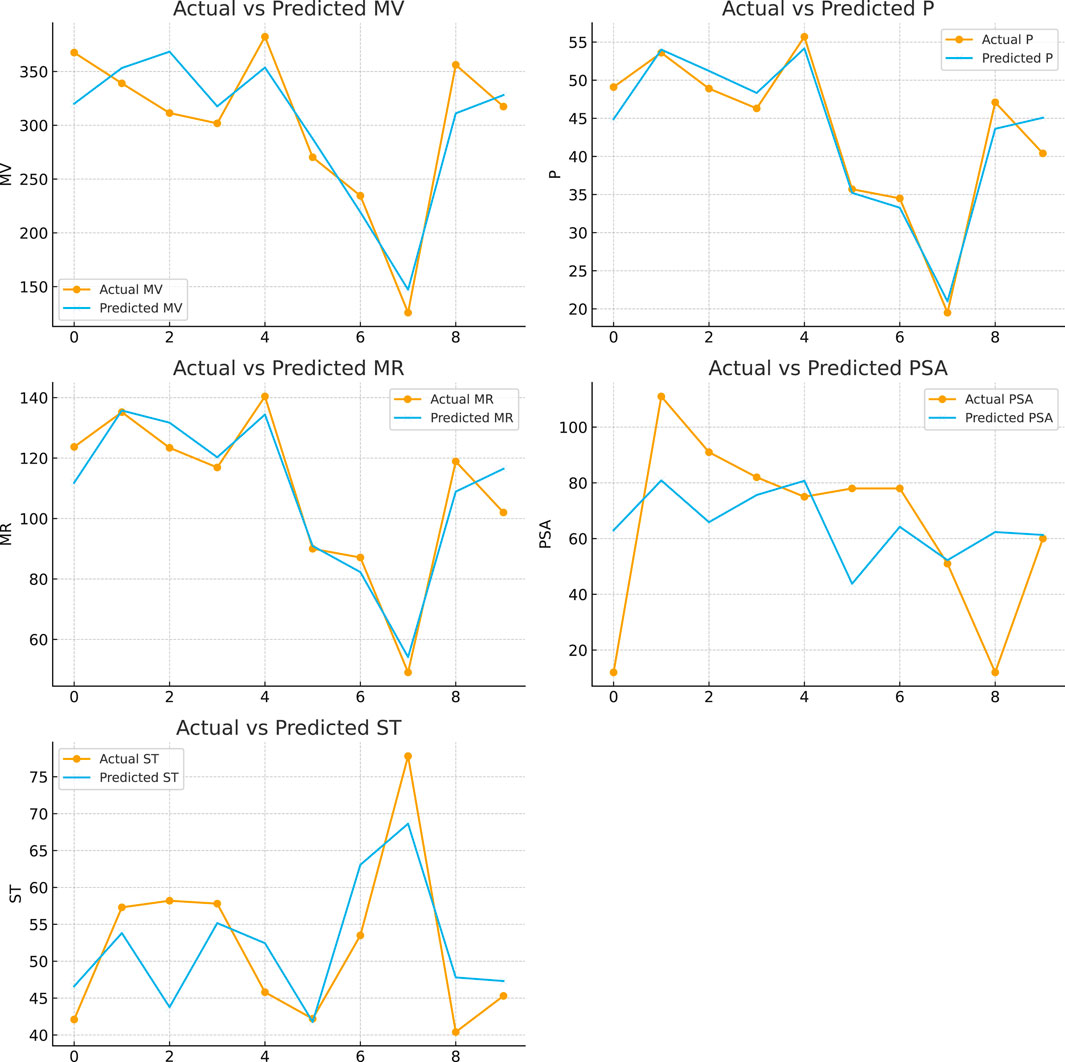
Figure 3. Plots of predicted values of resolving topological indices and MV, P, MR, PSA and ST from MLR analysis.
4 Discussion
We used linear, quadratic, and cubic regression models to see how well resolving topological indices could predict future events in this study. The results showed that
To evaluate the predictive power of each model in simulating the link between resolving topological indices and physicochemical properties, the performance of linear, quadratic, cubic, and multiple linear regression (MLR) models was examined (Table 10). All things considered, the comparison demonstrates that MLR is the best modeling strategy for this dataset, whereas PSA plays an insignificant role in drug activity estimates. In the case of PSA, the regression model demonstrated less statistical significance (p
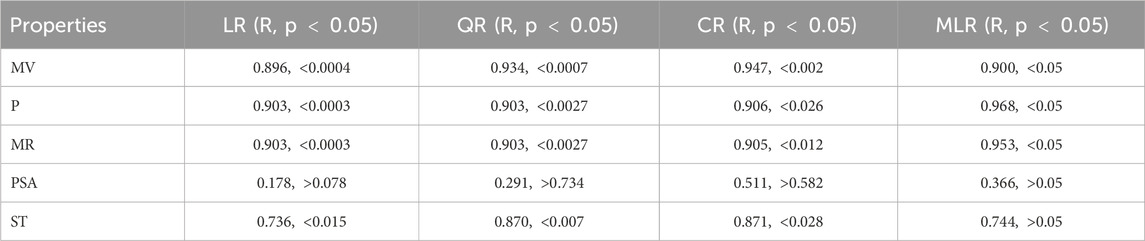
Table 10. Comparative results of linear, quadratic, cubic, and MLR models for molecular properties.
Several research studies have investigated the use of topological indices to predict the physicochemical features of breast cancer drugs. For example, standard degree-based topological indices were used for breast cancer drugs and found strong correlations with certain physicochemical properties [Bokhary et al., 2022; Shanmukha et al., 2022; Meharban et al., 2024). Entire neighborhood topological indices were then developed, using cubic and multiple regression approaches, and these exhibited better relationships with drug attributes (Altassan et al., 2025). CoM-polynomial-based indices were also examined, computing variable topological coindices, and several indices showed significant predictive capacity using curvilinear regression analysis (Öztürk Sözen and Eryaşar, 2024). More recently, entropy-based indices were developed using both linear and cubic regression techniques, and specific entropy indices were found to substantially predict attributes such as boiling point, molar volume, and melting point (Rauf et al., 2023b). While these studies demonstrate the adaptability of topological indices in QSPR modeling of breast cancer drugs, the majority use standard degree-based indices, neighborhood indices, or entropy-based indices. In contrast, the current study highlights the use of resolving topological indices, which offer a new perspective by merging structural uniqueness and molecular symmetry into the characterization of chemical graphs. This technique adds a new dimension to QSPR research, potentially improving predicted accuracy and offering more insight into drug features. Compared to previous research, our work broadens the field of topological index applications by looking at the efficacy of resolving indices for breast cancer drugs. The findings suggest that resolving indices may be useful descriptors in chemical graph theory, supplementing and expanding the predictive power of previously examined indices.
5 Conclusion
In this study, we used both linear and multiple linear regression (MLR) models to examine the relationship between resolving topological indices and important physicochemical properties of drugs used to treat breast cancer. According to the results of linear regression, indices like
5.1 Implications
Drug activity prediction for breast cancer may be enhanced by QSPR modeling and resolving topological indices, enabling safer and more efficient treatment approaches. Understanding molecular descriptors can help pharmacists and chemists optimize medication discovery and design, which will ultimately result in more individualized and accurate cancer treatments.
5.2 Limitation
The primary limitation of this study is the limited dataset of ten breast cancer drugs, which constrains the generalizability of the regression findings. The limited sample size may not accurately represent the extensive chemical and therapeutic diversity of breast cancer treatments. Nonetheless, the selected drugs were incorporated due to the availability of reliable experimental data and their significance as clinically important therapies. Although the models offer valuable insights into the correlation between resolving topological indices and drug activity, it is crucial to expand the dataset in future studies to enhance robustness, validate findings, and improve predictive accuracy.
Data availability statement
The original contributions presented in the study are included in the article/supplementary material, further inquiries can be directed to the corresponding author.
Author contributions
EP: Conceptualization, Formal Analysis, Investigation, Methodology, Software, Validation, Writing – original draft. JR: Conceptualization, Resources, Supervision, Validation, Writing – review and editing.
Funding
The author(s) declare that no financial support was received for the research and/or publication of this article.
Acknowledgments
AcknowledgementsThe authors would like to take this opportunity to thank the management of Vellore Institute of Technology, Vellore, Tamil Nadu, India, for providing the necessary facilities and encouragement to carry out this work.
Conflict of interest
The authors declare that the research was conducted in the absence of any commercial or financial relationships that could be construed as a potential conflict of interest.
Generative AI statement
The author(s) declare that no Generative AI was used in the creation of this manuscript.
Any alternative text (alt text) provided alongside figures in this article has been generated by Frontiers with the support of artificial intelligence and reasonable efforts have been made to ensure accuracy, including review by the authors wherever possible. If you identify any issues, please contact us.
Publisher’s note
All claims expressed in this article are solely those of the authors and do not necessarily represent those of their affiliated organizations, or those of the publisher, the editors and the reviewers. Any product that may be evaluated in this article, or claim that may be made by its manufacturer, is not guaranteed or endorsed by the publisher.
References
Altassan, A., Saleh, A., Alashwali, H., Hamed, M., and Muthana, N. (2025). Exploring qspr in breast cancer drugs via entire neighborhood indices and regression models. Sci. Rep. 15, 26683. doi:10.1038/s41598-025-12179-0
Arockiaraj, M., Godlin, J. J., and Radha, S. (2025). Comparative study of degree and neighborhood degree sum-based topological indices for predicting physicochemical properties of skin cancer drug structures. Mod. Phys. Lett. B 39, 2550106. doi:10.1142/S0217984925501064
Bokhary, S. A. U. H., Siddiqui, M. K., and Cancan, M. (2022). On topological indices and qspr analysis of drugs used for the treatment of breast cancer. Polycycl. Aromat. Compd. 42, 6233–6253. doi:10.1080/10406638.2021.1977353
Bommahalli Jayaraman, B., and Siddiqui, M. K. (2024). Exploring the properties of antituberculosis drugs through qspr graph models and domination-based topological descriptors. Sci. Rep. 14, 24387. doi:10.1038/s41598-024-73918-3
Chang, Y.-H., Chen, J.-Y., Hor, C.-Y., Chuang, Y.-C., Yang, C.-B., and Yang, C.-N. (2013). Computational study of estrogen receptor-alpha antagonist with three-dimensional quantitative structure-activity relationship, support vector regression, and linear regression methods. Int. J. Med. Chem. 2013, 1–13. doi:10.1155/2013/743139
Gutman, I., and Trinajstić, N. (1972). Graph theory and molecular orbitals. Total φ-electron energy of alternant hydrocarbons. Chem. Phys. Lett. 17, 535–538. doi:10.1016/0009-2614(72)85099-1
Hakeem, A., Ullah, A., Zaman, S., Mahmoud, E. E., Ahmad, H., Ali, P., et al. (2025). Topological modeling and qspr based prediction of physicochemical properties of bioactive polyphenols. Sci. Rep. 15, 27466. doi:10.1038/.s41598-025-11863-5
Havare, Ö. Ç. (2021). Topological indices and qspr modeling of some novel drugs used in the cancer treatment. Int. J. Quantum Chem. 121, e26813. doi:10.1002/qua.26813
Kara, Y., Özkan, Y. S., and Arockiaraj, M. (2025a). Computational insights and predictive models for lung cancer molecular structures. Chem. Pap. 79, 1869–1878. doi:10.1007/s11696-025-03894-z
Kara, Y., Özkan, Y. S., Ullah, A., Hamed, Y. S., and Belay, M. B. (2025b). Qspr modeling of some covid-19 drugs using neighborhood eccentricity-based topological indices: a comparative analysis. PLoS One 20, e0321359. doi:10.1371/journal.pone.0321359
Karampuri, A., and Perugu, S. (2024). A breast cancer-specific combinational qsar model development using machine learning and deep learning approaches. Front. Bioinforma. 3, 1328262. doi:10.3389/fbinf.2023.1328262
Kirmani, S. A. K., Ali, P., and Azam, F. (2021). Topological indices and qspr/qsar analysis of some antiviral drugs being investigated for the treatment of covid-19 patients. Int. J. Quantum Chem. 121, e26594. doi:10.1002/qua.26594
Kour, S., and J., R. S. (2024). Machine learning regression models for predicting anti-cancer drug properties: insights from topological indices in qspr analysis. Contemp. Math., 6515–6526doi. doi:10.37256/cm.5420245826
Kour, S., and Ravi Sankar, J. (2025). Hydrogen-centric machine learning approach for analyzing properties of tricyclic anti-depressant drugs. Front. Chem. 13, 1603948. doi:10.3389/fchem.2025.1603948
Kour, S., and Sankar, J. R. (2025). Characterization of tricyclic anti-depressant drugs efficacy via topological indices. Sci. Rep. 15, 22853. doi:10.1038/s41598-025-05045-6
Kumar, V., and Das, S. (2024). Comparative study of gq and qg indices as potentially favorable molecular descriptors. Int. J. Quantum Chem. 124, e27334. doi:10.1002/qua.27334
Liu, J. B. (2022). Novel applications of graph theory in chemistry and drug designing. Comb. Chem. and High Throughput Screen. 25, 439–440. doi:10.2174/1386207325666220104223136
Liu, J.-B., and Singaraj, R. M. (2021). Topological analysis of para-line graph of remdesivir used in the prevention of corona virus. Int. J. Quantum Chem. 121, e26778. doi:10.1002/qua.26778
Mahboob, A., Rasheed, M. W., Hanif, I., Amin, L., and Alameri, A. (2024). Role of molecular descriptors in quantitative structure-property relationship analysis of kidney cancer therapeutics. Int. J. Quantum Chem. 124, e27241. doi:10.1002/qua.27241
Meharban, S., Ullah, A., Zaman, S., Hamraz, A., and Razaq, A. (2024). Molecular structural modeling and physical characteristics of anti-breast cancer drugs via some novel topological descriptors and regression models. Curr. Res. Struct. Biol. 7, 100134. doi:10.1016/j.crstbi.2024.100134
Öztürk Sözen, E., and Eryaşar, E. (2024). An algebraic approach to calculate some topological coindices and qspr analysis of some novel drugs used in the treatment of breast cancer. Polycycl. Aromat. Compd. 44, 2226–2243. doi:10.1080/10406638.2023.2214286
Pandeeswari, E., and Ravi Sankar, J. (2025). Investigating metric and edge metric resolvability in molecular structures of breast cancer therapeutics. Malays. J. Math. Sci. 19, 1079–1110. doi:10.47836/mjms.19.3.16
Pandeeswari, E., and Sankar J, R. (2025). Computational approaches to predict nsaid characteristics using degcity indices and qspr analysis. Contemp. Math., 1331–1346doi. doi:10.37256/cm.6120255205
Randic, M. (1975). Characterization of molecular branching. J. Am. Chem. Soc. 97, 6609–6615. doi:10.1021/ja00856a001
Rao, Y., Chen, R., Ahmad, H., and Ahmad, U. (2024). Reverse zagreb indices and their application in the evaluation of physiochemical properties of anticancer/antibacterial drugs. ACS omega 9, 31056–31080. doi:10.1021/acsomega.4c04409
Rauf, A., Naeem, M., and Hanif, A. (2023a). Quantitative structure–properties relationship analysis of eigen-value-based indices using covid-19 drugs structure. Int. J. Quantum Chem. 123, e27030. doi:10.1002/qua.27030
Rauf, A., Naeem, M., Rahman, J., and Saleem, A. V. (2023b). Qspr study of ve-degree based end vertice edge entropy indices with physio-chemical properties of breast cancer drugs. Polycycl. Aromat. Compd. 43, 4170–4183. doi:10.1080/10406638.2022.2086272
Sardar, M. S., and Hakami, K. H. (2024). Qspr analysis of some alzheimer’s compounds via topological indices and regression models. J. Chem. 2024, 5520607. doi:10.1155/2024/5520607
Shanmukha, M., Usha, A., Praveen, B., and Douhadji, A. (2022). Degree-Based molecular descriptors and QSPR analysis of breast cancer drugs. J. Math. 2022, 5880011. doi:10.1155/2022/5880011
Sooryanarayana, B., Chandrakala, S. B., Roshini, G. R., and Kumar, M. V. (2022). Resolving topological indices of graphs. Iran. J. Math. Chem. 13, 201–226. doi:10.22052/ijmc.2022.242888.1567
P, U. P., Suresh, M., Tolasa, F. T., and Bonyah, E. (2024). Qspr/Qsar study of antiviral drugs modeled as multigraphs by using ti’s and mlr method to treat covid-19 disease. Sci. Rep. 14, 1–14. doi:10.1038/s41598-024-63007-w
Keywords: resolving set, metric dimension, resolving degree, resolving topological indices, regression models, QSPR study
Citation: Pandeeswari E and Ravi Sankar J (2025) Topological insights into breast cancer drugs: a QSPR approach using resolving topological indices. Front. Chem. 13:1710442. doi: 10.3389/fchem.2025.1710442
Received: 22 September 2025; Accepted: 14 October 2025;
Published: 29 October 2025.
Edited by:
Renjith Thomas, Mahatma Gandhi University, IndiaReviewed by:
Yeşim Sağlam Özkan, Bursa Uludag Universitesi, TürkiyeZonghuang Xu, University of Nanking, China
Copyright © 2025 Pandeeswari and Ravi Sankar. This is an open-access article distributed under the terms of the Creative Commons Attribution License (CC BY). The use, distribution or reproduction in other forums is permitted, provided the original author(s) and the copyright owner(s) are credited and that the original publication in this journal is cited, in accordance with accepted academic practice. No use, distribution or reproduction is permitted which does not comply with these terms.
*Correspondence: J. Ravi Sankar, cmF2aXNhbmthci5qQHZpdC5hYy5pbg==