 Wei Wang1,2
 Shuo Yang
- 1Faculty of Architecture and Engineering, Beijing University of Technology, Beijing, China
- 2China Railway Shanghai Engineering Group Co., Ltd., Shanghai, China
- 3School of Civil Engineering, Xuzhou University of Technology, Xuzhou, China
- 4School of Safety Engineering, China University of Mining and Technology, Xuzhou, China
As the development of deep underground engineering in modern days (i.e., exploitation of geo-energy and underground constructions), a higher demand arises for an accurate prediction of ground deformation and stability. For jointed rock mass with anisotropy, stress field and the structure of surrounding rock mass change with the underground construction, for example, during deep-ground tunnel excavation which is associated with ground depth and joint angles. Currently, it is difficult to reasonably predict localized deformation of jointed rock mass with existing theory. In this paper, characteristics of strength and failure mechanism of pre-holed jointed rock mass is experimentally investigated by adopting the digital image correlation and acoustic emission methods. The role of buried depth is considered with confining boundary applied during experiments. To precisely characterize deformation patterns and capture cracking via DIC, tests on DIC parameters and analysis algorithms are further carried out. Results show that joint inclination and confining condition exert a notable influence on the mechanical properties and failure behaviour of rock masses with centering holes. Rock mass exhibits ductile failure while applied with a confined boundary. The confining associated with buried depth in practical would pose an influence on the strength of the rock in particular for oblique jointed situations. The perpendicular-jointed condition poses the most significant risk in both shallow and deep buried conditions due to its relatively lower strength and the maintained brittle failure mode.
1 Introduction
In geotechnical applications of hydrologic infrastructure, civil engineering, transportation systems, and mining operations, the interplay between material strength characteristics and failure modes in rock matrices critically influences rock mass stability, requiring balanced considerations of structural integrity and economic efficiency. Particularly in deep ground excavations such as tunnel systems and coal mining, discontinuous joint systems exhibit a pronounced impact on surrounding rock deformation (Li et al., 2025; Panthee et al., 2016). Mechanical disturbances during excavation processes in jointed rock masses commonly trigger crack initiation, propagation, and interconnection of pre-existing discontinuities adjacent to tunnel profiles, ultimately leading to progressive failure mechanisms in surrounding geological formations (Liu et al., 2025; Zheng et al., 2023). Systematic investigation of strength degradation patterns, deformation characteristics, fracture development sequences in discontinuous jointed rock mass under excavation loading as well as the role of boundary confining in relation to the buried depth provides crucial insights into the spatiotemporal evolution of rock mass instability.
Rock masses are intrinsically structural discontinuities with the presence of internal joints and fractures, significantly influencing mechanical behaviour under complex stress conditions, leading to local stress concentration and unpredictable failure modes posing a challenge to engineering safety (Feng et al., 2019; Yang et al., 2022). Currently, laboratory experiments and numerical simulations are often adopted to study failure modes of rock mass, i.e., physical modelling experiments under scaling laws for the strength attenuation of hard rock in tunnel walls (Kusui et al., 2016), laboratory investigations via digital image correlation method for dynamic propagation process of brittle fracture (Zhu et al., 2022), and brittle failure criteria of rock bridges in rock slopes by PFC (Qin et al., 2024), etc. As for jointed rock mass, Chen et al. conducted real-time inpvestigations on the strain field and micro-fracture events of jointed samples, demonstrating that the inclination of the joints exerts a substantial influence on the strength and failure mode of the samples (Chen et al., 2019); Lin et al. investigated the mechanical properties and fracture mechanisms of jointed rock masses with holes and summarized the crack coalescence modes between joints and holes (Lin et al., 2020); Si et al. explored the failure modes and rock burst characteristics of layered rock masses containing circular openings under different bedding angles, revealing spatial relationship between the bedding plane and the axis of the opening directly affecting the propagation direction of V-shaped spalling fractures and the energy release mechanism in the surrounding rock (Si et al., 2022), etc. However, existing studies focus more on intact rock masses or simple joint systems. There is still a lack of systematic understanding of the progressive failure process of complex jointed rock masses with holes under real complex confining pressure boundaries.
Determination of the deformation field and failure mode in laboratory investigations relies highly on the reliability of measurement technology. The development of the strain field is of great significance in revealing the fracture behaviour of rock masses which can be measured by the DIC. In the measurement layer, traditional testing methods face difficulties in obtaining discontinuous deformation. In particular for the DIC method, an optical non-contact deformation measurement technique (Alhakim et al., 2023; Aliabadian et al., 2019; Li et al., 2019) which can be used to monitor the full-field strain evolution of the sample surface, the discontinuity effect is frequently referred to regarding accuracy (Li et al., 2022). Due to the working basis of DIC, inevitable discontinuities like material cracking will pose a risk to the computational error of correlation which calls for optimization in analysis to minimize this influence (Hassan, 2021).
In this paper, by combining digital image correlation and acoustic emission technology, the strength characteristics and failure mechanisms of pre-existing jointed rock masses with a central hole under different confining conditions are experimentally investigated, with a focus on the effects of joint angle and confining condition on the mechanical response of rock masses. Meanwhile, optimized DIC algorism was adopted with core parameters calibrated detailly for an optimized recognition of discontinuity patterns. This paper is structured as follows. The underlying mechanism and the optimization algorithm of the DIC are elucidated in Section 2. Section 3 presents the specifics of the experimental setup. Parametric studies for DIC measurement are detailed in Section 4. Strength characteristics and failure mechanism of confined pre-holed jointed rock mass, as revealed by the experimental outcomes, are examined in Section 5.
2 Measurement of deformation and cracking via DIC system
2.1 Principle of digital image correlation method
DSCM (digital speckle correlation method), also called as DIC (digital image correlation), is set as an optical, non-contact, speckle-based measurement for process displacement, strain and deformation of the material. In particular, 2D-DIC is widely applied to experimental research in the fields of geotechnical engineering, structure engineering, material research, etc. (Li et al., 2016; Szymczak et al., 2022). It relies on the correlation calculation of the selected subsets, where for each one in the reference image a best-fit subset is found in the target image (Li and Einstein, 2017). The criterion for judging the target subset is based on the correlation coefficient (CC). As depicted in Figure 1, each DIC subset appears as a block with a radius that can be adjusted. During the correlation analysis, the grey value
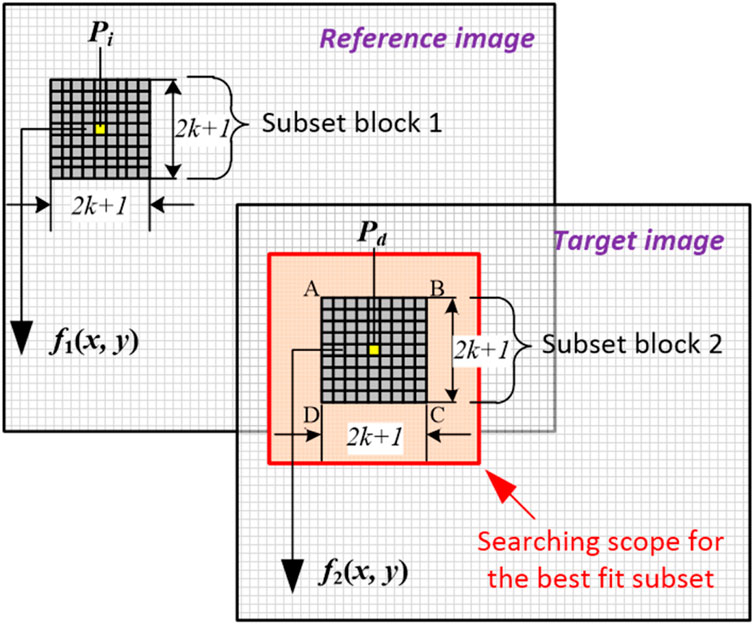
Figure 1. Calculation of correlation coefficient during deformation process (Li et al., 2019).
2.2 DIC optimization for the measurement of discontinuous deformation
Cracks typically create discontinuous regions in digital images, which can interrupt surrounding subset blocks and potentially lead to correlation calculation errors when applying DIC to materials with cracks. To address this, one common approach is to reduce the subset radius, but this can increase image noise in the results. Balancing these factors requires manual adjustment of the subset radius to minimize noise interference. However, this process is complex and cannot completely eliminate the noise effect. To fix the issues of crack discontinuity and noise effects, a correlation calculation algorithm named OPFPM (one point with five pixel-block method) was developed (Li et al., 2022). This algorithm automatically adjusts the subset block around a crack. Figure 2 illustrates the calculation process of OPFPM, where a crack traverses the original subset block. When capturing images with a CCD camera, it is feasible to obtain images of newly formed cracks with minimal opening. As shown in Figure 2, the crack passes through the original block along with block 1, block 2, and block 3, but not block 4. This indicates that, provided the position point P is outside the crack area, it is possible to find a block with the position point in the corner that is least affected by the crack. OPFPM can be described as a block adjustment process. Initially, five subset blocks are generated around a position point in the target image, along with five corresponding CC values. Subsequently, the block set is determined based on the maximum CC value. This approach helps to mitigate the impact of cracks and noise, enhancing the accuracy of the correlation calculations. To conclude, the OPFPM helps to revise computational errors due to the generation of discontinuities without complex tests on the setting of DIC parameters.
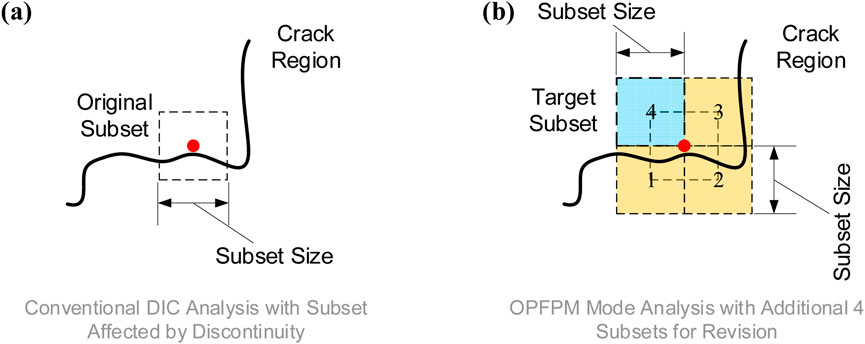
Figure 2. Revision through OPFPM mode for DIC calculation suffering discontinuity influence. (a) original DIC mode with only one subset (b) OPFPM Mode with five subsets.
2.3 DIC software: PhotoInfor
The whole-field correlation calculation is mainly realised through software processing. PhotoInfor is a customized DIC software with a post-processing programme (user interface see Figure 3). Unlike software that relies on specific environments, PhotoInfor can be operated directly in Windows, making it user-friendly and highly functional. PhotoInfor has been widely used in DIC-related studies, and its measurement accuracy has been verified accordingly. PhotoInfor is particularly designed for geotechnical tests based on the deformation characteristics in terms of non-uniform deformation, large deformation, crack generation, etc. Besides the general correlation calculation function, specialized algorithms, i.e., OPFPM, are set in PhotoInfor which could largely improve the analysis speed and accuracy.
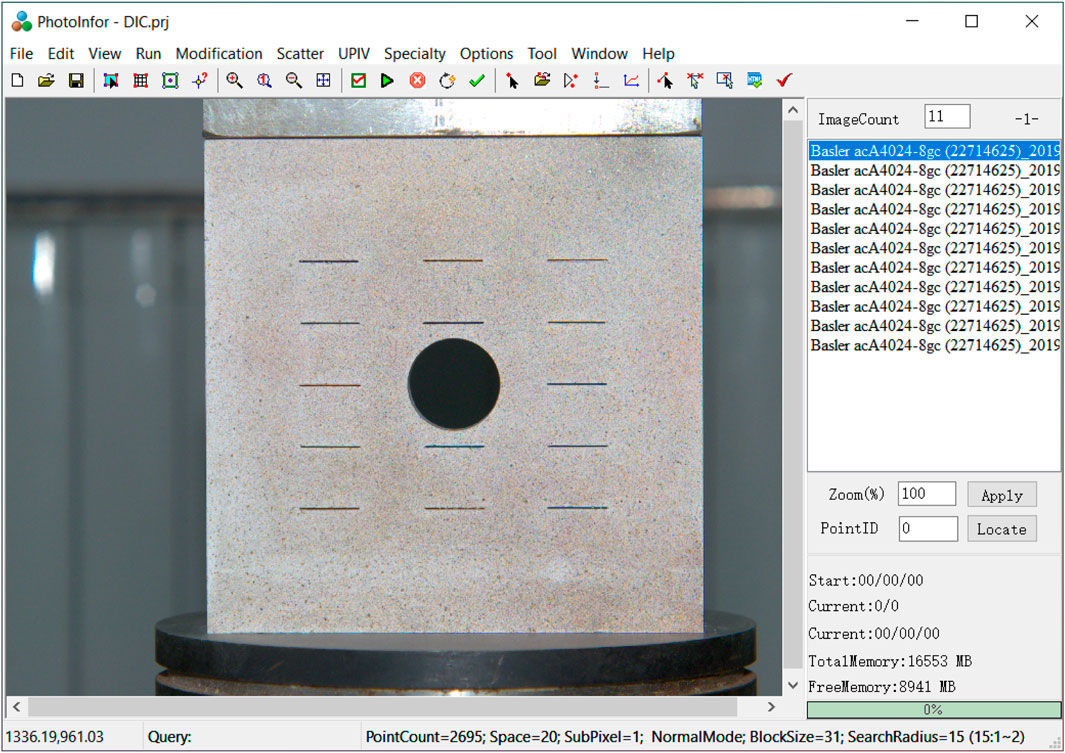
Figure 3. User interface of DIC analysis software PhotoInfor.
3 Experimental setup
3.1 Fabrication of materials and samples
Rock-like material used in the experiment contains mixed liquor and plaster that are under a fixed mass ratio of 70%. Firstly, defoamer of 0.07% v/v was added to water and stirred thoroughly. Defoamer used here is to inhibit the phenomenon of inside bubbles when producing the plaster slurry. The mixture of plaster and liquor was performed later in an oscillator and then poured into a customized mould. A series of compression tests were conducted to obtain the material parameters, such as Young’s modulus, Poisson’s ratio, UCS, etc. Figure 4 depicts the uniaxial curves where a stress drop occurred after the peak of 8.01 MPa which indicates a fragile failure like the characteristics of practical rock. We prepared samples of dimensions 160 × 160 × 40 mm and a hole in the center with diameter of 30 mm (see Figure 5). Joints were realized through aluminium sheets with the same thickness of 0.6 mm and length of 160 mm, and the angles were set as 0, 45, 90°. As shown in Figure 5, a fixed confining boundary is applied by a pair of connected steel plates.
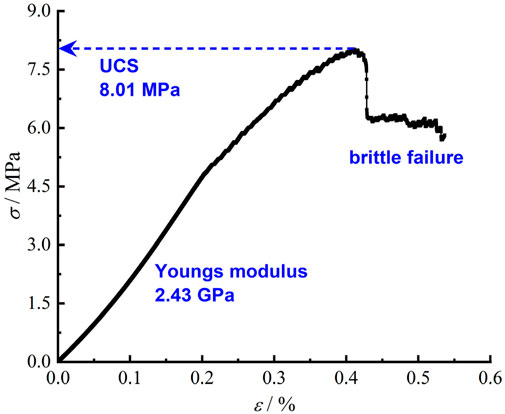
Figure 4. Stress-strain curve of uniaxial compression test on the rock-like material.
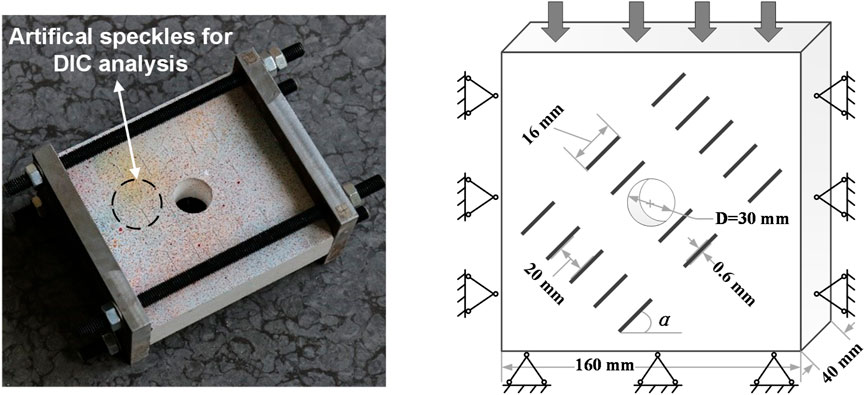
Figure 5. Schematics of experimental sample and setup of confining conditions.
3.2 Experimental setup
The purpose of this DIC-based experiment is to examine the role of boundary conditions on the mechanical behaviour and crack pattern of pre-holed jointed rock mass during a compressing period. As depicted in Figure 6, the experiment was conducted in MTS microcomputer control system which could reach a maximum of 300 kN and stabilizing the loading rate within ±1% deviation. In order to reach the crack generation moment, CCD camera (acA4024-8gc, Basler ace) was used for image capture, illuminated by two stepless dimming lights. Focal length of the camera was fixed during experiments. To better predict the crack moment, acoustic emission technology was applied either during the compressing by which the crack activity can be revealed in monitor data.
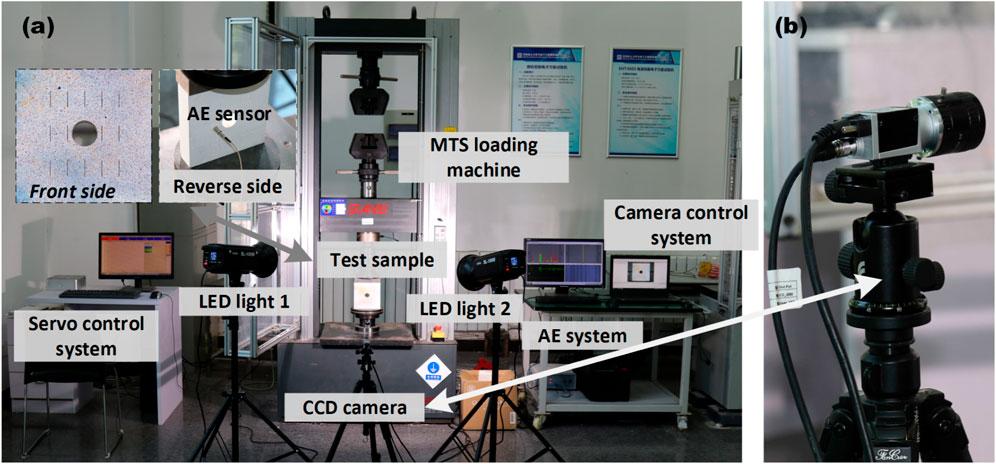
Figure 6. (a) Experimental setup for the analysis of strength and failure mechanism of confined pre-holed jointed rock mass via DIC and AE (b) CCD camera for image acquisition.
3.3 Procedures and repeatability
Firstly, in order to perform a precise DIC analysis which is based on the correlation calculation, sample surface needs a speckled dispose through colored paint before the tests. Multi-colored and scattered speckle patterns can normally induce a better effect. In this research, two boundary conditions were applied for comparison where one represents unconfined compression and another is set with displacement-fixed boundary. The fixation was realized through a couple of steel plates which were connected by four iron bolts. After the settlement of equipment, like image acquisition device and acoustic emission sensor, uniaxial compression was then conducted. The initial contact force was set at 200 N. The loading rate of the upper top was set as 0.12 mm per minute. Six cases, varied with boundary conditions and joint angles, were repeated for at least three times respectively to avoid experimental errors.
4 Optimization of DIC parameters for measurement of deformation and crack
Crack behaviour is a complex, multi-scale phenomenon that evolves from the intra-grain level (micro-scale) to the formation of emerging cracks (mesoscale), and ultimately manifests as visually striking patterns (macro scale). However, due to limitations in recording equipment and a primary focus on deformation measurement, the application of DIC in geotechnical tests typically concentrates on the meso and macro scales. In this section, we will present a case study aimed at calibrating the operational coefficients for characterizing crack development using the PhotoInfor software. The performance of DIC is influenced by several key parameters, including image resolution, subset radius, search range, and subset interval (mesh density). In advanced applications, additional factors such as search mode, correlation algorithms, and sub-pixel division can be fine-tuned to achieve optimal results. We hereby conducted a preliminary test focusing on the searching mode, subset radius and mesh density, and try to propose a suggested criterion to deal with the settlement of DIC.
4.1 Analysis mode against discontinuity influence
First, we present a case study on the revision of crack influence in DIC analysis by adopting the OPFPM mode. Figure 7a shows the measurement region as selected by the dashed line with a dimension of 150*200 pixels (1 pixel corresponds to 0.05 mm in reality). Here the searching radius in DIC is 15 pixels. Obviously to be observed that DIC analysis in conventional mode meets measurement error near the crack region while the adaptation of the OPFPM can perfectly revise the error which is simple and straightforward in the DIC. In what follows, the function of the OPFPM will be activated in the remaining analysis.
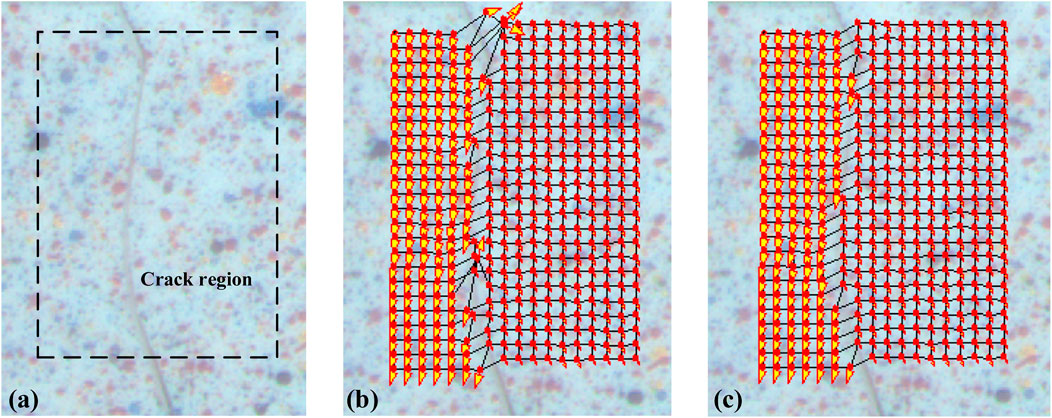
Figure 7. DIC analysis for the case with discontinuity influence. (a) Deformation figure with interface crack. (b) conventional DIC analysis. (c) DIC analysis through the OPFPM mode.
4.2 Mesh density
In DIC, the measurement quality of the deformation pattern is highly controlled by mesh density. Particularly, as for small-sized objects like cracks, it calls for denser mesh to realize the observation of crack boundary. Note here in addition to the acquisition of crack pattern, the mesh density should also be high enough to realize the crack thickness to be mesh-independent.
Figure 8 describes the volume stain of 4 mesh cases. First to be demonstrated, standard mesh mode in PhotoInfor is through square splitting and correspondingly the density is defined as the spacing between two neighbored subsets. Obviously to be observed, case (a) with a much dense mesh can capture the crack pattern while with much irrelevant information. Meanwhile, computation with large amounts of subsets can introduce huge time costs. As the density slightly decreased, case (b) can also present a clear pattern including the crack length and a general distribution mode. As for case (c) with subset interval size of 10 pixels, the crack pattern can be hardly captured and the thickness is fully mesh-dependent (thickness equals to mesh spacing). The results indicate that both calculations using a spacing of 5 pixels and 2 pixels can yield acceptable outcomes. However, taking into account the analysis speed, a mesh density of 5 pixels is recommended for this problem. Based on the above description, we propose a recommended criterion for mesh installation in DIC applications. Given that the average measured opening/thickness of the generated crack is 3 pixels, our analysis suggests that the mesh density (spacing) should be kept within twice the pattern size.
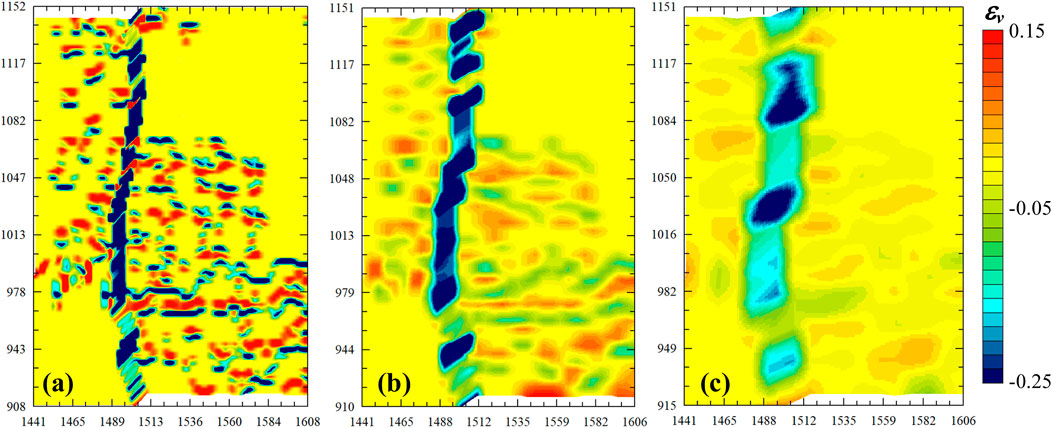
Figure 8. Comparison of volume strain diagrams varied with subset interval size set as (a) 2 pixels. (b) 5 pixels. (c) 10 pixels (axis unit in pixels with 1 pixel corresponding to 0.05 mm in reality).
4.3 Subset radius
As for subset radius, it is generally related to noise effects. Image noise occurs irregularly during acquisition and signal transformation, and is hard to eliminate entirely. Published results indicate that the impact of noise on correlation calculations grows as the subset radius shrinks. Thus, it is predicted that there’s a subset radius threshold below which analysis errors occur. Additionally, an upper bound for subset radius exists, as overly large subsets can lead to loss of fine-scale patterns of interest. Therefore, it is crucial to conduct subset radius comparison considering both noise-based and pattern-based factors. Figure 9 presents a typical example of establishing an approximate radius range. Figure 9a with small size of subset radius shows evident computation error while the situation tends better for cases with larger size of subset. As the OPFPM mode is activated, the computation time is much longer in the case with subset radius as 25 pixels. In this experiment, the subset radius was set as 15 pixels for its identification of cracking pattern and its moderate magnitude with computation time and taken into account.
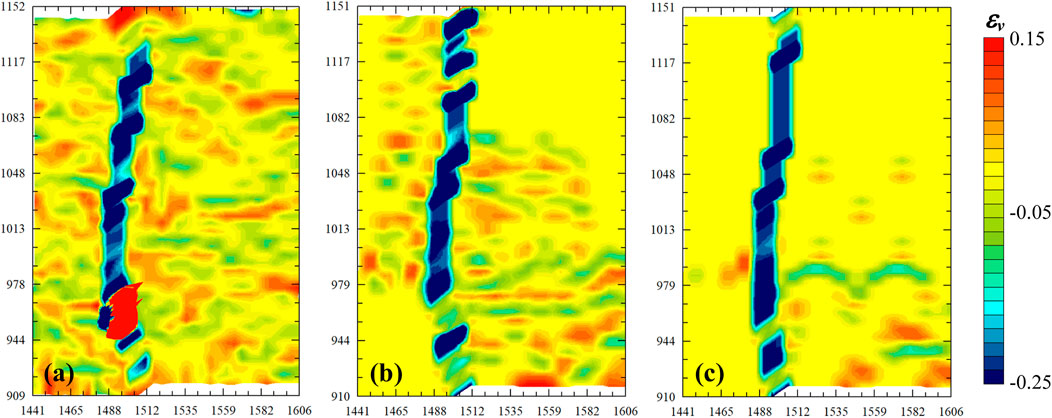
Figure 9. Comparison of volume strain diagrams varied with subset radii set as (a) 5 pixels. (b) 15 pixels. (c) 25 pixels (axis unit in pixels with 1 pixel corresponding to 0.05 mm in reality).
5 Results
5.1 The role of joint angle and confining condition on the change of mechanical behaviour
The joint angle and confining condition play significant roles in the change of mechanical behaviour of materials. Mechanical behaviour of samples with Three joint angles and two boundary conditions were compared as shown in Figure 10, and each case is repeated for three times. The strength of rock masses is highly dependent on the joint angle no matter in joint angle cases or boundary cases. In two boundary cases, 90° joint cases behave the highest strength. In uniaxial conditions, 90° jointed sample shows approximately 7.5 MPa, 0° jointed sample exhibits 4.75 MPa (the lowest strength), and 45° jointed sample behaves at a middle state of 5.05 MPa. In detail, for the horizontally jointed condition in the uniaxial case (where the joint angle is perpendicular to the main loading direction), the rock mass undergoes significant compaction at the initial stage of loading. This indicates that the perpendicular-jointed condition is highly unstable and prone to localized instability. As the loading progresses, the rock sample transitions from a dense state through a temporary elastic phase, ultimately reaching the peak of failure. When the angle is set at 45°, a comparable scenario is observed in uniaxial cases. Rock masses containing joints undergo a similar compression pattern from the initial stage to the peak point. Nevertheless, the post-peak behaviour differs significantly. The stress drop in the jointed condition is relatively more gradual compared to that in the zero-degree case. For 90° jointed rock mass, it behaves with the highest strength and brittle failure characteristics.
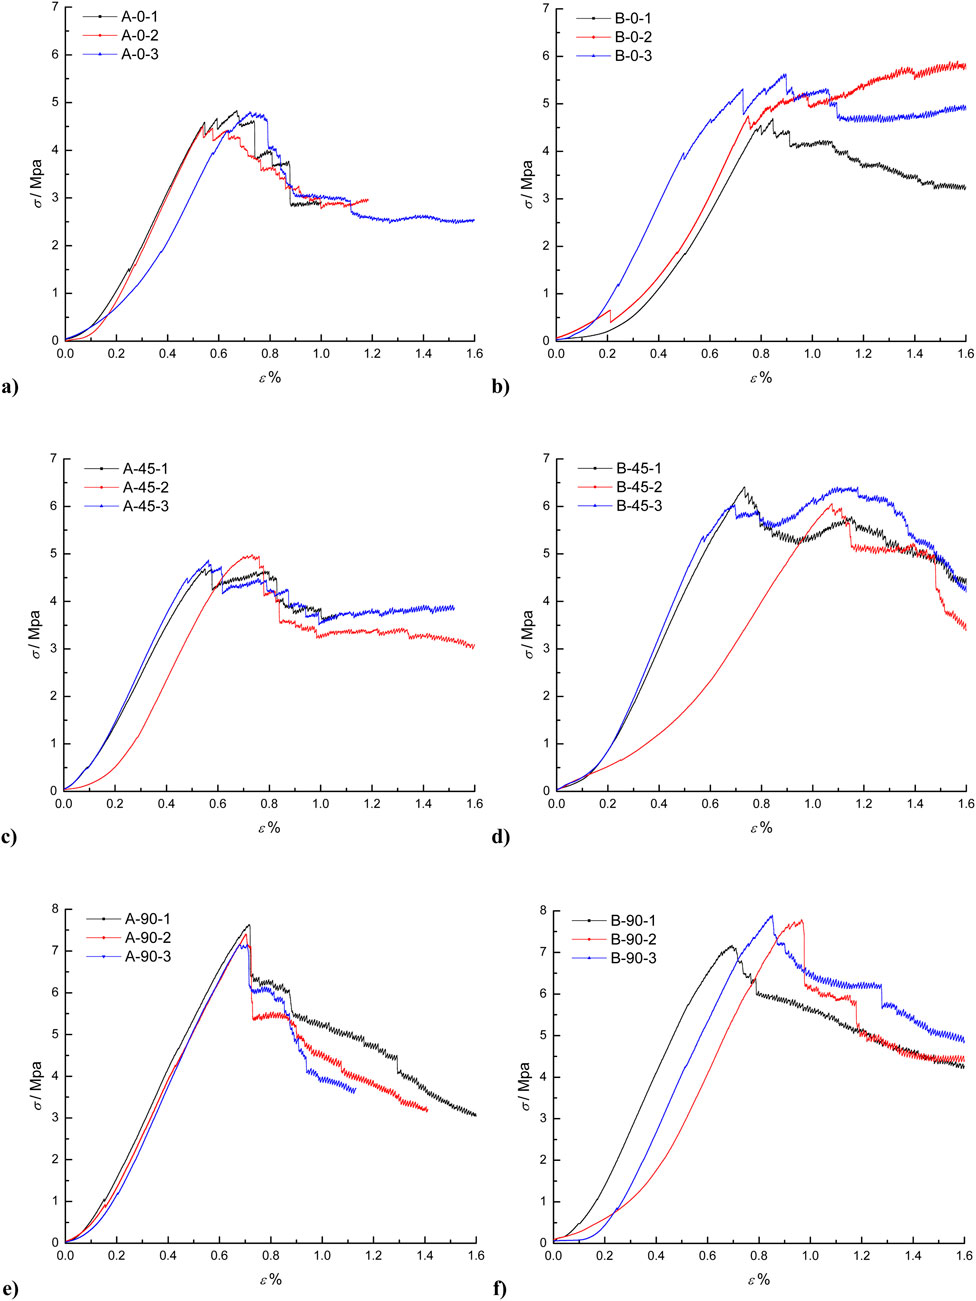
Figure 10. Stress-strain curves of free uniaxial (a,c,e) and fixed-boundary (b,d,f) compression experiments on jointed rock varied with angles of 0, 45, 90°.
When the confining is applied, peak values in three jointed cases of loading pressure are overall enhanced while with different patterns in post peak stages. First, peak pressure of 0°, 45° and 90° jointed samples in confining condition shows approximately 5.85 MPa, 6.45 MPa and 7.85 MPa. Obviously to be observed, the confining boundary condition plays the most significant role in the 45° jointed cases due to its constraint on the sliding of rock mass. In comparison, another two cases embrace slight enhancement of the loading pressure. The reason lies on the displacement of rock mass upon loading. The deformation pattern will be further discussed in the latter through the analysis of DIC. The post-peak stress-strain relationship in three jointed cases subject to confining condition indicates ductile deformation which is different from the uniaxial results.
Drawing on the preceding analysis and integrating it with practical tunnel engineering scenarios, the following findings can be achieved. The presence of joints within the ground significantly impacts mechanical feedback, with the degree of influence varying according to the joint angle. Specifically, when joints are perpendicular to the loading direction, the primary effect is on the rock mass strength, while the rock mass continues to exhibit a brittle failure mode. In contrast, oblique joints tend to affect both the strength and the failure mode of the rock mass. Meanwhile, parallel joints have a relatively minor impact on mechanical characteristics, causing only a slight reduction in strength. The confining degree is associated with the buried depth. We further propose that the buried depth would also pose an influence on the strength of the rock in particular for oblique jointed case. Meanwhile, rock mass exhibits ductile failure in deep buried conditions. From these observations, it is evident that in jointed ground, tunnel engineering stability is influenced by joint angles and buried depth. Among these, the perpendicular-jointed condition poses the most significant risk in both shallow and deep-buried conditions. This is due to its relatively lower strength and the maintained brittle failure mode, which suggests that energy will be released abruptly upon failure. This abrupt energy release poses the greatest threat to the tunnel structure.
5.2 Analysis of acoustic emission singles for cases with various joint angles and confining condition
Acoustic emission technology relies on monitoring wave signals generated by internal structural changes within materials, such as cracking, fracture propagation, and dislocation displacement. However, it is important to note that stable defects like elastic strain do not produce acoustic signals. In the case of intact rock materials, AE activity is typically minimal at the beginning of the loading process but increases noticeably as the material approaches failure. This characteristic enables AE data particularly useful for predicting internal cracks and material failure, offering significant benefits for practical engineering applications.
Figure 11 presents AE count singles and the stress evolution upon the loading process for cases with various joint angles and boundary conditions. As depicted in Figures 11a,c,e, for free boundary samples, AE behaviour remains active firstly at the pre-compression stage. During this period, the entire rock mass is compressed and shows a plastic deformation mode. Specifically, 0° jointed rock tends to has a longer duration of pre-compression than other joint conditions. As the loading continues, 0° jointed mass will have a short period with mechanical behaviour like elastic performance. A similar period of 45° and 90° conditions is longer because 45° jointed rock mass has a lower starting point of elastic behaviour and 90° jointed mass is with a bigger yield limit. For cases with confining boundary as depicted in Figures 11b,d,f, AE singles remain active almost through the loading process in comparison with the free boundary cases, in particular in 0° and 45° joint cases, indicating more frequent internal cracks generated during the deformation. As indicated from AE behaviors in two boundary cases, more internal cracks may generate for deep-buried rock mass in comparison with shallow-buried ones which calls for effective monitoring.
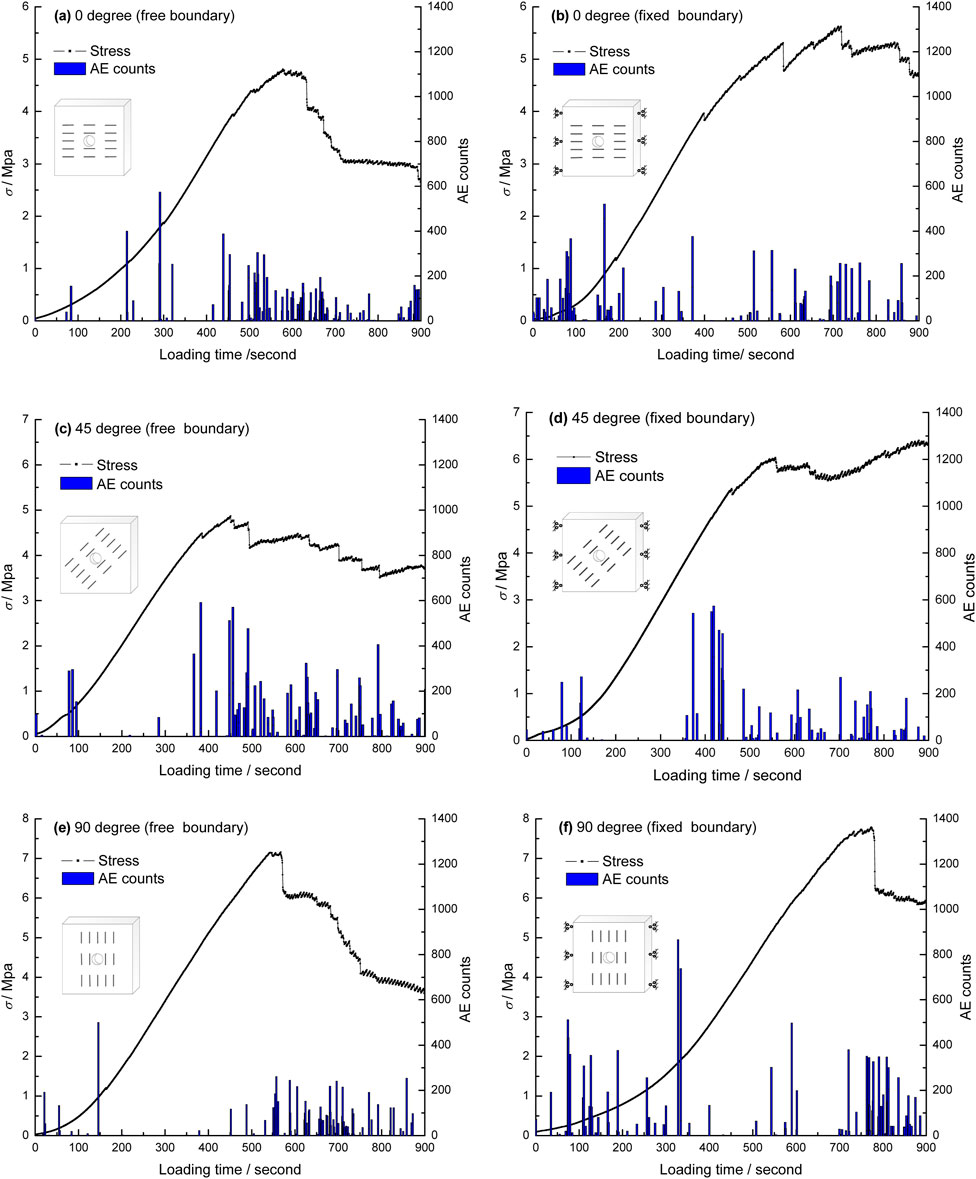
Figure 11. Evolution of stress diagrams and AE activities of for cases with various joint angles in free uniaxial (a, c, e) and fixed-boundary (b, d, f) compression experiments.
5.3 Failure characteristics as measured by DIC
Figure 12 further describes the volumetric strain pattern as measured by DIC for cases with various joint angles and confining conditions. Volumetric strain results indicate material cracking regions during the loading process. As described in above, 0° and 45° joint cases exhibit almost whole-stage AE activities in two boundary cases which corresponds to the closure of internal joints subject to the loading as measured by DIC. When it comes to the 90° joint case with joints parallel to the loading direction while with the highest strength than the other two cases, no evident joint closure can be detected. The overall failure of 90° joint behaves with a connected crack penetrating the central hole while another two cases show the connection of closed joints. There is no significant difference in failure pattern for cases with various confining conditions.
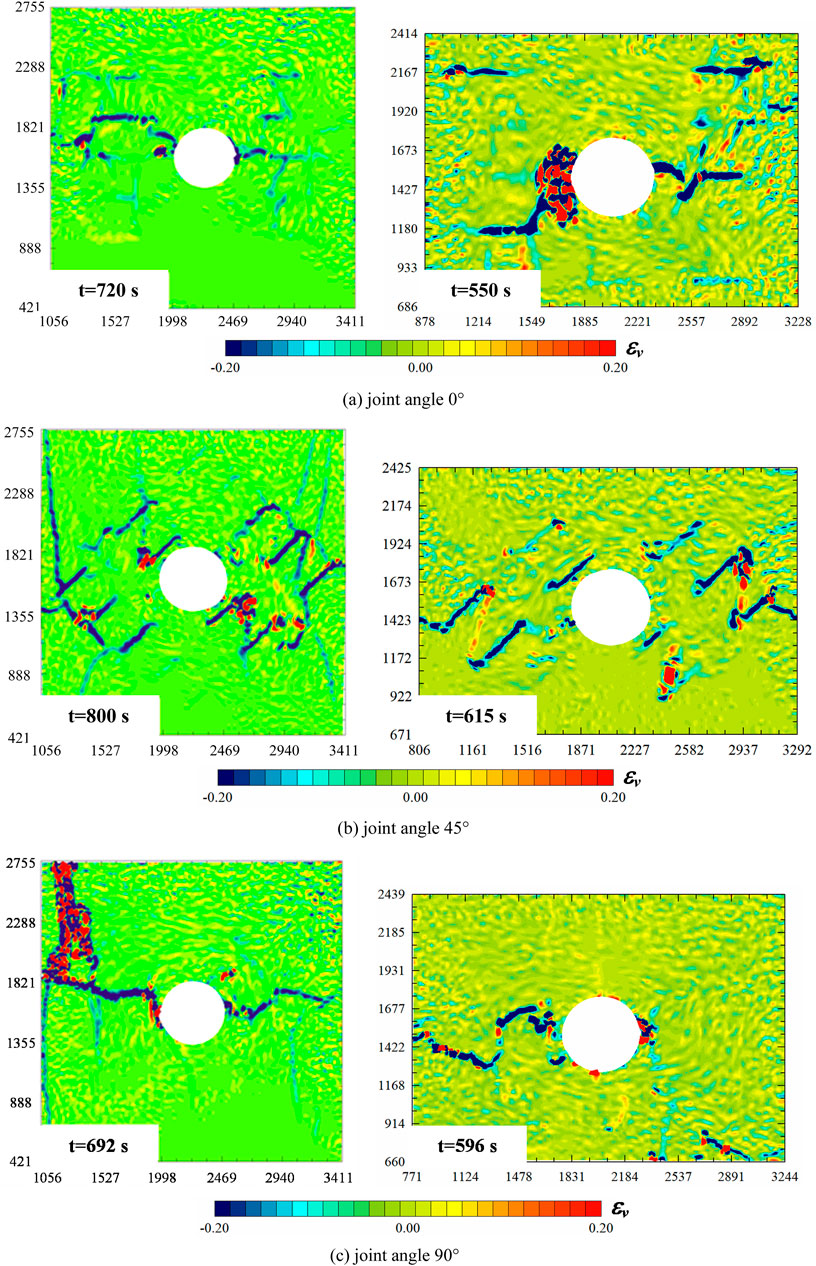
Figure 12. Volumetric strain pattern as measured by DIC for cases with various joint angles and confining conditions (the left figures correspond to free boundary case and the right ones correspond to fixed boundary case). The unit of coordinates is in pixels (axis unit in pixels with 1 pixel corresponding to 0.05 mm in reality). (a) Joint angle 0°. (b) Joint angle 45°. (c) Joint angle 90°.
6 Conclusion
In this study, an optimized DIC system for discontinuity revision combined with AE technology is adopted to analyze the mechanical behaviour and failure mechanism of jointed rock mass with a central hole at different confining conditions. The following conclusions can be drawn.
(1) Joint inclination and confining condition exert a notable influence on the mechanical properties and failure behaviour of rock masses with holes. Rock mass exhibits ductile failure while applied with confined boundary. The confining associated with buried depth in practical would also pose an influence on the strength of the rock in particular for the oblique jointed case. The perpendicular-jointed condition poses the most significant risk in both shallow and deep buried condition due to its relatively lower strength and the maintained brittle failure mode.
(2) Results show that more internal cracks may occur for deep-buried rock mass in comparison with shallow-buried ones. 0° and 45° joint cases exhibit nearly a whole-stage AE activities corresponding to the closure of internal joints subject to the loading as measured by DIC while the overall failure of 90° joint behaves with a connected crack penetrating the central hole in both boundary cases.
(3) To optimize crack measurement using DIC, parametric studies have been conducted to establish a criterion for mesh installation in DIC applications. It is recommended that subset intervals should be kept within twice the pattern size. Additionally, the OPFPM mode is suggested to achieve the required deformation pattern with a reasonable computational load.
Data availability statement
The original contributions presented in the study are included in the article/supplementary material, further inquiries can be directed to the corresponding author.
Author contributions
WW: Formal Analysis, Writing – review and editing, Resources, Methodology, Writing – original draft, Data curation. YB: Writing – review and editing, Formal Analysis, Investigation, Data curation. SY: Formal Analysis, Data curation, Methodology, Validation, Supervision, Writing – review and editing, Funding acquisition, Conceptualization.
Funding
The author(s) declare that financial support was received for the research and/or publication of this article. This research was supported by the Natural Science Foundation of the Jiangsu Higher Education Institutions of China (21KJB580004).
Acknowledgments
Additionally, the authors are grateful to the reviewers of this article for their careful reading of our manuscript and their many helpful comments.
Conflict of interest
Authors WW and YB were employed by China Railway Shanghai Engineering Group Co., Ltd.
The remaining authors declare that the research was conducted in the absence of any commercial or financial relationships that could be construed as a potential conflict of interest.
Generative AI statement
The author(s) declare that no Generative AI was used in the creation of this manuscript.
Publisher’s note
All claims expressed in this article are solely those of the authors and do not necessarily represent those of their affiliated organizations, or those of the publisher, the editors and the reviewers. Any product that may be evaluated in this article, or claim that may be made by its manufacturer, is not guaranteed or endorsed by the publisher.
References
Alhakim, G., Núñez-Temes, C., Ortiz-Sanz, J., Arza-García, M., Jaber, L., and Gil-Docampo, M. L. (2023). Experimental application and accuracy assessment of 2D-DIC in meso-direct-shear test of sandy soil. Measurement 211, 112645. doi:10.1016/j.measurement.2023.112645
Aliabadian, Z., Zhao, G.-F., and Russell, A. R. (2019). Crack development in transversely isotropic sandstone discs subjected to Brazilian tests observed using digital image correlation. Int. J. Rock Mech. Min. Sci. 119, 211–221. doi:10.1016/j.ijrmms.2019.04.004
Chen, M., Yang, S., Pathegama Gamage, R., Yang, W., Yin, P., Zhang, Y., et al. (2019). Fracture processes of rock-like specimens containing nonpersistent fissures under uniaxial compression. Energies 12 (1), 79. doi:10.3390/en12010079
Feng, X.-T., Kong, R., Zhang, X., and Yang, C. (2019). Experimental study of failure differences in hard rock under true triaxial compression. Rock Mech. Rock Eng. 52 (7), 2109–2122. doi:10.1007/s00603-018-1700-1
Hassan, G. M. (2021). Deformation measurement in the presence of discontinuities with digital image correlation: a review. Opt. Lasers Eng. 137, 106394. doi:10.1016/j.optlaseng.2020.106394
Kusui, A., Villaescusa, E., and Funatsu, T. (2016). Mechanical behaviour of scaled-down unsupported tunnel walls in hard rock under high stress. Tunn. Undergr. Space Technol. 60, 30–40. doi:10.1016/j.tust.2016.07.012
Li, B. Q., and Einstein, H. H. (2017). Comparison of visual and acoustic emission observations in a four point bending experiment on barre granite. Rock Mech. Rock Eng. 50 (9), 2277–2296. doi:10.1007/s00603-017-1233-z
Li, Y., Tang, X., Yang, S., and Chen, J. (2019). Evolution of the broken rock zone in the mixed ground tunnel based on the DSCM. Tunn. Undergr. Space Technol. 84, 248–258. doi:10.1016/j.tust.2018.11.017
Li, Y., Tang, X., and Zhu, H. (2022). Optimization of the digital image correlation method for deformation measurement of geomaterials. Acta Geotech. 17 (12), 5721–5737. doi:10.1007/s11440-022-01646-x
Li, Y., Zhang, Q., Lin, Z., and Wang, X. (2016). Spatiotemporal evolution rule of rocks fracture surrounding gob-side roadway with model experiments. Int. J. Min. Sci. Technol. 26(5), 895–902. doi:10.1016/j.ijmst.2016.05.031
Li, Z., Zhang, Y., Gao, X., Ma, D., Fan, L., Li, G., et al. (2025). Characterizing the deformation, failure, and water-conducting fractures evolution of shallow weakly cemented overburden under coal mining. Front. Earth Sci. 13. doi:10.3389/feart.2025.1538324
Lin, Q., Cao, P., Cao, R., Lin, H., and Meng, J. (2020). Mechanical behavior around double circular openings in a jointed rock mass under uniaxial compression. Archives Civ. Mech. Eng. 20 (1), 19. doi:10.1007/s43452-020-00027-z
Liu, T., Ding, L., Shen, H., Xiang, C., and Yang, S. (2025). Influence of crack initiation competition and interaction of cross flaw on the dynamic fracture behavior of granite under biaxial compression. Theor. Appl. Fract. Mech. 136, 104850. doi:10.1016/j.tafmec.2025.104850
Panthee, S., Singh, P. K., Kainthola, A., and Singh, T. N. (2016). Control of rock joint parameters on deformation of tunnel opening. J. Rock Mech. Geotechnical Eng. 8(4), 489–498. doi:10.1016/j.jrmge.2016.03.003
Qin, C. A., Chen, G., and Zhang, G. (2024). Tension-shear extension criteria used in PFC2D to reveal a brittle failure of rock bridges in rock slopes with stepped joints. Eng. Fract. Mech. 295, 109807. doi:10.1016/j.engfracmech.2023.109807
Si, X., Li, X., Gong, F., Huang, L., and Ma, C. (2022). Experimental investigation on rockburst process and characteristics of a circular opening in layered rock under three-dimensional stress conditions. Tunn. Undergr. Space Technol. 127, 104603. doi:10.1016/j.tust.2022.104603
Szymczak, T., Brodecki, A., Kowalewski, Z. L., and Rudnik, D. (2022). Mechanical investigations supported by DIC of structural components intended for operation. Sci. Rep. 12 (1), 19148. doi:10.1038/s41598-022-22615-0
Yang, Y., Wang, S., Zhang, M., and Wu, B. (2022). Identification of key blocks considering finiteness of discontinuities in tunnel engineering. Front. Earth Sci. 10. doi:10.3389/feart.2022.794936
Zheng, G., Sun, J., Zhang, T., Zhang, X., Cheng, H., Wang, H., et al. (2023). Mechanism and countermeasures of progressive failure in shield tunnels. Tunn. Undergr. Space Technol. 131, 104797. doi:10.1016/j.tust.2022.104797
Keywords: pre-holed jointed rock mass, confining condition, digital image correlation, failure mode, crack pattern
Citation: Wang W, Bi Y and Yang S (2025) On the strength and failure mechanism of confined pre-holed jointed rock mass via DIC. Front. Earth Sci. 13:1650732. doi: 10.3389/feart.2025.1650732
Received: 20 June 2025; Accepted: 07 July 2025;
Published: 18 July 2025.
Edited by:
Wenling Tian, China University of Mining and Technology, ChinaReviewed by:
Xingyu Kang, Changsha University of Science and Technology, ChinaWeijing Yao, Anhui University of Science and Technology Affiliated Fengxian Hospital, China
Copyright © 2025 Wang, Bi and Yang. This is an open-access article distributed under the terms of the Creative Commons Attribution License (CC BY). The use, distribution or reproduction in other forums is permitted, provided the original author(s) and the copyright owner(s) are credited and that the original publication in this journal is cited, in accordance with accepted academic practice. No use, distribution or reproduction is permitted which does not comply with these terms.
*Correspondence: Shuo Yang, eWFuZ3NodW9AeHppdC5lZHUuY24=