 Fengyang Sui1,2†
 Xinxin Du1†
 Henglin Xiao2,3*Shuying Zang4
 Hongkuan Hui5
 Qi Lv1
 Yan Liu1Nannan Zhang6
 Yawen Fan7*
- 1College of Life Science and Technology, Harbin Normal University, Harbin, China
- 2Key Laboratory of Intelligent Health Perception and Ecological Restoration of Rivers and Lakes, Ministry of Education, Hubei University of Technology, Wuhan, China
- 3State Key Laboratory of Precision Blasting, Jianghan University, Wuhan, China
- 4Heilongjiang Province Key Laboratory of Geographical Environment Monitoring and Spatial Information Service in Cold Regions, Harbin Normal University, Harbin, China
- 5School of Geography and Tourism, Qilu Normal University, Jinan, China
- 6Modern Educational Technology and Experiment Center, Harbin Normal University, Harbin, China
- 7Key Laboratory of Biodiversity of Aquatic Organisms, Harbin Normal University, Harbin, China
Chagan Lake is the largest meadow-type lake in Northeast China. Over the past century, due to anthropogenic disturbances and regional environmental changes, its aquatic ecosystem has suffered significant stress. This study used sediment diatom records, 210Pb dating, and ecological classification indices to reconstruct the historical water environment changes of Chagan Lake from the mid-19th century to the mid-20th century. Two distinct ecological phases were identified: (1) Zone I (ca. 1859–1950 CE) recorded stable, weak alkaline (pH classes 3–4) and fresh-brackish (salinity class around 2) conditions, with diatoms Aulacoseira granulata (43–72%) and Aulacoseira ambigua (4–17%) being dominant, indicating a moderately eutrophic state with a relatively low level of organic pollution. (2) Zone II (ca. 1951–1962 CE) marked a transition to fluctuating conditions, with a sharp decline in A. granulata (16–36%) and an increase in pollution-tolerant taxa (such as Stephanocyclus meneghinianus: 2–32%, Nitzschia palea: 7–20%), and changes in oxygen requirements (classes 2–3 to 2–4), saprobity (classes 1–2 to 2–3), nitrogen metabolism (classes 1–2 to 1–3), and trophic state (classes 4–5 to 5). Hierarchical clustering and principal component analysis confirmed that significant changes occurred in the diatom community around the 1950s, associated with population growth, increased agricultural runoff, and altered hydrological conditions. Although pH values and salinity thresholds remained stable, the nutrient status developed towards eutrophication after the 1950s. Sedimentological data further indicated accelerated sedimentation rates (0.34 cm·yr−1 pre-1950s vs. 1.31 cm·yr−1 post-1980s) and notable changes in grain-size characteristics, attributable to combined anthropogenic erosion, hydrological engineering, and climatic influences. These findings established a baseline for understanding the anthropogenic impacts on Chagan Lake over a century scale and emphasized the urgency of adopting targeted restoration strategies for shallow, semi-arid lake ecosystems facing similar stressors.
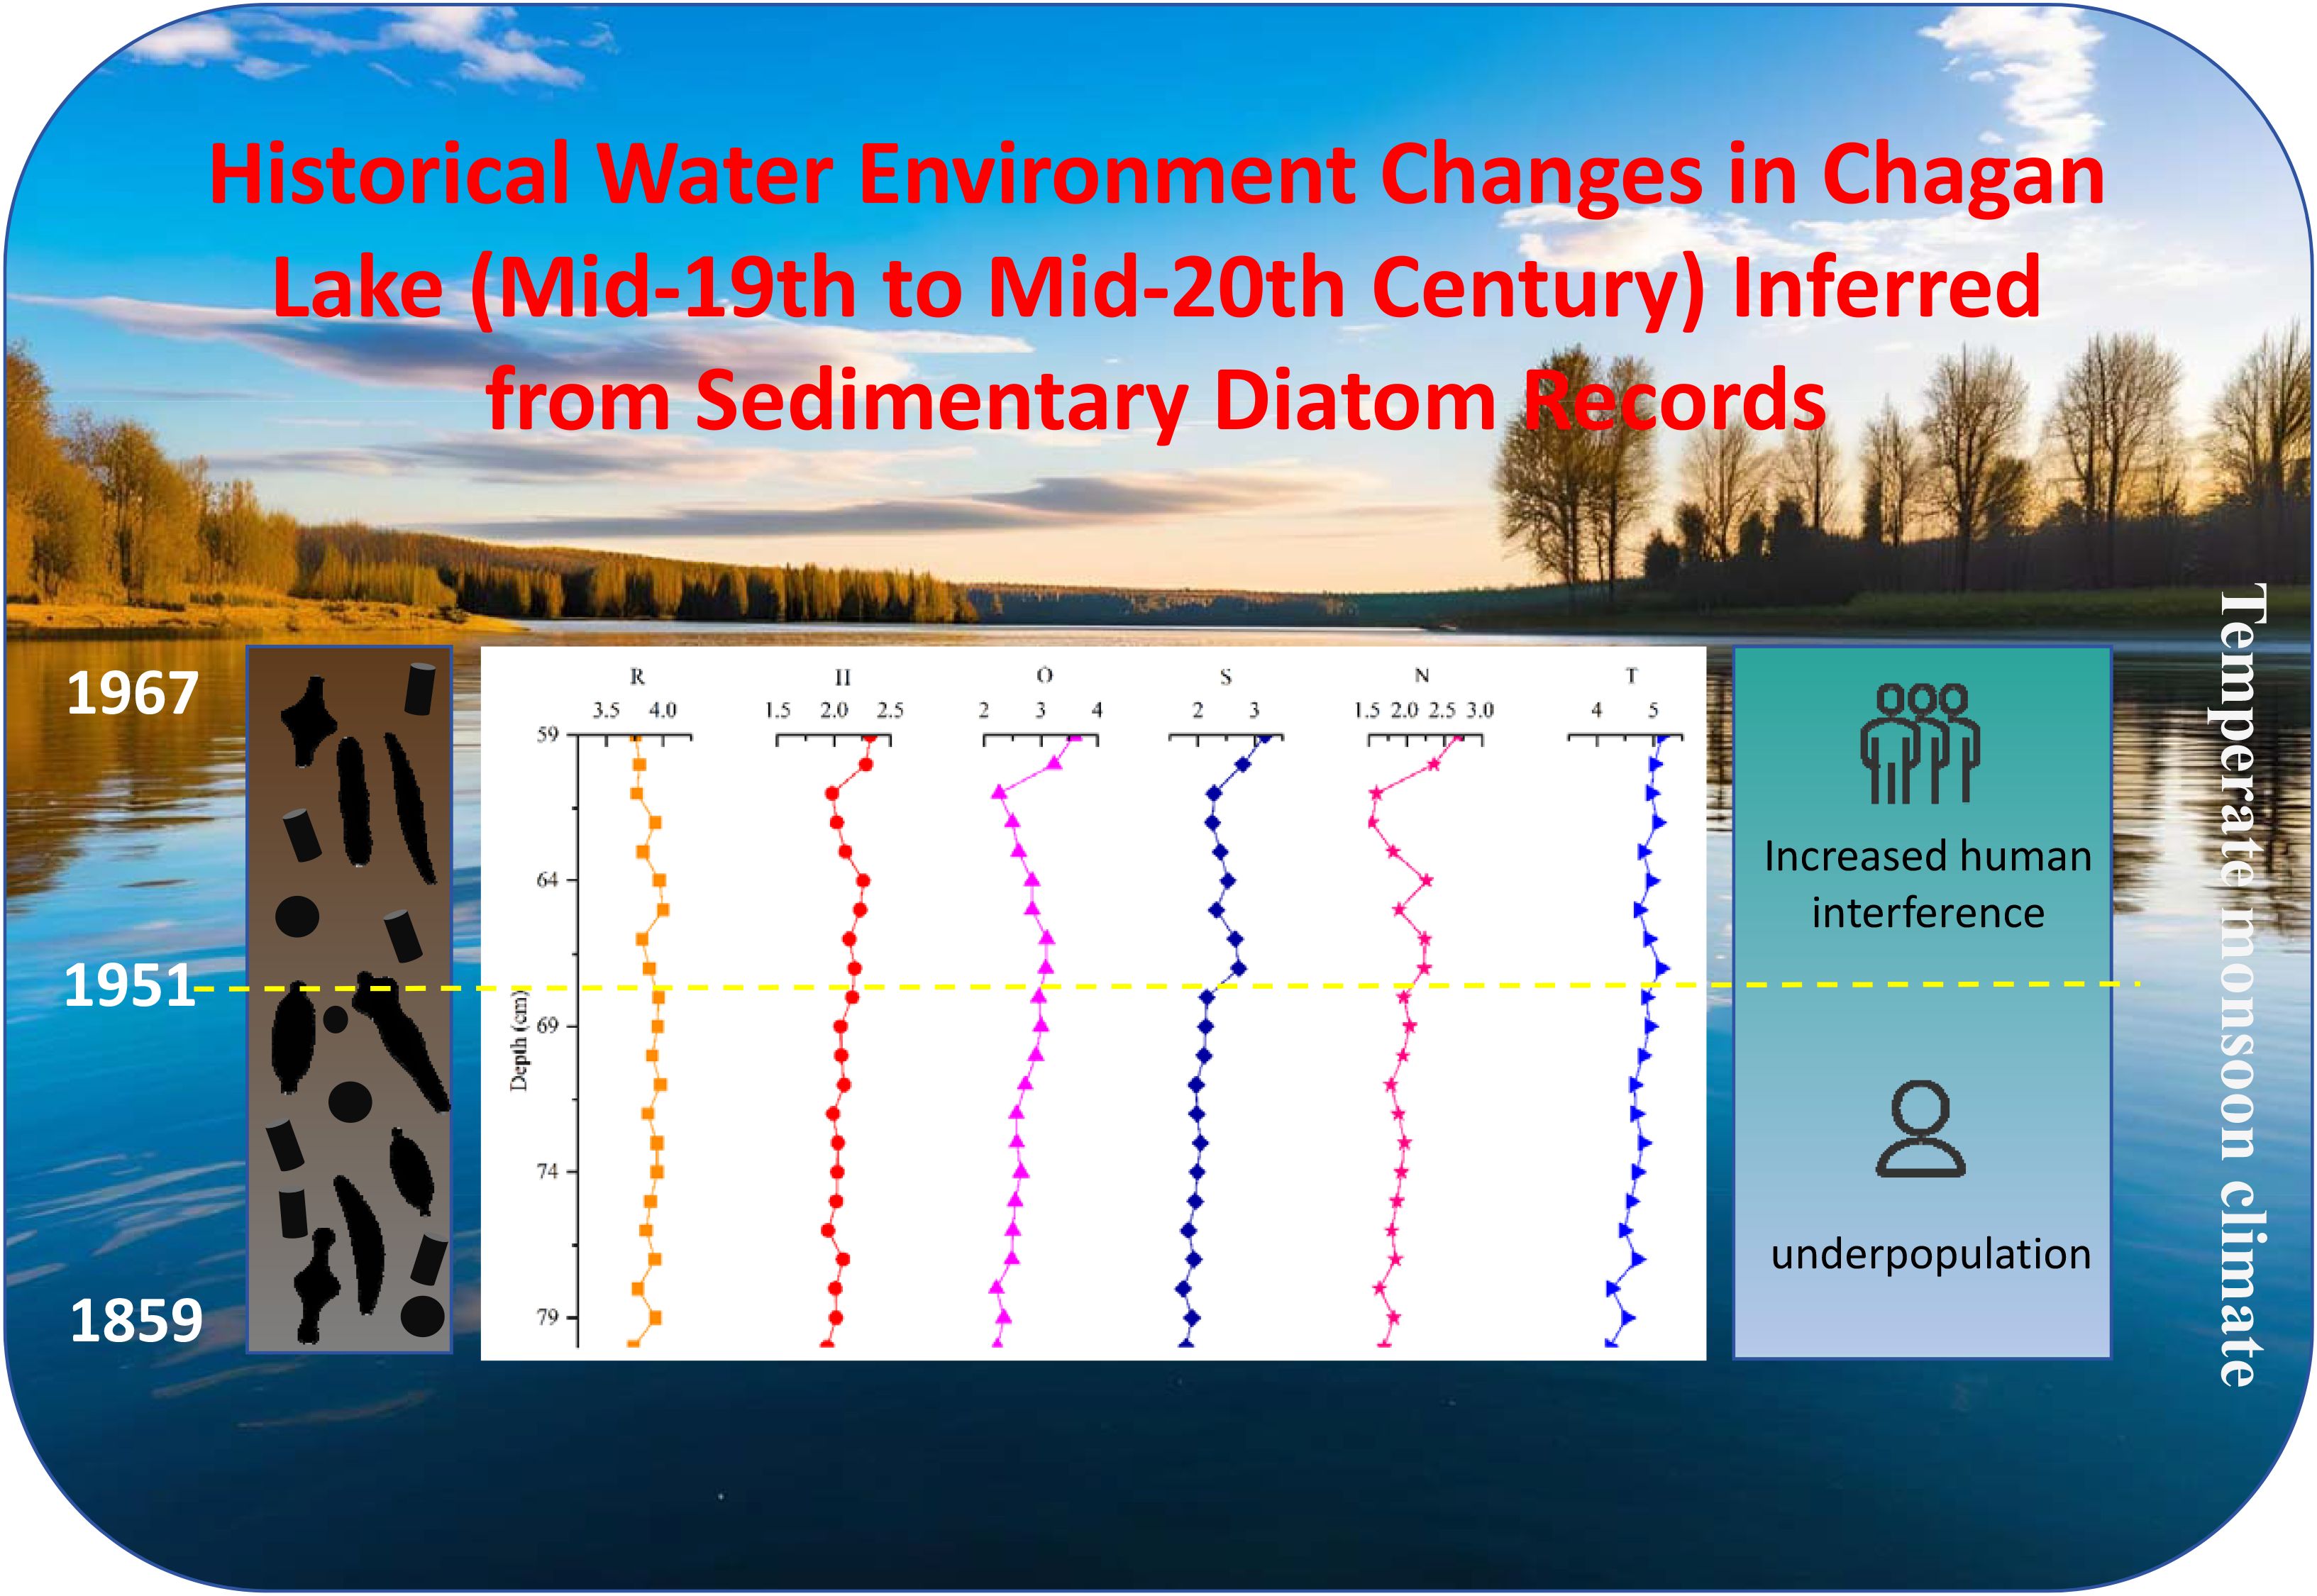
Graphical Abstract.
1 Introduction
Lakes are highly sensitive aquatic ecosystems on land, serving as pivotal hubs for the intricate interplay of diverse elements within the terrestrial surface system. Therefore, lakes play a crucial role in maintaining the surrounding climatic conditions and the local ecological balance (Zhao et al., 2023). Over the past two centuries, many lakes worldwide have been impacted by multiple environmental stressors, including eutrophication, acidification, metal contamination, human disturbance, and climate change (Dixit et al., 2002; Enache et al., 2011; Favot et al., 2024; Mao et al., 2024; Rühland et al., 2008; Xiao et al., 2024). To assess the effects of these stressors, long-term limnological data is needed to understand the ecological evolution of a lake environment over the past hundred years or more. Since long-term limnological monitoring records are usually scarce, alternative approaches such as investigating natural archives (e.g., lake sediments) are indispensable for retrieving these missing data (Cheng et al., 2023; Smol, 2019). These sediments accumulate materials from both within the lake and the surrounding watershed, providing a continuous, high-resolution record of climatic and ecological changes over extended timescales (Wang and Zhang, 1999).
Diatoms are highly sensitive indicators of environmental change, responding rapidly to variations in pH, salinity, nutrient levels, climate, and other factors. Moreover, their siliceous valves persist as subfossils in lake sediments, enabling long-term paleoenvironmental reconstruction (Smol and Stoermer, 2010). Therefore, subfossil diatoms have become an important proxy indicator for investigating the regional ecological and environmental evolution. They are commonly employed to reconstruct historical variations in lake depth, nutrient enrichment, and salinity, and to track ecological responses to anthropogenic disturbances (Bak and Nam, 2024; Balasubramaniam et al., 2023; Wu et al., 2022; Zhang et al., 2024). This includes providing quantitative estimates through statistical transfer functions based on contemporary relationships between diatom-environmental stressors (Andrén et al., 2017; Burge et al., 2018; Han et al., 2023; Pienitz et al., 1995). While ecological changes caused by a single and well-characterized driver (e.g., nutrient loading) have been well identified, there remains limited understanding regarding the dynamics of ecosystem state alterations in response to different stressors and their temporal interactions. Given the potential occurrence of multiple anthropogenic disturbances in the future, it is crucial to comprehend the underlying mechanisms driving aquatic ecological changes and assess the impacts of multiple drivers on lake ecosystems (Mao et al., 2024).
Chagan Lake, located on the Songnen Plain in Northeast China, is the largest lake in this semi-arid region and a typical example of an alkaline lake ecosystem (Song et al., 2011). Situated in western Jilin Province, it serves as an important ecological buffer, a major fishery resource, and a popular tourist destination (Liu et al., 2021). The lake developed under unique hydrogeological conditions in the Songliao Depression, shaped by long-term Mesozoic subsidence. This tectonic activity formed a deep bedrock basin subsequently filled with Quaternary fluvial and lacustrine sediments, resulting in elevated salinity and alkalinity (Wang and Zheng, 1992). Geochemical analyses indicate that in saline environments, mainly sodium cations (Na+) and bicarbonate anions (HCO3−) exist, which are typical characteristics of alkaline lakes formed through weathering and carbonate interaction (Wei et al., 2000; Li and Zheng, 1997).
The lake basin was formed under the influence of neotectonic adjustment and paleohydrological changes. Abandoned river channels and wind-eroded depressions transformed into permanent water bodies through the surface runoff process. Prior to the 1950s, limited human intervention allowed the lake to retain its natural state (Song et al., 2011). However, since then, rapid landscape transformation driven by agricultural expansion and infrastructure development has led to increased environmental stress, including salinization and eutrophication. During this period, there were also pressure factors such as increased nutrient load, hydrological changes, and climate warming. Nevertheless, there has been a lack of systematic investigation into how the lake ecosystem has changed during this period of accelerated anthropogenic influences (Liu et al., 2021; Sun, 2021; Xie et al., 2021).
A major challenge in assessing long-term environmental change is the lack of continuous historical data on hydrology, hydrochemistry, and biological communities. Chagan Lake exemplifies this limitation, as available records span less than three decades. To address this gap, this study utilizes sedimentary diatoms as key indicators of aquatic environmental conditions to reconstruct ecological changes in Chagan Lake over the past century (from the mid-19th to mid-20th century). The specific objectives are: (1) to reconstruct the environmental changes of Chagan Lake on a centennial scale based on the sedimentary record of diatom communities; (2) to explore the responses of the lake ecosystem to human disturbances and regional environmental changes. The results of this study will be helpful in providing better guidance for the ecosystem management and restoration of Chagan Lake and other large shallow lakes.
2 Materials and methods
2.1 Study area
Chagan Lake is the largest natural lake in Jilin Province and the tenth-largest lake in China (Liu et al., 2021). It is located on the Songnen Plain in northeast China (124°03’ ~124°34’ E, 45°05’ ~45°30’ N) (Figure 1), which serves as a crucial drainage area for commodity grain production. The surface area of the lake is 372 km2, with an average depth of 2.5 m and a maximum depth of 6 m, storing approximately 5.89 ×10⁸ m3 of water. Chagan Lake is a typical meadow lake in Northeast China, characterized by a continental semi-arid monsoon climate. The regional climate exhibits dry and windy conditions in spring, precipitation concentrated in summer, rapid cooling in autumn, and long cold winters with a short frost-free period (~140 days) throughout the year.
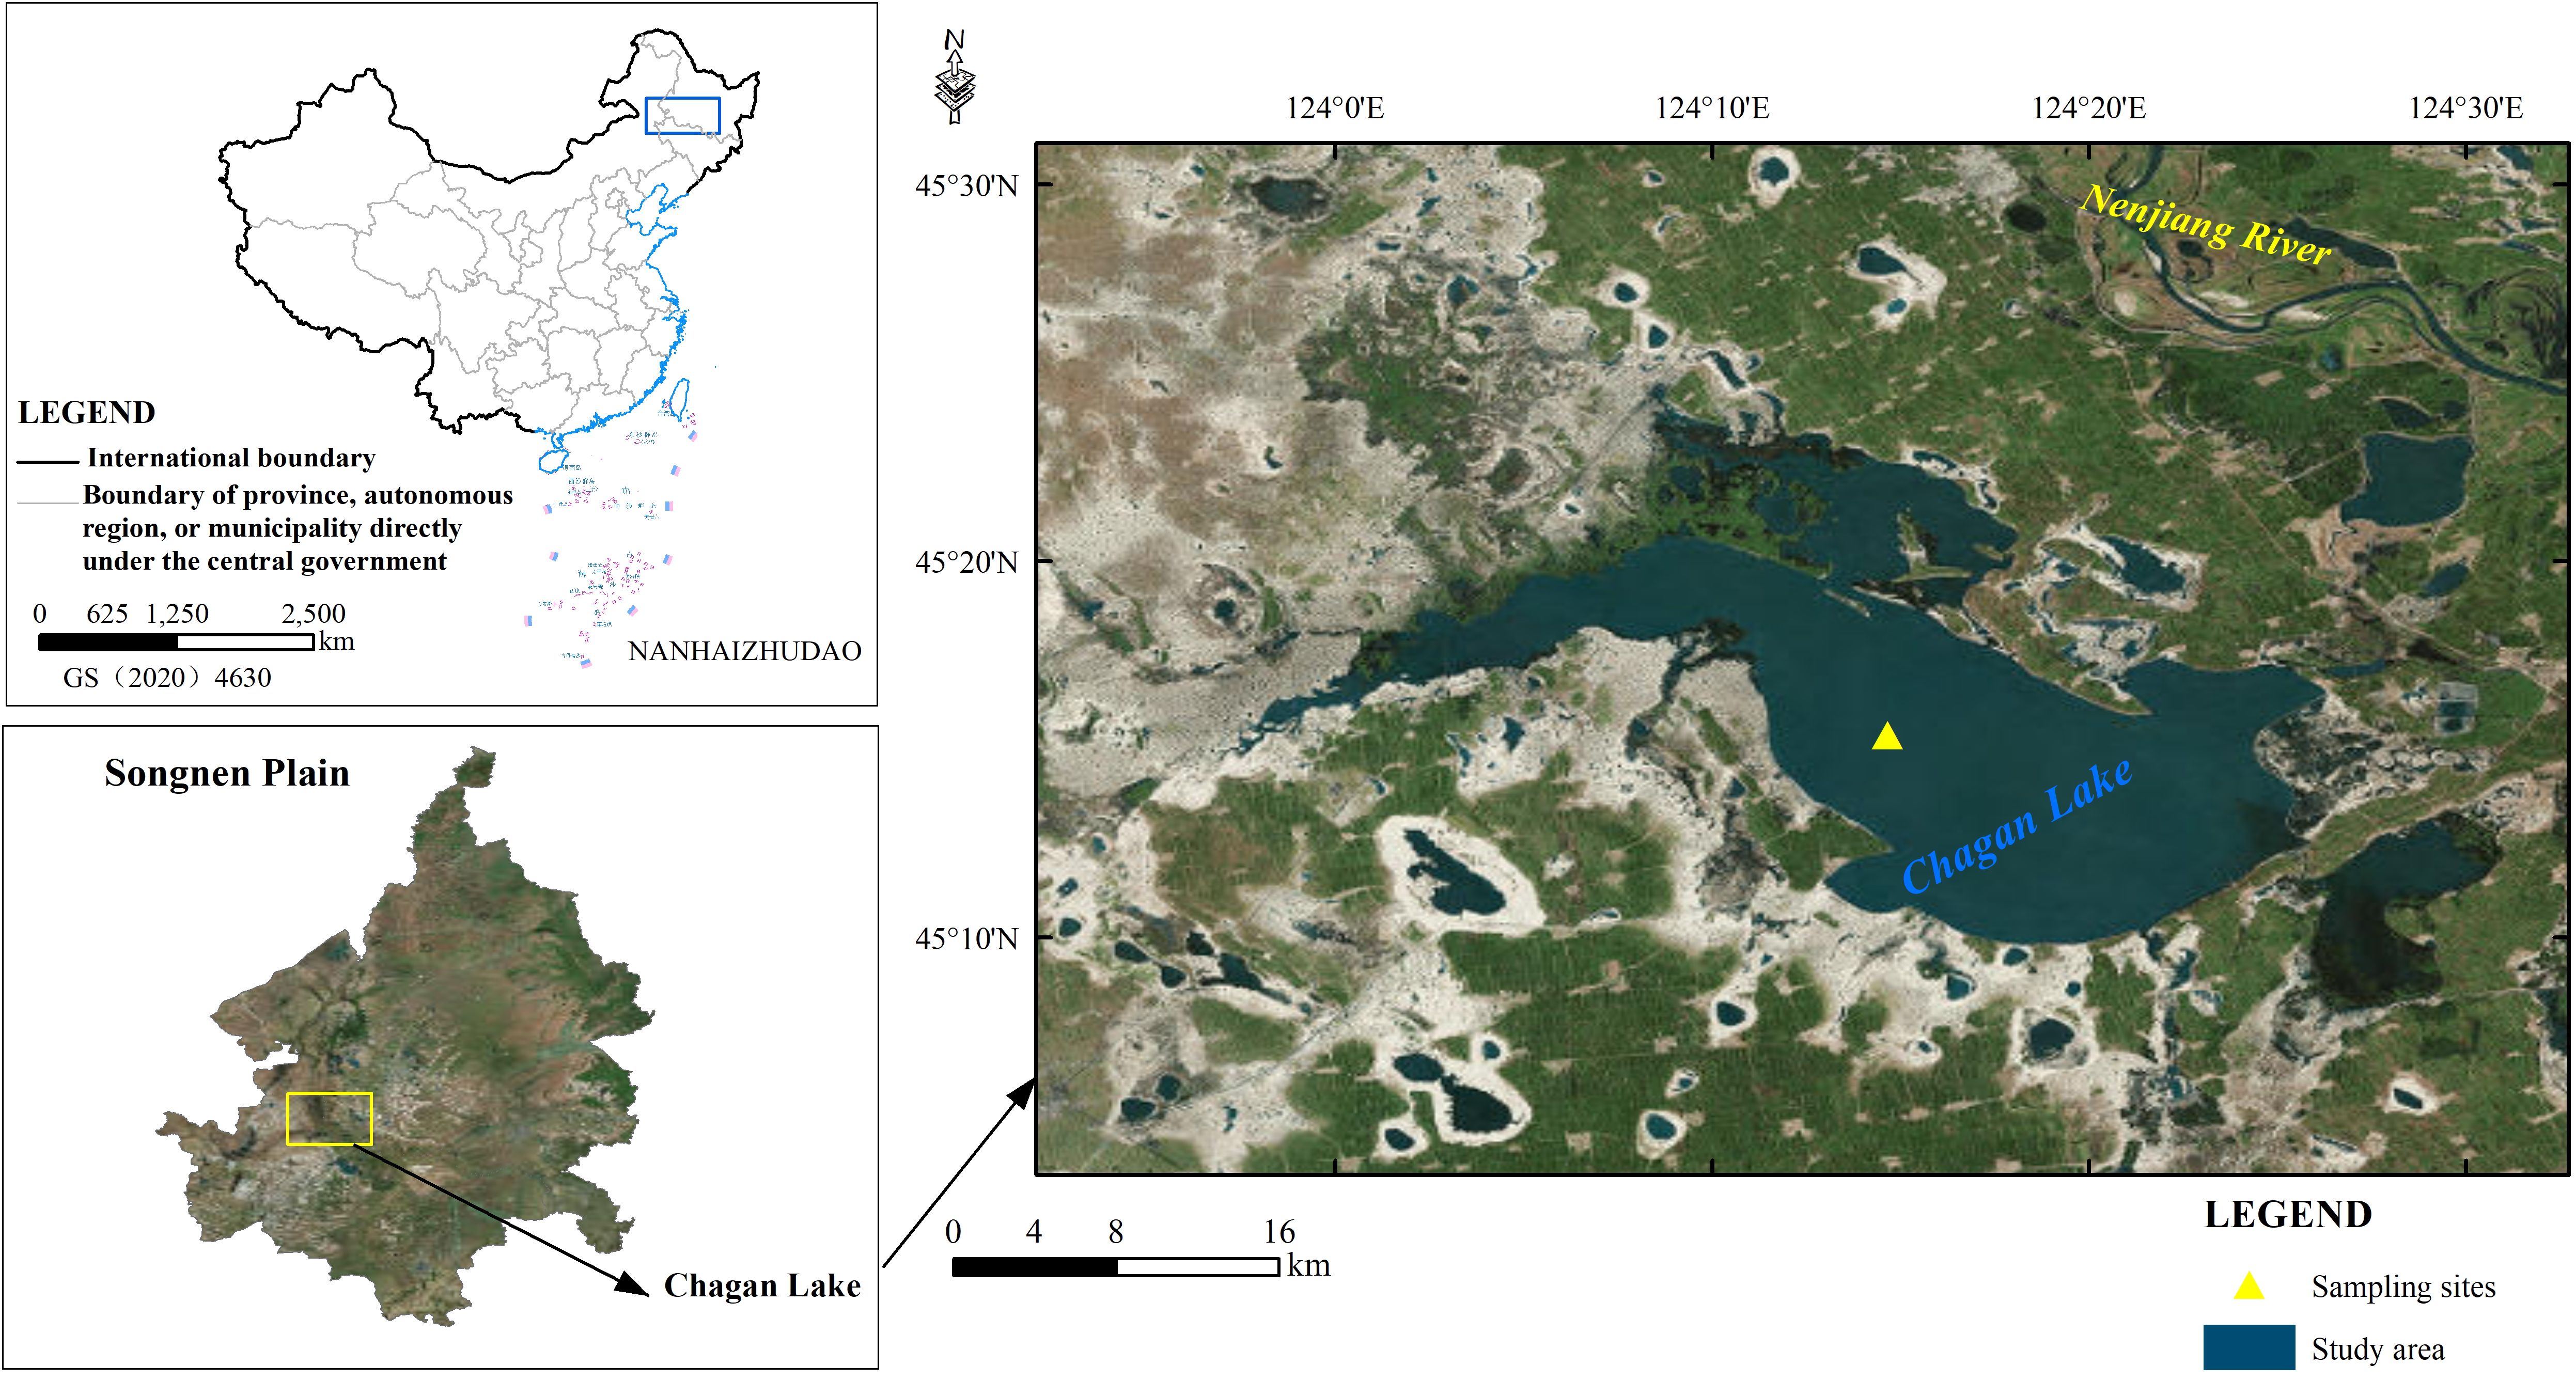
Figure 1. Maps showing the location of Chagan Lake and the sampling site.
Daily meteorological observations from the nearby Qianguo station (45°12′ N, 124°26′ E) for the period 1981–2010 report a mean annual temperature of 5.8°C, with monthly averages ranging from –16°C in January to 24°C in July. Annual precipitation ranges from 400 to 500 mm, with approximately 50% occurring between June and August. Annual evaporation is considerably higher, reaching 1140–1270 mm (China.Meteorological.Administration, 2010; Liu et al., 2020b, 2019).
The main rivers supplying Chagan Lake include the Huolin River, Songhua River, and Nenjiang River. Chagan Lake is connected to the Songhua River by irrigation canals, through which the lake receives a large amount of water from the Second Songhua River and from Qianguo Irrigation Area agricultural drainage. Since the 1950s, particularly from the 1960s onward, extensive farmland development surrounding Chagan Lake has resulted in significant amounts of irrigation drainage with high concentrations of total nitrogen (TN), total phosphorus (TP), and salt entering the lake, inevitably impacting its water quality and ecological security. In addition, natural precipitation and groundwater also play a role as ancillary water suppliers for the lake (Liu et al., 2020a, 2021; Zhang et al., 2017).
2.2 Coring and dating
Three sediment cores of 78–81 cm depth were retrieved in parallel with a piston columnar sampler near the center of Chagan Lake (45°14’45.86’’N~124°16’48.33’’E) (Figure 1) in December 2016. Considering the shallow water conditions at the lake’s edge, the sampling point was strategically positioned in the lake’s central region characterized by deeper water (~5 m) and minimal anthropogenic disturbances, thereby approximating its original ecological context.
During sampling, the coring device was maintained as vertically as possible relative to the water surface. The retrieved sediment cores retained structural integrity, and the overlying water column remained clear, collectively indicating an undisturbed water-sediment interface. From the surface to the bottom, the grain size of the sedimentary cores gradually changed from silty sand to clay, and the color changed from gray black to dark gray (Xie et al., 2021).
On-site, these cores were sliced at 1 cm intervals, sealed in plastic bags, and stored at –4°C. The samples were frozen in the laboratory before analysis.
To establish a core chronology, an 80-cm-long core was selected for dating analysis. The age of the samples was determined via the 210Pb method, employing a high-purity germanium gamma spectrometer (AMETEK, United States). Standard samples were provided by the China Institute of Atomic Energy. The ORTEC high-voltage protection mode was utilized throughout this process to ensure a measurement range spanning from 10 KeV to 10 MeV. After a one-month storage of the sediments in sealed containers to allow radioactive equilibration, 210Pb were determined at the energy peak efficiency scale of 46.84 KeV and measured lasting over 24 h. Sediments with 210Pb activity were dated using the CRS (constant rate of supply) model (Xie et al., 2021), and the reliability of the age model was verified by the 137Cs activity (Appleby, 2001; Zhang et al., 2018).
2.3 Determination of sediment grain size
Approximately 1g of homogenized sediment sample was placed into a 50 mL beaker, after which 10 mL of 5% H2O2 was added. The mixture was stirred and allowed to stand for 12 h (or until effervescence ceased) to remove organic matter. The supernatant was decanted, and 10% HCl was added; the suspension was left overnight (until bubbling stopped) to dissolve carbonates. After discarding the acidified supernatant, a 10% (NaPO3)6 dispersant was introduced, and the sample was ultrasonicated for 10 min to ensure uniform dispersion. Grain size distribution was then measured using a Mastersizer 2000 laser diffraction analyzer (range: 0.02–2000 μm).
2.4 Diatom processing
The diatom samples were subjected to standard procedures involving treatment with 10% HCl and 30% H2O2 (Birks et al., 2001). Subsequently, the cleaned diatom suspensions were carefully pipetted onto coverslips and mounted using Naphrax®. A minimum of 300 valves for each sample (one each 1cm) were meticulously authenticated and counted at x1000 magnification using an Olympus microscope (BH) fitted with oil immersion objective. Diatom taxonomy was mainly based on the works of Krammer and Lange-Bertalot (1986–1991) (Krammer and Lange-Bertalot, 1986, 1988, 1991a, 1991b), and species names were updated to the currently accepted nomenclature using Algaebase (Guiry and Guiry, 2025).
2.5 Diatom-based ecological classification assessment
This study applies the ecological classification system for diatoms developed by Van Dam et al. (1994) and updated by Mertens et al. (2025). Based on species-specific ecological traits, diatom taxa were assigned grading values for the following indicators: pH, salinity, oxygen requirement, saprobity, nitrogen uptake metabolism, and trophic state.
(1) pH index (R): Ranges from class 1 (strongly acidic) to class 5 (strongly alkaline), with an additional class X for taxa indifferent to pH levels. Lower classes (e.g., class 1: acidobiontic) indicate taxa adapted to pH < 5.5, while higher classes (e.g., class 5: alkalibiontic) represent taxa occurring exclusively at pH > 7 (Van Dam et al., 1994).
(2) Salinity index (H): Divided into seven classes (1–7), from freshwater (class 1) to marine conditions (class 7). Lower classes (1–2) reflect freshwater conditions, while higher classes (6–7) indicate marine/near-marine salinity.
(3) Oxygen requirement index (O): Includes five levels (1–5), reflecting tolerance to oxygen availability. Class 1 taxa require near-saturation oxygen (~100%), whereas class 5 taxa tolerate severely hypoxic conditions (~10% saturation).
(4) Saprobity index (S): Categorizes water quality based on organic pollution and oxygen demand. Class 1 (oligosaprobous) represents clean, oxygen-rich waters; classes 4–5 (polysaprobous) indicate heavily polluted, oxygen-depleted environments.
(5) Nitrogen uptake index (N): Four classes (1–4) reflecting organic nitrogen utilization capacity. Class 1 taxa are strictly autotrophic (inorganic nitrogen only), while class 4 taxa are obligate heterotrophs relying on organic nitrogen.
(6) Trophic status index (T): Ranges from class 1 (oligotrophic) to class 6 (hypertrophic), with an additional class X for taxa indifferent to nutrient levels. This index indicates nutrient enrichment, particularly nitrogen and phosphorus.
For each sample, the weighted average of these grading values was calculated for each ecological indicator, using the relative abundances of diatom species within the sample as weighting factors. This approach provides an integrated assessment of past environmental conditions. For Surirella hoefleri, species-specific ecological data were unavailable; therefore, genus-level values were used for all indicators except salinity, which was set to class 6 due to its known preference for high electrolyte concentrations (Krammer and Lange-Bertalot, 1988).
2.6 Data analysis
The relative abundances of diatom species were calculated as percentages of the total diatom count. A stratigraphic diagram illustrating diatom succession and diatom index was generated using Origin 2024b software, including only species with a relative abundance exceeding 2% in at least one sample (Cheng et al., 2023; Favot et al., 2024). Diatom assemblage zones were delineated through hierarchical cluster analysis, and principal component analysis (PCA) was subsequently performed to identify the major patterns of diatom distribution across the stratigraphic sequences; both analyses were conducted using Origin 2024b. Additionally, a chronological sequence diagram and a grain-size composition distribution diagram for the Chagan Lake sediment core were generated using the same software, offering insights into the temporal and hydrological dynamics within the sediment core.
3 Results
3.1 Sediment chronology
The activity of excess 210Pb (210Pbex) in the sedimentary core ranged from 75.36 to 817.72 Bq·kg−1 and generally exhibited a decreasing trend with depth (Figure 2). The 137Cs profile further revealed two distinct phases: (1) a pronounced peak at 57 cm depth, corresponding to the 1963–1964 global fallout maximum from atmospheric nuclear weapons testing (Pennington et al., 1973), and (2) persistently elevated activities in the upper 30 cm (post-1983 CE), indicating contributions beyond direct atmospheric deposition. Above ~30 cm, 137Cs activities displayed multiple sub-peaks rather than a smooth decline toward the surface (Figure 2). This pattern likely reflects intermittent riverine inputs of watershed-derived 137Cs adsorbed to fine sediment particles, as observed in other lakes in Northeast China (Zhang et al., 2022). In addition, variations in sediment grain size modulate the adsorption and burial efficiency of 137Cs; finer clay and silt components have a higher surface area and cation exchange capacity, which promotes greater 137Cs retention (Xu et al., 2022). Thus, peaks in 137Cs in the upper 1–30 cm interval likely record alternating phases of enhanced riverine supply during anthropogenic land-use disturbance and depositional shifts favoring fine-grained sediment accumulation.
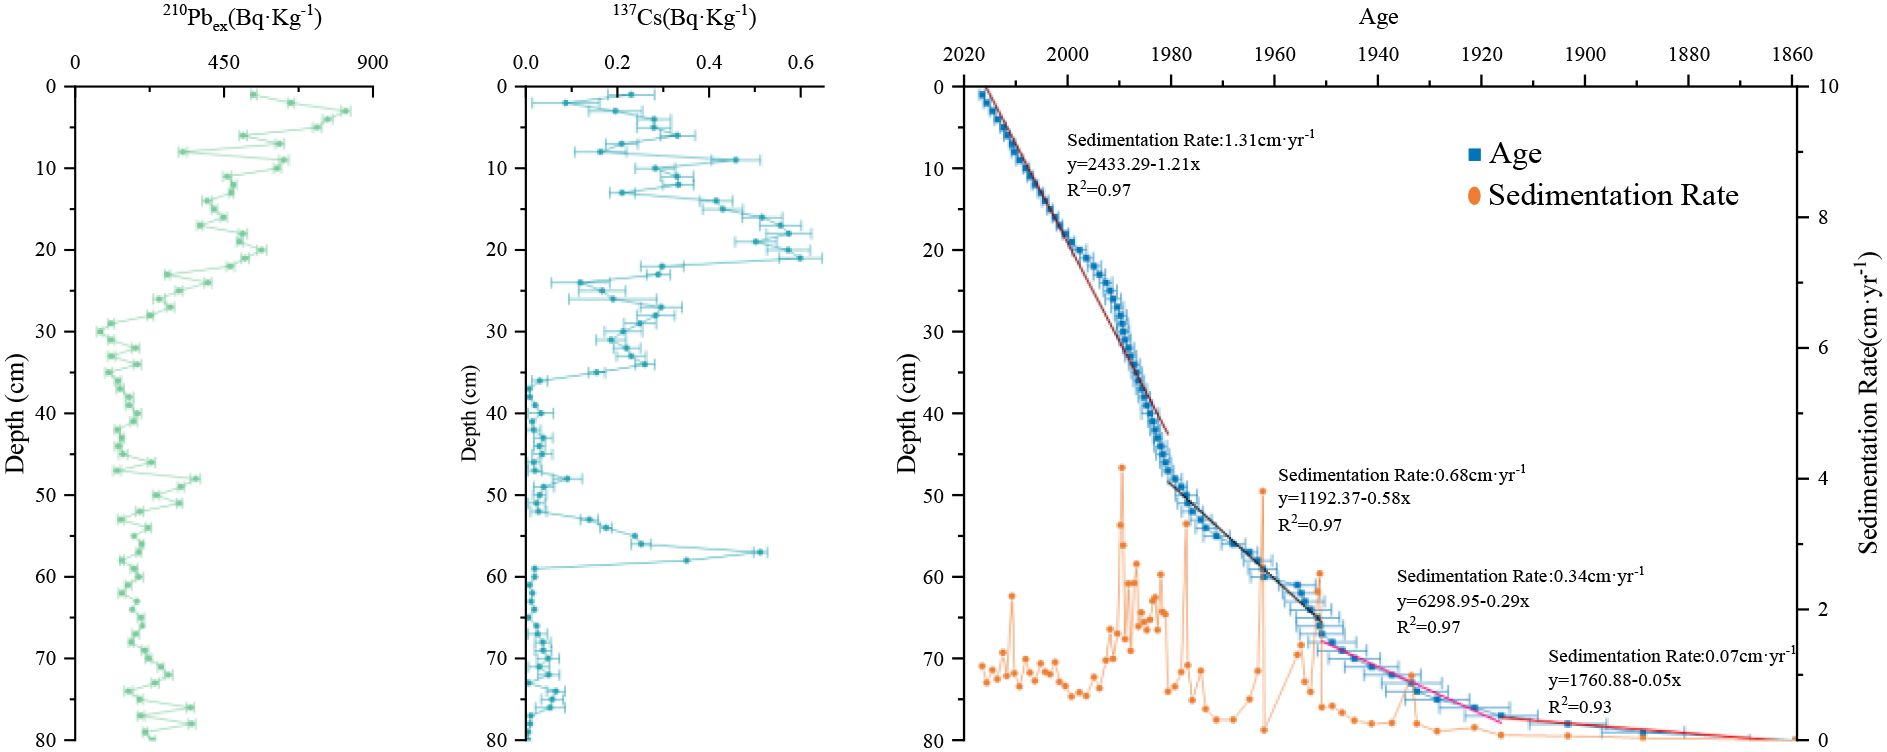
Figure 2. 210Pb activity profile, 137Cs activity profile and sediment chronology of Chagan Lake core.
The Chagan Lake core, collected in December 2016 with its surface assigned to 2016, was dated using the 210Pbex-based CRS model calibrated with the 137Cs marker. This chronology places the core base at 1859 ± 9 CE (Figure 2), and the sedimentation history is divided into four distinct phases: (1) Very slow accumulation (ca.1860–1920 CE; 80–77 cm), with a mean rate of 0.07 ± 0.04 cm·yr−1, indicating a stable depositional environment. (2) Moderate increase in sedimentation (ca.1920–1950 CE; 76–68 cm), with a mean rate of 0.34 ± 0.25 cm·yr−1, suggesting enhanced sediment input. (3) Rapid but highly variable accumulation (ca.1950–1980 CE; 67–48 cm), with a mean rate of 0.68 ± 1.00 cm·yr−1, reflecting intensified and unstable catchment disturbance. (4) High accumulation with reduced variability (ca.1980–2016 CE; 47–1 cm), with a mean rate of 1.31 ± 0.76 cm·yr−1, indicating sustained but less fluctuating input. Over this 150-year period, sediment accumulation transitioned from relatively slower to rapid rates, a shift potentially linked to anthropogenic impacts and regional environmental changes (Xie et al., 2021).
3.2 Grain size
The grain-size composition of the Chagan Lake sediment core (1–80 cm; 2016–1859 CE) revealed distinct variations, with differences in grain size distribution broadly corresponding to the staged changes in sedimentation rate (Figure 3). These variations reflect both natural depositional environments and anthropogenic influence. Throughout the entire profile, the sediments are dominated by fine particles, particularly the 4–16 μm and <4 μm fractions.
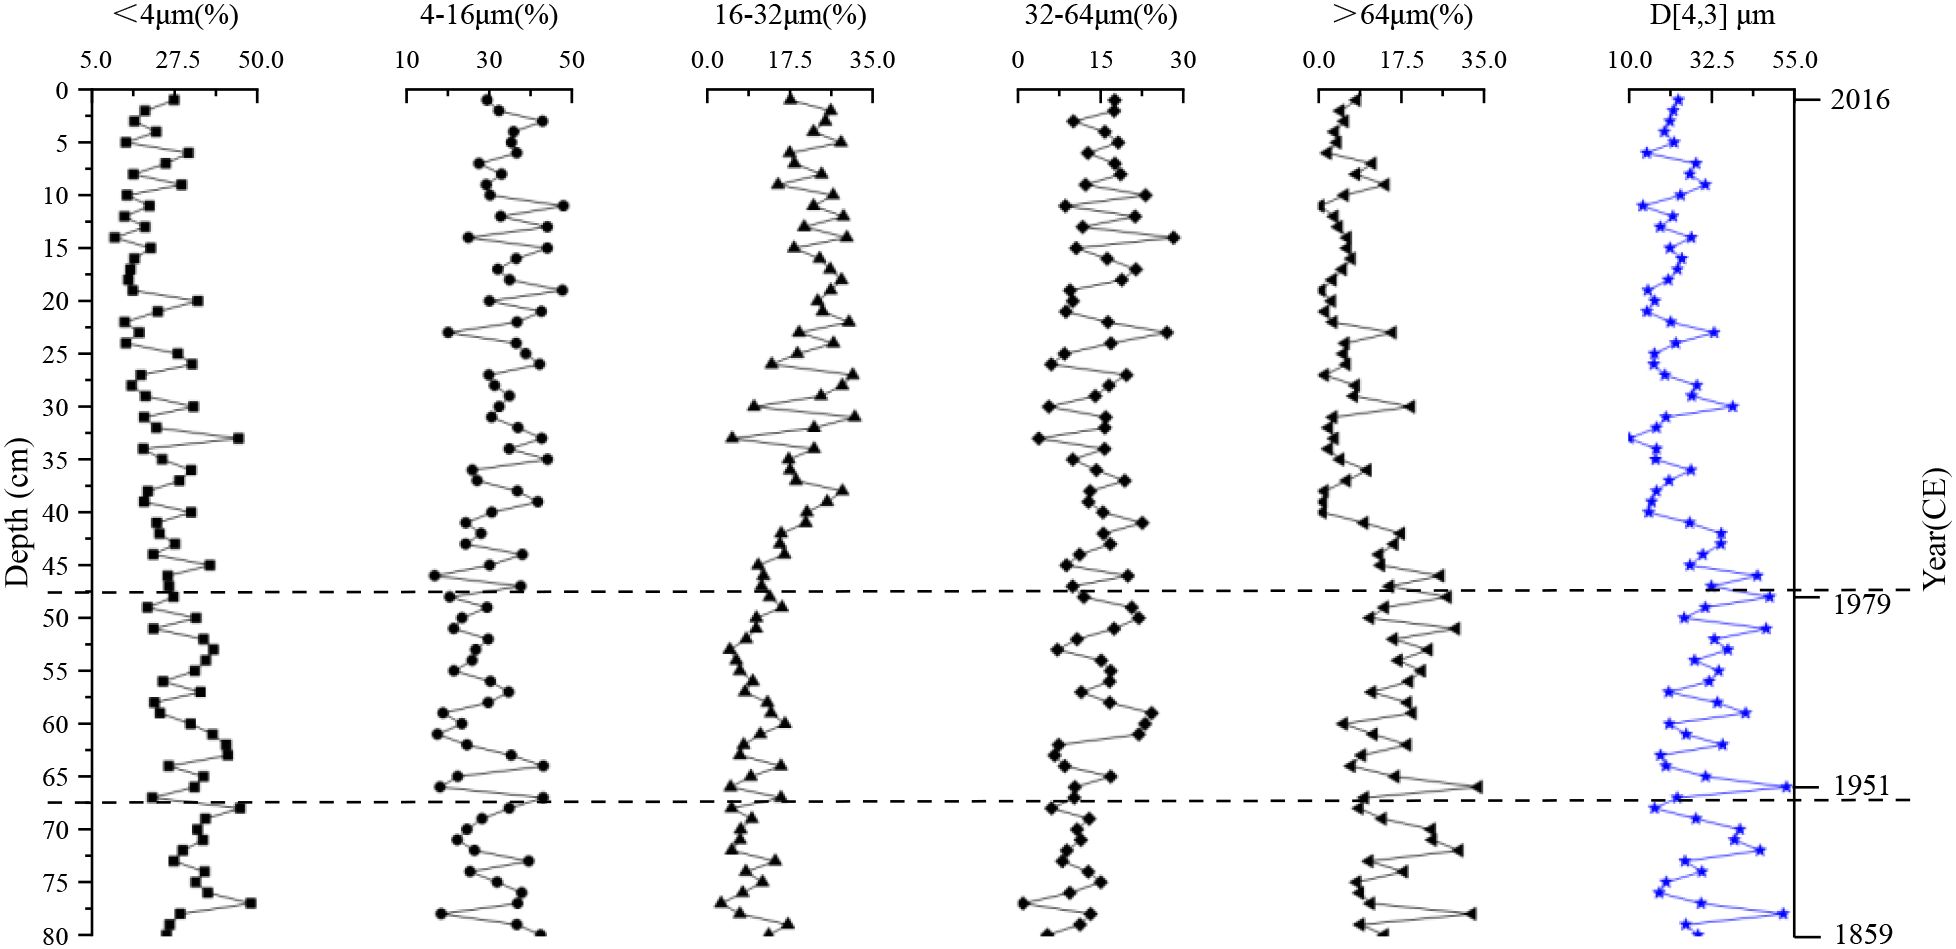
Figure 3. Vertical distribution of grain size composition in the sediment core from Chagan Lake.
Below 68 cm depth (pre-1950 CE), sediments are dominated by fine-grained particles, with the <4 μm and 4–16 μm fractions averaging 34% and 31%, respectively. Medium silt fractions (16–32 μm and 32–64 μm) account for approximately 9% and 10%, while coarser particles (>64 μm) comprise about 16%. The mean grain size (D [4, 3], volume-weighted) is relatively coarse, at ~31 ± 10 μm.
Between 67 and 48 cm depth (ca. 1950–1980 CE), the proportions of fine particles (<4 μm and 4–16 μm) slightly decrease to 31% and 27%, respectively. In contrast, the medium silt fractions (16–32 μm and 32–64 μm) increase to 10% and 15%. Coarse particles (>64 μm) show no significant change. The mean grain size increases slightly to ~32 ± 10μm, indicating a modest coarsening of the sediment.
Above 47 cm (post-1980 CE), the very fine fraction (< 4 μm) fell more markedly to 23%, while the 4–16 μm and 16–32 μm fractions rise to 34% and 21%, respectively. Notably, coarse particles (>64 μm) decrease to 7%. The mean grain size decreases significantly to ~23 ± 7μm, suggesting an enhanced input of fine-grained clay and silt material during this period.
3.3 Diatom assemblages
The distribution of diatoms in the 80cm sediment core of Chagan Lake was found to be non-uniform. Diatom preservation was poor, and the frequency of diatom valve breakage was high in the layers above 59cm, whereas abundant and well-preserved diatoms with low breakage frequency were observed in the layers between 59–80 cm. Therefore, for this study, only samples in depth intervals 59–80 cm were analyzed for their diatom composition.
A total of 47 diatom species were identified in the sediment core spanning the 59–80 cm interval, among which 12 taxa had relative abundances ≥2% in at least one sediment layer (Figure 4). Within these diatom assemblages, planktonic species exhibited limited taxonomic diversity but dominated in relative abundances. The planktonic community was primarily characterized by three taxa: Aulacoseira granulata (average ~ 44%), Aulacoseira ambigua (average ~ 11%), and Stephanocyclus meneghinianus (average ~ 6%). In contrast, benthic species constituted most taxa with relative abundances exceeding 2%, including Diploneis elliptica, Cocconeis placentula, Iconella tenera, Nitzschia palea, and Staurosirella pinnata. Notably, Staurosirella pinnata was present in multiple sediment core samples, with relative abundances ranging from 4% to 34%.
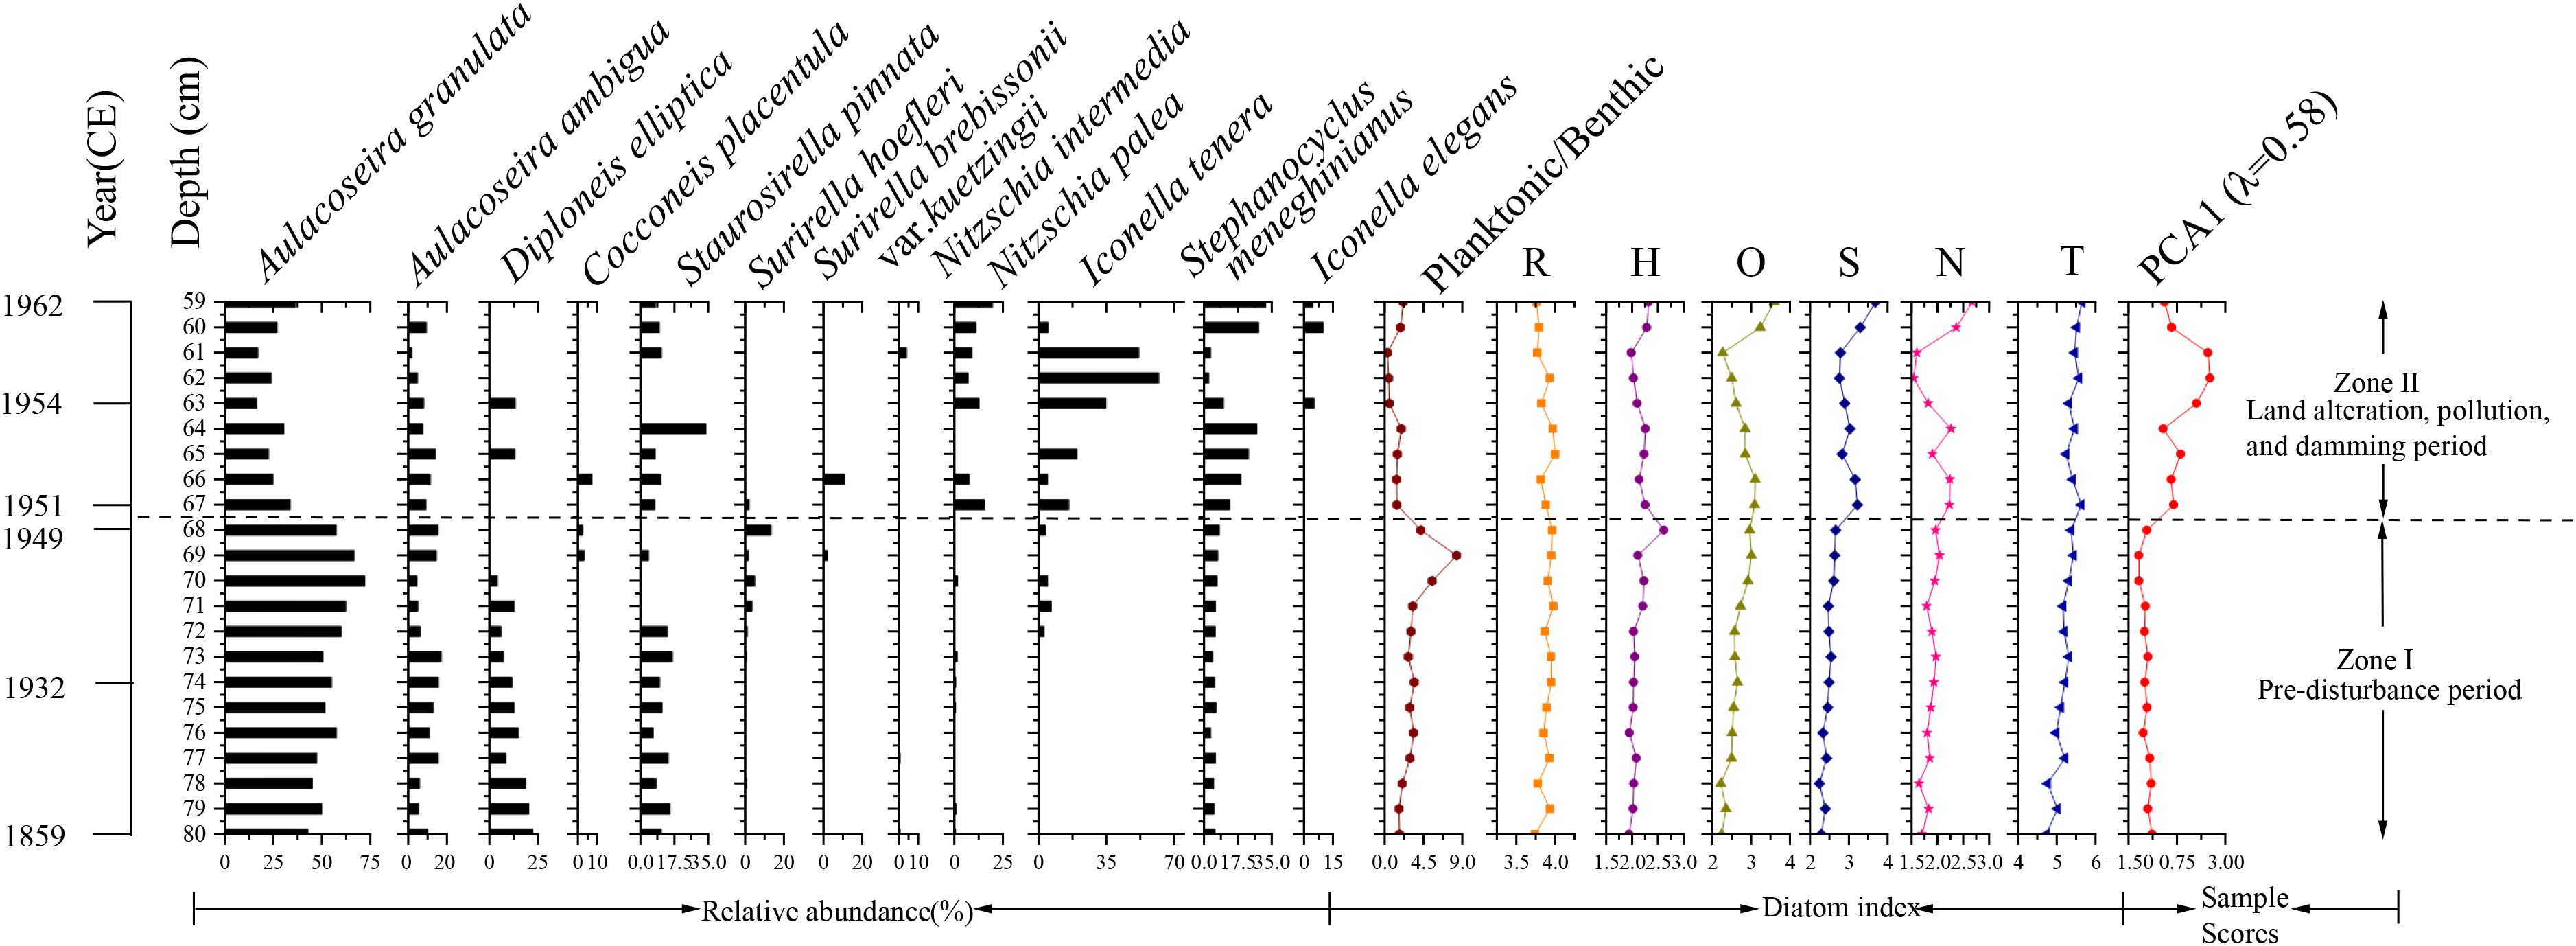
Figure 4. Stratigraphic distribution of dominant diatom taxa (≥2% relative abundance in at least one interval) and associated changes in diatom-based ecological indices in the sediment core from Chagan Lake. Ecological indicators include pH class (R), salinity class (H), oxygen requirement class (O), saprobity class (S), nitrogen uptake metabolism class (N), and trophic state class (T). Also shown are PCA Axis 1 sample scores.
The hierarchical cluster analysis identified two major diatom zones in the 59–80cm sediment record of Chagan Lake: Zone I (80–68 cm, ca. 1859–1950 CE) and Zone II (67–59 cm, ca. 1951–1962 CE).
Zone I (ca. 1859–1950 CE) exhibited a pronounced dominance of Aulacoseira granulata, a common freshwater taxon, displaying relative abundances ranging from 43% to 72% across the interval. This zone was further characterized by four persistent subdominant species: Aulacoseira ambigua, Stephanocyclus meneghinianus, D. elliptica, and Staurosirella pinnata, all of which occurred consistently in all samples with mean abundances exceeding 5%. While N. palea and Surirella hoefleri were recurrent throughout multiple horizons, their mean abundances remained comparatively low. In contrast, five taxa (C. placentula, E. gibba, Nitzschia intermedia, Surirella brebissonii var. kuetzingii and I. tenera) had sporadic occurrences. Consistent with the dominance of planktonic taxa, this zone showed a relatively high planktonic-to-benthic diatom ratio (3.47 ± 1.78), indicative of deeper or well-mixed water conditions during this period.
Zone II (ca. 1951–1962 CE) marked a pronounced departure from Zone I in assemblage composition, most notably through the sharp decline of A. granulata (16–36% relative abundance vs. 43–72% in Zone I). This shift is further reflected in a substantially lower planktonic-to-benthic diatom ratio (1.26 ± 0.68), suggesting a transition toward shallower or more stratified water conditions. Concurrently, four taxa—Stephanocyclus meneghinianus (average ~ 18%), N. palea (12%), I. tenera (28%), and Staurosirella pinnata (13%)—emerged as dominant constituents. Notably, Iconella elegans first appeared within this interval, occurring exclusively in horizons 59, 60, and 63 (average ~ 6%). In contrast, six taxa (C. placentula, D. elliptica, Surirella brebissonii var. kuetzingii, Surirella hoefleri, E. gibba and Nitzschia intermedia) displayed sporadic occurrences.
The cluster analysis and PCA results revealed pronounced compositional shifts in diatom assemblages around 1950 (Figure 5). The PCA of the diatom data revealed that axis 1 and axis 2 explained 57.7% and 21.8% of the variance respectively (Figure 5b). Axis 1 was dominated by strong negative loadings of the planktonic, eutrophication‐tolerant A. granulata (PC1 loading—0.67) and strong positive loadings of the benthic, pollution‐tolerant taxa I. tenera (+0.70) and N. palea (+0.16). Axis 2 was characterized by strong positive loadings of Stephanocyclus meneghinianus (+0.57) and Staurosirella pinnata (+0.34), and negative loadings of A. granulata (–0.47) and I. tenera (–0.55). The PCA1 scores (Figure 4) provided a concise summary of the compositional turnover, facilitating the interpretation of the dynamic patterns observed in the diatom assemblages. Overall, both cluster analysis and PCA reveal the maximum reorganization of the diatom community around the 1950s, which was a period of initial land alteration, water pollution, and hydro management.
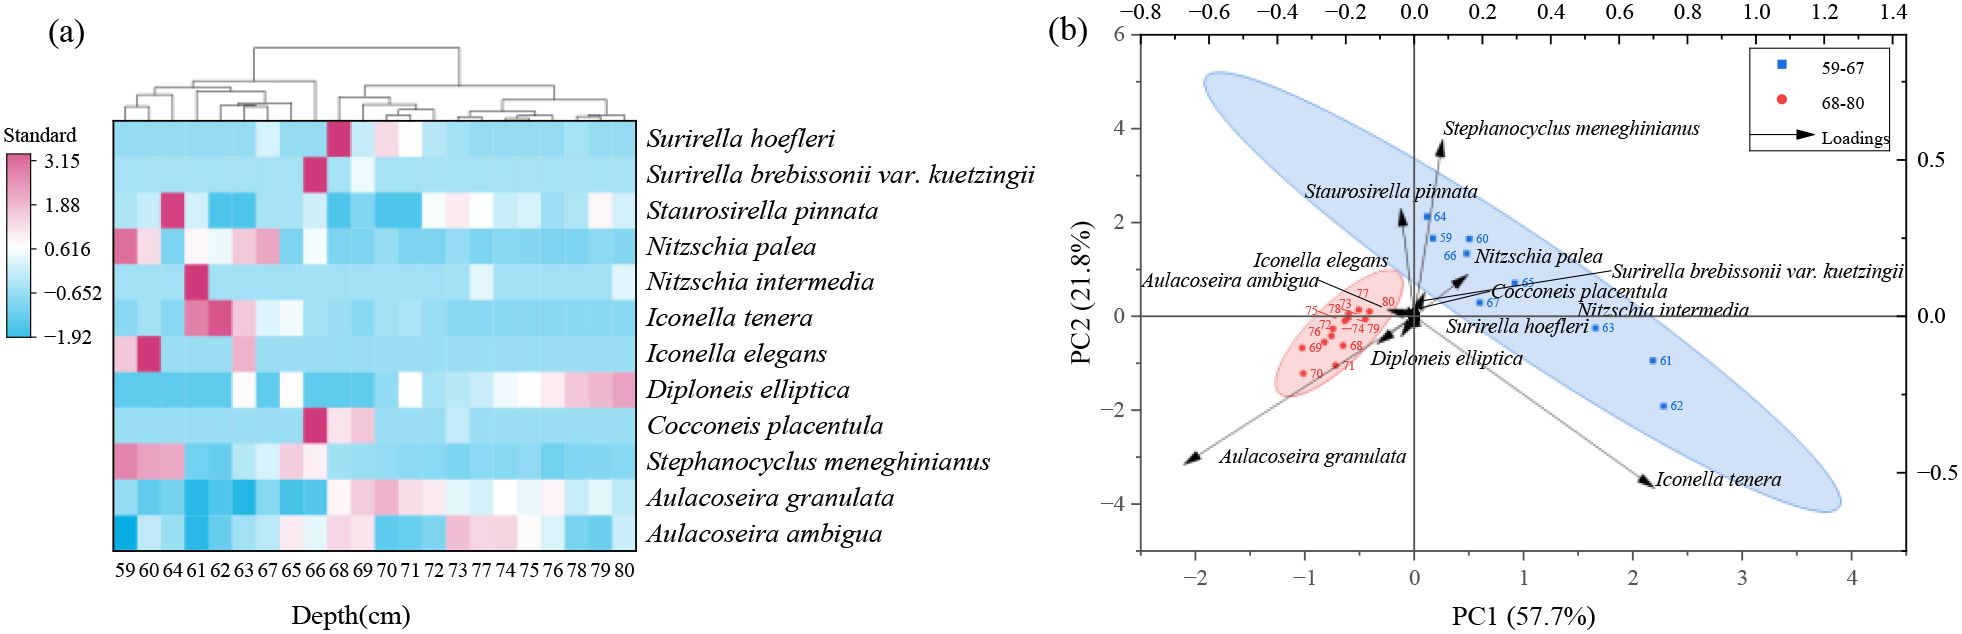
Figure 5. The cluster analysis (a) and principal component analysis (b) of diatom assemblages (diatom taxa with a relative abundance of ≥2%).
3.4 Historical trends in water environment parameters
Based on the diatom ecological attribute classification method proposed by Mertens et al., historical environmental changes in Chagan Lake were inferred from sediment core samples. The ecological indicator classes—pH (R), salinity (H), oxygen requirement (O), saprobity (S), nitrogen uptake metabolism (N), and trophic state (T)—exhibited consistent values with minimal variation within the 80–68 cm depth interval. This stability suggests relatively stable environmental conditions during this period. However, above the 67 cm layer (i.e. 1951 CE), the values of O, S, N, and T began to show notable fluctuations. A gradual increase in these indicators was observed between 61 and 59 cm, corresponding to more recent sediment layers. This trend indicates that, since around 1950, Chagan Lake’s aquatic environment has experienced increasing external anthropogenic influences (Figure 4).
pH (R): Values in the 59–80 cm interval ranged from 3.74 to 4.00, indicating diatom assemblages predominantly aligned with circumneutral to alkaliphilous preferences (classes 3–4). This suggests that, for most of the period from the mid-19th to the mid-20th century, the lake’s pH generally hovered near or above neutrality, with moderate alkaline tendencies.
Salinity (H): Values ranged from 1.94 to 2.62. These values indicated that the diatom assemblages predominantly fell within the boundary of fresh to brackish‐fresh conditions (classes 1–3), implying moderately low salinity. Throughout much of the mid-19th to mid-20th century, Chagan Lake likely maintained water chemistry characterized by limited chloride concentrations and salinity below the brackish threshold.
Oxygen requirement (O): Values ranged from 2.22 to 3.59, corresponding to classes 2–4 (Mertens et al., 2025). In Zone I (80–68 cm), O values predominantly lay in the class 2–3 intervals, indicating diatom assemblages adapted to roughly 50–75% oxygen saturation. By contrast, in Zone II (67–59 cm) the O values shifted downward into the class 2–4 range, reflecting a transition to diatom communities that tolerate low oxygen saturation (30–75%). Although several samples in Zone II (at 59, 60, 66, and 67 cm) exceeded 3.0, none reached the class 4 threshold.
Saprobity (S): Values ranged from 1.74 to 3.18. In Zone I, S values spanned classes 1–2, with most samples clustering around class 2 (β-mesosaprobous), indicating water quality class II, oxygen saturation of 70–85%, and BOD520 of 2–4 mg·L−1 (moderate organic pollution). In Zone II, however, S values shifted into classes 2–3; notably, samples at 59, 60, 64, 66, and 67 cm approached class 3 (α-mesosaprobous), indicating episodic organic enrichment (BOD520: 4–13 mg·L−1) and reduced oxygen saturation (25–70%).
Nitrogen uptake metabolism (N): Values ranged from 1.54 to 2.67. In Zone I, N values ranged from 1.64 to 2.04, with most samples falling in Class 2, indicative of nitrogen-autotrophic diatom assemblages relying primarily on inorganic nitrogen. In Zone II, however, N values extended up to 2.67, bringing samples into class 3 and reflecting a facultative nitrogen-heterotrophic capability. This transition from class 1–2 in Zone I to class 1–3 in Zone II suggests that, after ca. 1950s, Chagan Lake experienced more frequent organic nitrogen inputs alongside its baseline inorganic nitrogen regime.
Trophic status (T): Values were consistently high, ranging from 4.23 to 5.15. In Zone I, T values ranged from 4.23 to 4.93, corresponding to classes 4–5 (meso-eutrophic to eutrophic). In Zone II, the range extended from 4.74 up to 5.15, with samples at 59, 60, 62, and 67 cm exceeding 5.0, firmly within class 5 (eutrophic). This upward transition from a mixture of classes 4–5 in Zone I to predominantly class 5 in Zone II reflects an intensification of nutrient enrichment—and thus eutrophication—occurring after ca. 1950s.
4 Discussion
4.1 Anthropogenic disturbance on sedimentary processes
The sediment core from Chagan Lake records clear shifts in sedimentation rate and grain size distribution from 1859 to 2016 CE, reflecting transitions in both natural depositional processes and anthropogenic disturbance.
Prior to the 1950s (80–68 cm), sediment accumulation was relatively slow, and the deposits were dominated by fine particles (<16 μm). However, the mean grain size (~31 μm) was relatively coarse due to intermittent inputs of coarser materials, possibly from seasonal runoff or wind-induced resuspension. The high standard deviation (± 10 μm) further implies a heterogeneous depositional regime under weak but variable hydrodynamic conditions typical of shallow semi-arid lakes.
Between the 1950s and 1980s (67–48 cm), the sedimentation rate increased, coinciding with regional agricultural expansion and the construction of dams (Figure 6). Grain-size analysis indicates a slight coarsening trend, associated with intensified land use and reservoir development which reduced surface inflow, created a negative water balance (evaporation exceeding inflow), lowered lake levels, and contracted the lake surface—thereby promoting deposition of coarser material. The high standard deviation (± 10 μm) indicates sustained variability in sediment sources and more dynamic inflow conditions driven by catchment erosion, irrigation return flows, and watershed disturbances.
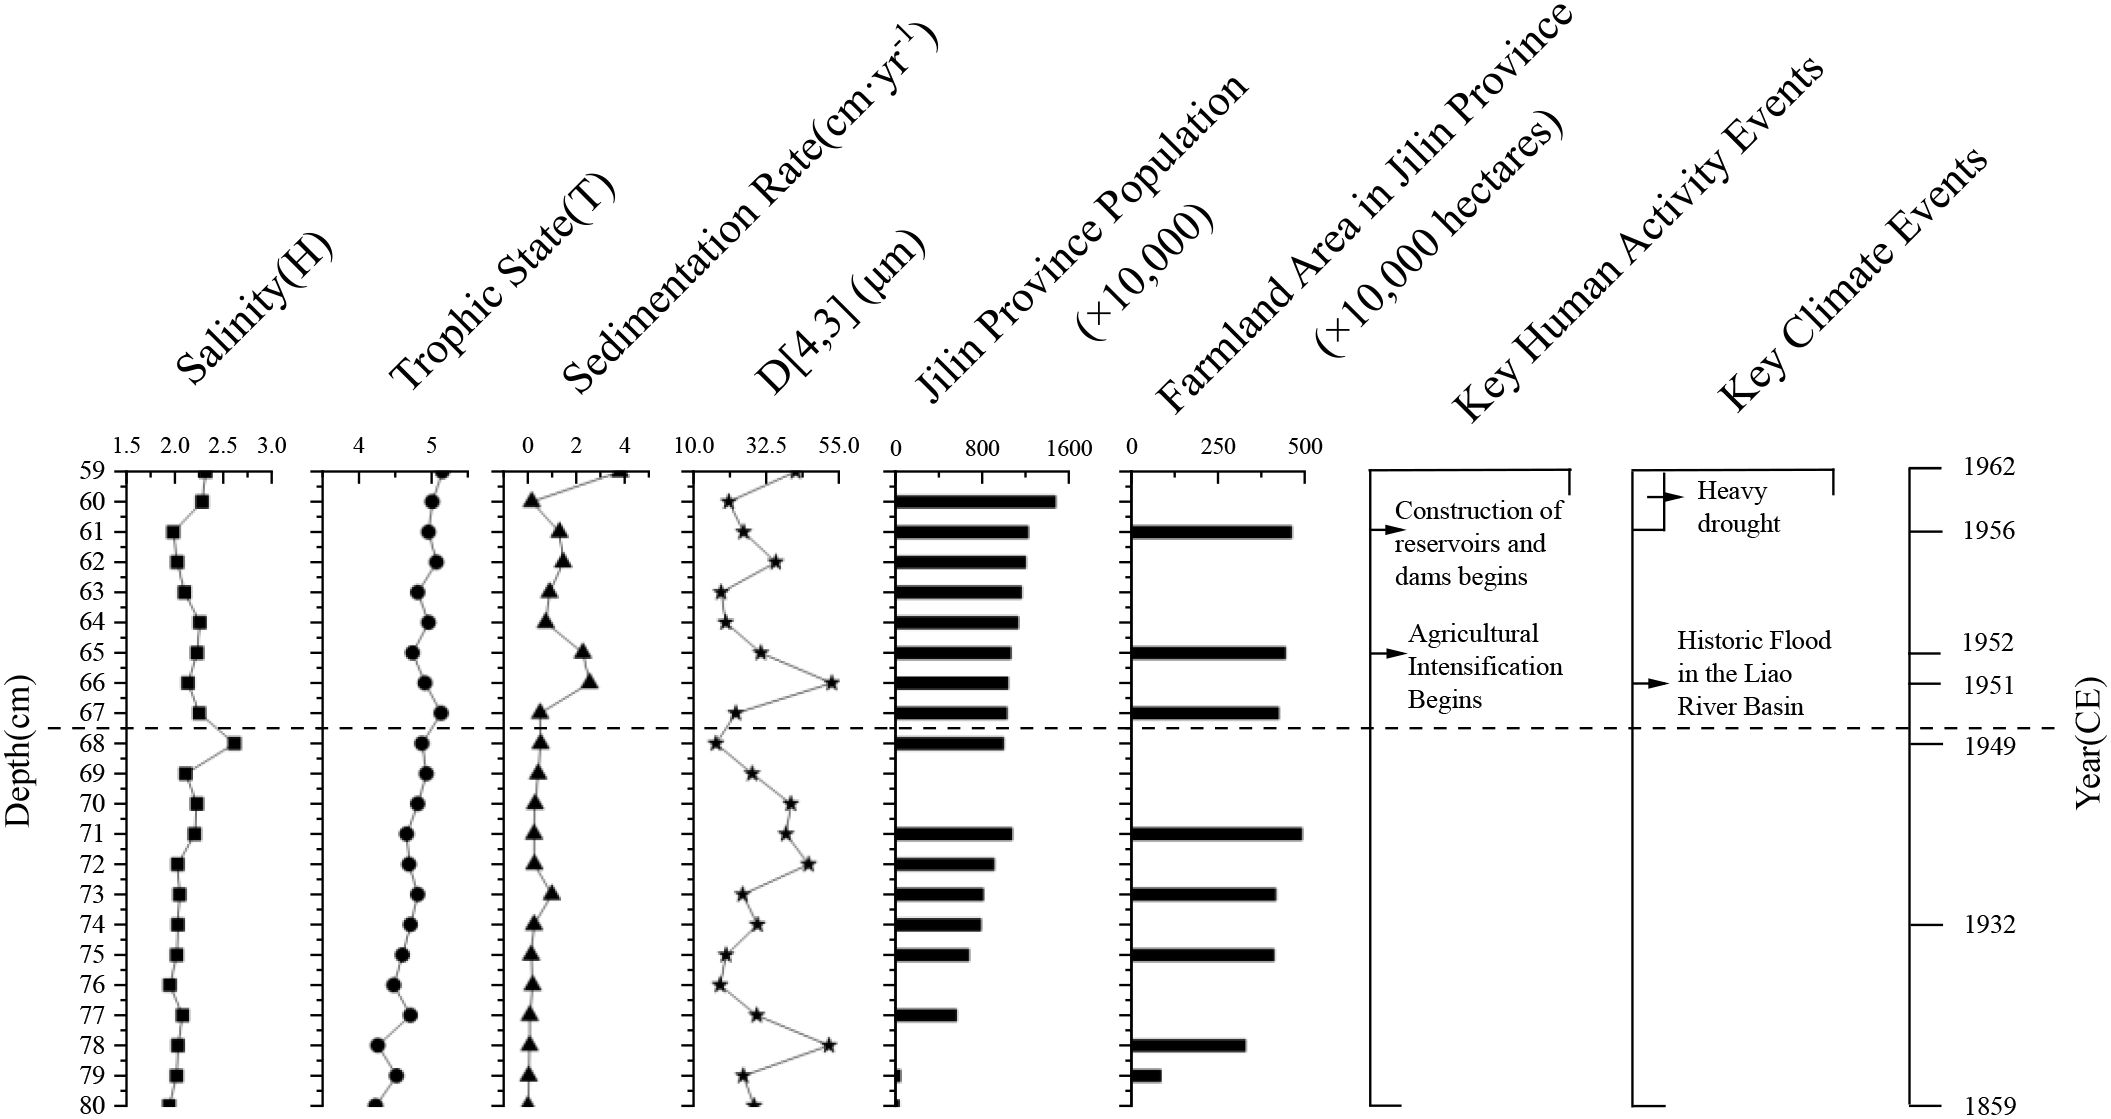
Figure 6. Summary of key sedimentary and environmental parameters in the Chagan Lake core. Data sources: Information on population, agricultural production, meteorological disasters, and water conservancy projects was obtained from the Jilin Provincial Gazetteer (Jilin Provincial Local Gazetteer Compilation Committee, n.d.). Data gaps reflect incomplete historical records; missing values do not indicate zero.
Interestingly, the sediment accumulation rate in Chagan Lake exhibits not only a significant long-term upward trend but also notable short-term variability. Particularly after the 1950s, the sediment record shows marked fluctuations. At a depth of 66 cm (early 1951 CE), the sedimentation rate peaked at 2.55 cm·yr−1, with a mean grain size of 52.86 μm. These changes in sedimentary characteristics were likely caused by a catastrophic flood in the Liao River Basin, triggered by extreme rainfall over northeastern China in 1951. The event severely affected many parts of Jilin Province and likely caused extensive soil erosion and substantial sediment influx into the Chagan Lake. Shortly thereafter, at depths of 64–60 cm (ca. 1953–1962 CE), the sedimentation rate experienced a brief but significant decline. Historical records indicate that northeastern China suffered severe droughts between 1958 and 1962, during which reduced sediment input likely led to the observed decrease in accumulation. In the following decades, sedimentation rates remained highly variable, suggesting unstable sediment supply conditions. These high-amplitude variations likely reflect the combined influence of intense yet intermittent human activities—such as agricultural expansion, irrigation return flow, hydrological regulation, and increased pollution from population growth—and extreme climatic events (Figure 6).
After the 1980s (47–1 cm), the sedimentation rate remained high, but with a shift toward finer particles and more uniform deposition. This transformation likely reflects more stable hydrological inputs and decreased variability in sediment sources, associated with improved water management and the implementation of ecological restoration measures. A key driver was the completion of an artificial canal in 1984 that diverted water from the Songhua River into Chagan Lake, introducing substantial new sediment inputs and raising the lake level. Concurrent climatic trends—namely, increasing regional precipitation and decreasing evaporation from 1960 to 2018—further contributed to the lake’s hydrological recovery (Liu et al., 2020b). Following the 1990s, growing public environmental awareness prompted a series of government-led conservation initiatives. In 2007, Chagan Lake was designated a national nature reserve with a 147 km2 outer protection zone. Further efforts included the launch of the National Ecological Riparian Project in 2014, which targeted 23.6 km of degraded shoreline through measures designed to mitigate erosion, stabilize lake margins, and reduce soil loss due to freeze–thaw processes (Li and Zheng, 1997). Collectively, these anthropogenic and climatic influences led to a more regulated sedimentary regime and improved ecological conditions.
It is important to note that the sedimentation rates used in this study are based on volumetric (linear) accumulation estimates derived from 210Pb dating. While these values provide valuable insights into temporal trends, they primarily reflect relative rather than absolute changes in erosional and depositional dynamics. Accordingly, our interpretation focuses on the comparative shifts in sediment input and transport regimes over time, rather than precise mass accumulation.
4.2 Principal component analysis of diatom assemblages
The PCA ordination highlights two distinct ecological gradients governing diatom assemblage shifts in Chagan Lake. Principal Axis 1 (57.7% variance) was primarily driven by A. granulata, I. tenera and N. palea. A. granulata is a planktonic species commonly found in deeper, well-mixed waters with moderate trophic conditions and dominated the assemblages before the 1950s (Zone I). Its prevalence suggests relatively stable hydrological conditions, weak alkaline pH (~7–8), moderate oxygen saturation, low organic pollution, and a meso-eutrophic state. In contrast, I. tenera and N. palea both epipelic species—increased after the 1950s (Zone II). These species are typically associated with fine-grained, unstable sediments and organically enriched, oxygen-poor conditions (Dalu et al., 2020; Klamt et al., 2020). Their increase reflects not only eutrophication but also a shift in dominant habitat types from planktonic to benthic, likely driven by shallowing of the lake, intensified siltation, and increased disturbance, in line with anthropogenic influences such as agricultural runoff and hydrological regulation. This shift is further supported by the decline in the planktonic-to-benthic diatom ratio, which dropped from 3.47 ± 1.78 in Zone I to 1.26 ± 0.68 in Zone II. This quantitative trend reinforces the interpretation of a functional community transition from planktonic dominance to benthic taxa, likely in response to decreased mixing depth and increased habitat instability. Thus, Axis 1 represents a complex ecological gradient: while it clearly captures the transition from meso-eutrophic to eutrophic conditions, it also reflects a shift in life-forms from planktonic (A. granulata) to benthic (Nitzschia, Iconella, and Surirella) diatoms.
Additionally, the notable rise of Cocconeis placentula, a typical epiphytic diatom, during the transition between Zones I and II may suggest an expansion of submerged macrophytes, potentially associated with a decline in lake level and improved light penetration. This period also coincides with a decline in sedimentation rate, further supporting the possibility of macrophyte proliferation during a more hydrologically stable or shallow phase. Notably, Surirella hoefleri only appeared in the layers with a lower sedimentation rate and reached its peak during this transition. This species is usually found in environments with high conductivity (Krammer and Lange-Bertalot, 1988; Stenger-Kovács and Lengyel, 2015). Its abundance likely reflects a temporary increase in salinity, providing additional evidence of changing hydrological conditions.
Axis 2 (21.8% variance) seems to represent the gradient changes influenced by salinity and oxygen dynamics. Positive loadings were associated with Stephanocyclus meneghinianus and Staurosirella pinnata. The tolerance of Stephanocyclus meneghinianus to brackish-fresh transitions and hypoxia indicates that it tends to adapt to salinity fluctuations or low-oxygen microhabitats, while the high-oxygen requirement of Staurosirella pinnata may suggest the presence of local oxygen-rich areas, which may be related to seasonal water level changes or sediment resuspension. Negative loadings for A. granulata and I. tenera (both with H=2) may reflect the dominance of freshwater. This means that Axis 2 captures the secondary gradients of salinity changes and redox heterogeneity, which may be influenced by intermittent hydrological inputs or human lake management.
Although A. granulata is often associated with eutrophic systems, its dominance in Zone I (negative Axis 1) was accompanied by low saprobity (S=2) and moderate oxygen levels (O=3), suggesting early-stage nutrient enrichment rather than severe organic pollution. In addition, A. granulata’s heavy silicified filamentous depend on wind-driven turbulence to maintain suspension—an increasingly unmet requirement as wind speeds decline. Previous studies have documented a significant decrease in near-surface wind velocities across mid-latitude regions from the mid-20th century to around 2010, a phenomenon known as “global terrestrial stilling” (Deng et al., 2018; McVicar et al., 2012). This “stilling” reduced mixing depth, disadvantaging A. granulata against benthic, heterotrophic taxa like N. palea (S=5, N=4), which thrived under complex stress conditions, even in eutrophic environments. Thus, the convergence of diminished turbulence, eutrophication, and hydrological modifications favored stress-tolerant assemblages, surpassing purely nutrient-driven succession patterns.
4.3 Drivers and implications of water environment changes
The diatom-derived ecological indicators provide a detailed understanding of the dynamic changes in the water environment of Chagan Lake from the mid-19th century to the mid-20th century. The interactions among pH, salinity, oxygen saturation, saprobity, nitrogen metabolism, and trophic state reveal a system that is constantly transforming under both natural and anthropogenic pressures, providing crucial insights into its ecological trajectory.
The weakly alkaline conditions (pH classification: 3.74–4.00) inferred from diatom assemblages are consistent with the dominance of alkaliphilic taxa such as Stephanocyclus meneghinianus and A. granulata. These taxa thrive in environments dominated by bicarbonate ions (HCO3−) and carbonate ions (CO32−), which are characteristic of the geological origin of this lake in the saline-alkali Songnen Plain (Deng et al., 2018; Wang and Zheng, 1992). The persistence of alkaline conditions reflects ongoing inputs of Na+ and HCO3− through weathering of regional bedrock and interactions with Quaternary sediments. However, the absence of extreme alkalibiontic taxa (class 5) suggests pH remained below 9.0, avoiding conditions that could severely limit dissolved oxygen solubility (Passy et al., 2004).
Salinity classification values (1.94–2.62) reflect freshwater to brackish fresh environment (Cl−: ~100–500 mg·L−1), which is consistent with modern measurement results (Sui et al., 2016). This moderate salinity may result from the balance between natural groundwater inputs (rich in Na+ and HCO3−) and dilution by the Songhua River. However, following the 1950s, agricultural expansion and irrigation drainage likely contributed additional salts and nutrients to the lake, resulting in a slight increase in salinity and the ecological shifts observed in Zone II (Liu et al., 2021).
Oxygen saturation is a key water quality parameter that directly affects the functions of aquatic ecosystems. It exerts its influence by affecting the survival of organisms, biodiversity, and biogeochemical cycles. In Chagan Lake, sedimentary diatom proxies indicate moderate–good oxygenation (50–75% saturation) from the mid-19th to mid-20th century, but saturation fell to 30–50% by the 1960s under growing anthropogenic and climatic stress. Since the mid-20th century, Northeast China has experienced significant warming, with Chagan Lake’s regional annual temperature rising at a rate of 0.43 °C per decade (Liu et al., 2020a). This warming increases lake water temperature, reduces the solubility of oxygen, and enhances microbial metabolic rates—together contributing to lower oxygen saturation, particularly under the lake’ s alkaline conditions (pH>8). In addition, the long ice-cover period of Chagan Lake restricts atmospheric gas exchange and limits light availability for photosynthesis, leading to under-ice anoxia in shallow areas during winter months (Zdorovennova et al., 2021). Even during the ice-free season, reduced wind speeds may weaken vertical mixing, exacerbate stratification, and limit oxygen transport to deeper layers (Deng et al., 2018).
These climate-driven mechanisms (temperature rise, ice cover duration, and wind patterns) may synergize with anthropogenic pressures (e.g., nutrient input from agriculture), creating a compounding effect on oxygen saturation.
Historical records support this interpretation. As a former royal hunting reserve, Chagan Lake’s wetland ecosystem remained largely undisturbed until the mid-20th century, maintaining natural hydrological connectivity and vegetation coverage. This relatively pristine state is maintained through the interaction between undisturbed sediments and water bodies, as well as the maintenance of an effective oxygen regulation by aquatic plant communities. The decline in oxygen levels in the 1960s coincided with the beginning of regional development (Figure 6), although the impact of pre-industrialization was still relatively limited compared to the changes in the late 20th century. This paleolimnological reconstruction demonstrates diatom assemblages’ sensitivity to oxygen regime changes, with their compositional variations effectively capturing early warning signals of ecosystem stress.
The distribution of saprobic indicator taxa in aquatic sediments is more responsive to increasing pollution than to improvements in water quality. Saprophilous taxa often have broad environmental tolerances and can persist even under low-saprobity conditions (Mertens et al., 2025). In the 59–80 cm interval of the sediment core, spanning from the mid-19th century (80 cm, ~1859 CE) to the mid-20th century (59 cm, ~1962 CE), shifts in diatom assemblages reflect temporal variations in organic loading (BOD520) and associated oxygen demand. From the mid-19th to early 20th century (74–80 cm, S=1.74–1.99), oligosaprobous taxa, notably D. elliptica, dominated under low organic enrichment, which was consistent with stable oxygen conditions. Under these conditions, limited biodegradable organic matter reduced BOD520 and maintained an aerobic habitat conducive to pollution-sensitive species. By the mid-20th century (59–64 cm, S=2.26–3.18), the increase in agricultural activities raised the input of organic matter, promoting the dominance of β−mesosaprobous A. granulata and polysaprobous taxa such as Stephanocyclus meneghinianus and N. palea. Elevated organic loads likely stimulated microbial decomposition, intensified BOD520, and created anaerobic conditions that inhibited oligosaprobous diatoms. This can be seen from the peak saprobity index at 59 cm (S=3.18 at 59 cm). Between these two phases (65–73 cm, S=1.97–2.72), oligosaprobous taxa such as C. placentula showed intermittent recovery and the polysaprobous Nitzschia intermedia appeared sporadically, while Surirella hoefleri remained consistently abundant. Given its well-documented preference for high-conductivity, elevated-salinity waters (Krammer and Lange-Bertalot, 1988; Stenger-Kovács and Lengyel, 2015), the persistence of S. hoefleri in this interval likely reflects periodic salinity peaks superimposed on fluctuating organic loading. Together, these patterns of mixed saprobic and salinity-tolerant taxa indicate irregular oxygen demand and unstable redox conditions, creating a mosaic of ecological niches.
Because the saprobic index integrates both biodegradable organic load and dissolved oxygen, its gradient closely mirrors previously discussed oxygen saturation trends—ranging from 70–85% in β-mesosaprobous to 25–70% in α-mesosaprobous conditions. The increase in saprobity index—from S=1.79 at a depth of 80 cm (mid-19th century) to S=3.18 at a depth of 59 cm (mid-20th century)—reflects the gradual rise in the degree of organic pollution over time. The higher S values in the upper layers reflect elevated BOD520, resulting from increased organic matter input that depletes dissolved oxygen and favors pollution-tolerant taxa. Conversely, the lower S values in the deeper layers correspond to reduced BOD520 levels, preserving aerobic conditions for several oligosaprobous species.
The nitrogen uptake metabolism index increased from 1.70 at 80 cm to 2.67 at 59 cm, indicating a shift from dominance by nitrogen-autotrophic taxa to an increasing reliance on organically bound nitrogen after the 1950s. This transition is coherent with the simultaneous saprobity increase (S=1.79 → 3.18) and the rise in the oxygen‐requirement index (2.23 → 3.59), both of which testify to intensifying organic pollution and higher biochemical oxygen demand. Accordingly, the trophic state index climbed from 4.23 (mesotrophic) to 5.15 (eutrophic), which was consistent with the enrichment degree of nutrients and the increase in primary productivity. Taken together, the converging lines of evidence—from oxygen requirement trend, through saprobity, to nitrogen‐uptake metabolism and trophic state—paint a clear picture of progressive eutrophication and organic-N loading from the mid-19th to the mid-20th century. The diatom assemblages showed a rising proportion of facultative nitrogen-heterotrophic species, underscoring the value of nitrogen uptake metabolism as a sensitive indicator of nutritional regime shifts.
Furthermore, it should be emphasized that diatom remains were notably scarce in sediments above 59 cm (ca. 1962–2016 CE) in this study, including the top 10 cm (ca. 2008–2016 CE). However, field investigations of algal communities in Chagan Lake in 2008 (Sui et al., 2016) and another study in 2012 (Li et al., 2014) reported relatively abundant diatom populations, suggesting that the low diatom abundance in sediments may result from post-depositional dissolution processes rather than a decline in diatom productivity. Similar patterns have been documented in other saline-alkaline or alkaline lakes, where elevated pH, increased salinity, and intensified silica cycling can lead to significant dissolution of diatom frustules prior to their preservation in sediments (Lent and Lyons, 2001; Paull et al., 2017). These findings imply that the scarcity of diatom remains in Chagan Lake sediments may not reflect an actual reduction in diatom populations but rather a taphonomic bias caused by unfavorable preservation conditions. Future studies should integrate high-resolution environmental indicators (e.g., in situ salinity and dissolved oxygen monitoring) with modern diatom community surveys to further validate these mechanisms.
5 Conclusions
Sedimentary diatom records from Chagan Lake (ca. 1859–1962 CE) reveal a transition from relatively stable environmental conditions to pronounced ecological change beginning in the 1950s, coinciding with population growth, intensified agricultural drainage and hydrological regulation. During the earlier phase (Zone I), the lake maintained weakly alkaline and fresh-brackish conditions, with dominance of planktonic diatoms such as A. granulata and A. ambigua, reflecting a meso-eutrophic state with low organic pollution and moderate oxygen saturation. After the 1950s (Zone II), notable changes emerged in sediment rate, grain size, and diatom composition. The decline in planktonic taxa and the proliferation of benthic, pollution-tolerant species (e.g., N. palea, I. tenera) were accompanied by elevated ecological indicator values for saprobity, nitrogen uptake metabolism, and trophic state. These shifts signal a transition toward eutrophication, increased organic loading, and declining oxygen levels—largely driven by catchment disturbance, nutrient input, and regional climate change. These results (1) determine the time and nature of the impact of human activities on the lake ecosystem, and (2) emphasize the effectiveness of diatom-based ecological classification indices as early warning tools for lake degradation.
However, the limited temporal resolution and absence of diatom data after 1962 constrain our understanding of the complete trajectory and mechanisms of ecological changes. Future studies should expand paleolimnological reconstructions and long-term environmental monitoring to more accurately assess historical baselines and the recovery capacity of saline-alkali lake systems under continuous anthropogenic and climatic pressures.
Data availability statement
The original contributions presented in the study are included in the article/supplementary material. Further inquiries can be directed to the corresponding author/s.
Author contributions
FS: Data curation, Methodology, Writing – original draft, Formal Analysis. XD: Formal analysis, Writing – original draft, Data curation, Methodology. HX: Supervision, Writing – review & editing, Formal analysis, Funding acquisition. SZ: Writing – review & editing, Data curation. HH: Data curation, Writing – original draft. QL: Writing – original draft, Data curation. YL: Writing – review & editing. NZ: Writing – original draft, Data curation. YF: Funding acquisition, Formal analysis, Supervision, Writing – review & editing.
Funding
The author(s) declare that financial support was received for the research and/or publication of this article. This work was supported by the Open Project Funding of Key Laboratory of Intelligent Health Perception and Ecological Restoration of Rivers and Lakes, Ministry of Education, Hubei University of Technology (Grant No.HGKFYBP26); and the National Natural Science Foundation of China (Grant No.32400302, Grant No.32370215).
Acknowledgments
We would like to express our sincere gratitude to Associate Professor Sun Huajie and Associate Professor Xie Ruifeng from the College of Geography, Harbin Normal University, for their substantial support in sample collection and chronological data analysis. Their assistance has been invaluable to the success of this research.
Conflict of interest
The authors declare that the research was conducted in the absence of any commercial or financial relationships that could be construed as a potential conflict of interest.
Generative AI statement
The author(s) declare that Generative AI was used in the creation of this manuscript. We used ChatGPT (OpenAI) to improve the language and readability of the manuscript. All scientific content, interpretation, and conclusions are solely those of the authors.
Publisher’s note
All claims expressed in this article are solely those of the authors and do not necessarily represent those of their affiliated organizations, or those of the publisher, the editors and the reviewers. Any product that may be evaluated in this article, or claim that may be made by its manufacturer, is not guaranteed or endorsed by the publisher.
References
Andrén E., Telford R. J., and Jonsson P. (2017). Reconstructing the history of eutrophication and quantifying total nitrogen reference conditions in Bothnian Sea coastal waters. Estuarine Coast. Shelf Sci. 198, 320–328. doi: 10.1016/j.ecss.2016.07.015
Appleby P. G. (2001). “Chronostratigraphic techniques in recent sediments,” in Tracking environmental change 738 using lake sediments. Terrestrial, algal, and siliceous indicators, vol. 1 . Eds. Last W. M. and Smol J. P. (Kluwer Academic 739 Publishers, Dordrecht), 171–203. doi: 10.1007/0-306-47669-X_9
Bak Y. S. and Nam S. I. (2024). Holocene paleoenvironmental change based on diatom records from the continental shelf of the Chukchi Sea in the Arctic Ocean. Geosciences J. 28, 137–144. doi: 10.1007/s12303-023-0040-7
Balasubramaniam K., Rühland K. M., and Smol J. P. (2023). A diatom-based paleolimnological re-assessment of previously polymictic Lake Opinicon, Ontario (Canada): crossing an ecological threshold in response to warming over the past 25 years. J. Paleolimnology 69, 37–55. doi: 10.1007/s10933-022-00261-w
Birks H. J. B., Last W. M., and Smol J. P. (2001). Tracking environmental change using lake sediments. Volume 3: Terrestrial, algal, and siliceous indicators Vol. 371 (Dordrecht, Netherlands: Kluwer Academic Publishers), 1571–5299. doi: 10.1007/0-306-47668-1
Burge D. R., Edlund M. B., and Frisch D. (2018). Paleolimnology and resurrection ecology: The future of reconstructing the past. Evolutionary Appl. 11, 42–59. doi: 10.1111/eva.12556
Cheng Y., Baud A., Gregory-Eaves I., Simmatis B., Smol J. P., and Griffiths K. (2023). Climate change and nutrient enrichment altering sedimentary diatom assemblages since pre-industrial time: evidence from Canada’s most populated ecozone. J. Paleolimnology 69, 57–75. doi: 10.1007/s10933-022-00262-9
China.Meteorological.Administration (2010). Meteorological observations at Qianguo Station, (1981–2010) (Beijing, China: China Meteorological Data Service Center). Available online at: https://data.cma.cn.
Dalu T., Cuthbert R. N., Chavalala T. L., Froneman P. W., and Wasserman R. J. (2020). Assessing sediment particle-size effects on benthic algal colonisation and total carbohydrate production. Sci. Total Environ. 710, 136348. doi: 10.1016/j.scitotenv.2019.136348
Deng J., Paerl H. W., Qin B., Zhang Y., Zhu G., Jeppesen E., et al. (2018). Climatically-modulated decline in wind speed may strongly affect eutrophication in shallow lakes. Sci. Total Environ. 645, 1361–1370. doi: 10.1016/j.scitotenv.2018.07.208
Dixit S. S., Dixit A. S., and Smol J. P. (2002). Diatom and chrysophyte functions and inferences of post-industrial acidification and recent recovery trends in Killarney lakes (Ontario, Canada). J. Paleolimnology 27, 79–96. doi: 10.1023/A:1013571821476
Enache M. D., Paterson A. M., and Cumming B. F. (2011). Changes in diatom assemblages since pre-industrial times in 40 reference lakes from the Experimental Lakes Area (northwestern Ontario, Canada). J. Paleolimnology 46, 1–15. doi: 10.1007/s10933-011-9504-2
Favot E. J., Rühland K. M., Paterson A. M., and Smol J. P. (2024). Sediment records from Lake Nipissing (ON, Canada) register a lake-wide multi-trophic response to climate change and reveal its possible role for increased cyanobacterial blooms. J. Great Lakes Res. 50, 102268. doi: 10.1016/j.jglr.2023.102268
Guiry M. D. and Guiry G. M. (2025). AlgaeBase (Galway: National University of Ireland). Available online at: https://www.algaebase.org.
Han J., Kirby M., Carlin J., Nauman B., and MacDonald G. (2023). A diatom-inferred water-depth transfer function from a single lake in the northern California Coast Range. J. Paleolimnology 70, 23–37. doi: 10.1007/s10933-023-00281-0
Jilin Provincial Local Gazetteer Compilation Committee. Gazetteer of Jilin province. Jilin Provincial Gazetteer Database. Available online at: https://was.jl.gov.cn/was5/web/search?token=0.1505695175134.94&channelid=287255 (Accessed May 26, 2025).
Klamt A. M., Hu K., Huang L., Chen X., Liu X., and Chen G. (2020). An extreme drought event homogenises the diatom composition of two shallow lakes in southwest China. Ecol. Indic. 108, 105662. doi: 10.1016/j.ecolind.2019.105662
Krammer K. and Lange-Bertalot H. (1986). “Bacillariophyceae. 1. Teil: naviculaceae,” in Süsswasserflora von mitteleuropa, band 2/1. Eds. Ettl H., Gerloff J., Heynig H., and Mollenhauer D. (Gustav Fisher Verlag, Jena), 876.
Krammer K. and Lange-Bertalot H. (1988). “Bacillariophyceae 2. Teil: bacillariaceae, epithemiaceae, surirellaceae,” in Subwasserflora von mitteleuropa, vol. 2 . Eds. Ettl H., Gerloff J., Heynig H., and Mollenhauer D. (Jena, Germany: Gustav Fischer Verlag).
Krammer K. and Lange-Bertalot H. (1991a). “Bacillariophyceae. 3. Teil: centrales, fragilariaceae, eunotiaceae,” in Süsswasserflora von mitteleuropa, vol. 2 . Eds. Ettl H., Gerloff J., Heynig H., and Mollenhauer D. (Jena, Germany: Gustav Fischer Verlag), 1–576.
Krammer K. and Lange-Bertalot H. (1991b). “Bacillariophyceae 4. Teil: Achnanthaceae. Kritische Erganzungen zu Navicula (Lineolatae) und Gomphonema,” in Susswasserflora von mitteleuropa. Eds. Ettl H., Gerloff J., Heynig H., and Mollenhauer D. (Gustav Fisher Verlag, Jena, Germany), 1–437.
Lent R. M. and Lyons B. (2001). Biogeochemistry of silica in Devils Lake: implications for diatom preservation. J. Paleolimnology 26, 53–66. doi: 10.1023/A:1011143809891
Li R. R., Zhang G. X., and Zhang L. (2014). Multivariate analysis of the relations between phytoplankton assemblages and environmental factors in Chagan Lake Wetland. Acta Ecologica Sin. 34, 2663–2673. doi: 10.5846/stxb201306091545
Li J. D. and Zheng H. Y. (1997). Management of saline-alkali grasslands in the songnen plain and its biogeochemical mechanisms (Beijing: Science Press).
Liu X., Zhang G., and Sun G. (2019). Assessment of Lake water quality and eutrophication risk in an agricultural irrigation area: A case study of the Chagan Lake in Northeast China. Water 11, 2380. doi: 10.3390/w11112380
Liu X., Zhang G., Xu Y. J., Wu Y., Liu Y., and Zhang H. (2020a). Assessment of water quality of best water management practices in lake adjacent to the high-latitude agricultural areas, China. Environ. Sci. pollut. Res. 27, 3338–3349. doi: 10.1007/s11356-019-06858-5
Liu X., Zhang G., Zhang J., Xu Y. J., Wu Y., Sun G., et al. (2020b). Effects of irrigation discharge on salinity of a large freshwater lake: A case study in Chagan Lake, Northeast China. Water 12, 2112. doi: 10.3390/w12082112
Liu P., Zheng C., Wen M., Luo X., Wu Z., Liu Y., et al. (2021). Ecological risk assessment and contamination history of heavy metals in the sediments of Chagan Lake, Northeast China. Water 13, 894. doi: 10.3390/w13070894
Mao X., Liu L., Zhao H., Ge Y., Jiang G., Song L., et al. (2024). Abrupt diatom assemblage shifts in Lake Baiyangdian driven by distinct hydrological changes and yet more so by gradual eutrophication. Limnologica 105, 126155. doi: 10.1016/j.limno.2024.126155
McVicar T. R., Roderick M. L., Donohue R. J., Li L.T., Van Niei T.G., Thomas A., et al. (2012). Global review and synthesis of trends in observed terrestrial near-surface wind speeds: Implications for evaporation. J. Hydrology 416, 182–205. doi: 10.1016/j.jhydrol.2011.10.024
Mertens A., van der Wal J., Verweij G., Pex B., Van Dulmen A., Van Dam H., et al. (2025). A revised list of diatom ecological indicator values in The Netherlands. Ecol. Indic. 172, 113219. doi: 10.1016/j.ecolind.2025.113219
Passy S. I., Bode R. W., Carlson D. M., and Novak M. A. (2004). Comparative environmental assessment in the studies of benthic diatom, macroinvertebrate, and fish communities. Int. Rev. Hydrobiology: A J. Covering all Aspects Limnology Mar. Biol. 89, 121–138. doi: 10.1002/iroh.200310721
Paull T. M., Finkelstein S. A., and Gajewski K. (2017). Interactions between climate and landscape drive Holocene ecological change in a High Arctic lake on Somerset Island, Nunavut, Canada. Arctic Sci. 3, 17–38. doi: 10.1139/as-2016-0013
Pennington W., Tutin T., Cambray R., and Fisher E. M. (1973). Observations on lake sediments using fallout 137Cs as a tracer. Nature 242, 324–326. doi: 10.1038/242324a0
Pienitz R., Smol J. P., and Birks H. J. B. (1995). Assessment of freshwater diatoms as quantitative indicators of past climatic change in the Yukon and Northwest Territories, Canada. J. Paleolimnology 13, 21–49. doi: 10.1007/BF00678109
Rühland K., Paterson A. M., and Smol J. P. (2008). Hemispheric-scale patterns of climate-related shifts in planktonic diatoms from North American and European lakes. Global Change Biol. 14, 2740–2754. doi: 10.1111/j.1365-2486.2008.01670.x
Smol J. P. (2019). Under the radar: long-term perspectives on ecological changes in lakes. Proc. R. Soc. B 286, 20190834. doi: 10.1098/rspb.2019.0834
Smol J. P. and Stoermer E. F. (2010). The diatoms: applications for the environmental and earth sciences (Cambridge, United Kingdom: Cambridge University Press).
Song K., Wang Z., Blackwell J., Zhang B., Li F., Zhang Y., et al. (2011). Water quality monitoring using Landsat Themate Mapper data with empirical algorithms in Chagan Lake, China. J. Appl. Remote Sens. 5, 1–17. doi: 10.1117/1.3559497
Stenger-Kovács C. and Lengyel E. (2015). Taxonomical and distribution guide of diatoms in soda pans of Central Europe. Studia Botanica hungarica 46, 3–203. doi: 10.17110/StudBot.2015.46.Suppl.3
Sui F., Zang S., Fan Y., and Ye H. (2016). Effects of different saline-alkaline conditions on the characteristics of phytoplankton communities in the lakes of Songnen Plain, China. PloS One 11, e0164734. doi: 10.1371/journal.pone.0164734
Sun H. J. (2021). Reconstruction of polycyclic aromatic hydrocarbon pollution history in typical northern lakes and response to human activities. doi: 10.27064/d.cnki.ghasu.2021.000006
Van Dam H., Mertens A., and Sinkeldam J. (1994). A coded checklist and ecological indicator values of freshwater diatoms from the Netherlands. Netherland J. Aquat. Ecol. 28, 117–133. doi: 10.1007/BF02334251
Wang S. M. and Zhang Z. K. (1999). New advances in the study of lake sediments and environmental evolution in China. Sci. Bull. 44 (6), 579–587. doi: 10.1360/csb1999-44-6-579
Wang C. M. and Zheng Y. (1992). Hydrogeological environment and land salinization in the semi-arid western region of jilin. J. Changchun Institute Geology 22 (2), 203–207.
Wei D., Yan H., Xin-shan S., and Bai-xing Y. (2000). Chemical characteristics of water environment of saline mire in the west of Songnen Plain. Geographical Res. 19 (2), 113–119. doi: 10.11821/yj2000020001
Wu H., Liao M., Guo J., Zhang Y., Liu Q., and Liu Y. (2022). Diatom assemblage responses to multiple environmental stressors in a deep brackish plateau lake, SW China. Environ. Sci. pollut. Res. 29 (8), 12051–12063. doi: 10.1007/s11356-021-17853-0
Xiao W., Zhang J., Zhou J., Yan R., and Ji Y. (2024). Diatom records in sediments for eutrophication process of lake Xian’nv, China since the mid-20th century. Global Nest J. 26, 1–11. doi: 10.30955/gnj.005247
Xie R., Sun D., Sun L., Zhang L., Zhang J., Zang S., et al. (2021). Sediment record of heavy metals over the last 150 years in Northeast China: implications for regional anthropogenic activities. Ecotoxicology 30 (2), 197–208. doi: 10.1007/s10646-021-02350-4
Xu L., Jiang W., Wang F., Wang F., Cheng Q., Xu F., et al. (2022). A big difference in 137Cs inventories based on two individual cores within a shallow lake, east China. J. Radioanalytical Nucl. Chem. 331, 5763–5770. doi: 10.1007/s10967-022-08649-8
Zdorovennova G., Palshin N., Golosov S., Efremova T., Belashev B., Bogdanov S., et al. (2021). Dissolved oxygen in a shallow ice-covered lake in winter: effect of changes in light, thermal and ice regimes. Water 13, 2435. doi: 10.3390/w13172435
Zhang Q., Dong X., Chen Y., Yang X., Xu M., Davidson T. A., et al. (2018). Hydrological alterations as the major driver on environmental change in a floodplain Lake Poyang (China): Evidence from monitoring and sediment records. J. Great Lakes Res. 44, 377–387. doi: 10.1016/j.jglr.2018.02.003
Zhang L., Hipsey M. R., Zhang G., Busch B., and Li Y. (2017). Simulation of multiple water source ecological replenishment for Chagan Lake based on coupled hydrodynamic and water quality models. Water Sci. Technology: Water Supply 17, 1774–1784. doi: 10.2166/ws.2017.079
Zhang Y., Peng W., Li Y., Xiao X., and Hillman A. (2024). Diatom-based inferences of environmental changes from an alpine lake on the southeast edge of the Tibetan plateau over the last 4000 years. Front. Earth Sci. 12. doi: 10.3389/feart.2024.1324724
Zhang S., Yang G., Zheng J., Pan S., Cao L., Aono T., et al. (2022). Global fallout Pu isotopes, 137Cs and 237Np records in the sediments of Lake Xingkai and their response to environmental changes in the catchment. Catena 215, 106276. doi: 10.1016/j.catena.2022.106276
Keywords: diatoms, sediments, ecological indicators, anthropogenic disturbance, Chagan lake
Citation: Sui F, Du X, Xiao H, Zang S, Hui H, Lv Q, Liu Y, Zhang N and Fan Y (2025) Historical water environment changes in Chagan Lake (mid-19th to mid-20th century) inferred from sedimentary diatom records. Front. Ecol. Evol. 13:1618566. doi: 10.3389/fevo.2025.1618566
Received: 26 April 2025; Accepted: 24 June 2025;
Published: 18 July 2025.
Edited by:
Helen Bennion, University College London, United KingdomReviewed by:
Patrick Rioual, Chinese Academy of Sciences (CAS), ChinaXuhui Dong, Guangzhou University, China
Copyright © 2025 Sui, Du, Xiao, Zang, Hui, Lv, Liu, Zhang and Fan. This is an open-access article distributed under the terms of the Creative Commons Attribution License (CC BY). The use, distribution or reproduction in other forums is permitted, provided the original author(s) and the copyright owner(s) are credited and that the original publication in this journal is cited, in accordance with accepted academic practice. No use, distribution or reproduction is permitted which does not comply with these terms.
*Correspondence: Henglin Xiao, eGlhby1oZW5nbGluQDE2My5jb20=; Yawen Fan, ZmFueWF3X2hyYm51QDE2My5jb20=
†These authors have contributed equally to this work