 Roberto Bruno1*
 Gerald Jaskhec2
- 1Mechanical, Energy and Management Engineering Department – University of Calabria, Cosenza, Italy
- 2Independent Researcher, Nuremberg, Germany
This research investigates the application of solid thermal storage, charged with a surplus of photovoltaic electricity, for residential building heating. The performance of the storage system was evaluated using TRNSYS modelling and simulation across various operating conditions, examining the impact of the installed photovoltaic peak power, storage volume and operating temperature. The solid storage medium was either pure sand or a sand-iron waste mixture. Results indicate the technology’s potential to improve renewable energy self-consumption and reduce dependence on fossil fuels, achieving a solar fraction for heating reaching 65% for a 49.5 kWp photovoltaic field and a 2 m3 storage unit at 600 °C. Economic analysis confirms the system’s viability in certain applications, in light of a discounted payback of 12 years, determined considering a lifespan of 25 years.
1 Introduction
The building stock represents one of the primary energy-consuming segments, alongside the transport and the industrial sectors, accounting for 38% of CO2 emissions and consuming approximately 40% of global energy consumption (Jones et al., 2025). Additionally, primary energy consumption is expected to increase by more than 50% by 2030 (Sundaram et al., 2024) due to the continuous demand for thermo-hygrometric comfort in confined environments. Approximately 75% of the European building stock is residential, of which 85%–90% will still be in use in 2050; in these buildings, space heating and domestic hot water production represent the main sources of energy consumption (Kockat and Milne, 2025). Currently, electricity and natural gas are the most widely used energy carriers in buildings, as shown in Figure 1, illustrating their use in 2024 (International Energy Agency, 2025).
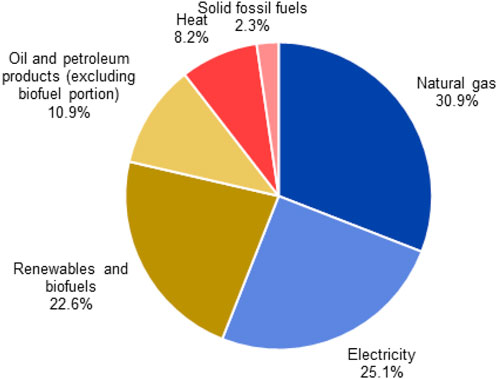
Figure 1. Final energy consumption for the building sector differentiated by energy carrier.
Consequently, the growing need to reduce the consumption of fossil fuels to limit the environmental impact of buildings has driven research in recent decades towards more sustainable solutions capable of rationally managing consumption and promoting the integration of renewable energy sources (Ahmed et al., 2022; Diwania et al., 2024; Saxena et al., 2024). In this context, despite the significant decrease in the cost of renewable energy technologies in recent times (International Renewable Energy Agency, 2021), the problem of their intermittency remains, often leading to a mismatch between energy production and demand, particularly in winter (Notton et al., 2018; Al-Hashmi et al., 2025). Consequently, Thermal Storage Systems (TES) play a significant role, as they enable heat produced even without a concurrent thermal load to be stored and utilized at a later time, thereby optimizing the use of renewable resources (Al-Hashmi, 2015a; 2015b; Enasel and Dumitrascu, 2025; Hossain Lipu et al., 2025). Among the various TES technologies available in the residential sector, water-based systems are technologically reliable and widespread (Furbo, 2015), while solid storage, which can reach high operating temperatures, is primarily used for industrial applications (Seyitini et al., 2023). In this regard, a Finnish enterprise proposes a large-scale high-temperature TES offering a 2 MW sand battery (suitable for small to medium-sized industrial plants, space heating, or district heating networks) with a capacity of 200 MWh and a cycle efficiency of approximately 85%, and a 10 MW sand battery for industrial processes with a capacity of 1,000 MWh and a cycle efficiency of 90% (Polar Night Energy, 2025). Furthermore, an Italian company proposes thermal energy storage systems in sand based on fluidised bed technology, with stored energy then released when needed (MGTES–Magaldi Green Thermal Energy Storage, 2025). Electrical energy is used to heat the silica sand, activating the fluidisation process, which reaches temperatures above 600 °C while minimizing heat loss. The operation of both systems is based on storing excess renewable energy in sand, in the form of heat, for long periods. The accumulated energy is then released as hot water, hot air, or steam for industrial processes, thereby reducing dependence on fossil fuels. Future developments are expected to enable the conversion of stored thermal energy back into electricity. However, solid TES also represents a promising option for the building sector. It is easily integrated with renewable energy technologies and enables a reduction in required storage volumes due to higher temperature, resulting in an efficient and low-cost option. Despite this, no documents concerning the application of high-temperature solid TES specifically for the residential sector were found, although some similar applications have been considered for specific cases. In (Rodríguez et al., 2025), the authors explored silica sand enhanced with graphite coatings to improve solar energy absorption and thermal energy storage in concentrated solar power plants, observing that graphite-coated sand exhibited superior optical and thermal performance, achieving a 44.9% increase in photothermal conversion efficiency compared to uncoated sand. In the investigation carried out in (Yuan et al., 2025b), a solar-air source heat pump system (SASHP) coupled with a sand-based thermal storage floor for rural heating in inner Mongolia was proposed. The system’s performance was evaluated throughout the heating season using TRNSYS models, showing that an average indoor temperature of 18.8 °C can be maintained, even when outdoor temperatures ranged from −18.4 °C to 12.3 °C, achieving an average COP of 2.6 and a solar fraction of 50.9%, respectively. In (Yuan et al., 2025a), a similar study investigated the heat storage and release characteristics of a sand-based thermal storage floor through experimental and theoretical methods. This work confirmed the strong thermal storage capabilities achievable, ensuring consistent heating and maintaining indoor temperatures above 16 °C for up to 14 h without additional heat input. In (Gupta et al., 2025), the authors proposed a sand-filled thermal energy storage to enhance the performance of a photovoltaic thermal solar dryer, showing that the system can decrease drying time and improve charging and discharging efficiency. The investigation carried out in (Tat and Muthukumar, 2024) experimentally and theoretically analyzed a cost-effective hybrid thermal storage system designed for operation at temperatures over 300 °C, using sand and sodium nitrate for sensible and latent heat storage. Experimental results showed a system capacity of 5.46 MJ of stored heat accumulated in 559 min and 5.42 MJ discharged in 376 min. Finally, in (Odoi-Yorke et al., 2024), a field review employing bibliometric analysis examined the trends, evolution, and future research directions of sand-based thermal energy storage systems. By analysing 339 documents, an increasing publication trend since 2003 was revealed, with research hotspots focused on numerical and experimental investigations. The authors concluded that key future research directions include optimizing systems with AI, machine learning and deep learning, developing cost-effective and property enhancement techniques, and assessing long-term stability. In light of this, an evident research gap concerning the use of solid TES for heating applications in the building sector becomes apparent, particularly regarding achievable energy performances through numerical approaches. Therefore, the main goal of this paper is to evaluate the solar fraction (the share of heating demand covered solely by the solar source) and other performance indices achievable in a reference building equipped with high-temperature terminals supplied by hot water, the latter produced using a solid TES. However, to evaluate the achievable energy performance, a thorough analysis of the physical properties of the storage material, the heat exchange mechanisms, the integration (e.g., backup systems), and their interaction with the technologies used for space heating is necessary, especially when renewable sources are integrated. An interesting solution involves converting surplus photovoltaic production, generally available in the summer period, into high-temperature thermal energy (600 °C) through electrical resistors to create an inter-seasonal TES. The use of solid materials primarily based on sand (silicon dioxide) offers clear advantages (Tetteh et al., 2024):
• Efficiency and cost-effectiveness, due to its appreciable thermophysical properties and wide availability, allowing for low-cost thermal energy storage.
• Reduction of operating costs, given its long lifespan and minimal maintenance requirements.
• Sustainability, as it is a locally available, inert, and reusable material (minimizing transport impact).
• Versatility, since sand, unlike traditional water-based TES, enables high temperatures to be reached, leading to a significant reduction in storage volumes.
Regarding this last aspect, considering average specific heat and density of sand of 0.7 kJ/kg·K and 2,200 kg/m3 respectively (Xu et al., 2017) (equivalent to approximately 0.43 kWh/m3K), with a temperature variation of 600 °C, it is possible to store a thermal energy of 258 kWh/m3 within the medium’s volume. This is more than double that of water storage (1.162 kWh/m3K × 90 K = 104.65 kWh/m3), assuming a maximum temperature variation of 90 °C (Furbo, 2015). Furthermore, sand does not experience thermal stratification, hence, the temperature can be considered nearly uniform throughout the storage volume (Ananth and Selvakumar, 2025). The monitoring of experimental set-ups for industrial applications has highlighted that thermo-physical properties of sand do not change with the time (Polar Night Energy, 2025; MGTES–Magaldi Green Thermal Energy Storage, 2025), moreover the sand is fully inert, therefore it does not origin chemical reactions and they do not suffer from typical issues promoted by hysteresis processes, as instead observed for other solution employed for thermal energy storage such as Phase Change Materials (Al-Hashmi and Chen, 2023). Chemical reactivity is of interest exclusively to iron scraps at high temperatures due to the oxygen of the air stream crossing the TES, resulting in oxidation and consequent degradation of physical properties. However, this issue can be addressed by treating metallic waste with proper coatings or utilizing iron scraps made of alloys with high chromium or nickel percentages, which are more resistant to corrosion. Since photovoltaic (PV) energy is among the most promising and widespread renewable technologies in the building sector (Bevilacqua et al., 2021; Diwania et al., 2022b; 2022a), to promote synchronization between the availability of solar radiation and the thermal load demand, it is interesting to consider the possibility of converting surplus from a PV generator into high-temperature thermal energy using electrical resistors, to charge a solid TES. From this device, heat can subsequently be extracted for space heating, even for systems equipped with high-temperature radiators. This system is an alternative to a common solution in which photovoltaic surpluses are used to drive air/water or water/water vapour compression heat pumps (SAHP, Solar Assisted Heat Pumps) (Perrella et al., 2023) to supply a hot water tank for low/medium temperature terminals. The issue related to the supply of low to medium temperatures can be overcome with heat pumps at high temperatures, but these are penalized by a low coefficient of performance. Moreover, the system still suffers from a mismatch between the requirements of heating loads (especially during nocturnal hours) and the availability of solar irradiance, which could be solved only by the employment of high and expensive water tanks. Additionally, heat pumps are negatively influenced by a lower lifespan and the necessity to operate periodic maintenance (Perrella et al., 2024). Compared to a SAHP system, where the coefficient of performance allows obtaining 3-4 times the absorbed electrical energy as thermal energy, this is only achievable with suitable emitters (fan-coils, radiant systems) and necessitates larger solar collection surfaces. However, the decreasing costs of photovoltaic technology could make the proposed solution economically viable than SAHP if properly sized. The objective of this work is to analyse the operation of both a pure sand TES and a mixed sand/iron scrap TES by modelling the integrated system (comprising the photovoltaic generator, solid storage, integration system, and a reference building) to heat buildings equipped with high-temperature emitters in the TRNSYS environment. This aims to evaluate the achievable energy performance in different operating scenarios, characterized by varying key design parameters. Specifically, the obtainable solar fraction will be evaluated concerning the installed photovoltaic peak power, the solid TES volume, and its operating temperature. An economic analysis will also be conducted to assess the viability of the investment. This study on solid TES for the residential sector aims to fill the identified research gap by providing preliminary system sizing and providing preliminary techo-economic assessments, as the proposed solution is an alternative heating system capable of drastically reducing the dependence of new or existing buildings on fossil fuels.
2 Methodology
The work is aimed at analyzing the operation of a solid thermal energy storage (TES) system through modelling and simulations in the TRNSYS environment. This software is widely employed in the scientific community due to its flexibility and ability to model complex energy systems, including buildings, plants, and other installations employing real climatic data. The simulations of these systems provide realistic results as TRNSYS considers the interaction between the various components, which, in turn, are described by extensively validated mathematical models (McLeskey et al., 2012; Sweet and McLeskey, 2012), this aspect significant considering that experimental results referring to such a heating system to carry out a model validation and a model tuning are not available in the relevant literature. The model developed in TRNSYS includes several components that represent the main parts of the energy system under examination, such as the meteorological data generator (Type 54), the PV generator (Type 94), the AC busbar for electrical connection management (Type 188), the solid TES (Type 10), hydraulic pumps and variable speed fans (Type 3), an air-water heat exchanger (Type 5), a backup system (Type 6), and a reference building (Type 56). The system modelling was carried out by appropriately connecting these components, each characterized by constant parameters and dynamic inputs and outputs, resulting in the scheme depicted in Figure 2, in which the common variables are solved iteratively by a proper solver in various operational scenarios.
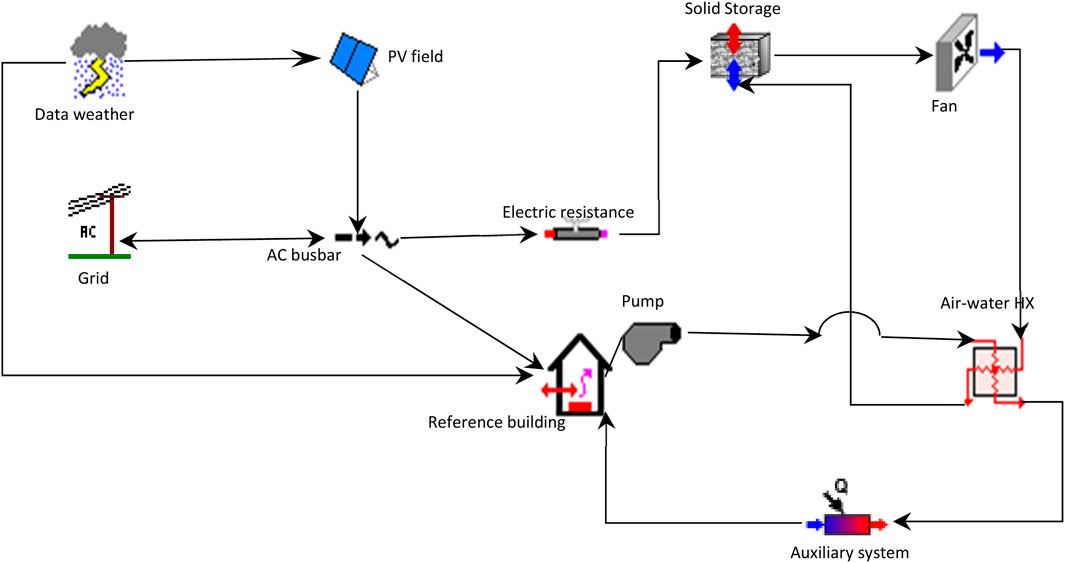
Figure 2. Connections between the several components of the system.
The weather generator provides climatic data, such as solar irradiance and outdoor air temperature, which are required to calculate the PV production and the heating demand of a reference building. The PV production is calculated taking into account the actual PV efficiency, in turn calculated as a function of the cell temperature, to consider the thermal drift effect on the achieved performance (Bevilacqua et al., 2020). This production is managed by an internal mini-grid that prioritizes the use of the renewable share as follows:
- First, it covers the building’s electric load;
- If PV surplus is available, this share is employed in electric resistances to charge the solid TES by the Joule effect, assuming that electric power is totally transformed into thermal power;
- If PV surplus is available but the TES is fully charged, the production is delivered to the grid.
If PV electricity is not available, energy is drawn from the grid to solely satisfy the building’s electric load. This control strategy can be easily implemented by a mini-grid available on the market (Menniti et al., 2024); on the other hand, this aspect can be further improved considering that rational management has to take into account eventual financial supports as well as the variability of electric tariffs on a daily basis. When the thermal level of the solid TES is sufficient, a fan is activated to use the hot airflow in a heat exchanger to transfer thermal energy to a water flow until a desired set-point has been reached. This heated water is then used to heat the reference building, which is simulated as a 2-D single thermal zone, assuming radiators supplied at 80 °C as emitters. The hydronic pump is activated following a thermal profile of the reference building determined in preliminary simulations. The fan operates with a variable flow rate (as a function of the building heating load) to avoid achieving high water temperatures in the heat exchanger, thereby allowing for rational exploitation of the solid TES’s thermal level. Conversely, when the TES thermal level is insufficient to produce a constant water flow rate at 80 °C, the auxiliary system intervenes in series to ensure the desired radiator supply temperature.
2.1 The reference building
The system’s performance refers to the building depicted in Figure 3, which measures 20 m in length and 10 m in width, with a height of 3.5 m. From this, a gabled roof develops, with its two pitches inclined at 19.3°. The two pitches each form a surface area of 106 m2, meaning the maximum allocable surface area for the photovoltaic (PV) array is 212 m2. It should be noted that the adopted orientation places the main entrance facing west, and the envelope is not subject to shading from fixed obstacles. The simplification to simulate the reference building as a 2D thermal single zone is derived for reducing computational effort without penalizing the result reliability, as reported in (Karitnig, 2008; Persson et al., 2011; Jeon et al., 2016) with analyses carried out for energy performance evaluations. TRNSYS uses the transfer function approach to consider the structure’s capacitive effects properly, in order to take into account also the seasonal fluctuations in the entire year simulation period. Typical patterns from national standards for energy building labelling that consider internal gains and ventilation loads, strongly affected by human actions, have been set to consider human behavior in order to make the reference building close to a real-case application.

Figure 3. Sketches of the reference building used for the TRNSYS simulations.
The average thermal transmittance of the opaque envelope is 0.296 W/m2K, whereas windowed surfaces are characterized by a mean thermal transmittance of 2.83 W/m2K. The glazing is characterized by a normal solar factor of 75% and represents 25% of the total dispersing surface. These parameters were chosen because compliant with the usual construction techniques employed for new buildings in the considered location. Figure 4a reports the trends of the required heating load obtained by setting an indoor air temperature of 20 °C, using the weather data introduced in the next section. A peak heating power of 5.25 kW, an average required heating power (dashed line) of 2.48 kW, and a seasonal heating demand of 10,336 kWh have been determined. Figure 4b shows the annual electric profile determined using the online tool 'Load Profile Generator’. This was based on four occupants, LED lighting, and typical appliances for a residential building (Pflugradt et al., 2022). It has a peak of 5.62 kW, a mean electric load of 0.7 kW, and an annual requirement of 6 144 kWh. It can be noticed that for 15 days at the beginning of summer, there is only the base load (85 W) due to the building being unoccupied for a holiday period. It has to be noticed that if larger or retrofitted buildings are considered, the magnitude of the thermal loads varies mainly with the envelope size, considering that current regulations impose the achievement of precise standards to limit both transmission and ventilation losses, also in the case of the refurbishment of existing structures.
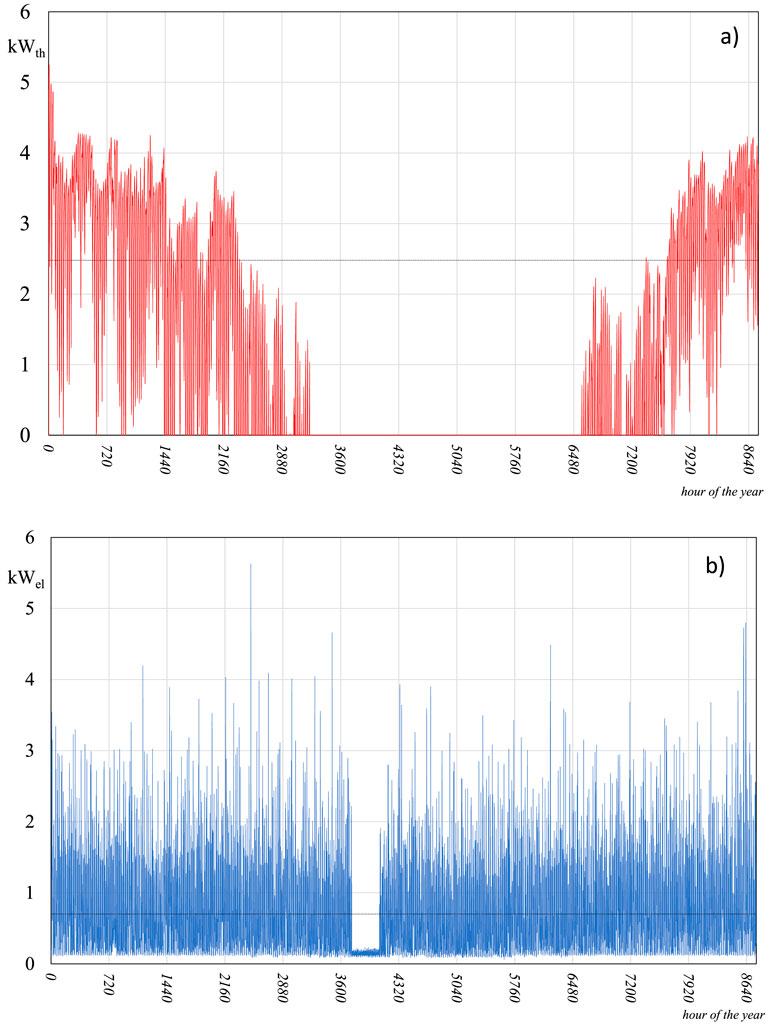
Figure 4. Annual profiles determined for the heating load (a) and for the electric load (b) of the reference building.
2.2 Data weather
The building was simulated in Cosenza (Southern Italy), a locality classified as Cfa according to the Köppen standard (Peel et al., 2007). The site is characterized by a typical Mediterranean climate with warm winters and hot, dry summers. For calculating the envelope’s infrared exchanges with the outdoor environment, the Aubinet correlation (TRANSSOLAR & Energietechnik GmbH, 2016) was used to determine the sky temperature, while the ground surface was assumed to be at the external air temperature. The ground floor transfers thermal power to the underlying soil, which was considered to be at a constant temperature of 15 °C throughout the year, also for the calculation of the solid TES thermal losses, considering it fully buried. PV generators with crystalline technology can produce approximately 1,400–1,500 kWh/kWp per year under ideal conditions (30° tilted toward the South). Figure 5 shows the trend of the annual outdoor air temperature and the solar radiation incident on the two roof slopes.
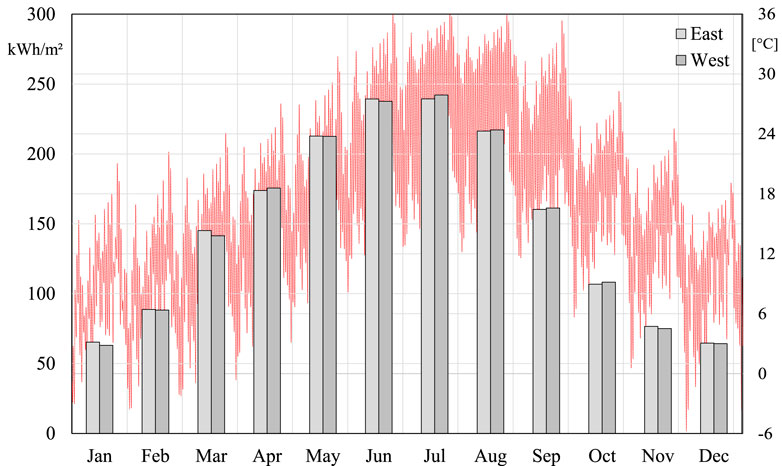
Figure 5. Bars of the solar radiation available on the roof slopes and yearly trend of external air temperature (red line).
2.3 Considered PV panels
Table 1 lists the main electrical parameters for the PV modules, which are used to calculate electrical efficiency based on cell temperature. For this reason, the model implements the panel’s thermal balance, aimed at evaluating the cell temperature based on the boundary conditions (incident solar radiation, sky temperature, and outdoor air temperature). These conditions, in turn, are necessary to determine the actual electric efficiency and the real electric production (Bevilacqua et al., 2020). This panel is available on the market with an optimal quality-to-price ratio: it features monocrystalline technology with a rated efficiency of 22.5%, a decrease in efficiency of 13% of the nominal value after 25 years, and a cost of 600 €/kWp for installations over 40 kWp in the European market.
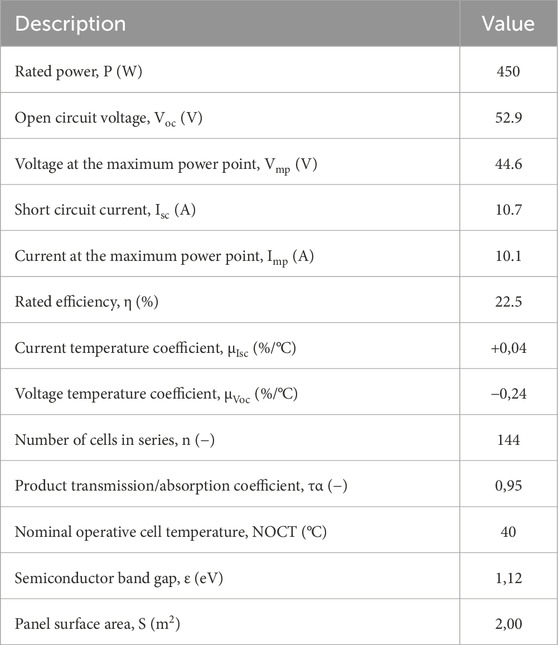
Table 1. Main electrical features of the monocrystalline panel for the TRNSYS simulations.
2.4 Solid storage
The solid TES is assumed to be located in the ground and was simulated according to the scheme depicted in Figure 6. Two distinct 200 mm insulation layers of foam glass boards were designed to recover part of the thermal losses to the ground. These boards are characterized by excellent thermal insulation (thermal conductivity of 0.036 W/m·K) and mechanical resistance (>900 kPa to compression strength). The air stream is first pre-heated by exploiting the thermal power lost toward the ground and subsequently brought to the desired temperature by extracting heat from the core of the solid TES. The foam glass boards are water-resistant and not susceptible to parasites, ensuring the TES’s long lifespan. Two different storage materials have been considered: pure silica sand and a sand-iron waste mixture, with properties listed in Table 2, simulated assuming different volume fractions of the metal waste.
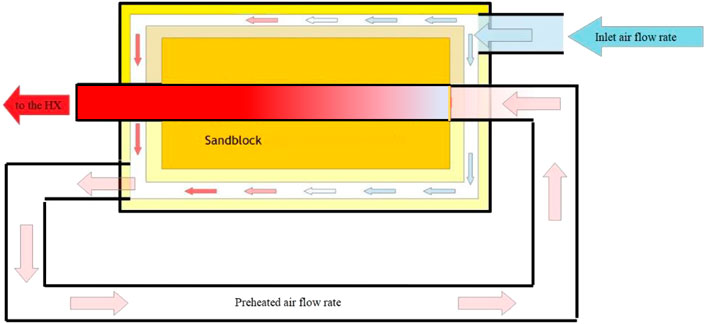
Figure 6. Operating mode of the simulated solid TES with air stream pre-heating.
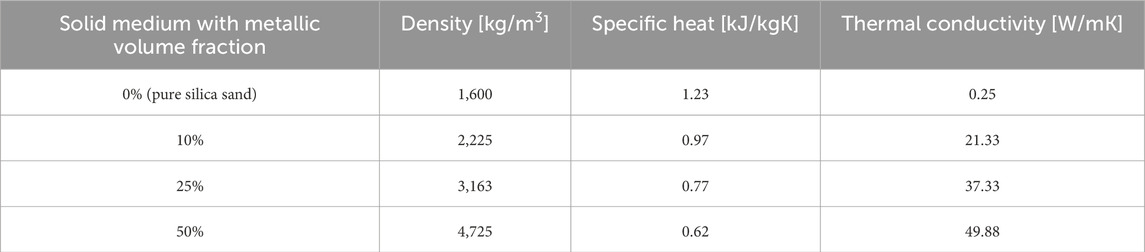
Table 2. Thermo-physical properties of the simulated solid medium.
2.5 Monitored performance parameters
At an annual level, the renewable electricity share (R) in the building-plant system, as per Equation 1, evaluates the percentage of energy conveyed within the system that originates from renewable energy sources. Power drawn from the grid is considered to be 80% produced by non-renewable sources (GME, 2024). This parameter takes into account both electric and heating requirements; therefore, high values identify a system configuration that allows for increasing the sustainability of the whole building-plant system:
The solar fraction SF for heating, Equation 2, determines the share of solar energy utilized to cover the heating demand. This considers that energy from the TES is completely provided by the PV generator, whereas the share of auxiliary energy (natural gas) is considered fully non-renewable. This parameter has a similar meaning to R, but it refers exclusively to the coverage by the solar source of the sole heating demand.
The self-consumption share (SC), Equation 3, refers to the amount of energy produced by the PV field that’s instantaneously consumed within the system, both for electric and heating needs, evaluated on a yearly scale as:
SC allows for determining the rational use of the PV field: low values, in fact, indicate a high share of renewable energy not used in the building-plant system but delivered to the grid, indicating an improper size of the generator.
3 Results
A parametric study was conducted to determine the performance indices by varying the collection surface (or the installed PV peak power), the solid TES volume, and the design TES temperature. The considered PV peak powers take into account different configurations of the generator, as indicated in Table 3, for a maximum installed power of 22.95 kW per pitched roof (a total maximum peak power of 45.9 kWp). This corresponds to 102 m2 to be compliant with the available surface. The volume of the solid TES was varied from 0.5 m3 to 2.5 m3, as preliminary design evaluations have demonstrated that these values can meet the building’s heating needs for a sufficient period. Moreover, these volumes allow for sizing TES with a compact size, reducing the dispersing surface, and allowing for limiting thermal losses toward the ground, considering also the non-operation during the periods in which heating is not required. Furthermore, this aspect can be further optimized by choosing an appropriate TES aspect ratio. First results highlighted that the TES scheme depicted in Figure 6, at an annual level, limits energy losses to 4% of the global thermal energy delivered to the reference building, even when TES reached the higher temperatures. Indeed, two maximum set-point levels have been chosen for the solid TES: 160 °C to ensure the attainment of supply temperatures pertinent to radiator operation, and 600 °C to maximize the storage features of the solid TES.
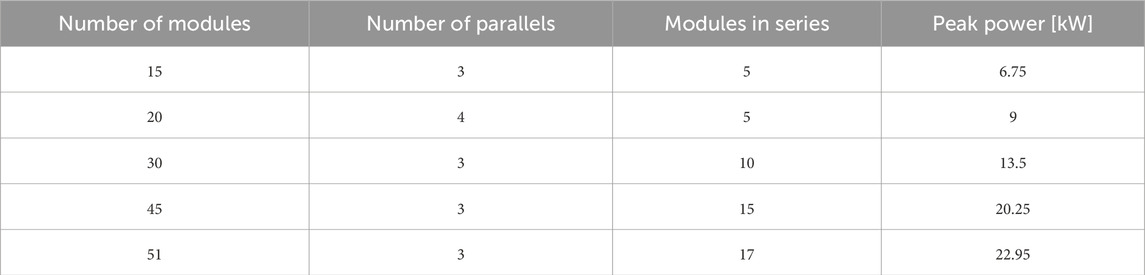
Table 3. The different configurations of PV generator considered on every pitched roof.
3.1 Energy performances
In Figure 7a, the renewable share index is shown as a function of installed peak power and solid TES volume, with the maximum TES temperature set at 160 °C. Conversely, in Figure 7b, these trends are displayed for a maximum TES temperature of 600 °C, with both scenarios assuming pure silica sand as the solid medium. It can be observed that the renewable share increases with installed peak power but decreases with an increase in TES volume. This is because a greater proportion of electricity absorbed from the grid, which in turn reduces the renewable share. Furthermore, R is higher when the TES temperature is limited to 160 °C, due to the lower electrical energy required. Significant deviations are only noticeable for TES volumes lower than 1 m3. The considered parameters only slightly affect the renewable share, given that their values range from a minimum of 85% (with 13.5 kWp and 2.5 m3 at 600 °C) to a maximum of 95.8% (with 45.9 kWp and 0.5 m3 of solid medium at 160 °C), conversely, PV size is more influential. Anyway, from a sustainability point of view of the building-plant system, the appreciable results of R demonstrate the system goodness, considering that in the better configuration, only an energy share lower than 5% is derived from fossil sources to satisfy both heating and electric demands. In the worst scenario, this share increases to 15% with large TES at 600 °C and small peak powers.
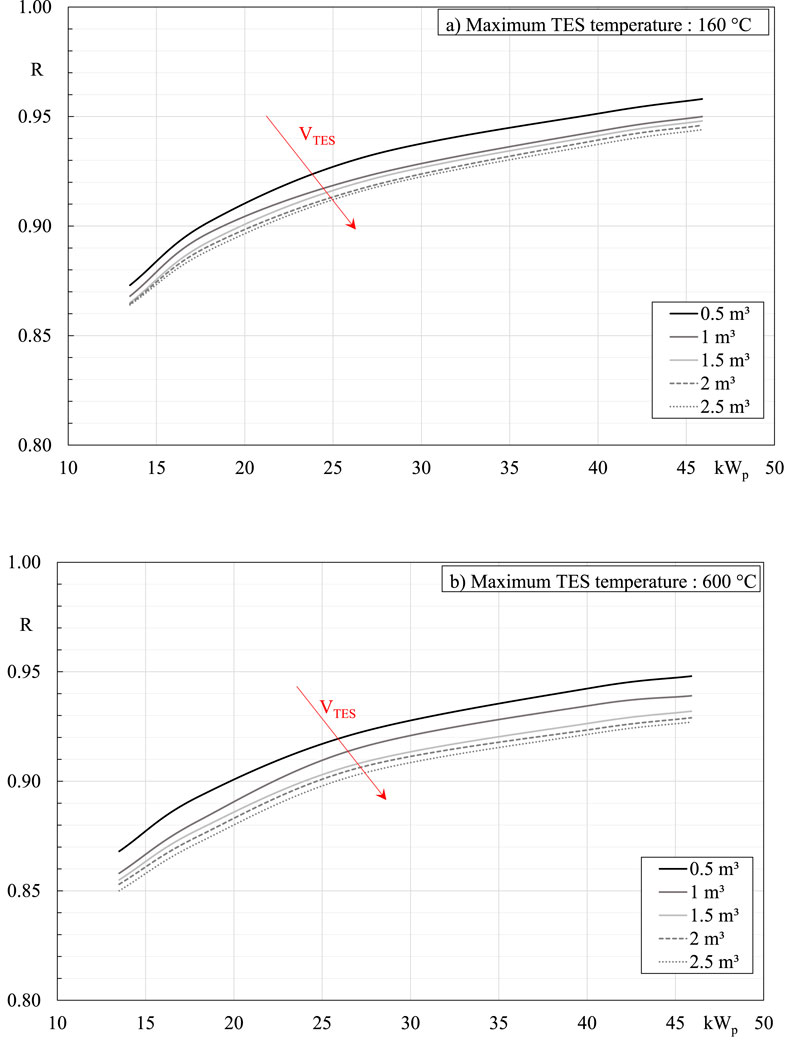
Figure 7. Renewable share index as a function of installed PV peak power and TES volume, assuming pure silica sand as solid matter for: (a) TES at 160 °C, (b) TES at 600 °C.
Regarding the Solar Fraction (SF) index (Figure 8), obtained with a storage made of pure silica sand, it can be observed that a higher temperature allows for covering a greater percentage of the heating demand for every system configuration. Furthermore, SF is more influenced by the PV installed peak power, as evidenced by a noticeably greater curve growth. In contrast, the TES volume only slightly affects the final results, showing a marginal improvement of SF with its augmentation, but only with the medium at 600 °C. Conversely, in TES maintained at 160 °C, noticeable deviations are detectable, especially with reduced volumes. Appreciable results, with SF greater than 60%, were achieved when the maximum PV peak power is installed with 1 m3 of solid TES maintained at 600 °C. The SF trends highlight that the TES volume has a scarce influence on the fraction of heating needs satisfied by the solar source, but only when maintained at high temperatures; therefore, in this case, the implementation of limited storage volume is recommended, allowing also for reducing the thermal losses in the not-operational phase, and simultaneously reducing installation costs. Furthermore, this choice does not penalize R in an evident manner, as depicted in Figure 7.
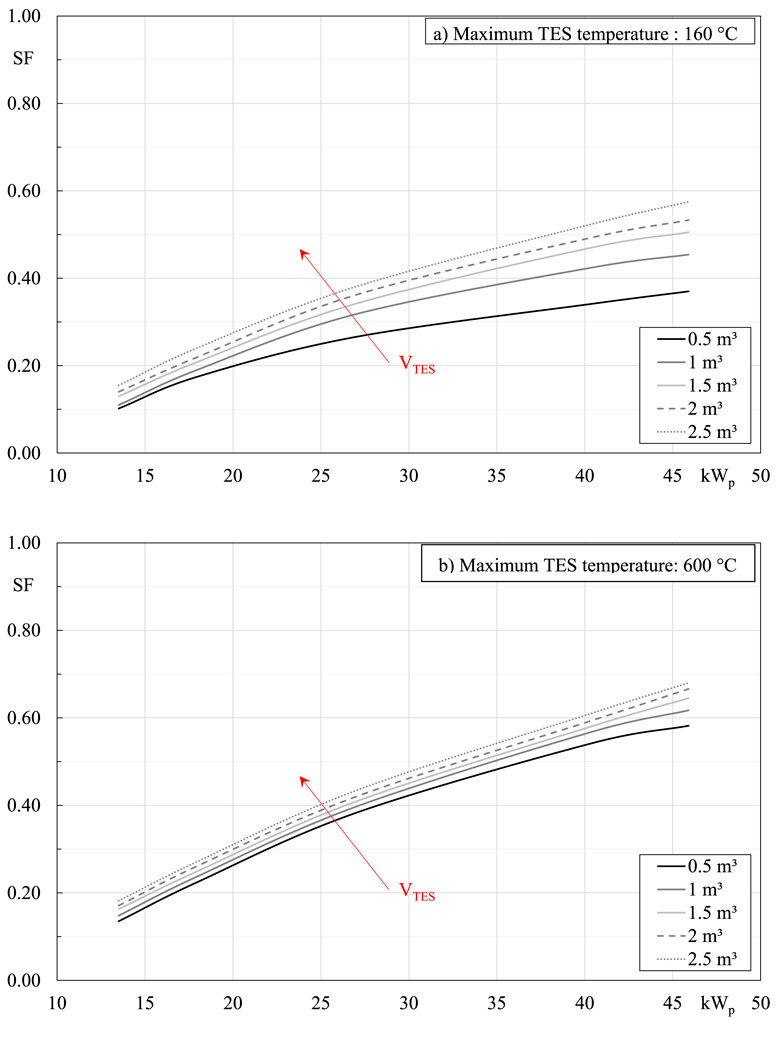
Figure 8. Solar Fraction for heating as a function of installed PV peak power and TES volume, assuming pure silica sand as solid matter for: (a) TES at 160 °C, (b) TES at 600 °C.
Regarding the self-consumed share, and assuming a solid TES with pure silica sand, the results depicted in Figure 9 highlight that reducing the PV installed peak powers allows for increasing SC. This is due to a limited transfer of renewable electricity to the grid. Again, the effect of the TES volume is more pronounced at the lower storage temperature. It can be noticed that at 600 °C, the self-consumed share remains over 50% when the peak power is less than 18 kWp. It is worth noting that, while large photovoltaic collection surfaces allow for appreciable percentages of renewable energy employed in the building, in light of the favourable values achievable both for R and SF, simultaneously an appreciable share is sacrificed and transferred to the grid. Therefore, further solutions are needed to overcome this drawback, as well as an economic analysis is mandatory to find the best compromise between technical performances and financial aspects.
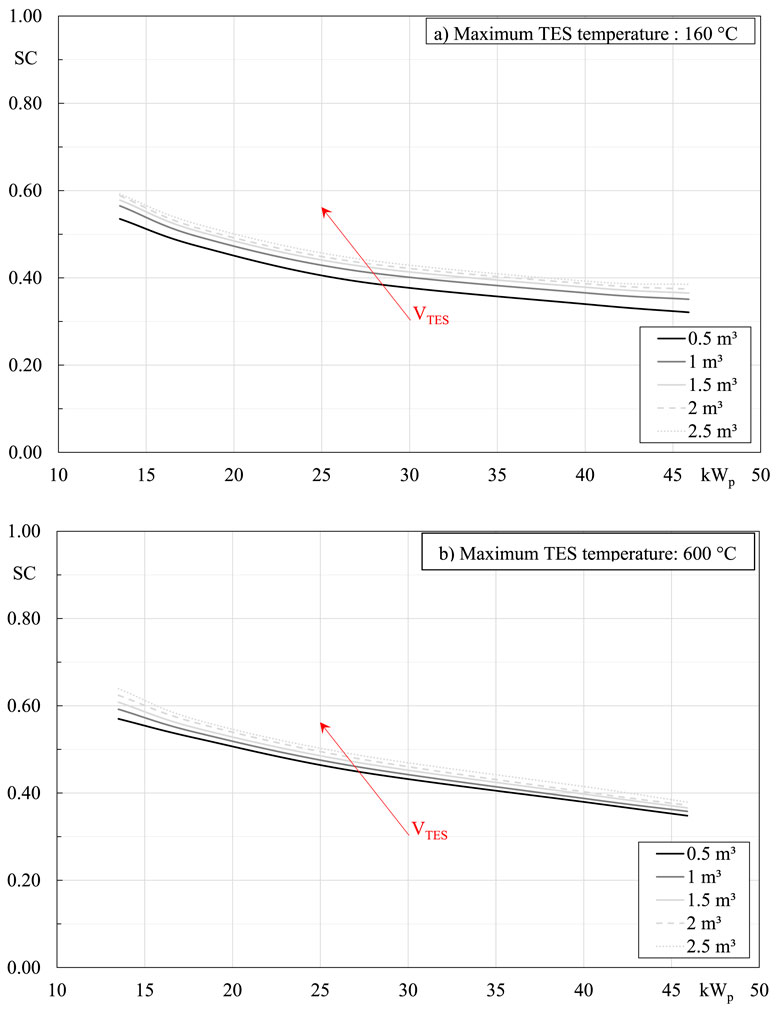
Figure 9. Self-consumed renewable electricity as a function of installed PV peak power and TES volume, assuming pure silica sand as solid matter for: (a) TES at 160 °C, (b) TES at 600 °C.
An idea to pursue for improving performance indices, without penalizing the economic frame, is the addition of iron scraps as a solid medium inside the TES. Figure 10 shows the trend of the performance indexes as a function of the volumetric percentage of iron scrap mixed with the sand inside the TES. This is presented assuming an optimal configuration: a system with the maximum installable peak power and a storage volume of 1 m3 that can be heated up to 600 °C. Indeed, this setup offers an SF over 60%, a renewable share of 94%, of which almost 40% is self-consumed. It is worth noting that the better thermo-physical features of the solid TES allow for achieving a proportional growth of SF, a greater increase in terms of SC and a slight decrease of R. Solar Fraction increases because there is an augment of the thermal energy extracted from the solid TES and a simultaneous reduction of the thermal energy provided by the backup system. R decreases due to a slight increase in the energy absorbed from the grid, whereas the SC growth is due to a consistent limitation of the PV power delivered to the grid: through the enhanced properties of the storage medium, in fact, a greater portion of photovoltaic electricity can be channelled into the thermal energy storage system. Anyway, the benefits of iron scrap mixed with sand are more detectable when analyzed in the transient regime. As listed in Table 4, assuming a volumetric percentage of 50% of metallic waste mixed inside the TES, the charging/discharging velocities of thermal energy increase noticeably. Moreover, the improved thermal conductivity allows for an increased charge temperature. It's interesting to note that the discharge time of the solid TES remains constant, whereas the charging time to reach the temperature of 600 °C is almost halved, making the system faster to follow the heating loads.
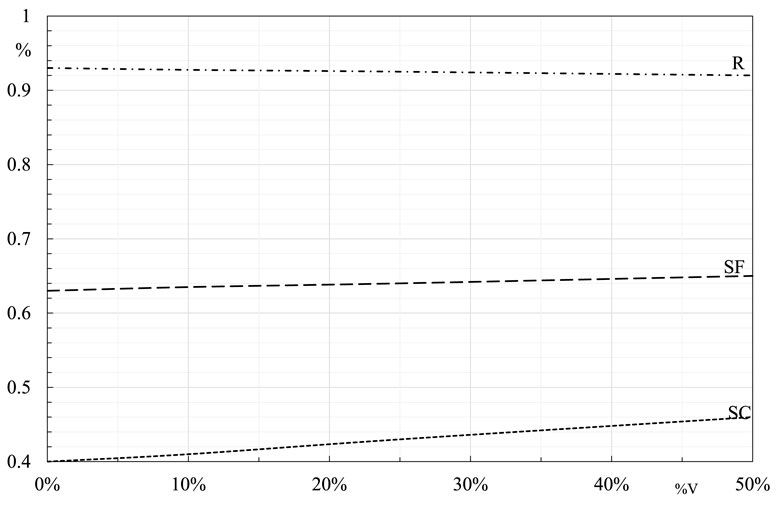
Figure 10. Trend of the energy performance indexes as a function of the volumetric percentage of iron scraps forming the solid thermal energy storage.
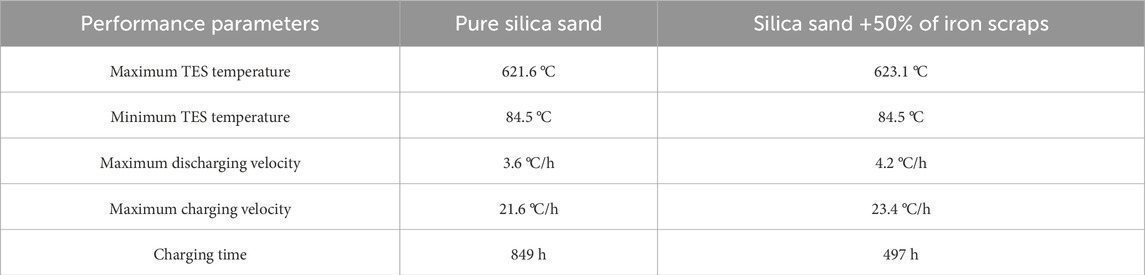
Table 4. Dynamic performance of two different configurations of solid TES.
3.2 Economic evaluations
The economic analysis of the solid TES aims to evaluate the investment’s profitability in terms of operational costs and economic return compared to traditional heating systems. This evaluation considers the costs of the main components, the cost of electricity and gas, and the economic value of energy delivered to the grid (see Table 5). The cost of the system is attributable to the configuration involving a TES volume of 1 m3 maintained at 600 °C that, at an annual level, disperses 241.5 kWh, charged by 45.9 kWp of PV panels. The investment cost consists of the purchase price of all components and the installation of the thermal energy storage system, including excavation and labour costs, amounting to €39,224.65. The payback time, considering a gradual energy cost increase, is evaluated. Revenues are assumed to be the saved self-consumed electric energy and the sale of electricity to the grid. The estimated system lifespan is 25 years (n), pertinent to the warranty provided by the photovoltaic module manufacturer, with a discount rate (r) estimated at 4%. The electricity cost is set to 0.25 €/kWh for the share absorbed from the grid and 0.12 €/kWh for the share delivered to the grid; the gas cost (supplying the auxiliary system) is 0.10 €/kWh. The cumulative sum of cash flows, determined for every year i as the difference between the system revenues and the incurred costs, was performed using the discounting function, following Equation 4:
and allowing for the identification of the payback time as the year in which the summation is null. The Return on Investment (ROI) is calculated using Equation 5, indicating the average annual profit relative to the initial investment:
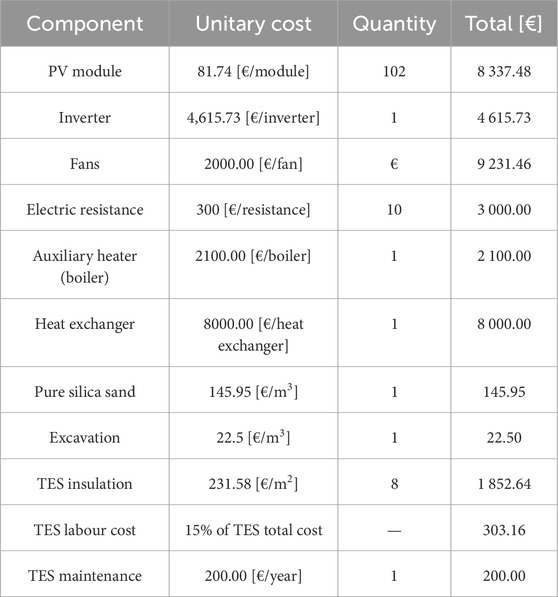
Table 5. Costs and revenues considered for the economic analysis considering a solid TES made of pure silica sand.
The Net Present Value (NPV), which is the sum of discounted cash flows, calculated over the system’s lifespan and diminished from the initial investment, confirms the investment’s profitability because it assumes the positive value of € 23,543.31 after 25 years, as indicated in Figure 11. The discounted payback is 12 years and 6 months (9 years and 8 months the simple payback) whereas ROI is 6.4%. These results are cautionary, considering that the addition of iron scraps allows for achieving better energy performance with an investment cost increase that can be retained negligible. To confirm this, the economic analysis carried out with 50% of metallic waste mixed in the solid TES has produced an NPV of over € 49,000, with a discounted payback of 10 years and 4 months, and an ROI of 10%.
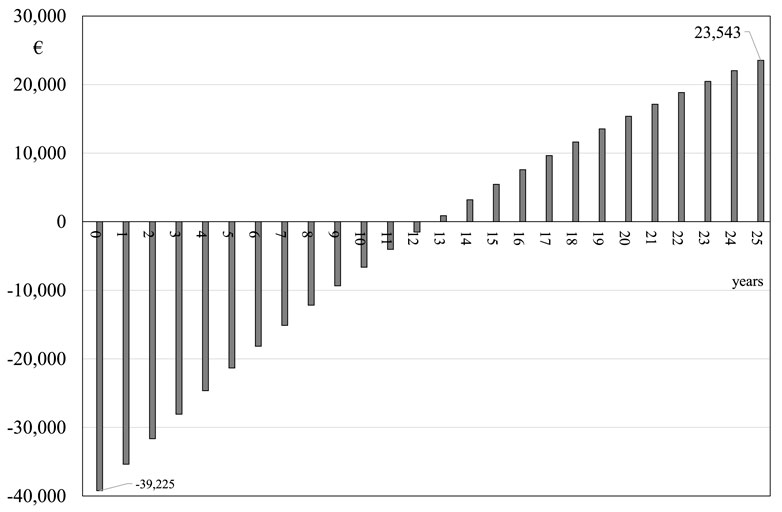
Figure 11. Net Present Value (NPV) for residential heating provided through a PV generator and a solid TES with pure silica sand, assuming 45.9 kWp installed and storage volume of 1 m3 at a maximum temperature of 600 °C.
4 Discussion
Simulation results are encouraging, both energetically and economically. Regarding the performance indexes, it's evident that bringing the solid TES to a high temperature is crucial. This approach allows for limiting the storage volume because SF and SC show only slight variation with changes in this parameter, allowing for limiting the dispersing surface toward the ground. Conversely, R is more significantly affected by the storage volume. The results obtained for solid TES at high temperatures are consistently better than those observed for the alternative scenario. Increasing the PV peak power leads to a better solar fraction and a higher share of employed renewable energy. However, this parameter is constrained by the limited suitable surface available for allocating the PV generator. The situation differs for the storage volume: its increase improves the solar fraction and self-consumed PV electricity, whereas the renewable share is negatively affected. This is because an increased storage medium volume leads to greater absorption of electricity from the grid to satisfy the building electric demand. Nonetheless, the detected values for the renewable share are already appreciable when storage volumes remain limited. Otherwise, the absorption of a higher share of electrical energy from the grid negatively influences the results. A solid TES volume of 20 m3 allows for achieving a solar fraction that asymptotically tends to unity. However, such a system would require substantial energy drawn from the grid (produced by fossil sources), worsening the system’s environmental performance. This study highlights the importance of enhancing the thermal properties of materials used for sensible thermal energy storage (TES). The addition of iron waste as an additional medium in the storage bed leads to a slight improvement in the performance indexes (except for the renewable share). More importantly, the transient features are positively affected, as evidenced by a conspicuously reduced charging time. This outcome is achieved without impacting the economic analysis, given that these materials are typically classified as metallurgical waste materials with negligible cost, while conversely, they require proper disposal, making an LCA frame more favourable. This investigation confirms that the significant reduction in PV generator costs observed in recent years suggests considering this technology not only for covering building electrical loads but also for residential heating. This can be achieved by exploiting the possibility of reducing the thermal storage volume (always required to counter the mismatch between solar irradiance availability and heating demand) by using a high-temperature solid medium with electric resistors. However, in the best configuration, 40% of the produced electricity is still transferred to the grid; therefore, further optimization can be conceived. Such a system primarily operates in an inter-seasonal mode, charging the solid TES in the hottest months when large PV surpluses are available. Results highlighted that, at an annual level, thermal losses are negligible considering that these do not exceed 4% of the thermal energy employed for the building heating. However, this share could be further limited by designing a solid TES with a proper geometry that minimizes the dispersing surface, such as two concentric spheres used as containers to form an air-gap for the air flow pre-heating.
5 Conclusion
This study allowed for a deeper understanding of sand-based solid thermal storage potential as a solution to improve building energy efficiency through the rational exploitation of PV surpluses for residential heating. Through system modelling and simulation, the thermal behaviour of solid TESs and their capacity to store and release heat to meet winter thermal loads, considering various operational parameters, was investigated. The results show that such a thermal storage solution is a promising technology, capable of at least partially covering a building’s heating demand, leading to a reduction in primary energy from fossil sources and associated pollutant emissions. Specifically, for a reference building simulated in the TRNSYS environment, after fully covering internal electric loads, employing 1 m3 of solid TES made of pure silica sand, charged up to 600 °C via resistors supplied by electric surpluses from a 45.9 kWp PV generator, can cover up to 64% of the heating load by dispersing only 241.5 kWh of thermal energy in the ground, at an annual level. The same configuration, modified by incorporating a 50% volumetric fraction of iron scraps inside the TES, increases the solar fraction to over 65%, boosts the self-consumed PV electricity by 6 percentage points, and visibly reduces the charging time. The goal of exclusively satisfying the heating demand using thermal energy extracted from the solid TES would require a volume of 20 m3 at 600 °C, making this solution technically and economically unfeasible. In the optimal configuration, however, the estimated investment cost is slightly lower than €40,000, with a discounted payback of approximately 12 years and an NPV of over €23,000 at the 25th year. This makes the solution profitable and ensures the simultaneous full coverage of electric and thermal loads. However, some challenges remain regarding consumer acceptance and the availability of suitable space for PV installation, as well as the necessity to solve mismatching issues of the renewable source on short-term projections. Therefore, further studies will focus on new configurations for solid storage shapes and optimized thermal exchange based on a broader scale. Other aspects that need to be addressed concern the system LCA, sensitivity and uncertainty analyses for system optimization, as well as the achievable thermal comfort conditions in the heated building. Adopting this technology could significantly contribute to the transition towards a more sustainable and efficient energy system in the residential sector.
Data availability statement
The original contributions presented in the study are included in the article/supplementary material, further inquiries can be directed to the corresponding author.
Author contributions
RB: Conceptualization, Methodology, Writing – original draft. GJ: Conceptualization, Data curation, Supervision, Writing – review and editing.
Funding
The authors declare that no financial support was received for the research and/or publication of this article.
Conflict of interest
The authors declare that the research was conducted in the absence of any commercial or financial relationships that could be construed as a potential conflict of interest.
The author(s) declared that they were an editorial board member of Frontiers, at the time of submission. This had no impact on the peer review process and the final decision.
Generative AI statement
The authors declare that no Generative AI was used in the creation of this manuscript.
Any alternative text (alt text) provided alongside figures in this article has been generated by Frontiers with the support of artificial intelligence and reasonable efforts have been made to ensure accuracy, including review by the authors wherever possible. If you identify any issues, please contact us.
Publisher’s note
All claims expressed in this article are solely those of the authors and do not necessarily represent those of their affiliated organizations, or those of the publisher, the editors and the reviewers. Any product that may be evaluated in this article, or claim that may be made by its manufacturer, is not guaranteed or endorsed by the publisher.
References
Ahmed, A., Ge, T., Peng, J., Yan, W. C., Tee, B. T., and You, S. (2022). Assessment of the renewable energy generation towards net-zero energy buildings: a review. Energy Build. 256, 111755. doi:10.1016/j.enbuild.2021.111755
Al-Hashmi, S. (2015a). Design, fabrication and testing of hybrid parabolic dish concentrator, Stirling engine & PCM-Storage in Oman. PhD thesis, University of Leeds.
Al-Hashmi, S. (2015b). “Solar thermal energy storage: materials, heat transfer analysis and applications,” in The future of solar power, 302.
Al-Hashmi, S., and Chen, M. (2023). Thermal analysis of phase change materials storage in solar concenter. J. Energy Syst. 7, 302–314. doi:10.30521/jes.1082104
Al-Hashmi, S., Chen, M., and Al-Saidi, S. (2025). Advancing sustainable energy solutions for hot regions: an in-depth exploration of solar thermal energy storage (STES) technologies and applications. Eng. Res. Express 7, 012101. doi:10.1088/2631-8695/adb8a0
Ananth, S., and Selvakumar, P. (2025). Experimental investigation of sand-based sensible heat energy storage system. Appl. Therm. Eng. 264, 125390. doi:10.1016/j.applthermaleng.2024.125390
Bevilacqua, P., Morabito, A., Bruno, R., Ferraro, V., and Arcuri, N. (2020). Seasonal performances of photovoltaic cooling systems in different weather conditions. J. Clean. Prod. 272, 122459. doi:10.1016/j.jclepro.2020.122459
Bevilacqua, P., Perrella, S., Bruno, R., and Arcuri, N. (2021). An accurate thermal model for the PV electric generation prediction: long-term validation in different climatic conditions. Renew. Energy 163, 1092–1112. doi:10.1016/j.renene.2020.07.115
Diwania, S., Kumar, M., Kumar, R., Kumar, A., Gupta, V., and Khetrapal, P. (2022a). Machine learning-based thermo-electrical performance improvement of nanofluid-cooled photovoltaic–thermal system. Energy Environ. 35, 1793–1817. doi:10.1177/0958305X221146947
Diwania, S., Kumar, R., Kumar, M., Gupta, V., and Alsenani, T. R.4 (2022b). Performance enrichment of hybrid photovoltaic thermal collector with different nano-fluids. Energy Environ. 34, 1747–1769. doi:10.1177/0958305X221093459
Diwania, S., Kumar, M., Gupta, V., Agrawal, S., Khetrapal, P., and Gupta, N. (2024). Insight into the investigation of thermo-electrical performance of hybrid photovoltaic-thermal air-collector. J. Inst. Eng. India Ser. B 105, 1275–1283. doi:10.1007/s40031-024-01040-z
Enasel, E., and Dumitrascu, G. (2025). Storage solutions for renewable energy: a review. Energy Nexus 17, 100391. doi:10.1016/j.nexus.2025.100391
Furbo, S. (2015). 2 - Using water for heat storage in thermal energy storage (TES) systems. Advances in Thermal Energy Storage Systems, 31–47. doi:10.1533/9781782420965.1.31
GME (2024). Italian electric market manager (GME). Available online at: www.mercatoelettrico.org.
Gupta, A., Das, B., and Mondol, J. D. (2025). Utilizing a novel method of sand-filled thermal energy storage system for performance enhancement in PVT solar dryer. Sol. Energy Mater. Sol. Cells 283, 113450. doi:10.1016/j.solmat.2025.113450
Hossain Lipu, M. S., Rahman, M. S. A., Islam, Z. U., Rahman, T., Rahman, M. S., Meraj, S. T., et al. (2025). Review of energy storage integration in off-grid and grid-connected hybrid renewable energy systems: structures, optimizations, challenges and opportunities. J. Energy Storage 122, 116629. doi:10.1016/j.est.2025.116629
International Energy Agency (2025). Net zero by 2050 - a roadmap for the global energy sector. Available online at: www.iea.org/t&c/.
International Renewable Energy Agency (2021). World energy transitions outlook. Available online at: https://www.irena.org/-/media/Files/IRENA/Agency/Publication/2024/Nov/IRENA_World_energy_transitions_outlook_2024_Summary.pdf (Accessed August 17, 2025).
Jeon, B. K., Park, S. H., and Kim, E.-J. (2016). Development of a single-zone RC model for predicting hourly load calculation.
Karitnig, A. (2008). Comparison of the two building simulation environments TRNSYS and designBuilder.
Kockat, J., and Milne, C. (2025). Defining a common vision for climate neutral buildings a comprehensive and harmonised framework for whole-life carbon.
McLeskey, J. T., Terziotti, L. T., and Sweet, M. L. (2012). Modeling seasonal solar thermal energy storage in a large urban residential building using TRNSYS 16. Energy Build. 45, 28–31. doi:10.1016/j.enbuild.2011.10.023
Menniti, D., Sorrentino, N., Pinnarelli, A., Brusco, G., Spena, G., and Barone, G. (2024). “DC nanogrid application in minigrid for rural electrification and humanitarian emergencies,” in 2024 7th IEEE Int. Humanit. Technol. Conf. IHTC 2024, 1–7. doi:10.1109/IHTC61819.2024.10855139
MGTES – Magaldi Green Thermal Energy Storage (2025). Magaldi power. Available online at: https://www.magaldi.com/it/applicazioni/mgtes-magaldi-green-thermal-energy-storage (Accessed on May 8, 2025).
Notton, G., Nivet, M. L., Voyant, C., Paoli, C., Darras, C., Motte, F., et al. (2018). Intermittent and stochastic character of renewable energy sources: consequences, cost of intermittence and benefit of forecasting. Renew. Sustain. Energy Rev. 87, 96–105. doi:10.1016/j.rser.2018.02.007
Odoi-Yorke, F., Opoku, R., Davis, F., and Obeng, G. Y. (2024). Employing bibliometric analysis to identify the trends, evolution, and future research directions of sand-based thermal energy storage systems. J. Energy Storage 94, 112343. doi:10.1016/j.est.2024.112343
Peel, M. C., Finlayson, B. L., and McMahon, T. A. (2007). Updated world map of the köppen-geiger climate classification. Hydrol. Earth Syst. Sci. 11, 1633–1644. doi:10.5194/hess-11-1633-2007
Perrella, S., Bruno, R., Bevilacqua, P., Cirone, D., and Arcuri, N. (2023). Energy evaluations of a new plant configuration for solar-assisted heat pumps in cold climates. Sustain 15, 1663. doi:10.3390/su15021663
Perrella, S., Bisegna, F., Bevilacqua, P., Cirone, D., and Bruno, R. (2024). Solar-assisted heat pump with electric and thermal storage: the role of appropriate control strategies for the exploitation of the solar source. Buildings 14, 296. doi:10.3390/buildings14010296
Persson, H., Perers, B., and Carlsson, B. (2011). Type12 and Type56: a load structure comparison in TRNSYS. Proc. World Renew. Energy Congr. – Swed. 8–13 May, 2011, Linköping, Swed. 57, 3789–3796. doi:10.3384/ecp110573789
Pflugradt, N., Stenzel, P., Kotzur, L., and Stolten, D. (2022). LoadProfileGenerator: an agent-based behavior simulation for generating residential load profiles. J. Open Source Softw. 7, 3574. doi:10.21105/joss.03574
Polar Night Energy (2025). Sand battery. Available online at: https://polarnightenergy.fi/sand-battery/ (Accessed on May 8, 2025).
Rodríguez, J. B., Majó, M., Mondragón, R., Díaz-Heras, M., Canales-Vázquez, J., Almendros-Ibáñez, J. A., et al. (2025). Experimental evaluation of carbon-coated sand as solar-absorbing and thermal energy storage media for concentrated solar power applications. Appl. Therm. Eng. 269, 1–10. doi:10.1016/j.applthermaleng.2025.126082
Saxena, V., Manna, S., Rajput, S. K., Diwania, S., and Gupta, V. (2024). Sustainable energy solutions: integrating hybrid CCHP systems with renewable technologies for efficient urban development. J. Braz. Soc. Mech. Sci. Eng. 46, 668. doi:10.1007/s40430-024-05250-w
Seyitini, L., Belgasim, B., and Enweremadu, C. C. (2023). Solid state sensible heat storage technology for industrial applications – a review. J. Energy Storage 62, 106919. doi:10.1016/j.est.2023.106919
Sundaram, K., Sri Preethaa, K. R., Natarajan, Y., Muthuramalingam, A., and Ali, A. A. Y. (2024). Advancing building energy efficiency: a deep learning approach to early-stage prediction of residential electric consumption. Energy Rep. 12, 1281–1292. doi:10.1016/j.egyr.2024.07.034
Sweet, M. L., and McLeskey, J. T. (2012). Numerical simulation of underground seasonal solar thermal energy storage (SSTES) for a single family dwelling using TRNSYS. Sol. Energy 86, 289–300. doi:10.1016/j.solener.2011.10.002
Tat, S. A., and Muthukumar, P. (2024). Performance assessment of a sand-PCM based hybrid thermal storage for medium-to-high temperature applications. J. Energy Storage 103, 114225. doi:10.1016/j.est.2024.114225
Tetteh, S., Juul, G., Järvinen, M., and Santasalo-Aarnio, A. (2024). Improved effective thermal conductivity of sand bed in thermal energy storage systems. J. Energy Storage 86, 111350. doi:10.1016/j.est.2024.111350
TRANSSOLAR and Energietechnik GmbH (2016). Multizone building modeling with type 56 and TRNBuild. Available online at: http://sel.me.wisc.edu/trnsys/features/trnsys18_0_updates.pdf.
Xu, B., Han, J., Kumar, A., Li, P., and Yang, Y. (2017). Thermal storage using sand saturated by thermal-conductive fluid and comparison with the use of concrete. J. Energy Storage 13, 85–95. doi:10.1016/j.est.2017.06.010
Yuan, P., Huang, F., Duanmu, L., Wang, Z., Zheng, H., Gao, S., et al. (2025a). Experimental and theoretical study on thermal storage performance of sand-based thermal storage floor in rural areas, Inner Mongolia, China. J. Energy Storage 106, 114906. doi:10.1016/j.est.2024.114906
Keywords: solid storage, TRNSYS, residential buildings, PV self-consumed share, energy savings
Citation: Bruno R and Jaskhec G (2025) Enhanced thermal storage for residential heating: sand and iron waste to manage PV surpluses. Front. Energy Res. 13:1672714. doi: 10.3389/fenrg.2025.1672714
Received: 24 July 2025; Accepted: 10 November 2025;
Published: 19 November 2025.
Edited by:
Koorosh Gharehbaghi, RMIT University, AustraliaReviewed by:
Varun Gupta, KIET Group of Institutions, IndiaSulaiman Al Hashmi, Sultan Qaboos University, Oman
Copyright © 2025 Bruno and Jaskhec. This is an open-access article distributed under the terms of the Creative Commons Attribution License (CC BY). The use, distribution or reproduction in other forums is permitted, provided the original author(s) and the copyright owner(s) are credited and that the original publication in this journal is cited, in accordance with accepted academic practice. No use, distribution or reproduction is permitted which does not comply with these terms.
*Correspondence: Roberto Bruno, cm9iZXJ0by5icnVub0B1bmljYWwuaXQ=