 Shaheen Akhtar Wahab
 Claire Chassagne
 Rudy L. J. Helmons
- 1Section of Offshore and Dredging Engineering, Department of Maritime and Transport Technology, Faculty of Mechanical Engineering, Delft University of Technology, Delft, Netherlands
- 2Section of Environmental Fluid Mechanics, Department of Hydraulic Engineering, Faculty of Civil Engineering and Geosciences, Delft University of Technology, Delft, Netherlands
This study investigated the impact of various types of bed composition on turbidity current propagation in relation to flocculation. A lock exchange setup was used, comprising a mixing section and an outflow compartment. The bed types investigated were a quartz bed, a quartz bed topped with (unflocculated) illite clay, and a quartz bed with flocculated illite. The findings confirmed that the presence of a bed influenced the turbidity current propagation. In particular, it was found that the front velocity was strongly reduced when the bed was composed of freshly made flocs compared to the case where the bed was made of quartz alone, which does not form flocs. While propagating, either illite clay or flocs were picked up and aggregated into larger flocs. These larger flocs were then deposited further downstream during propagation. Moreover, the front velocity was higher over a quartz bed when no flocculant was added to the outflow compartment water than when flocculant was present. This confirms that flocculation occurs in the water column during propagation.
Highlights
● Freshly flocculated beds reduced the turbidity current front velocity by 5-17% compared to quartz beds.
● Interaction with flocculated beds produced denser and compact flocs with higher median settling velocities (5–15 mm/s).
● Bed-induced roughness and in situ flocculation influence sediment dispersion, which can benefit dredging and marine mining activities.
1 Introduction
Turbidity can originate in any aquatic environment due to natural processes, such as sediment- laden flows propagating downslope under the influence of gravity. It can also arise due to any anthropogenic activities such as dredging, deep-sea mining, trawling, land reclamation, and offshore construction. Such activities can resuspend and release sediments into the water column, leading to the formation of turbidity flows. Among these activities, dredging has been extensively studied due to its importance in maintaining the effective functioning of coastal zones (CEDA, 2011; Erftemeijer et al., 2012; Victor et al., 2018). Sediment spilled during a dredging activity could result in excess turbidity and sedimentation around the dredging area (Bray, 2008; Laboyrie et al., 2018). In contrast to plume propagating in a slope, turbidity currents generated by human activities can also occur on a flat bed. Turbidity currents affect the surrounding environment, with an immediate impact on the marine ecosystem. It can alter species population and shift food webs depending on severity and duration of the exposure and the sensitivity of the ecosystem (Lunt and Smee, 2020; Riza et al., 2023). They also play a crucial role in transporting sediments, nutrients, and pollutants from the continental margin to the world’s oceans.
Turbidity currents are dilute sediment-laden flows with concentrations less than 10 kg/m3 (Parsons et al., 2007). They are fully turbulent with a Reynolds number greater than 10000 and contain poorly sorted sediments (Parsons et al., 2007). A turbidity current has three main parts, namely the head, body, and tail. The head of the turbidity current exhibits distinctive properties when compared to its body and tail. The head has significantly different mass and momentum from its body and tail. It has the highest concentration. While propagating, it displaces the ambient fluid, and this causes frictional resistance.
The presence of a bed affects the turbidity current propagation. The roughness of the bed plays a significant role in influencing the current kinematics, by reducing the front velocity due to more drag (Nogueira et al., 2013). In the case of a non-erodible bed, no additional material is picked up during the propagation. However, in an erodible bed, materials can be eroded, while some materials can be deposited, which will in turn affect the dynamics of the turbidity current (Parker et al., 1987). The turbidity currents can contribute to active sediment transport and rapid bed deformation, processes that contribute to erosion of various submarine canyons (Hu and Cao, 2009).
Studies have confirmed the occurrence of flocculation in the dredging plume (Ali et al., 2022; de Wit et al., 2025). In the previous articles of Wahab et al. (2024) and Wahab et al. (2025), the role of organic matter distributed in the water column on turbidity current propagation on a flatbed was studied. Together, these studies highlight how organic matter (flocculant) promotes flocculation, which in turn affects the turbidity current propagation. It was found that flocculation within turbidity flows is influenced not only due to the presence of suspended organic matter but also due to bed interactions. Hydrodynamics such as mixing rate inside the turbidity current (influenced by concentration) and residence times, i.e., for how long the sediment and organic matter were mixed, influenced the density and settling velocity of flocs.
The age of a bed also plays a vital role in flocculation dynamics. A previous study by (Wahab et al., 2025) showed that the turbidity current front velocity decreased in the presence of 1-day old bed (made with sediments from the Clarion Clipperton Zone, located between Hawaii and Mexico) but increased for a 3-day bed. In a study conducted by Ali et al. (2024) on the same material, flocs were created in a jar by mixing and left to rest on the bottom of the jar. Floc sizes were observed to gradually increase over time until resting day 10, after which a decline in size occurred. This reduction in size was attributed to the reconformation of organic matter inside the floc due to the amphiphilic property of the organic matter found in the Clarion Clipperton Zone.
The main goal of this research is to investigate the underlying mechanism by which a bed with loose materials influences flocculation and turbidity current dynamics. Laboratory experiments simplify the complex nature of real-world deep-sea turbidity currents. They were designed to isolate and study the governing mechanisms of particle aggregation and their impact on current propagation under transitional-turbulent conditions (here, Re=2878, Fr=0.15). This study specifically examines how bed roughness imparted by freshly deposited sediments affects floc formation and settling behavior. To ensure repeatability of the ex- periments, as natural sediments tend to have variability in their properties depending on their geographic origin and focus on the driving mechanism, illite clay (devoid of organic matter) was combined with an anionic polyacrylamide flocculant previously applied in related studies (Wahab et al., 2024). By using sediments with consistent behavior, the study could focus on the fundamental mechanisms that influence turbidity current dynamics due to the presence of a bed rather than any site-specific sediment characteristics. Furthermore, the use of illite and flocculants ensured sufficient materials were available throughout the experiments.
2 Materials and method
2.1 Setups
2.1.1 Lock exchange
The lock exchange flume is 3m long, 0.4m high, and 0.2m wide. It is illustrated in Figures 9 and 10 in the Supplementary Materials Section 13. Each experiment was repeated twice: once with a siphon (used for sampling for floc analysis) and the other for recording velocity profiles (using a UVP). Sediment samples from the heads of the turbidity currents were collected via the siphon placed 2cm above the bed.
2.1.2 Ultrasonic velocity profiler
The Ultrasonic Velocity Profiler (UVP) is an instrument designed to measure instantaneous velocity profiles in liquid flows. It uses the Doppler shift frequency of the echoed ultrasound as a function of time (Met-Flow, 2002). In this study, a Metflow UVP device was used. A 4 MHz transducer (based on the particle size of the sediments) was used to measure the velocity profiles of particles inside the turbidity current. It was placed at an angle of 20 degrees aligned with the flow direction, to record 1-D particle velocities (Supplementary Materials Section 13; Figure 10).
2.1.3 FlocCAM
The flocs were analyzed using an in-house device known as the FlocCAM (Figure 1). It can measure floc size and settling velocities of flocs greater than 20 µm (Manning et al., 2007; Ye et al., 2020; Shakeel et al., 2021). It consists of a settling column of dimension 10cm x 10 cm x 30cm, and a 5MP CMOS camera with a 2592 x 2048 pixels resolution and a Global Shutter was used to capture flocs in high- resolution images. The flocs were gently transferred into the settling column by a pipette. Videos were recorded and analyzed with the Safas software package to measure floc sizes and settling velocities (Ryan MacIver, 2019).
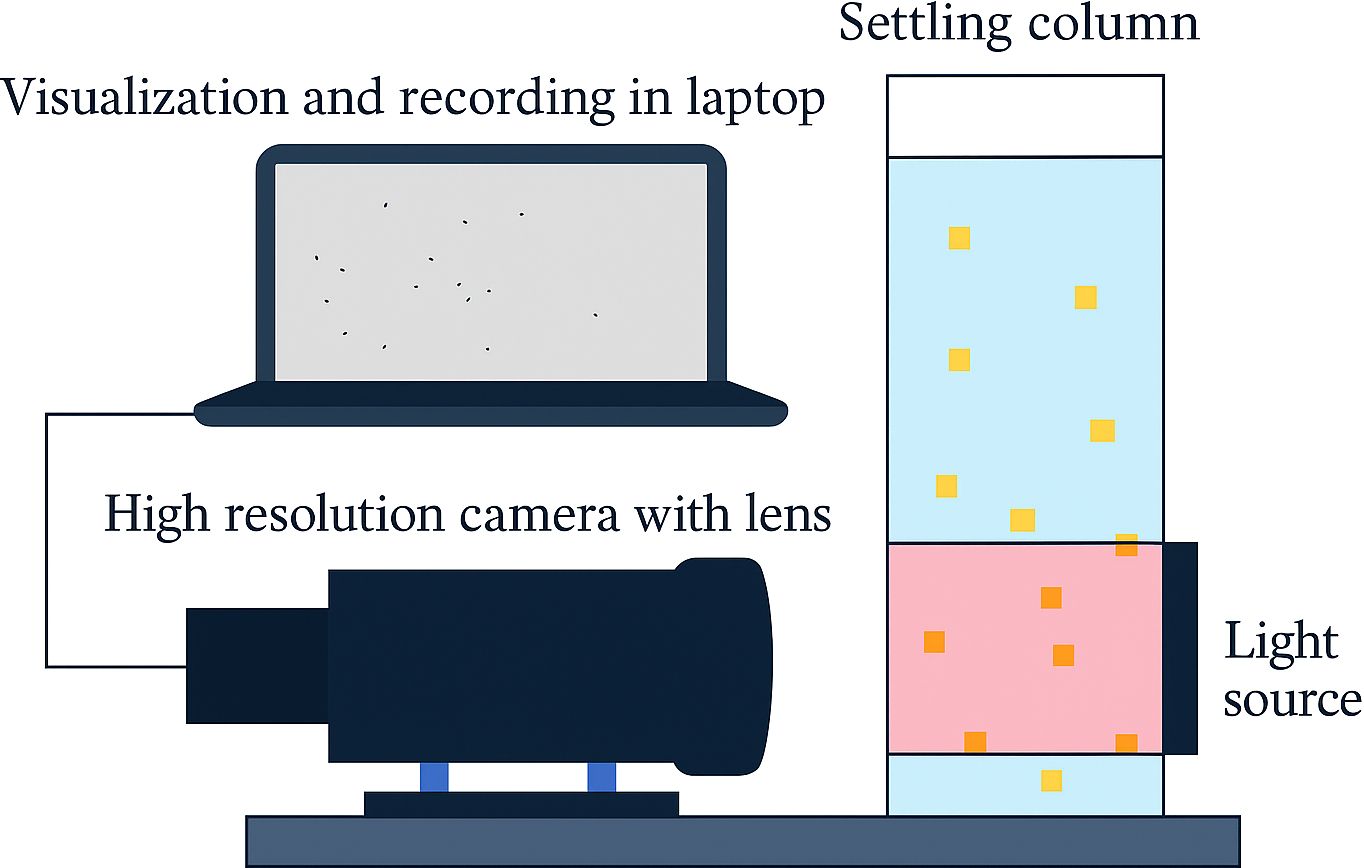
Figure 1. Schematic diagram of FlocCAM (Ali et al., 2022).
2.2 Materials
2.2.1 Clay
The experiments were conducted with illite. It is the primary mineral component in the Clarion Clipperton Zone sediment, making 39-54% of the uppermost layer (International Seabed Authority, 2010; Helmons et al., 2022). This material has also been used in the previous work of Ali et al. (2022) and Wahab et al. (2024). The illite used here is “Granulated green clay for poultice and plaster” purchased from Agriletz Laboratories. It has a d50 of 6.4 µm when measured using static light scattering technique in Malvern Mastersizer 2000 (Wahab et al., 2024). It has a density of 2750 kg/m3.
2.2.2 Saltwater
The experiments were conducted in saltwater. The salt used here was natrium chloride (NaCl) purchased from Boom Laboratories. The electrical conductivity of the saltwater was kept at 34.7mS/cm, similar to that of seawater.
2.2.3 Flocculant
In order to study the nature and behavior of flocs that were formed inside the body of the turbidity current during its propagation, as seen in the previous works of (Wahab et al., 2024; Wahab et al., 2025), it was crucial to add a flocculant that would form flocs. The flocculant was used to mimic the role of organic matter. Illite does not form flocs on its own. The flocculant used here was Zetag 4120 (from BASF), which is an anionic polyacrylamide, with a medium charge and high molecular weight. It is obtained as a dry powder and mixed with water to form a stock solution. The stock solution was then weighed and added according to the dosage. The dosage used here was 2.5mg/g of clay for all experiments.
2.2.4 Quartz
Quartz flour, commercially known as M10 (Sibelco), was used to construct a bed that was non-flocculating. The flour has a d50 of 23 µm and a density of 2650 kg/m3. The particle size distribution of quartz flour is shown in Figure 2.
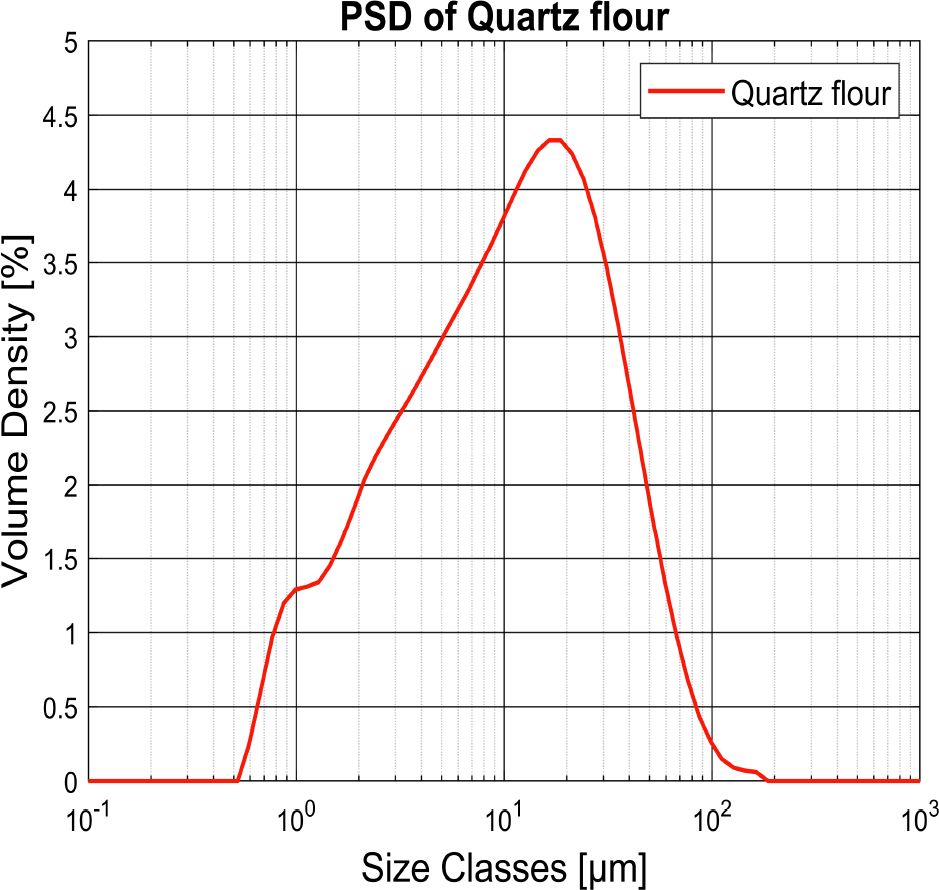
Figure 2. Particle size distribution of quartz flour.
2.3 Methods
The protocol that was followed while conducting these experiments is as follows:
1 Quartz bed
● Dry quartz flour was distributed on the flume bottom to make the bed.
● The quartz flour was moistened and allowed to rest for a minimum of 1 hour.
2 Lock exchange flume
● 210 liters of saltwater was gradually pumped into the flume with minimal disturbance up to a height of 35cm.
3 Mixing section
● Three different concentrations were used (Table 1). A weighed mass of illite based on the desired concentration was added to the mixing section of the flume, which contained 14 liters of saltwater. It was then mixed for 20 minutes.
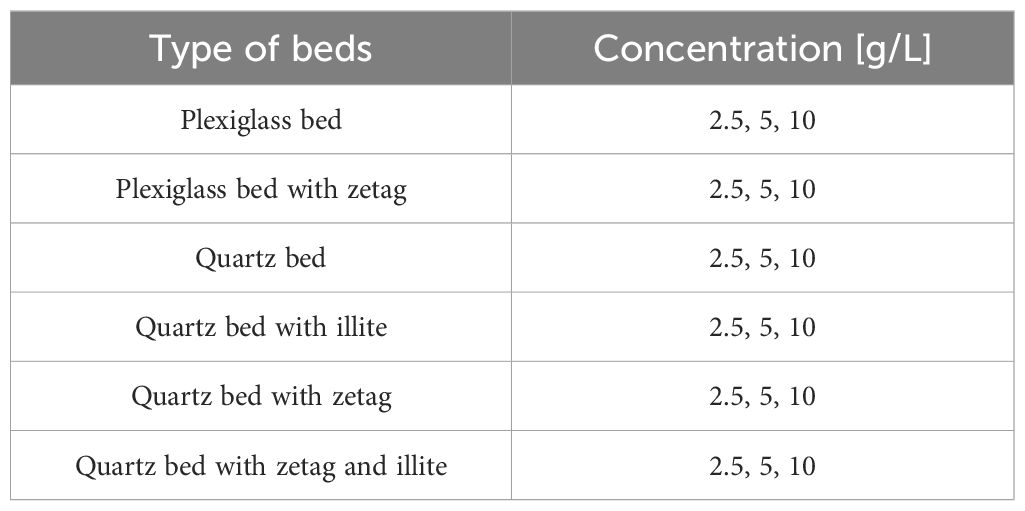
Table 1. Experimental matrix with different bed types and concentrations.
4 Outflow compartment
● Different types of beds and saltwater, which were used in the experiments in the outflow compartment, are described in Section 2.4.
5 Turbidity current propagation
● The lock gate was then opened, allowing the sediment mixture out and travel along the length of the flume.
● A UVP transducer was also installed at a fixed position in the setup to measure the velocity of particles within the turbidity current. The sampling frequency was set at 8 profiles per second.
● A GoPro Hero 11 camera was used to record videos, which were later analyzed with Tracker software (Brown et al., 2008).
6 Experimental matrix
● The experimental matrix was repeated as per the protocol (Steps 1-3), where sediment samples were collected from the body of the turbidity current using a siphon.
7 Floc analysis
● The collected samples were then analyzed with FlocCAM.
2.4 Types of bed
The bed construction is described in this section. The primary objective is to investigate how the presence of a bed affects the front velocity of turbidity currents. This is particularly relevant in scenarios like dredging or marine mining, where consecutive operations occur, leading to successive turbidity currents.
For two experiments, the flume bottom (made of plexiglass) was used. A bed was then prepared for the remaining experiments by layering quartz flour on the plexiglass flume bottom to mimic an existing (sea) bed. The bed was approximately 5mm thick. The flume tank was then carefully filled with saltwater with the least disturbance.
Six different kinds of experimental conditions (bed and saltwater) were prepared for these experiments, which are shown schematically in Figure 3.
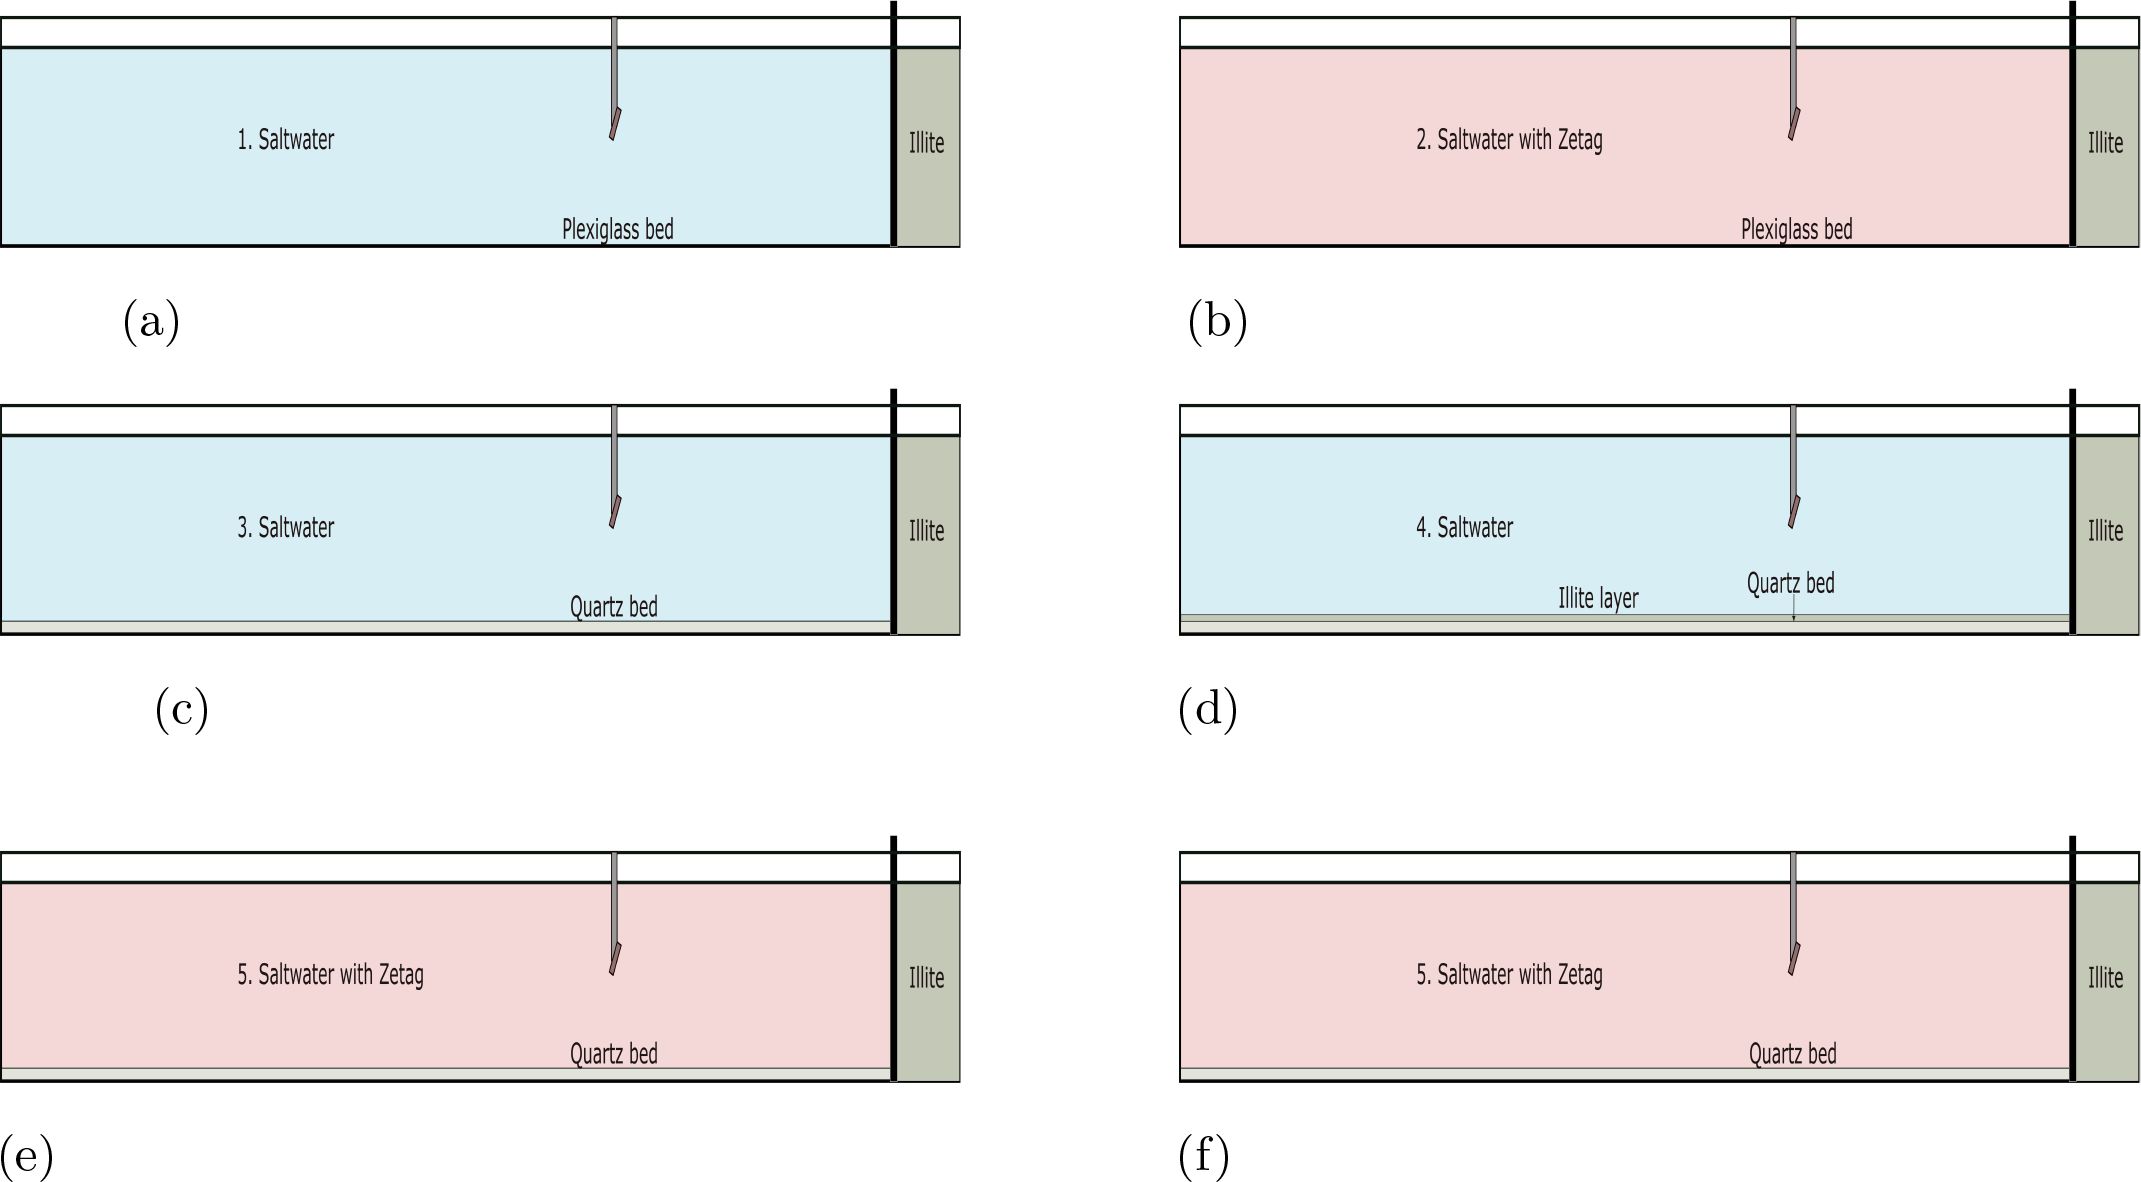
Figure 3. Formation of different types of beds. Here, blue represents the absence of Zetag, while pink denotes its presence in the water column. (a) Plexiglass bed with saltwater, (b) Plexiglass bed with saltwater and zetag, (c) Quartz bed with saltwater, (d) Quartz bed with loose illite on top and saltwater, (e) Quartz bed with zetag in the water col- umn, (f) Quartz bed with flocculated illite and ze- tag in the water column.
1 Plexiglass bed
The turbidity current in this case propagated on the plexiglass bottom of the flume. The water in this case was pure saltwater with no zetag.
2 Plexiglass bed with zetag
The turbidity current propagated on top of the plexiglass. The saltwater in the flume contained zetag in this case.
3 Quartz bed
This bed was constructed by laying quartz flour on the flume bottom and leveling it. The flume was then carefully filled with saltwater to the required height.
4 Quartz bed with illite
This bed was prepared using a consistent protocol, where freshly flocculated illite was allowed to settle on top of the quartz bed from a preceding run, thus naturally creating a uniform layer of illite. The previous study of (Wahab et al., 2025) showed that the age of the bed has a role to play in the consolidation of the bed, with an older being more consolidated and smoother compared to a freshly deposited bed. Here in these experiments, the duration in between runs was kept consistent (15 minutes), ensuring that the bed had a similar age before each run. In this way, the variability in bed roughness was minimized, ensuring consistency in preparation.
5 Quartz bed with zetag
This bed was prepared similarly to the quartz bed, but with zetag homogeneously suspended in the water column. A specified dosage of zetag was added to the outflow compartment of the flume and gently mixed before the experiment.
6 Quartz bed with zetag and illite
This bed was prepared in a similar way to the “Quartz bed with illite”. The only difference was that the water used here had zetag in it.
Table 1 shows the matrix for the experiments performed in the lock exchange.
3 Results
The results of the experiments that were conducted are presented here.
3.1 Front analysis
Here, the front positions of turbidity currents are analyzed. A similar pattern as seen in Wahab et al. (2025) has also been observed in these experiments. The videos recorded with Go Pro camera were analyzed using the Tracker software, where the front position was recorded with respect to time.
Across all three concentrations, the presence of a bed was found to reduce the front velocity of the turbidity current compared to a plexiglass bed (no bed condition). This finding supports the hypothesis that flocculants in the ambient water act as a lubricant, reducing bed roughness and thereby promoting faster current propagation (Wahab et al., 2024). In contrast, when loose bed materials (from a previous run) were introduced in combination with the flocculant, the front velocity showed the greatest reduction, indicating that the enhanced surface roughness counteracted the lubricating effect of the flocculant.
Figure 4 shows that the presence of a bed delays the turbidity current front compared to the case without a bed. For a plexiglass bed, with no quartz or zetag in the water column, the front positions at 10 g/L and 5 g/L were similar to those observed for the quartz bed, with front velocities of approximately 0.057m/s and 0.040m/s, respectively. However, for 2.5g/L concentration, the velocity matches the ones of Q.B+Illite and Q.B+Zetag+Illite cases (0.025m/s).
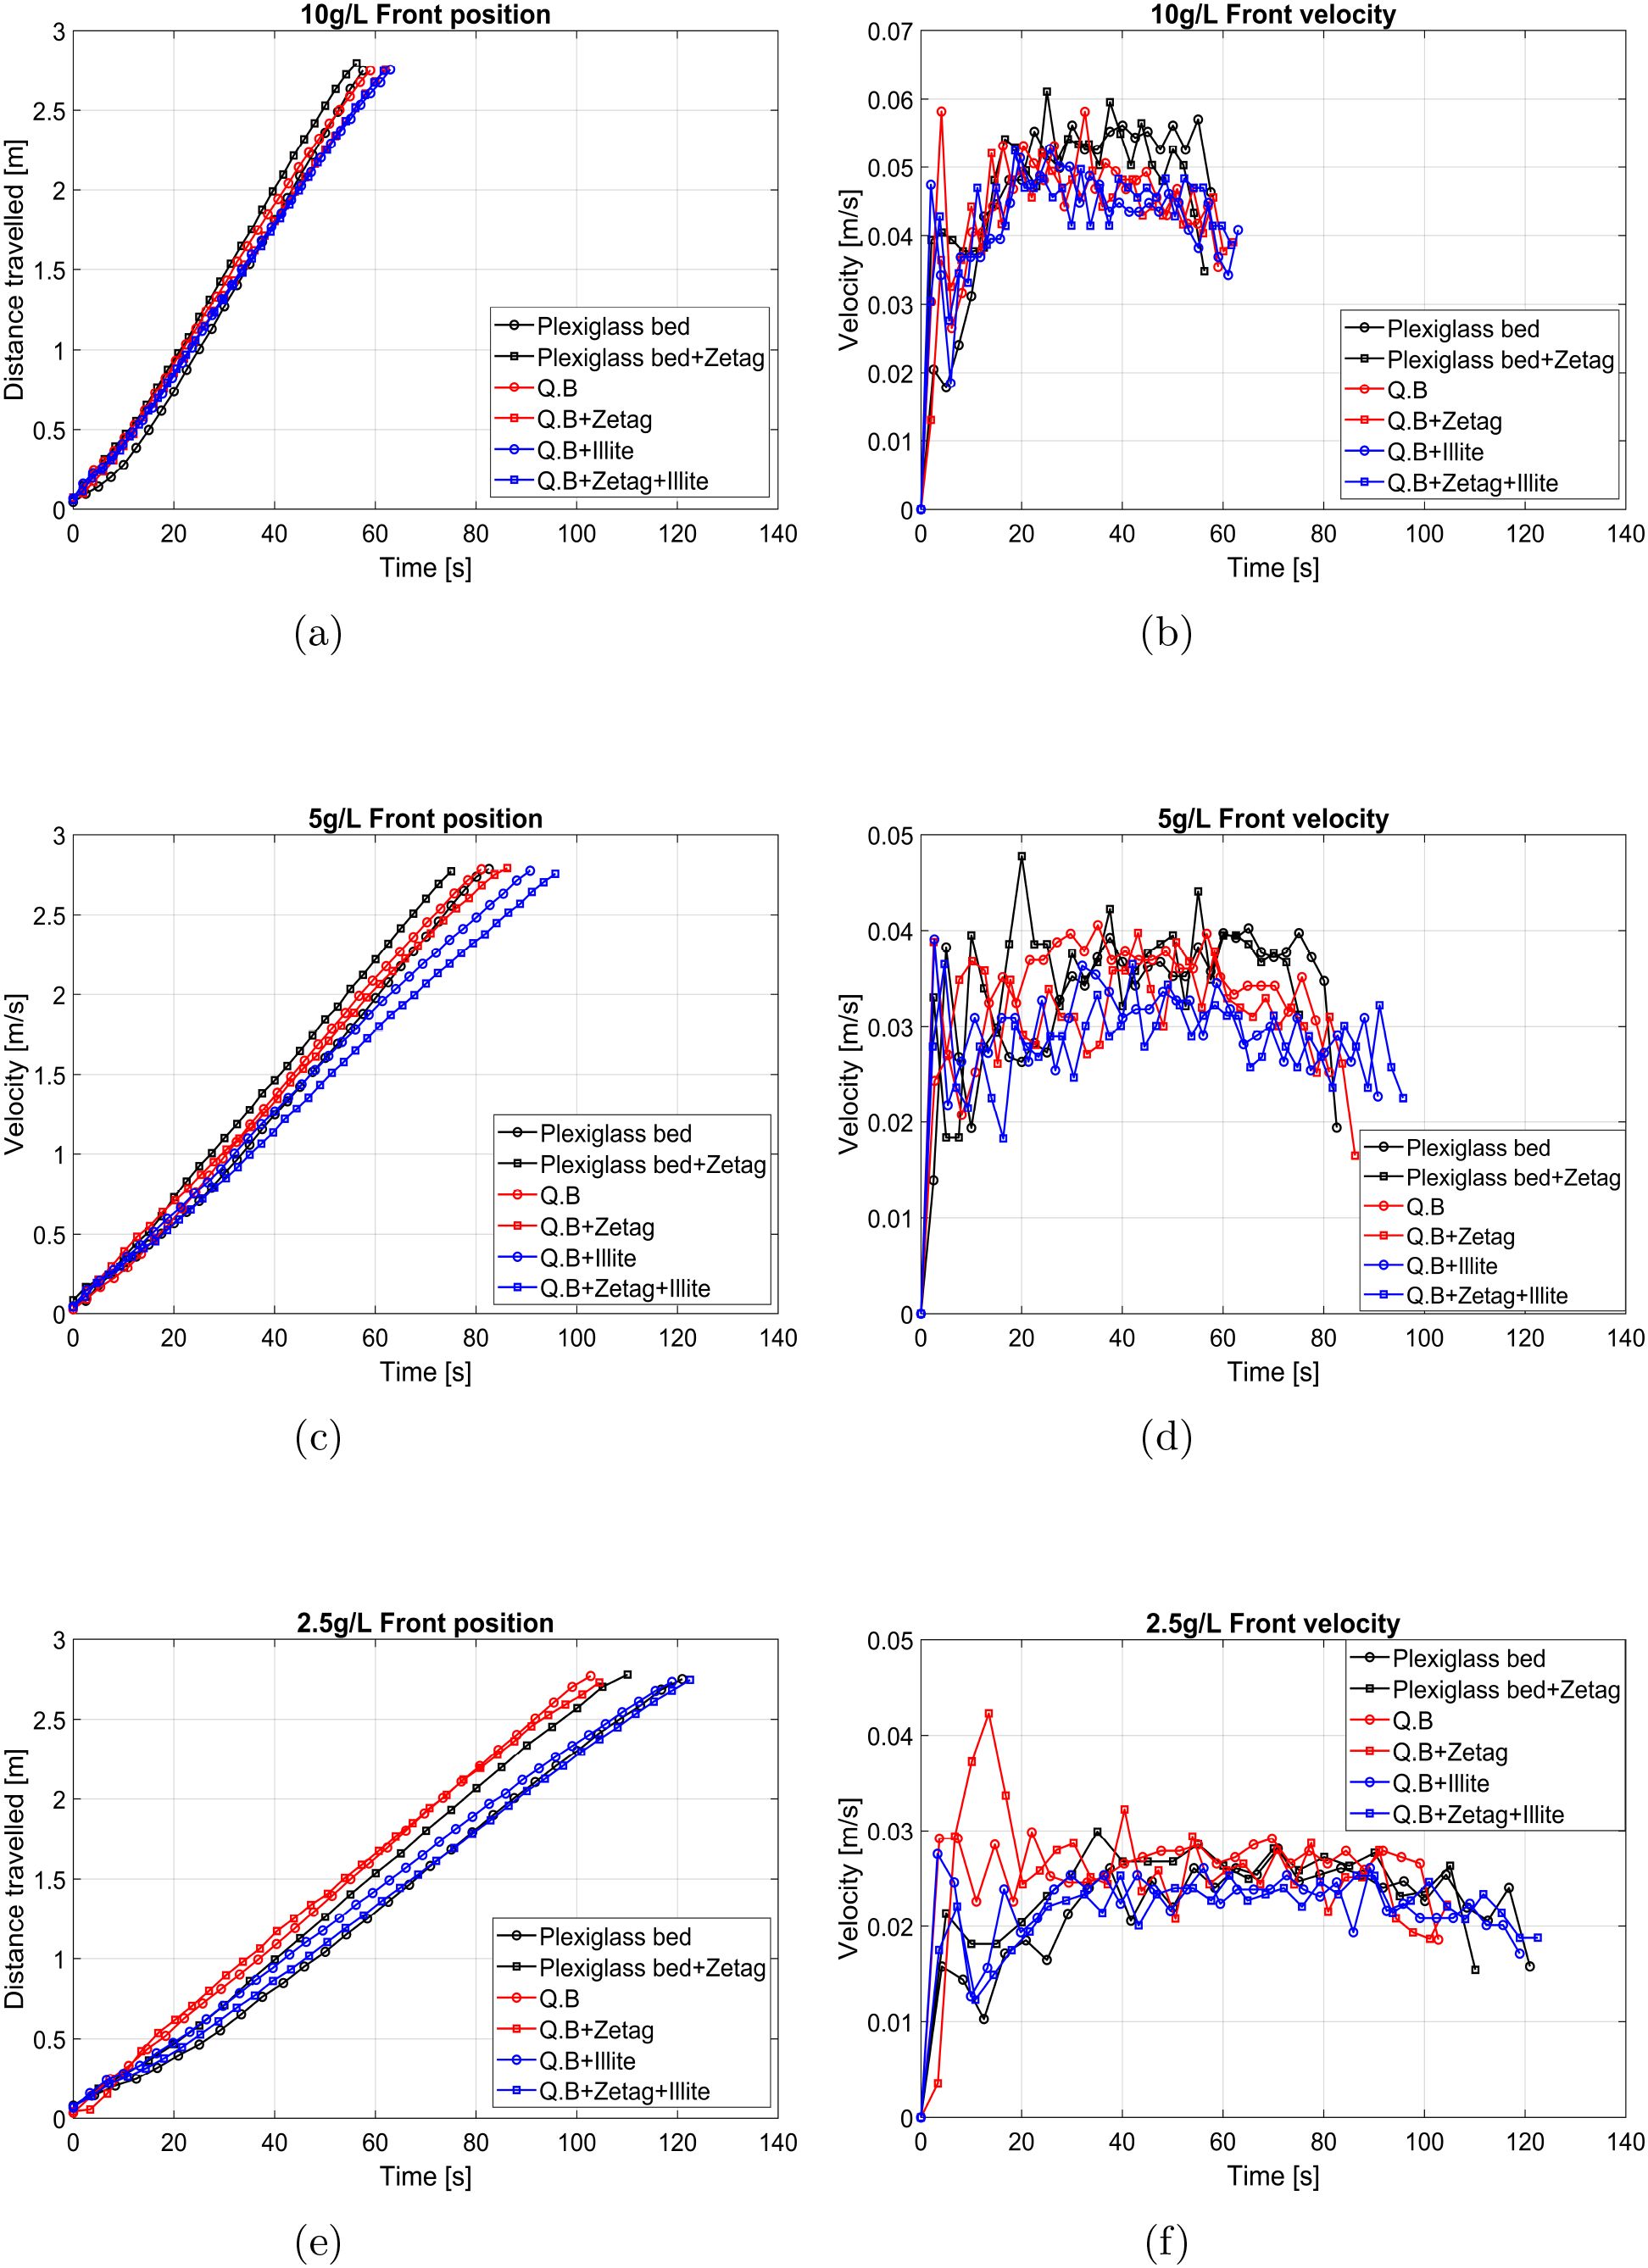
Figure 4. (a, c, e) Front positions of turbidity currents. (b, d, f) Front velocities of turbidity currents.
When zetag was added to the water column over a plexiglass bed, the turbidity current front reached the end of the flume fastest at 10 g/L and 5 g/L, with maximum velocities of 0.061m/s and 0.047m/s, respectively. This corresponds to an increase in approximately 11% compared to the case with no zetag in the water column, for the plexiglass bed case. The front positions are shown in (Figures 4a, c, e), while their corresponding velocities in (Figures 4b, d, f).
In the case of quartz bed, for all three concentrations studied, the introduction of the quartz bed influenced the front position, which is comparable to “Plexiglass bed” cases (for 10g/L and 5g/L). For the Quartz bed with illite case, when compared to the quartz bed alone, the introduction of illite clay on top of the bed reduced the front velocity further by 1 and 3% respectively for 10g/L and 5g/L. In case of Quartz bed with zetag, the turbidity current front velocity has been observed to be lower than in the case without zetag suspended. For the Quartz bed with zetag and illite in all three concentrations studied, the turbidity current propagating on this type of bed is the slowest compared to the other bed types. The maximum velocities were 0.052m/s for 10g/L, 0.036m/s for 5g/L and 0.025m/s for 2.5g/L.
3.2 UVP velocity profiles
The instantaneous velocity profiles obtained from the UVP transducer are shown here in Figure 5.
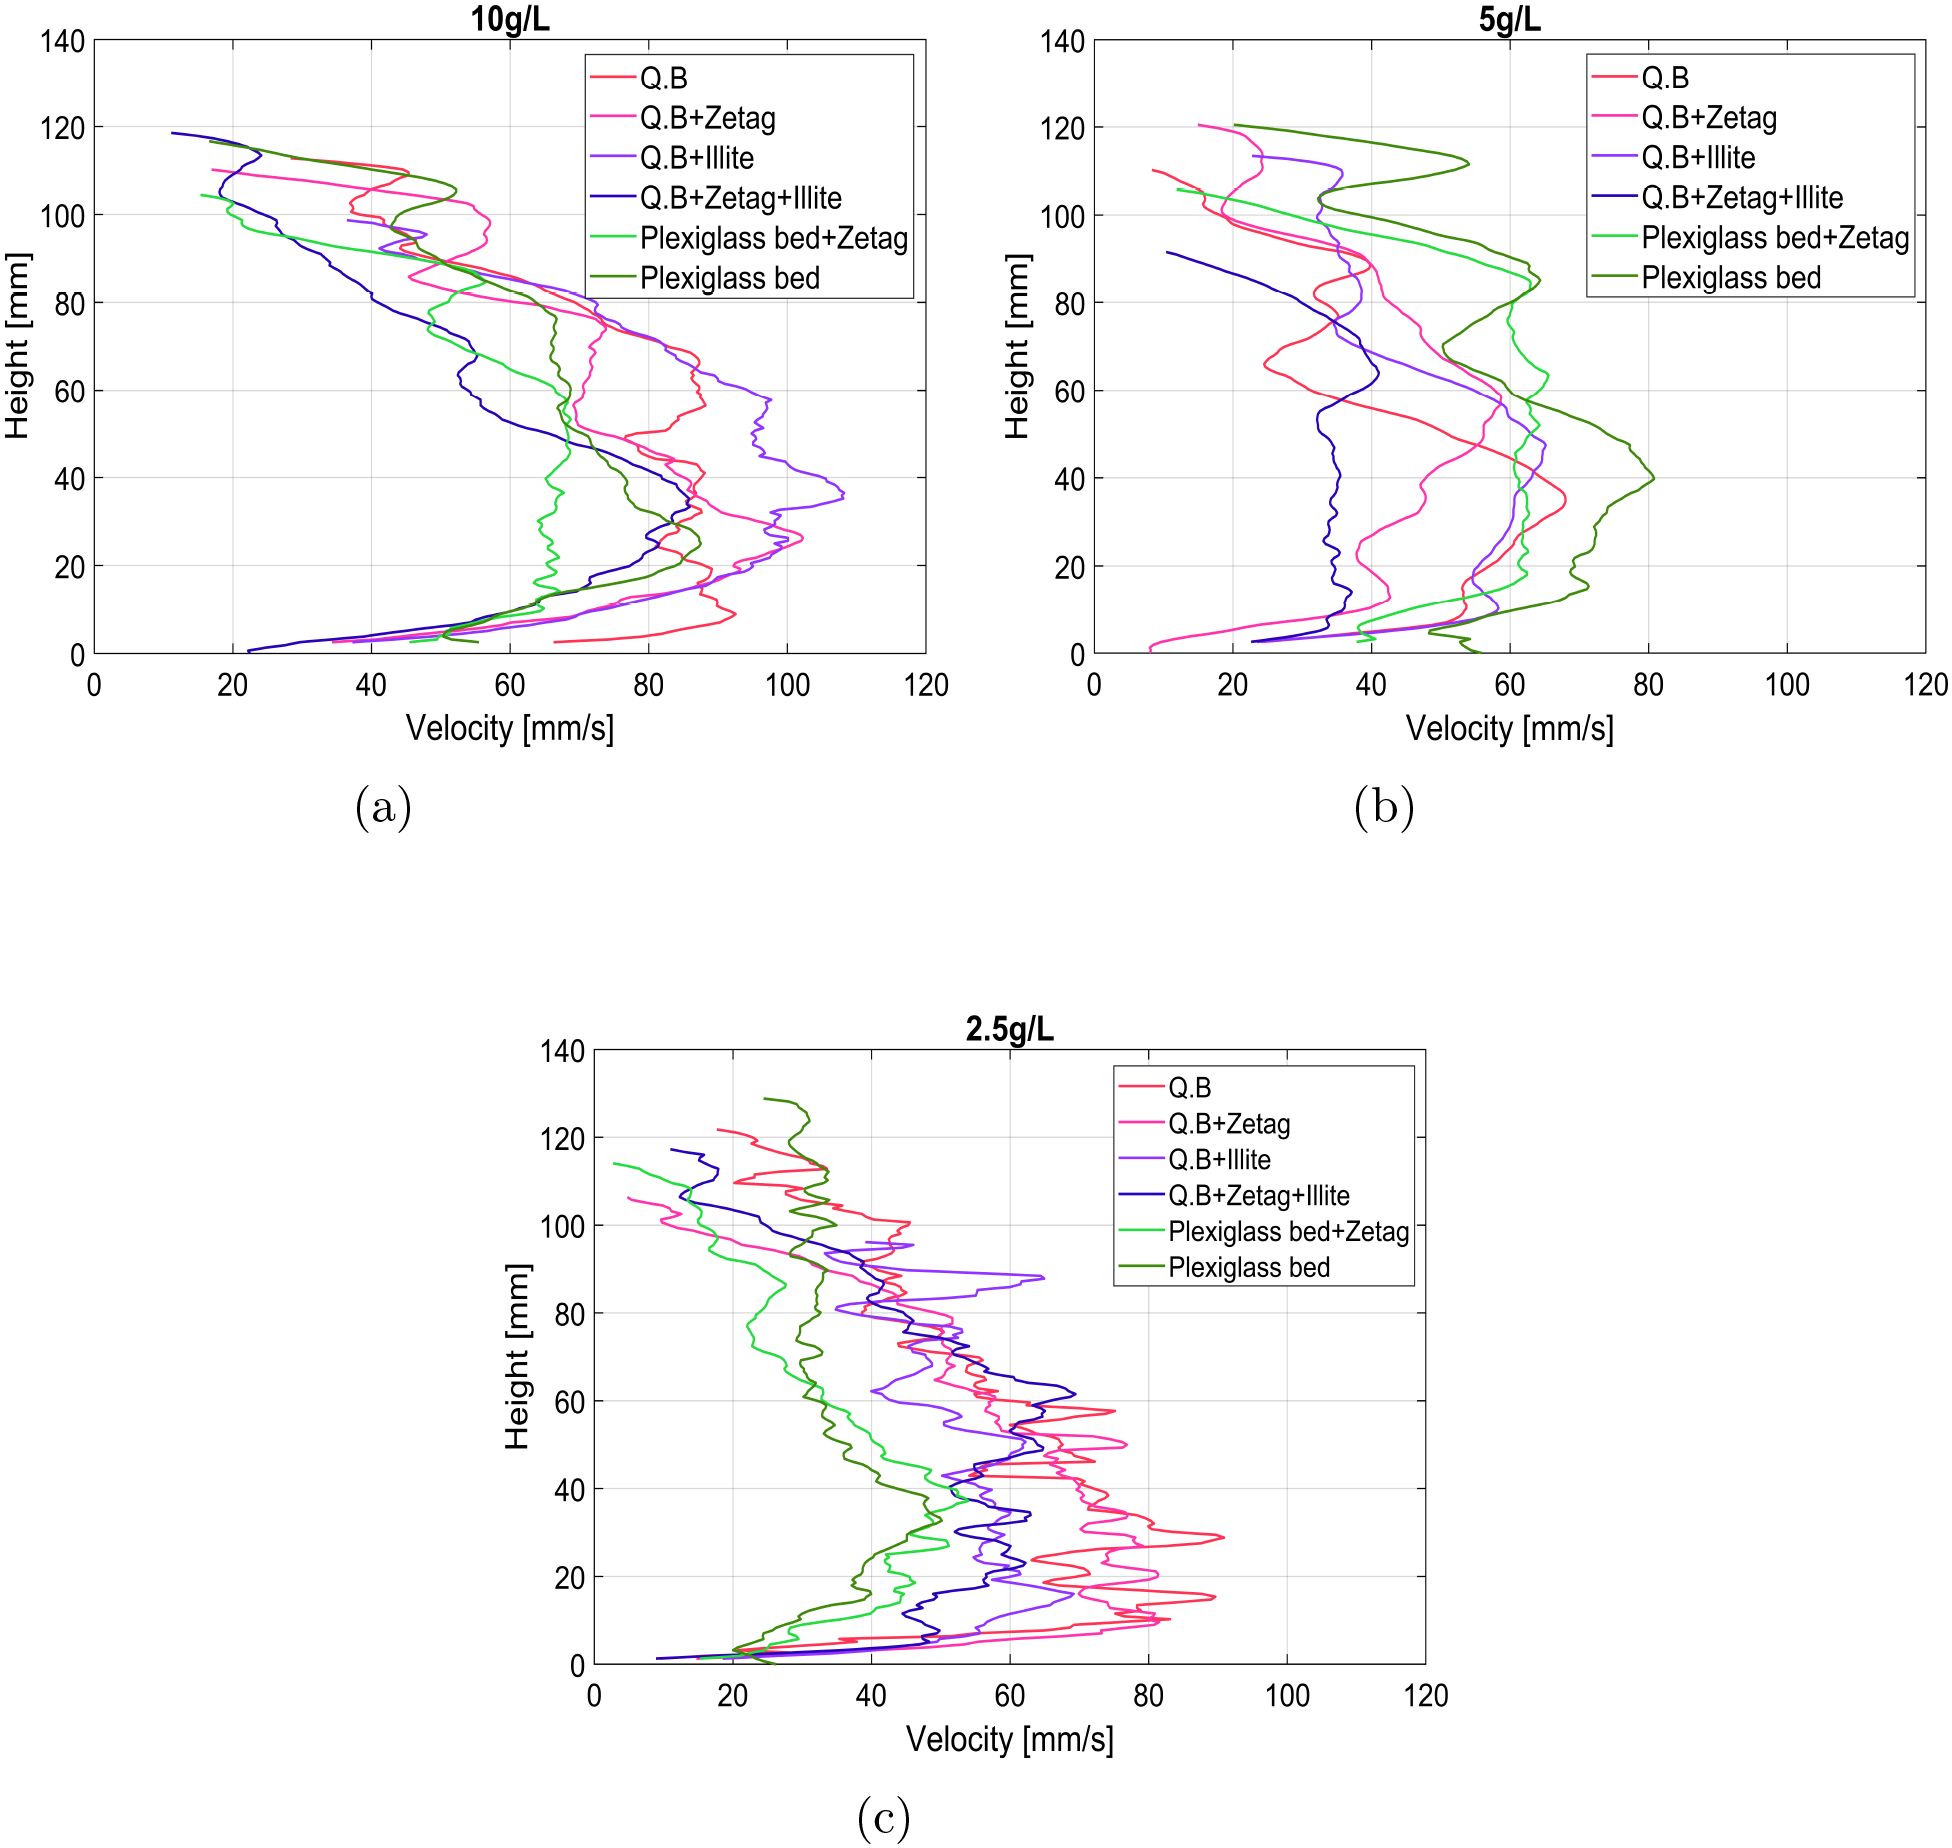
Figure 5. (a–c) Instantaneous velocity profiles for different bed conditions.
The velocity profiles represent the horizontal component of particle velocity within the turbidity current. The data shown here were extracted when the head of the current reached 120cm from the lock gate (30cm from the transducer). To capture the head region, a time window of 45–60 seconds was selected around the arrival of the front at 120cm from the lock gate. The velocity data were collected only from the head and not from the body as it contained more noise due to reduction in the amount of seeding materials that produced more noise than readable data.
Various processes take place inside a turbidity current. Thereby, the particles inside the current may not be representative of the front velocity. For the Q.B+Zetag+Illite bed cases, the initial velocities were generally the lowest, except at 5 g/L, where the velocities remained lowest across the entire height of the current. Also, the velocity of particles in the case of a quartz bed was found to be relatively higher across all three concentrations.
3.3 FlocCAM
Samples were collected from the body of the turbidity current via a siphon located 2cm above the bed and 90cm from the mixing section. They were then analyzed in the FlocCAM using Safas software. The flocs formed with zetag present in the outflow compartment for two types of bed scenarios are shown here: Quartz bed with zetag (Q.B+Zetag) and Quartz bed with zetag and illite (Q.B+Zetag+Illite).
It is seen that for all three concentrations, the flocs formed with an illite layer on top had higher settling velocity than those formed with a quartz bed alone. The quartz bed with illite had loose particles on its surface, which were picked up when a turbidity current passed over it. This led to the formation of denser flocs (Floc images are shown in Supplementary Materials Section 13, Figures 11–13). Additionally, the settling velocity distribution was observed to be narrower within a specific range of 3–30 mm/s for 5g/L and 2–20 mm/s for 2.5g/L. On the other hand, it was widespread in the case of 10g/L, ranging between 0.1–10 mm/s.
3.3.1 Settling velocity
Figure 6 shows the settling velocities of the flocs formed with three different sediment concentrations: 10g/L, 5g/L, and 2.5g/L.
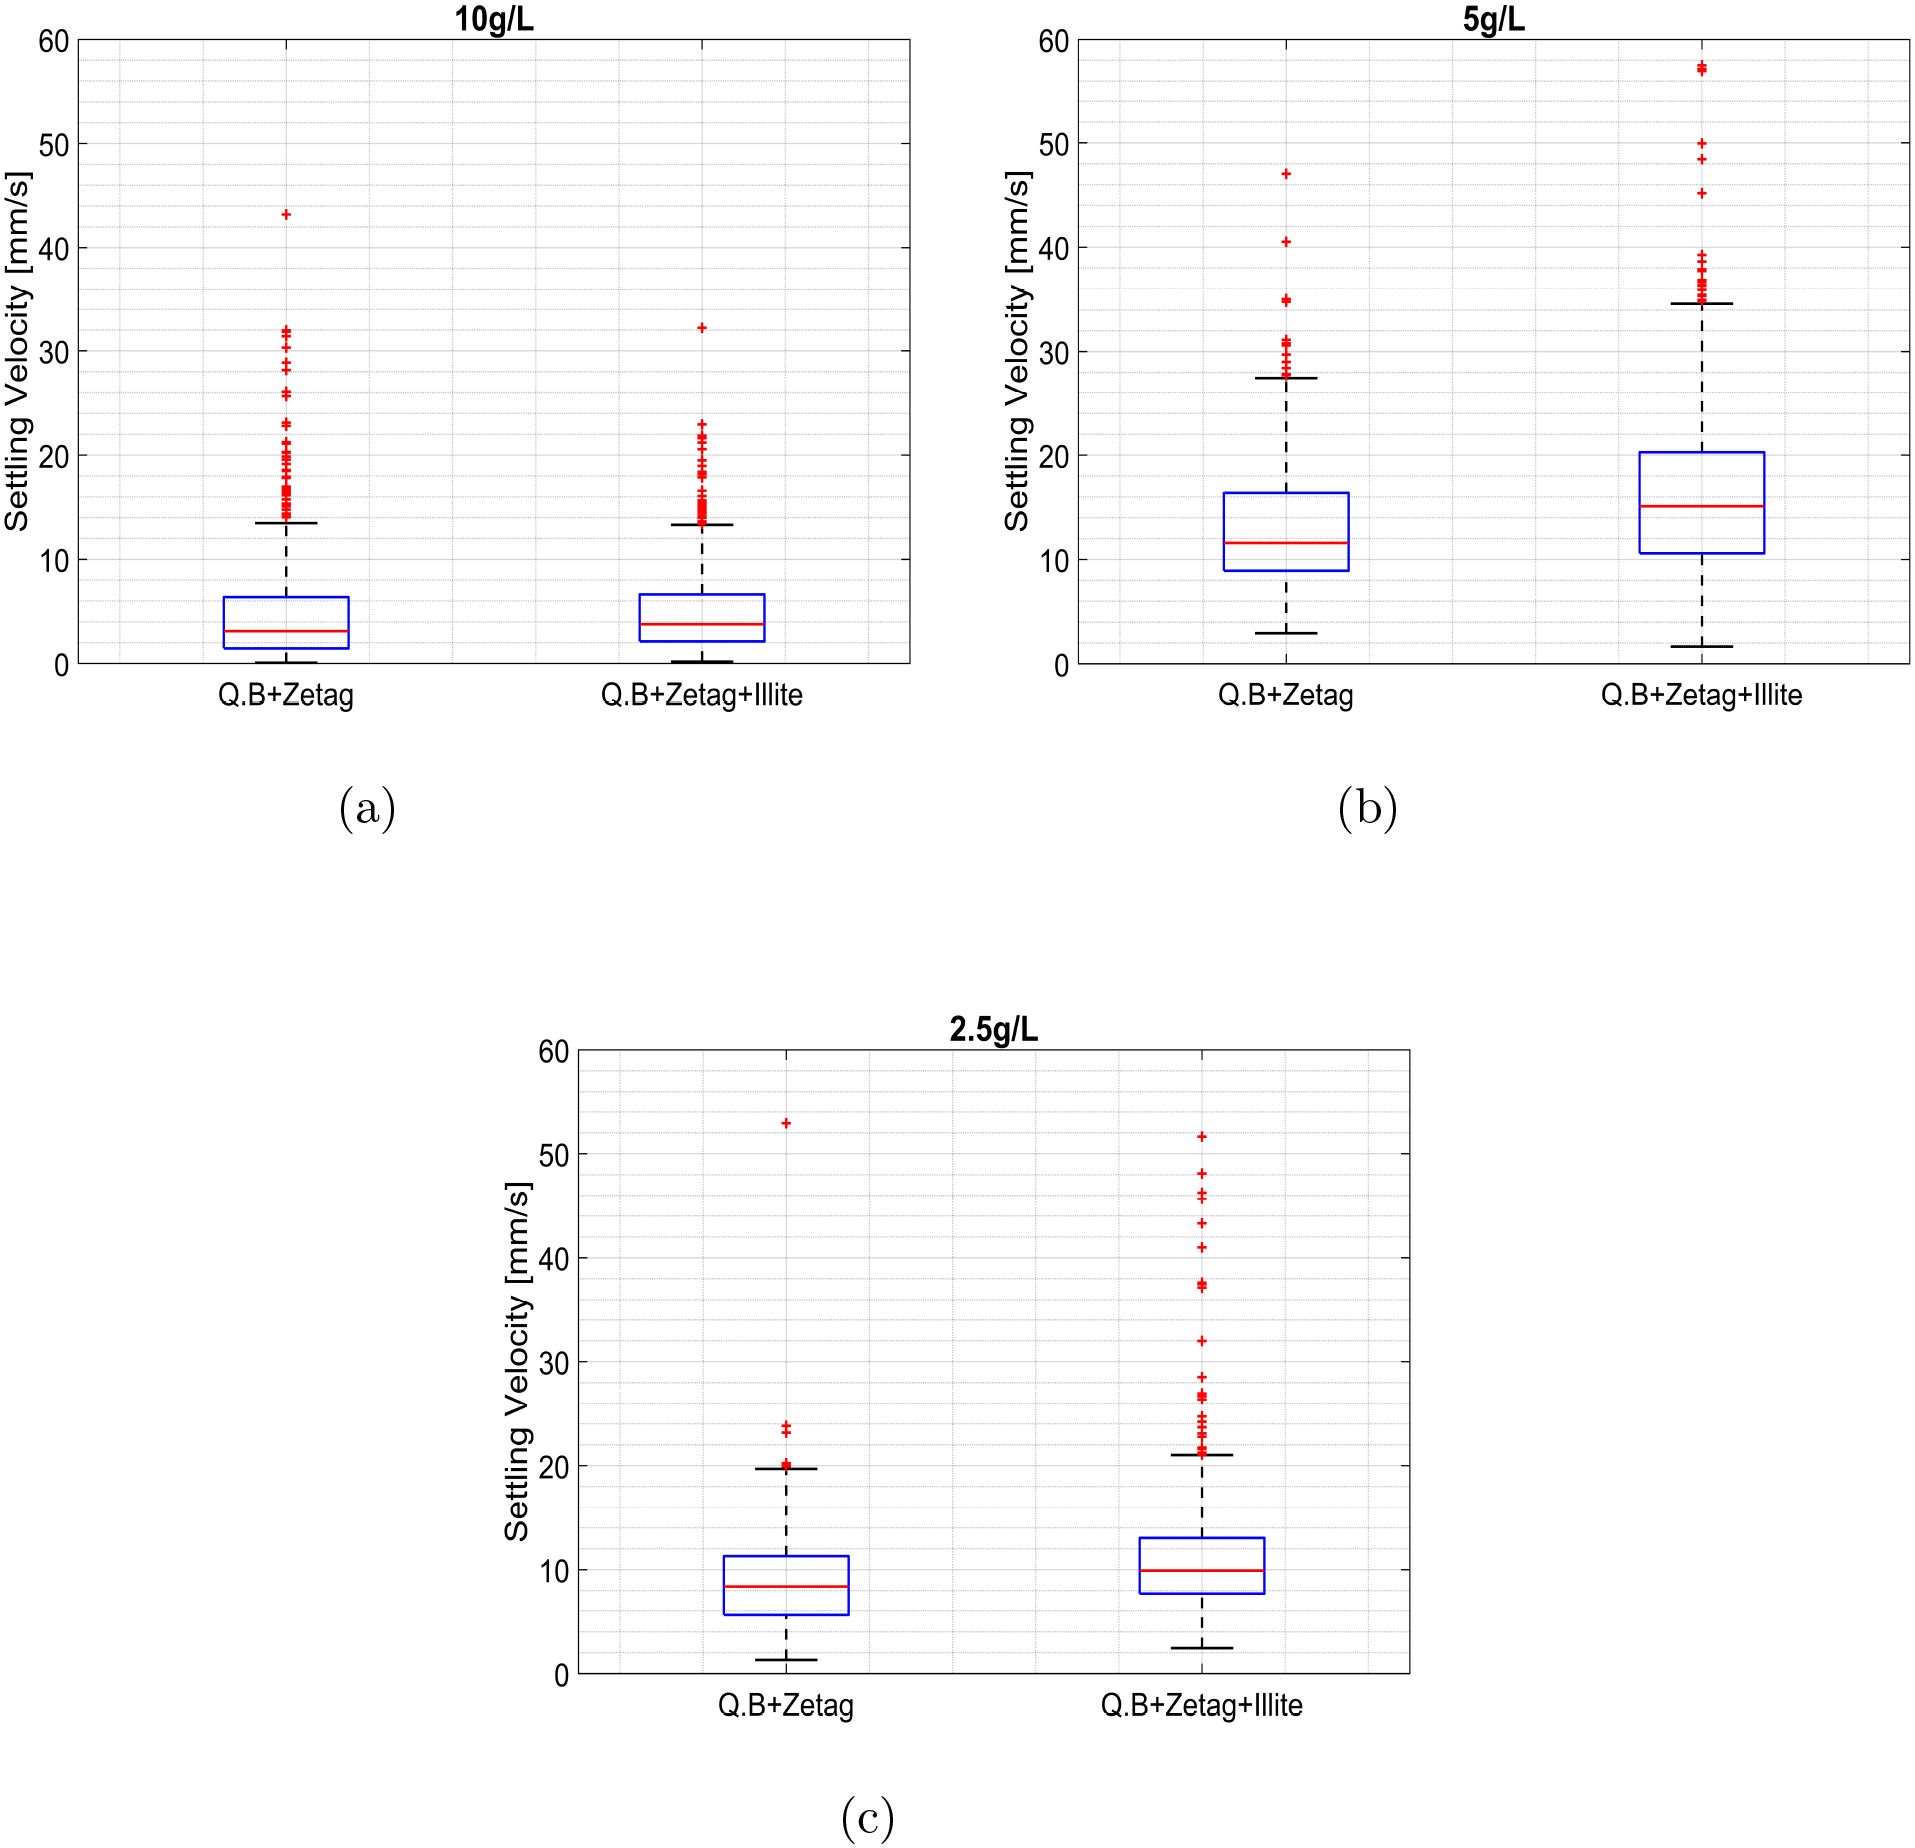
Figure 6. (a–c) Settling velocity of flocs under different bed conditions.
Here, the median settling velocities indicate that the flocs formed with illite on the bed surface led to the formation of denser flocs compared to those formed with a quartz bed alone. The settling velocities of flocs formed with 10g/L has lower settling velocities when compared to that of 5g/L and 2.5g/L. After analyzing the video recordings of flocs, it was found that the 10g/L sediment concentration flocs fell individually, following Stokes’ settling velocity. They also comprise of a large number of smaller flocs in the range of 100 µm. On the contrary, the flocs in the case of 5g/L sediment concentration fell as a stream collectively (also known as collective settling). Their settling velocities are in the comparable range (Figure 7) between 5–62 mm/s for 2.5g/L and 5–60 mm/s for 5g/L. For 2.5g/L concentration, the maximum settling velocities for d10, d50, and d90 for Q.B+Zetag+Illite flocs were 16, 17, and 62 mm/s, respectively. In case of 5g/L concentration, the maximum settling velocities for d10, d50, and d90 for Q.B+Zetag+Illite flocs were 38, 57 and 60 mm/s, respectively.
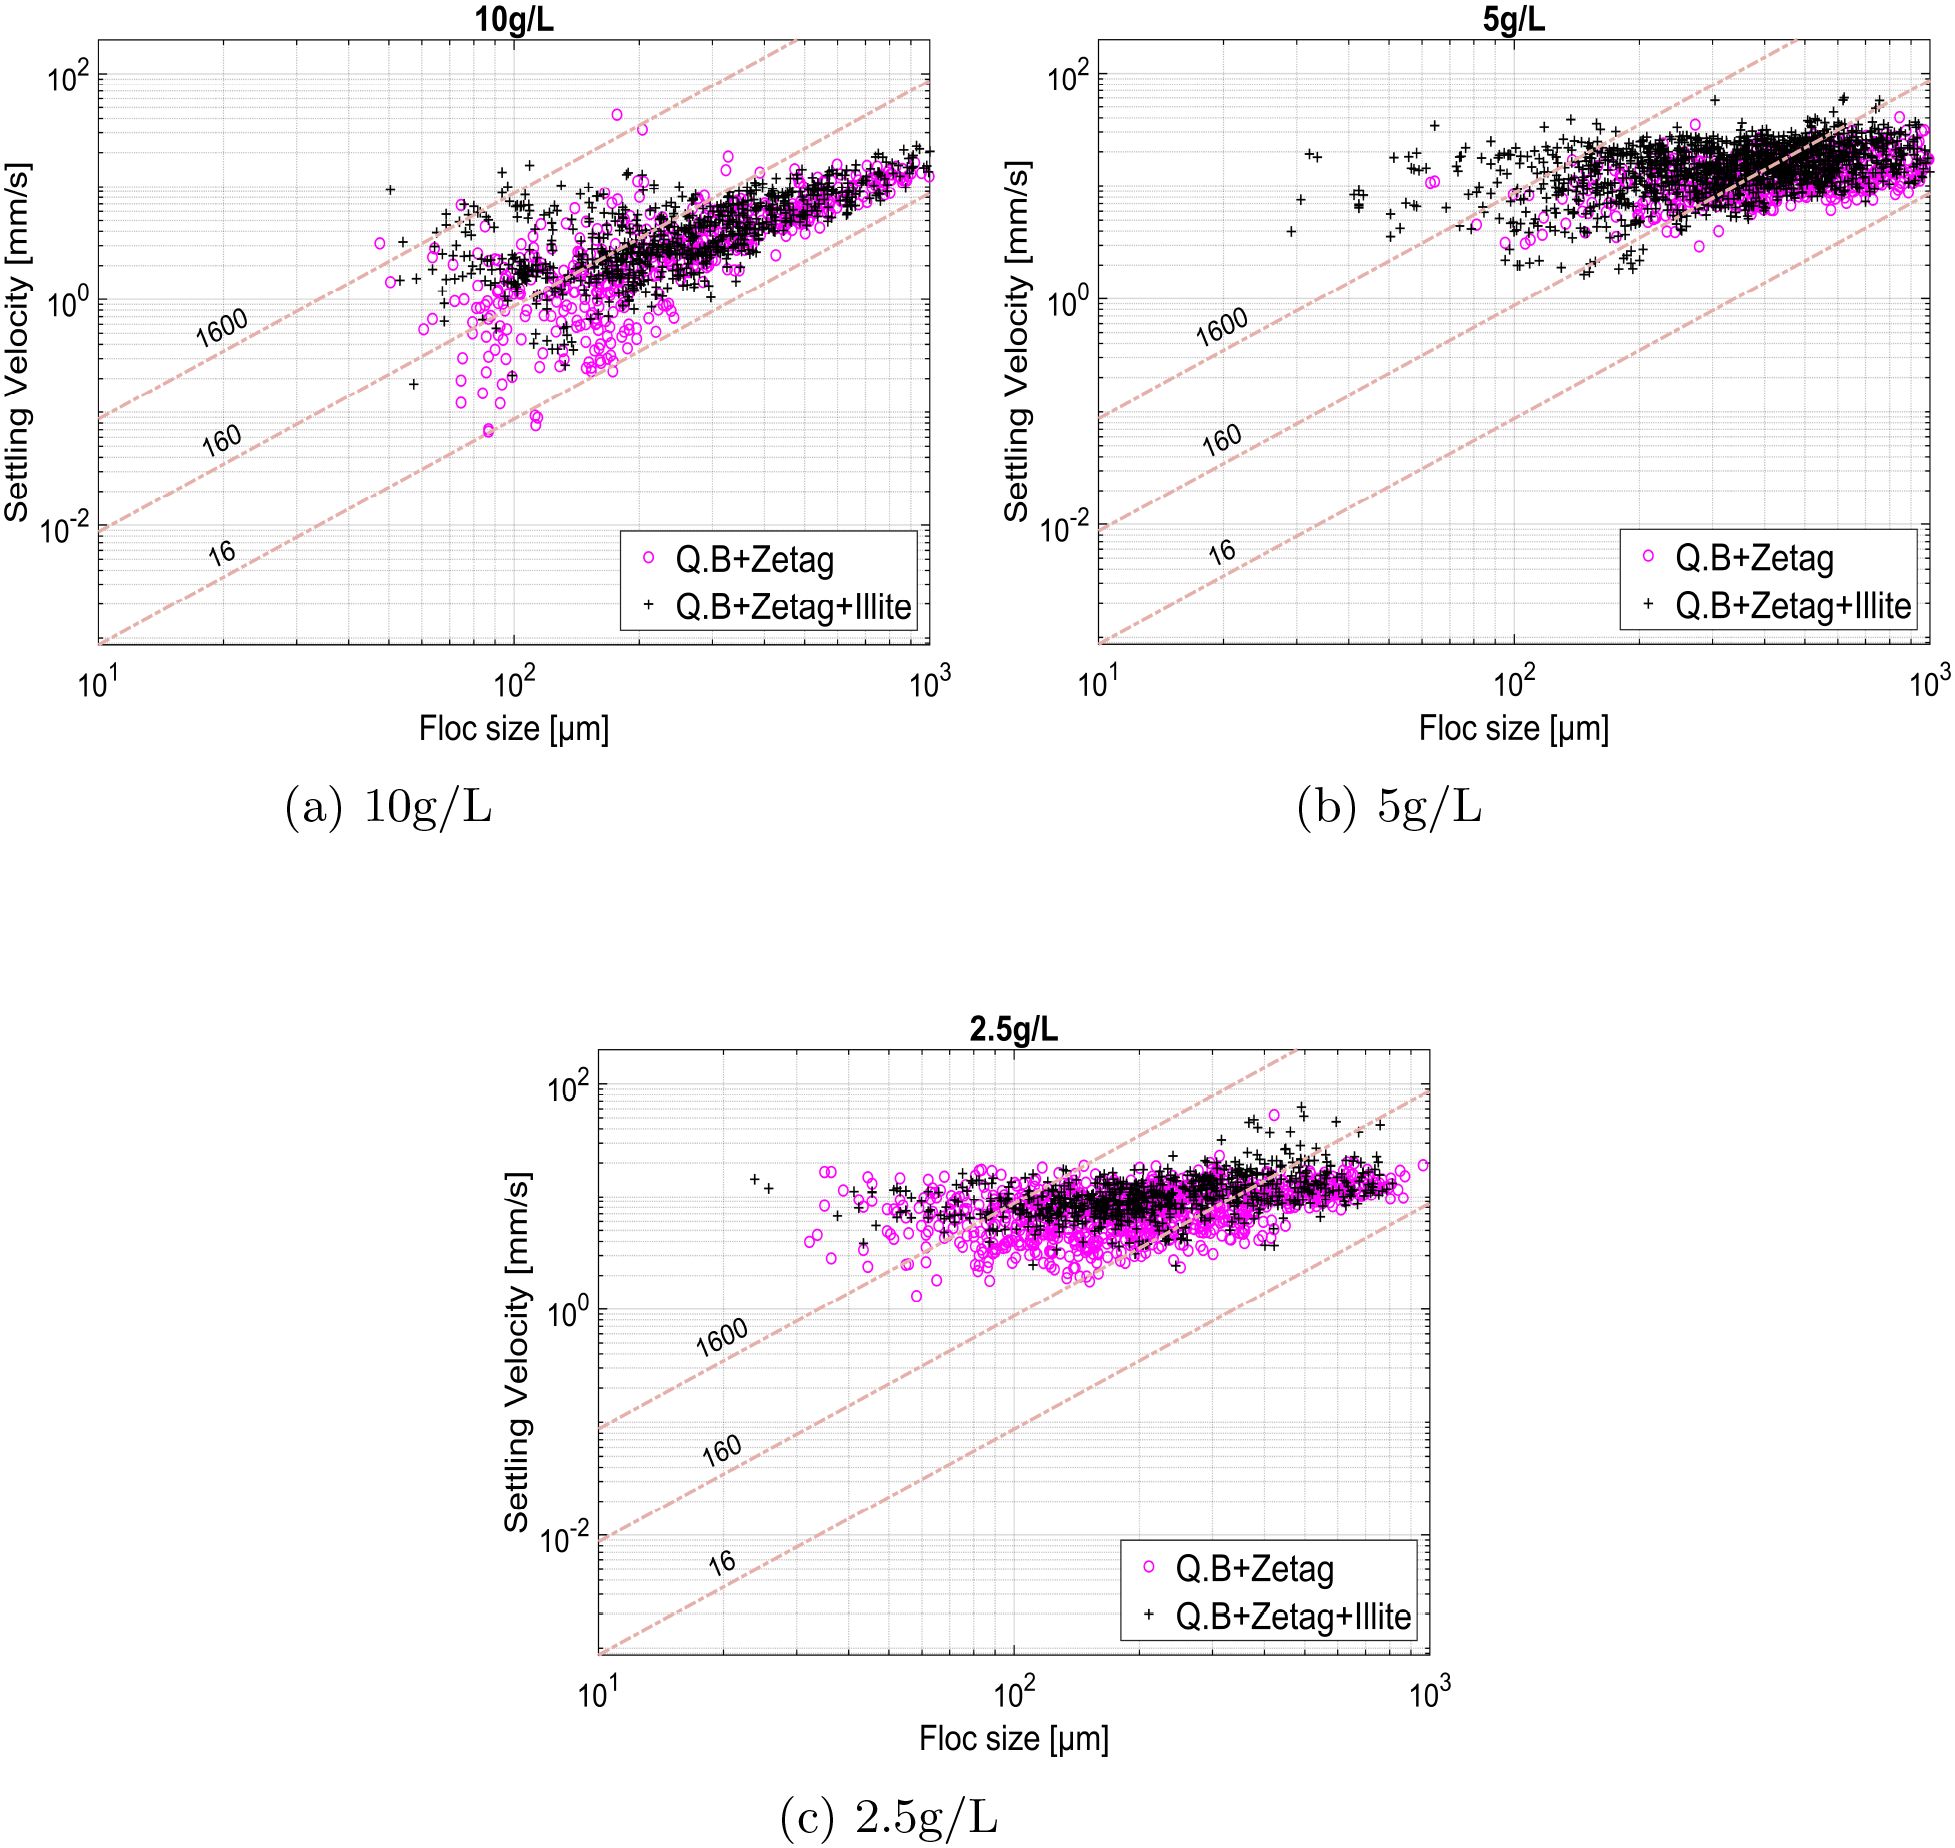
Figure 7. (a–c) Floc size vs Settling velocity of Illite flocs. The isodensity lines are marked by numbers that indicate the respective relative densities (1600, 160, and 16 kg/m3). The relative densities were derived from Stokes’ settling velocity considering three different particle densities (2600, 1160, and 1016 kg/m3), where densities of the formed flocs were calculated from their measured size and settling velocities. These lines serve as reference guides to interpret the density ranges of the formed flocs with respect to their sizes.
3.3.2 Floc size
Figure 8 shows the floc size distributions formed under two different bed conditions: Quartz bed with Zetag and Quartz bed with Zetag combined with illite. The median floc size for Q.B+Zetag was consistently larger than that observed for Q.B+Zetag+Illite. Video recordings further revealed distinct differences in floc morphology. Flocs generated with Q.B+Zetag appeared fluffier, with visible voids and a looser structure, whereas those formed with Q.B+Zetag+Illite were darker and more compact (Supplementary Materials Section 13, Figures 11–13). This difference can be attributed to the amount of material bound during floc formation, where fewer particles were incorporated in Q.B+Zetag case, resulting in looser flocs with voids. Whereas, in the case of Q.B+Zetag+Illite, the presence of illite on the bed provided additional fine materials that enhanced binding, resulting in the formation of compact flocs. The composition of the bed material also influences the differences in floc density. In the Q.B+Zetag case, the absence of illite on top of the quartz bed allowed quartz particles to be incorporated into the flocs. Since quartz has a lower density than illite, this likely contributed to the formation of less dense flocs. In contrast, flocs formed with Q.B+Zetag+Illite were developed exclusively with illite present on the bed surface, with no exposure to the Quartz bed, resulting in higher overall floc density.
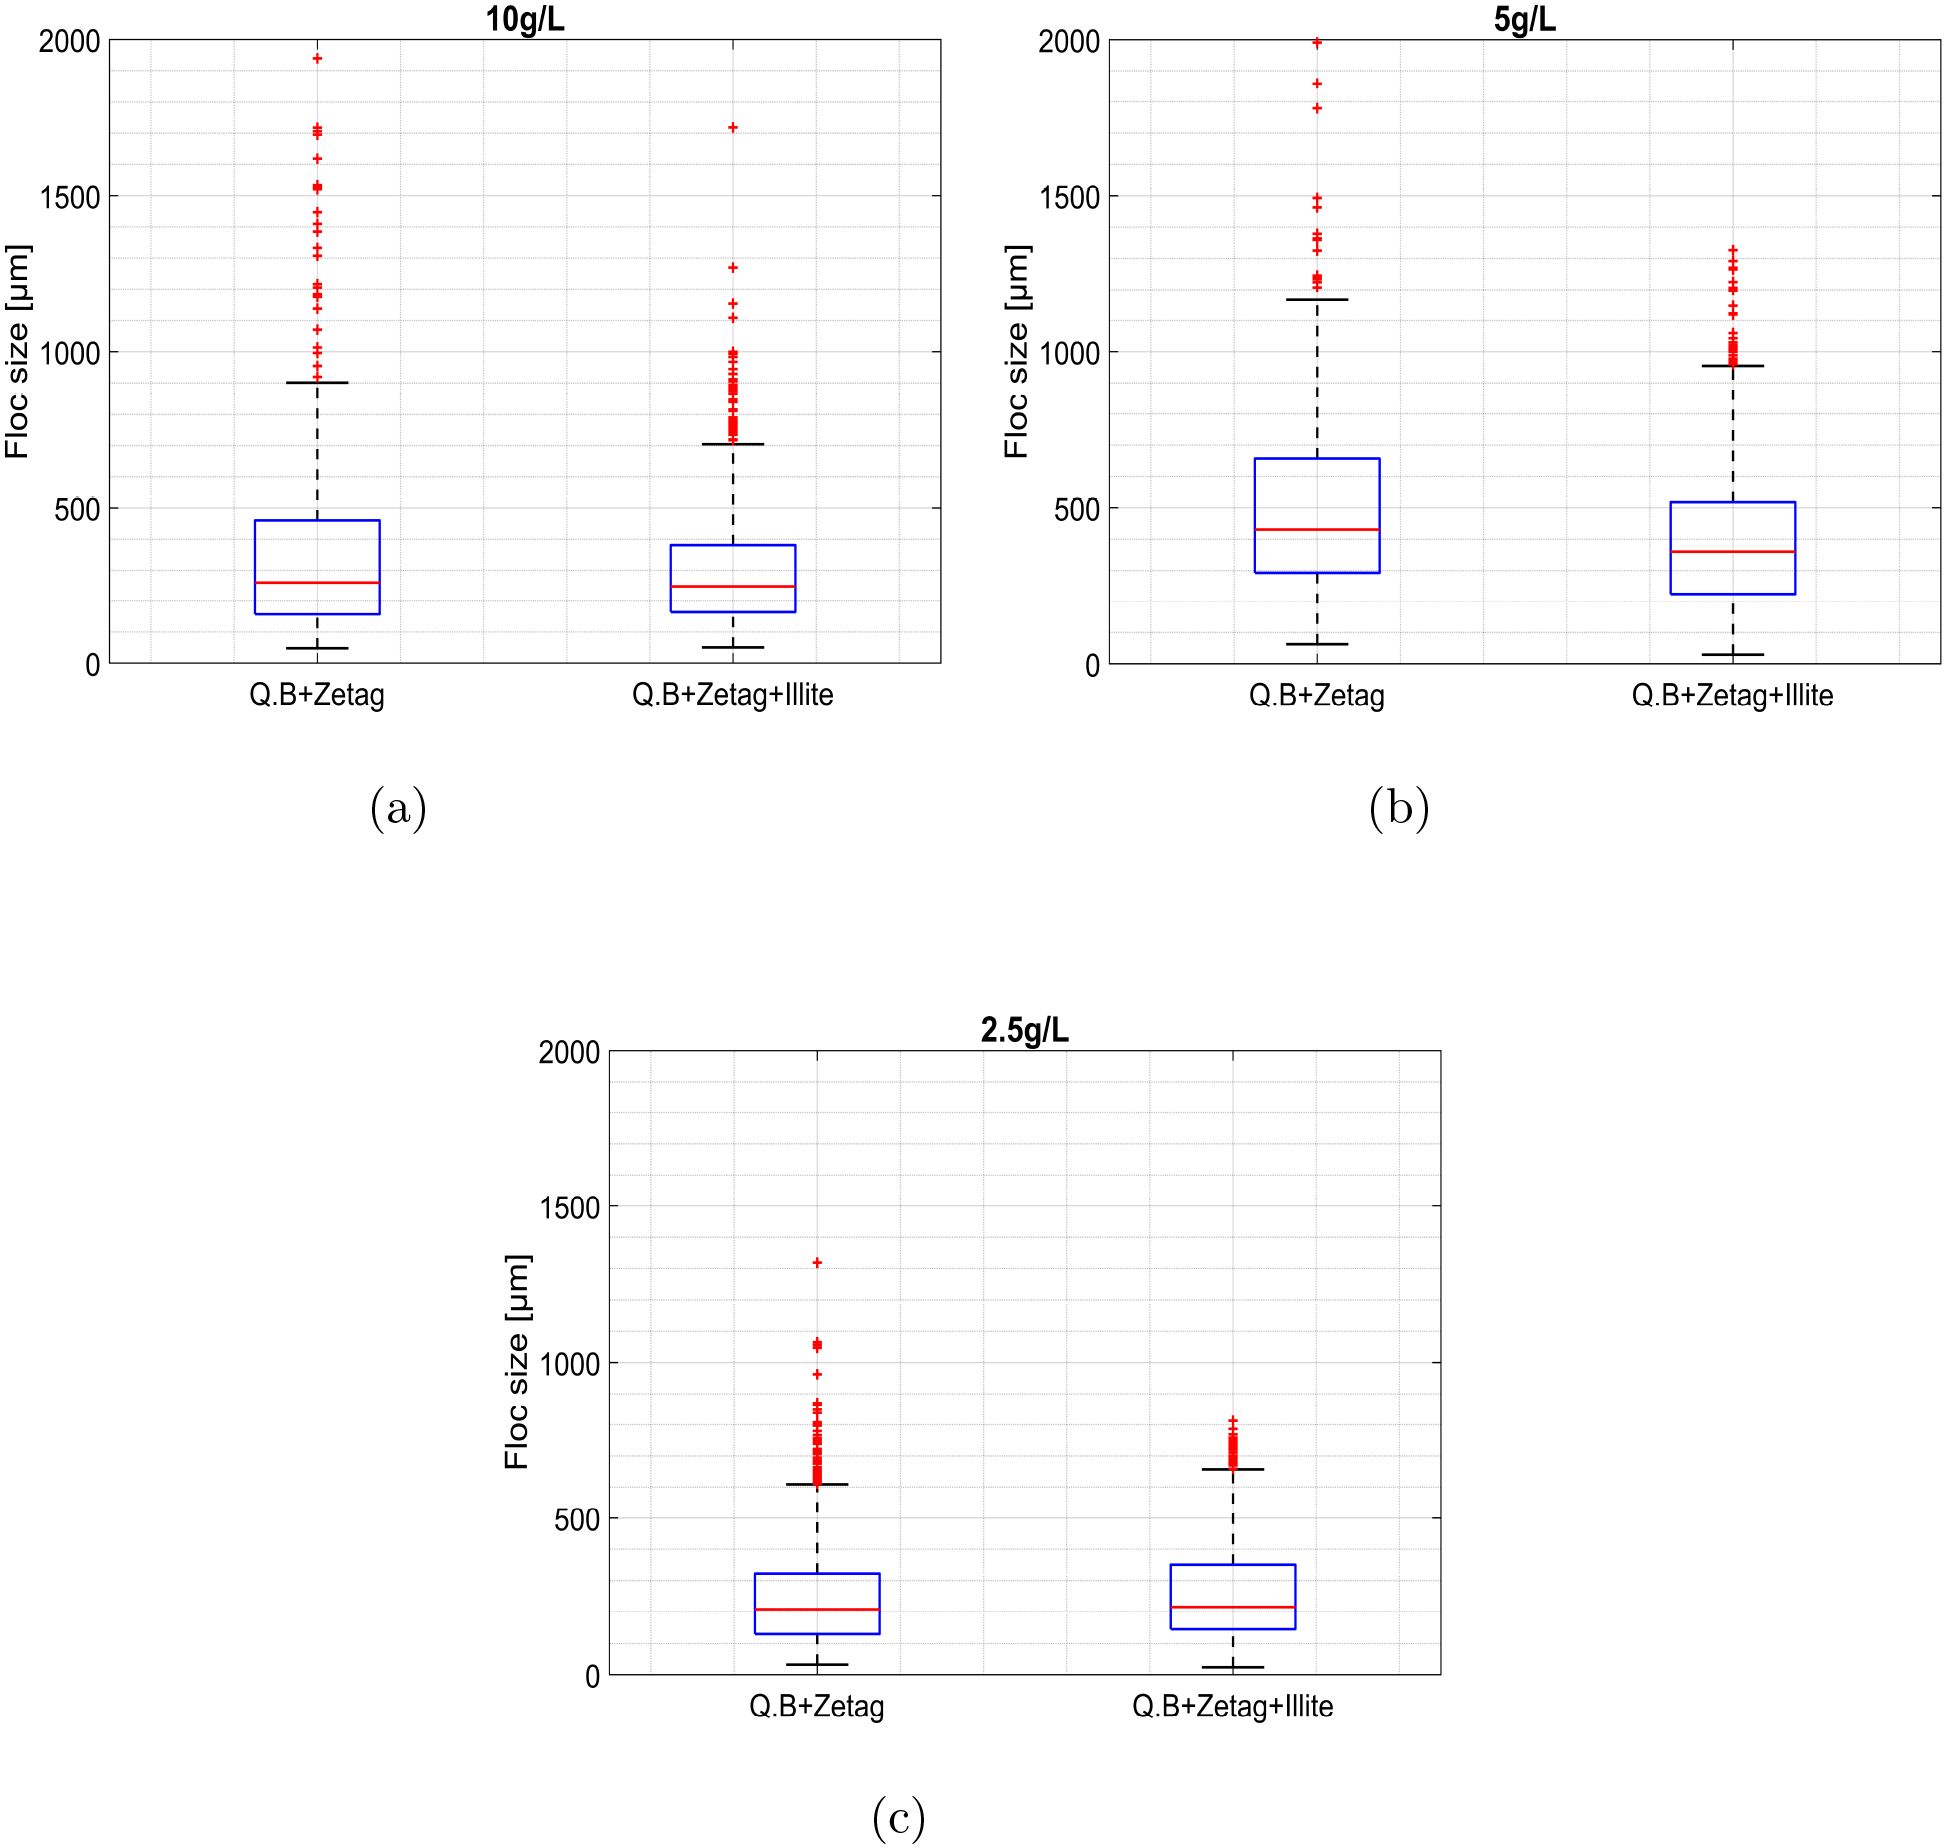
Figure 8. (a–c) Floc size under different bed conditions.
The flocs as seen from FlocCAM video recordings are shown in the Supplementary Materials Section 13, Figures 11–13.
4 Discussion and conclusion
The effect of different types of beds and saltwater compositions on the velocity of propagating turbidity currents in relation to flocculation has been studied in this article.
This study showed that the presence of a bed influences the front velocity of turbidity currents. In the case of a rougher bed surface, the resistance offered is greater, which decelerates the turbidity current, leading to sediment deposition along the way. It can also lead to sediment re-suspension depending on the erosion velocity of the turbidity current. On the other hand, for a smoother or consolidated older bed, the sediment particles are not easily eroded, hence reducing the likelihood of re-suspension. The frictional resistance offered by such a bed is lower, allowing the current to travel longer distances. The bed roughness adds complexity to the flow dynamics (Maggi et al., 2022), influencing the hydrodynamic conditions under which sediment transport and deposition occur.
4.1 Influence of a bed on turbidity current propagation
Figures 4a, c, e show that the front propagation of turbidity currents at concentrations of 5g/L and 10g/L over a plexiglass bed was similar to that over a quartz bed. However, at 2.5g/L, the propagation was similar to that observed in the Q.B+Zetag and Q.B+Zetag+Illite cases. For the 5g/L and 10g/L turbidity currents, the higher sediment concentration provided greater mass and momentum, allowing the flow to propagate faster and remain largely unaffected by the roughness of the quartz bed.
During the propagation of a turbidity current, entrainment of ambient water takes place. This entrainment of water increases the mass of the turbidity current, leading to a reduction in its front velocity, thus conserving momentum. It was observed that when the instantaneous velocity falls below the range of 2.6cm/s, as in the case of 2.5g/L, the turbidity current flow enters a transitional regime (Re=1800), indicating that it is not fully turbulent. Moreover, due to its lower sediment concentration, flocculation was also limited.
In case of 10g/L and 5g/L sediment concentration, the turbidity currents propagating on the plexiglass bed with zetag homogeneously distributed in the water column, have been observed to be the fastest. This was due to the lubrification effect of the polyacrylamide flocculant, where the flume bottom becomes lubricated, enabling the turbidity current to travel faster (Wahab et al., 2024).
4.2 Influence of a bed on flocculation
In Figure 4, it is seen that the presence of a flocculated illite bed significantly reduced the front velocity of the turbidity currents. The quartz bed with zetag case was slower compared to the case that had no zetag. This could be due to the fact that the materials were coming in contact with zetag that was homogeneously distributed in the water column, which led to flocculation on the way. However, the condition involving a flocculated illite layer combined with Zetag in the water column produced the slowest current propagation. This was due to flocs that were already formed from the previous run and were lying on the bed. These flocs with a minimum median size of 250 µm (Figure 8) added considerable resistance to the flow.
According to Köllner et al. (2020), the bottom friction is moderate when the particles are smaller than or roughly equal to the viscous sublayer (thickness=250 µm, whereas median particle size=250-400 µm). However, it increases significantly when the particles are protruding from the viscous sublayer, making it hydraulically rough, resulting in a more rapid deceleration of the flow. In this case, the minimum median floc size is 250 µm, with most of the flocs protruding beyond the viscous sublayer, which has a thickness of 250 µm. As a result, these flocs provide friction to the flow, causing fluctuations to the front velocity (Figures 4b, d, f). In contrast, cases with lower or moderate friction involved illite particles (d50=6.4 µm) that remained fully embedded within the viscous sublayer (250 µm).
4.3 Influence of flocculation on particle velocity inside the turbidity current
UVP data revealed that at concentrations of 10g/L and 5g/L, the turbidity currents over quartz beds and plexiglass beds exhibited higher velocities near the bottom compared to those that were lined with an illite layer. This observation supports the hypothesis that flocculation occurs, accompanied by the pickup and deposition of heavier particles near the bottom (Wahab et al., 2024). Such processes alter the hydrodynamics of the turbidity currents, leading to a reduction in flow velocity.
4.4 Influence of bed on settling velocity
In case of 10g/L, the flocs lie within the isodensity lines, indicating a relative density range of 1600–16 kg/m3. On the contrary, flocs formed at 5g/L and 2.5g/L exhibit higher densities and correspondingly higher median settling velocities. Across all experiments, the zetag-to-clay ratio was kept constant. Therefore, at higher clay concentrations, distance between clay particles is reduced, promoting faster aggregation with illite, as the flocculation rate is approximately linearly proportional to concentration (Ali and Chassagne, 2022). The settling velocities were higher in the case of Q.B+Zetag+Illite compared to Q.B+Zetag, even though their sizes were smaller when compared to Q.B+Zetag flocs. This implies that the flocs were reconforming or folding rather than breaking. Floc breakup is a mechanism that typically occurs in turbulent conditions. In the lock-exchange environment, the relatively low shear rates combined with the short propagation time (60–120 s) of the turbidity current are not expected to cause significant floc disintegration. FlocCAM video recordings further confirmed the presence of stable flocs with no signs of fragmentation. If floc breakup had occurred, the settling velocities would have been lesser compared to cases where there was floc reconformation or folding.
4.5 Influence of bed on floc size
It was observed that flocs formed on quartz beds that had an illite layer (Q.B+Zetag+Illite) on top with zetag in the water column were smaller in size than the ones that had no illite (Q.B+Zetag). The newly formed flocs aggregated either with flocculated illite present on the bed or with new illite inside the turbidity current. The median floc size in these cases ranged from 250-400 µm. Given that the d50 of illite is 6.4 µm and that of quartz is 23 µm, flocs formed directly on the quartz beds were generally larger than those formed on illite- topped quartz beds. Thus, across all concentrations, the floc size was consistently larger in the Q.B+Zetag cases compared to the Q.B+Zetag+illite cases. The floc images are shown in Supplementary Materials Section 13, Figures 11–13 where larger flocs were formed in Q.B+Zetag case. The bed has a critical role to play in turbidity current propagation. It has also been proven to influence flocculation. The roughness of the bed imparted due to materials lying on top significantly influences the flow dynamics of the turbidity current. These findings are particularly interesting from a dredging perspective. Additionally, the concentration of clay plays a significant role in floc formation and bed pickup. The sediment properties change during a turbidity current propagation, and for precise modelling, such information is crucial.
Data availability statement
The original contributions presented in the study are included in the article/Supplementary Material. Further inquiries can be directed to the corresponding author.
Author contributions
SW: Visualization, Software, Writing – original draft, Formal Analysis, Methodology, Conceptualization, Investigation, Writing – review & editing. CC: Funding acquisition, Writing – review & editing, Conceptualization, Methodology, Visualization, Investigation, Supervision. RH: Methodology, Investigation, Visualization, Funding acquisition, Supervision, Writing – review & editing, Conceptualization.
Funding
The author(s) declare financial support was received for the research and/or publication of this article. This research was conducted as a part of the PlumeFloc project and has received funding from NWO (NWO: TWM.BL.019.004).
Acknowledgments
We sincerely thank Deltares for letting us use their facilities. This work has been performed under the framework of PlumeFloc (TMW.BL.019.004, Topsector Water and Maritiem: Blauwe route) within the MUDNET academic network (https://www.tudelft.nl/mudnet/).
Conflict of interest
The authors declare that the research was conducted in the absence of any commercial or financial relationships that could be construed as a potential conflict of interest.
Generative AI statement
The author(s) declare that no Generative AI was used in the creation of this manuscript.
Any alternative text (alt text) provided alongside figures in this article has been generated by Frontiers with the support of artificial intelligence and reasonable efforts have been made to ensure accuracy, including review by the authors wherever possible. If you identify any issues, please contact us.
Publisher’s note
All claims expressed in this article are solely those of the authors and do not necessarily represent those of their affiliated organizations, or those of the publisher, the editors and the reviewers. Any product that may be evaluated in this article, or claim that may be made by its manufacturer, is not guaranteed or endorsed by the publisher.
Supplementary material
The Supplementary Material for this article can be found online at: https://www.frontiersin.org/articles/10.3389/fmars.2025.1656243/full#supplementary-material
References
Ali W. and Chassagne C. (2022). Comparison between two analytical models to study the flocculation of mineral clay by polyelectrolytes. Continental Shelf Res. 250, 104864. doi: 10.1016/j.csr.2022.104864
Ali W., Enthoven D., and Alex Kirichek C. (2022). Chassagne, and R Helmons. Effect of flocculation on turbidity currents. Front. Earth Sci. 10, 1014170. doi: 10.3389/feart.2022.1014170
Ali W., Kirichek A., and Chassagne C. (2024). Flocculation of deep-sea clay from the clarion clipperton fracture zone. Appl. Ocean Res. 150, 104099. doi: 10.1016/j.apor.2024.104099
de Wit L., Mosca C. A., Buschman F. A., Jaksic L., van der Deijl E., and van der Biezen T. (2025). Accurate determination of far-field source terms of barge overflow dredge plumes based on near-field monitoring and modeling. J. Waterway Port Coastal Ocean Eng. 151, 04024026. doi: 10.1061/JWPED5.WWENG-2134
Erftemeijer P. L. A., Riegl B., Hoeksema B. W., and Todd P. A. (2012). Environmental impacts of dredging and other sediment disturbances on corals: A review. Mar. pollut. Bull. 64, 1737–1765. doi: 10.1016/j.marpolbul.2012.05.008
Helmons R., de Wit L., de Stigter H., and Spearman J. (2022). Dispersion of benthic plumes in deep-sea mining: What lessons can be learned from dredging? Front. Earth Sci., 796. doi: 10.3389/feart.2022.868701
Hu P. and Cao Z. (2009). Fully coupled mathematical modeling of turbidity currents over erodible bed. Adv. Water Resour. 32, 1–15. doi: 10.1016/j.advwatres.2008.07.018
International Seabed Authority (2010). A geological model of polymetallic nodule deposits in the Clarion-Clipperton Fracture Zone (International Seabed Authority). Number 6.
Köllner T., Meredith A., Nokes R., and Meiburg E. (2020). Gravity currents over fixed beds of monodisperse spheres. J. Fluid Mechanics 901, A32.
Laboyrie P., Van Koningsveld M., Aarninkhof S., Van Parys M., Lee M., Jensen A., et al. (2018). Dredging for sustainable infras- tructure (The Netherlands: CEDA/IADC The Hague).
Lunt J. and Smee D. L. (2020). Turbidity alters estuarine biodiversity and species composition. ICES J. Mar. Sci. 77, 379–387. doi: 10.1093/icesjms/fsz214
Maggi M. R., Adduce C., and Negretti M. E. (2022). Lock-release grav- ity currents propagating over roughness elements. Environ. Fluid Mechanics 22, 383–402. doi: 10.1007/s10652-022-09845-6
Manning A. J., Friend P. L., Prowse N., and Amos C. L. (2007). Estuarine mud flocculation proper- ties determined using an annular mini-flume and the labsfloc system. Continental Shelf Res. 27, 1080–1095. doi: 10.1016/j.csr.2006.04.011
Met-Flow S. A. (2002). Uvp monitor model uvp-duo with software version 3 uvp-duo monitor user’s guide. Available online at: https://www.met-flow.com/ (Accessed January 8, 2022).
Nogueira H. I. S., Adduce C., Alves E., and Franca M´arioJ. (2013). Analysis of lock- exchange gravity currents over smooth and rough beds. J. hydraulic Res. 51, 417–431. doi: 10.1080/00221686.2013.798363
Parker G., Garcia M., Fukushima Y., and Yu W. (1987). Experiments on turbidity currents over an erodible bed. J. Hydraulic Res. 25, 123–147. doi: 10.1080/00221688709499292
Parsons J. D., Friedrichs C. T., Traykovski P. A., Mohrig D., Imran J., Syvitski J. P. M., et al. (2007). The mechanics of marine sediment gravity flows. Continental margin sedimentation: sediment transport to sequence stratigraphy, 275–337.
Riza M., Ehsan M. N., Pervez Md N., Khyum M. M.-. m. O., Cai Y., and Naddeo V. (2023). Control of eutrophication in aquatic ecosystems by sustainable dredging: Effectiveness, environmental impacts, and implications. Case Stud. Chem. Environ. Eng. 7, 100297. doi: 10.1016/j.cscee.2023.100297
Ryan MacIver M. (2019). Safas: Sedimentation and floc analysis software. Available online at: https://github.com/rmaciver/safas (Accessed January 9, 2022).
Shakeel A., MacIver M. R., van Kan P. J. M., Kirichek A., and Chassagne C. (2021). A rheological and microstructural study of two-step yielding in mud samples from a port area. Colloids Surfaces A: Physicochemical Eng. Aspects 624, 126827.
Victor O., Ikenna O. C., and Ndubuisi I. G. (2018). Environmental effect of dredging and geochemical fractionation of heavy metals in sediments removed from river. Modern Chem. 6.
Wahab S. A., Ali W., Chassagne C., and Helmons R. (2024). Role of organic matter present in the water column on turbidity flows. J. Mar. Sci. Eng. 12, 1884. doi: 10.3390/jmse12101884
Wahab S. A., Chassagne C., and Helmons R. (2025). Effect of flocculation on the propagation of a turbidity current in the presence of a bed. doi: 10.2139/ssrn.5338378
Keywords: flocculation, lock-exchange, turbidity currents, bed composition, front velocity
Citation: Wahab SA, Chassagne C and Helmons RLJ (2025) Effects of bed composition on turbidity flow dynamics in relation to flocculation. Front. Mar. Sci. 12:1656243. doi: 10.3389/fmars.2025.1656243
Received: 29 June 2025; Accepted: 13 October 2025;
Published: 27 October 2025.
Edited by:
Luigi Jovane, University of São Paulo, BrazilReviewed by:
Guangnian Xiao, Shanghai Maritime University, ChinaXu Changyan, Shanghai Maritime University, China
Copyright © 2025 Wahab, Chassagne and Helmons. This is an open-access article distributed under the terms of the Creative Commons Attribution License (CC BY). The use, distribution or reproduction in other forums is permitted, provided the original author(s) and the copyright owner(s) are credited and that the original publication in this journal is cited, in accordance with accepted academic practice. No use, distribution or reproduction is permitted which does not comply with these terms.
*Correspondence: Shaheen Akhtar Wahab, cy5hLndhaGFiLTFAdHVkZWxmdC5ubA==