 Yanna Gao1
 Zhuonan Huang
 Shaohua Wang
- 1Guangzhou Power Supply Bureau, Guangdong Power Grid Co. Ltd., Guangzhou, China
- 2School of Information Engineering, China University of Geosciences (Beijing), Beijing, China
- 3State Key Laboratory of Remote Sensing and Digital Earth, Aerospace Information Research Institute, Chinese Academy of Sciences, Beijing, China
- 4University of Chinese Academy of Sciences, Beijing, China
Introduction: Wind energy development faces challenges such as low utilization of wind resources, underdevelopment of suitable areas, and imbalanced electricity demand coverage. To address these issues, this study formulates a multi-objective maximal covering location problem (MO-MCLP) for onshore wind power station (OWPS) siting, aiming to improve resource utilization, expand development in promising regions, and balance demand coverage in spatial planning.
Methods: A MO-MCLP model is developed that simultaneously maximizes wind energy utilization, promotes development in suitable areas, and balances electricity demand coverage. To solve this model at large scale, a deep reinforcement learning (DRL) algorithm is designed and implemented. The DRL approach is benchmarked against a traditional optimization implementation using the Gurobi solver. Computational experiments focus on wind-rich coastal regions of Guangdong Province, evaluating both solution quality (coverage and utilization metrics) and computational efficiency under varying problem sizes.
Results: The DRL algorithm achieves objective values comparable to or better than those from the Gurobi-based method, while substantially reducing computation time for large problem instances. As the number of candidate sites and demand points increases, DRL demonstrates superior scalability. In the Guangdong case study, DRL attains similar or improved coverage and utilization within a fraction of the runtime required by Gurobi, enabling faster iteration for scenario analysis.
Discussion: The findings indicate that DRL offers an efficient alternative to traditional solvers for complex spatial optimization in wind farm siting. Faster computation and better scalability facilitate exploration of multiple planning scenarios, sensitivity analyses, and rapid decision support under practical time constraints. Integrating richer environmental and socioeconomic data, extending to multi-stage planning, or combining DRL with heuristic solvers may further enhance performance. Overall, the MO-MCLP model with DRL solution provides actionable insights for sustainable energy infrastructure planning by delivering high-quality site allocations efficiently.
1 Introduction
Wind energy, as a clean and renewable source of power, has received considerable attention and application in recent years, particularly in the context of addressing climate change and achieving sustainable development (Midilli et al., 2006). The effective development of wind power can significantly reduce greenhouse gas emissions, promote a green economy, and enhance energy security. Furthermore, it has the capacity to reduce reliance on fossil fuels and contribute to the global transition of the energy system (Xu et al., 2010; Su et al., 2024). As a result, wind energy plays an increasingly important role in achieving Sustainable Development Goals (SDGs) and has become a key component of global energy policies and environmental strategies.
In the field of wind energy development, the rational site selection and configuration of wind power infrastructure are crucial steps in achieving the efficient utilization of renewable energy (Pourasl et al., 2023; Villanueva and Feijóo, 2010). Due to the geographical complexity and diverse constraints of wind power projects, wind power planning must consider multiple objectives, including economic viability, environmental impact, and resource utilization efficiency (Yousef et al., 2024; Ricks et al., 2024). Therefore, the scientific site selection problem for wind farms focuses on how to maximize power generation while ensuring cost-effectiveness and effectively addressing the multiple constraints involved (Beiter et al., 2023).
Current research on the location of wind farm has demonstrated a trend towards greater diversity and refinement, with a particular focus on wind resource assessment methods, multi-factor comprehensive analysis, and the innovative application of location models (Cencen et al., 2024; Xia and Song, 2009). Wu et al. (2021) proposed a method combining the entropy weight method with subjective weights to address the multiple factors involved in wind farm location. This involved constructing an evaluation system based on fuzzy reasoning, with the aim of providing a feasible solution for location decisions (Rediske et al., 2021). However, this method relies heavily on the subjective judgement of experts, which may lack objectivity and stability in handling complex and uncertain factors. This may affect the generalizability of the model and the scientific validity of the siting solutions (Wang et al., 2024b; Nielson et al., 2020). Zhou et al. (2023) constructed a multi-factor comprehensive evaluation model by integrating wind speed data, terrain features, and road factors, and employed ArcGIS to perform spatial analysis on the suitability of wind farm development. This method provides a theoretical basis for wind farm siting by considering the spatial distribution of wind resources as well as terrain and infrastructure constraints. However, this GIS-based comprehensive evaluation has significant limitations in data acquisition, especially the scarcity of high-precision data on wind speed and terrain. Additionally, the analysis process is often complex, requiring substantial computational resources and data preparation, which limits its practicality in large-scale regional applications. Li distinguished between macro and micro phases in the context of wind power location (Li, 2018). They discussed preliminary wind resource evaluation and detailed wind turbine layout design as separate topics. Macro location primarily determines the overall location of the wind farm, whereas micro location is concerned with optimizing the specific layout of wind turbines in order to maximize power generation and efficiently utilize resources (Zhang et al., 2011; Bayer et al., 2013). While this approach facilitates stepwise optimization from the overall to the specific level, in practice, it is challenging to ensure coordination between macro and micro location, particularly in the presence of various complex environmental constraints. The two-stage approach tends to result in limitations in their respective optimizations, thereby lacking overall optimality (Chen, 2011).
The emerging field of geospatial optimization represents a novel approach that integrates geographic and mathematical optimization techniques to achieve optimal spatial allocation of facilities (Costa et al., 2021; Yu et al., 2025). The application of mathematical modelling techniques to the description of factors such as wind farm location, capacity configuration, and environmental impact enables the identification of an optimal solution (Li et al., 2023). These optimization methods typically encompass linear programming, heuristic algorithms and metaheuristic algorithms. Linear programming is an effective method for identifying optimal solutions when the constraints and conditions are simple and deterministic (Aneja et al., 2024). Heuristic and metaheuristic algorithms employ heuristics and random searches to locate near-optimal solutions in a shorter time, making them particularly well-suited for nonlinear and complex environments. However, these traditional methods often encounter limitations when confronted with intricate multi-objective and multi-constraint geospatial optimization challenges in wind farm siting (Zhao et al., 2017; Karayel and Dincer, 2024). Deep reinforcement learning (DRL) is a data-driven intelligent optimization method that is capable of adapting dynamically to complex constraints and continuously optimizing decisions through interaction with the environment and self-learning (Chu et al., 2024). DRL does not necessitate the simplification of the problem; rather, through the robust representation capabilities of deep neural networks, it is able to capture the non-linear features of complex geographic environments in wind farm location and perform effective adaptive optimization in a dynamically changing environment (Shakoor et al., 2016). Furthermore, DRL is capable of learning the optimal strategy through repeated trial and error, which makes it particularly advantageous in handling multi-objective optimization and complex constraint problems (Rediske et al., 2021).
Therefore, this study models the wind farm location problem as a mathematical optimization problem and explores the use of DRL algorithms to solve this problem, applying it to the onshore wind power siting layout in Guangdong Province to provide decision support for current wind farm construction and wind energy utilization in the province.
The main contributions of this study are as follows:
• Proposing a multi-objective optimization model that comprehensively considers wind energy resource utilization efficiency and demand coverage.
•Designing an innovation DRL method for model optimization.
•Applying the proposed framework to optimize the siting layout of onshore wind power in Guangdong Province.
The remainder of this study is organized as follows: Section 2 reviews the related works on the location models for wind power stations and deep learning methods for location optimization. Section 3 describes the proposed multi-objective optimization model and methods used. Section 4 presents the experimental setup and results, along with a comparative analysis. Section 5 discusses the research findings and their implications. The last section summarizes the main findings of this study and proposes future research directions.
2 Related works
2.1 Multi-objective location optimization problems for wind power stations
The optimization of wind power station siting necessitates balancing competing objectives such as energy yield maximization, cost minimization, and environmental compatibility, driving the adoption of multi-objective optimization (MOO) frameworks. Early studies predominantly employed single-objective models, with linear programming and heuristic algorithms addressing factors like infrastructure proximity and terrain constraints (Mosetti et al., 1994; Cortez and Dorrego, 2020). For instance, meta-heuristic algorithms incorporating improved charged particle optimization were developed to integrate topographic effects into layout designs (Hidayat et al., 2024; Asaah et al., 2021; Díaz et al., 2022), while the Jensen model and its variants addressed wake losses in onshore and offshore farms (Shakoor et al., 2016; Feng and Shen, 2014; Feng et al., 2018). However, the inherent complexity of wind farm planning—requiring simultaneous consideration of resource availability, land-use conflicts, and economic viability—has shifted research toward MOO methods capable of generating Pareto-optimal solutions.
A cornerstone in MOO is the Non-dominated Sorting Genetic Algorithm II (NSGA-II), renowned for its efficiency in handling non-convex objectives. Mytilinou and Kolios (2017) demonstrated NSGA-II’s superiority over SPEA2 and NSGA-III in optimizing offshore wind layouts by simultaneously minimizing lifecycle costs and maximizing energy output. Recent adaptations integrate spatial constraints, such as turbine wake effects and cable routing, enhancing its applicability to real-world scenarios (Manikowski et al., 2021). Alternative approaches, including Multi-Objective Random Search (MORS), leverage stochastic adjustments to refine turbine placement iteratively. Feng and Shen (2016) reported that MORS outperformed NSGA-II in high-dimensional problems, reducing cable lengths by 15% while maintaining power output in offshore farms. Bayesian optimization methods further address uncertainties in wind resource modeling; Chugh and Ymeraj (2022) utilized Gaussian processes with Expected Hypervolume Improvement to achieve a 4.6% power increase and 84% fatigue load reduction, highlighting MOO’s potential in stochastic environments.
Classical facility location models, such as p-Median and p-Center, have been adapted to optimize energy transmission efficiency and grid connectivity (Berman and Krass, 2002). These models minimize total or maximum distances between turbines and demand nodes, aligning with Hakimi’s foundational work (Hakimi, 1964; Hakimi, 1965). The Maximum Covering Location Problem (MCLP) and Location Set Covering Problem (LSCP) further address spatial coverage, with studies integrating GIS to prioritize high-wind zones while avoiding ecologically sensitive areas (Pamučar et al., 2017; Church and ReVelle, 1974; ReVelle et al., 2008; ReVelle and Swain, 1970; Pirkul and Schilling, 1989). For example, Chen et al. (2021) combined LSCP with NSGA-II to reduce infrastructure redundancy by 20% in offshore farms, illustrating the synergy between operations research and MOO.
Emerging hybrid frameworks merge evolutionary algorithms with probabilistic methods to address scalability and uncertainty. Kirchner-Bossi and Porte-Agel (2021) coupled NSGA-II with Monte Carlo simulations to optimize both turbine layouts and farm shapes, achieving a 12% energy yield increase in Denmark’s Horns Rev I farm. However, challenges persist in scaling these methods for large-scale farms (>100 turbines) and standardizing objective weighting schemes across diverse geographical contexts (Emami and Noghreh, 2010; Gao et al., 2016). Future research should prioritize hybrid algorithms and open-source tools to enhance reproducibility, alongside probabilistic lifecycle cost models to quantify long-term uncertainties (Kaynia et al., 2025).
2.2 Deep learning methods for multi-objective location problems
The integration of deep learning (DL) into multi-objective optimization (MOO) has introduced transformative capabilities for balancing competing objectives in spatial allocation problems, overcoming limitations of traditional rule-based and heuristic approaches. While classical MOO algorithms (e.g., NSGA-II) excel in deterministic scenarios, DL excels in extracting latent patterns from high-dimensional data and addressing stochastic or dynamic environments, making it indispensable for complex location problems (Mecheter et al., 2022; Hou et al., 2016; Hou et al., 2017).
Early attempts, such as Hopfield networks for the p-Median problem, were constrained by scalability and retraining requirements (Domínguez and Muñoz, 2008). Recent advances leverage graph neural networks (GNNs) to encode spatial dependencies and demand-facility interactions. For instance, Liang et al. (2024b) fused graph convolutional networks (GCNs) with facility location models, achieving a 40% reduction in computational time for the p-Center problem compared to exact solvers, while generalizing across problem scales without retraining. Similarly, Zhang et al. (2023) proposed a multi-task GNN framework that simultaneously optimizes coverage, cost, and equity in healthcare facility placement, demonstrating superior Pareto front diversity over genetic algorithms.
Deep reinforcement learning (DRL) has emerged as a dominant paradigm for sequential decision-making in MOO. Unlike supervised learning, DRL agents learn policies through environment interactions, enabling adaptive solutions under uncertainty. Wang et al. (2023a) designed a DRL model with a transformer-based policy network to solve the uncapacitated p-Median problem, reducing solution gaps by 12% compared to heuristic baselines. Extending this, Zhong et al. (2024) developed ReCovNet, which integrates attention mechanisms with reward shaping to balance coverage and budget constraints in billboard placement, achieving 98% coverage efficiency with 30% fewer resources. However, challenges persist in reward design for conflicting objectives; Chen L et al. (2023), Chen X et al. (2023) addressed this by introducing a dynamic weight adjustment module, enabling automatic trade-off calibration between cost and service accessibility in real-time logistics optimization.
Hybrid DL-MOO frameworks further bridge the gap between data-driven learning and classical optimization. The Sponet framework (Liang et al., 2024a; Liang et al., 2022; Wang et al., 2023b) combines DRL with metaheuristics, using a deep Q-network to guide simulated annealing for solving p-Median, p-Center, and MCLP problems. This approach reduced optimality gaps by 18% in large-scale urban facility allocation compared to pure DRL methods. Despite progress, critical limitations remain: most DL-MOO methods rely on synthetic training data, raising concerns about real-world robustness (Shadman Abid et al., 2025). Additionally, the “black-box” nature of DL models complicates interpretability, hindering adoption in policy-sensitive domains like environmental planning.
3 Materials and methods
3.1 Study area
Guangdong Province, located in southern coastal area of China (20°13′–25°31′N, 109°40′–117°18′E), experiences a climate characterized by the mid-subtropical, southern subtropical, and tropical zones, boasting abundant wind energy resources (Figure 1). The region is subject to the influence of a monsoon climate, which provides conditions conducive to the location and construction of wind farms. Concurrently, the Pearl River Delta represents one of the most economically developed areas in China, exhibiting a high demand for electricity and a well-established infrastructure that facilitates the efficient utilization of wind energy resources. Furthermore, the coastal region of Guangdong is characterized by a diverse and complex terrain, comprising plains, hills, and mountains, which gives rise to considerable spatial variations in wind speed and geographical conditions. The diversity of the region provides a representative and rich setting for conducting optimization research on wind farm location. Consequently, this study selects the coastal area of Guangdong Province as the research area, with the objective of exploring how to scientifically conduct wind farm location and optimization of allocation in the context of an economically developed, geographically complex, and wind resource-rich environment. Ultimately, the aim is to provide decision support for regional energy transition and sustainable development.
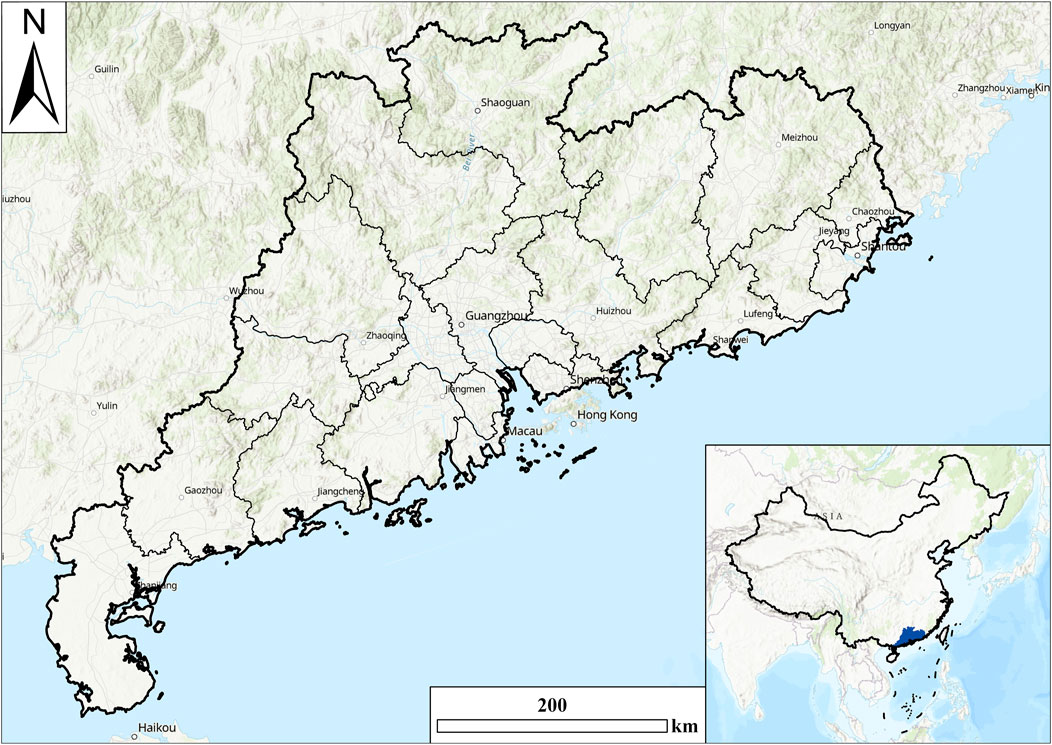
Figure 1. Location of study area.
3.2 Data acquisition and preprocessing
This study uses a dataset of OWPS in Guangdong Province for the year 2021, consisting of POI data with a total of 79 onshore wind power stations. The data, sourced from the National Energy Administration of China, includes attributes such as name, latitude and longitude coordinates, and installed capacity, and will serve as facility point inputs for the optimization of onshore wind power station site selection. For the demand calculation in site optimization, this study selects three types of data as sources for multi-dimensional demand calculation: GDP, population density, and nighttime light data. The GDP data comes from the Resources and Environmental Science Data Platform of the Institute of Geographic Sciences and Natural Resources Research, Chinese Academy of Sciences. It is raster data with a spatial resolution of 1 km × 1 km, collected in 2020. Population density data is sourced from the WorldPop website, from which we obtained the 2020 population density dataset of China and extracted data based on the study area, with a spatial resolution of 100 m × 100 m. Nighttime light data is used to reflect the region’s socioeconomic development level and human activity intensity, which has been verified in multiple studies as being related to electricity demand. The nighttime light data was obtained from the NPP-VIIRS cloud-free DNB monthly composite product, and we extracted and summed the NPP-VIIRS nighttime light data for January to December 2021 to obtain the annual nighttime light intensity. Regarding natural environment constraints, this study uses indicators such as annual average wind speed, DEM, NDVI, and temperature for demand calculation. Annual average wind speed and temperature are important factors affecting wind energy reserves and onshore wind power station site selection. We obtained meteorological station data for the study area in 2021 from the National Meteorological Information Center of China and used the Kriging interpolation method based on the annual average wind speed and temperature attributes of these stations to generate continuous grid data for wind speed and temperature across the study area. DEM and NDVI, which influence wind power station site selection from the perspectives of topography and vegetation cover, were obtained from the ASTER GDEM V2 and MODIS MOD13Q1 data products, with spatial resolutions of 30 m and 250 m, respectively. Detailed information about the data sources is shown in Table 1.
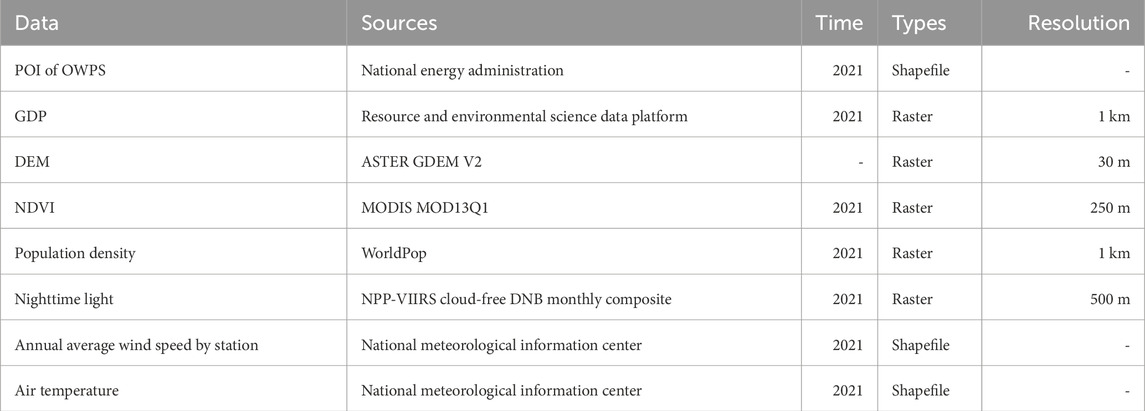
Table 1. The overview of the datasets.
3.3 Methods
In this study, the research area was subdivided into grid cells of 7000 m × 7000 m. The centroid of each grid cell was then utilized as the point of calculation for suitability. Indicators from both environmental and socioeconomic viewpoints were selected to assess the suitability of OWPS locations. These indicators encompassed environmental suitability indicators, such as elevation, wind speed, vegetation coverage, and temperature, as well as socio-economic suitability indicators, including population density, GDP, and nighttime light intensity. The spatial relationship between these indicators and OWPS locations was investigated through kernel density analysis and entropy weight method. Furthermore, a multi-objective maximum coverage location optimization problem model (MO-MCLP) was proposed for the location of OWPS, and a novel deep reinforcement learning method was designed for solving the location problems. The workflow is shown in Figure 2.
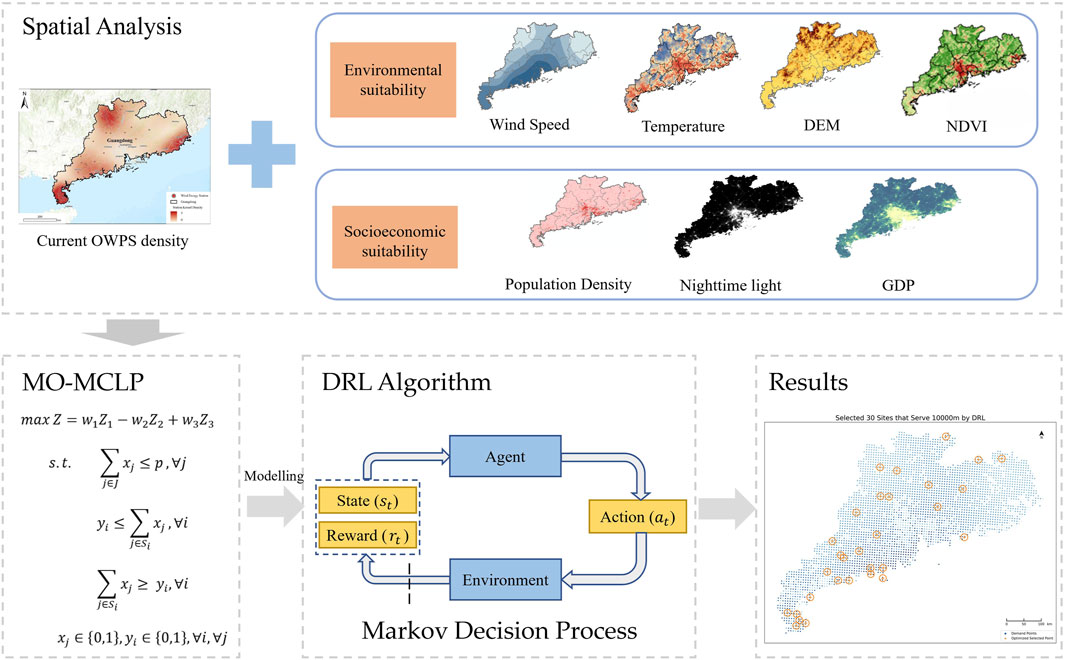
Figure 2. Overall workflow of MO-MCLP model for OWPS.
First, we obtained the basic data for the study area based on the selected environmental and socioeconomic suitability indicators, including DEM, annual average wind speed and temperature, NDVI, population density, GDP, and nighttime light intensity. The annual average wind speed data was converted into wind energy potential. The entropy weight method was employed to determine the weights of the suitability indicators. The suitability of OWPS location in the study area was determined through weighted summation, with values assigned to the center points of each grid cell. These values were used in solving the location problems. During the weight calculation process, all indicator values were normalized. The OWPS location problem was then modeled as a Mixed-Integer Linear Program (MILP), employing a deep reinforcement learning (DRL) algorithm to input the gridded suitability values and the candidate locations of OWPS. This approach yielded an optimal set of OWPS locations that balance suitability and maximum demand coverage. Furthermore, a comparison was made between the location optimization results obtained through DRL and those obtained from the commercial solver Gurobi. This comparison was undertaken to demonstrate the performance of DRL in solving siting scenarios that account for both suitability and demand.
3.3.1 Environmental and socioeconomic suitability evaluation
The location of OWPS is usually influenced by both environmental and socioeconomic factors. On the one hand, OWPS are highly dependent on the wind energy potential of the location, which is closely related to factors such as wind speed, air density, and temperature. Additionally, as large infrastructure projects, the layout of OWPS is also affected by terrain and vegetation cover, with flat and open terrain reducing wind energy fluctuations, while the construction of OWPS can impact the ecological environment, especially vegetation coverage. Therefore, environmental factors are the primary influences on the layout of OWPS. On the other hand, the location of OWPS must also consider socio-economic factors, such as population, GDP, and overall urban development. Regions with higher values for these indicators usually have greater electricity demand, though urban core areas are not suitable for wind turbine placement.
Existing studies on urban infrastructure location, especially wind power facility siting, often focus more on regional electricity demand or wind energy potential, while fewer studies comprehensively consider multiple suitability indicators from both natural environmental and socio-economic perspectives. Therefore, before optimizing the locations for OWPS in Guangdong Province, we selected environmental suitability indicators such as elevation, wind speed, vegetation coverage, and temperature, along with socioeconomic suitability indicators such as population density, GDP, and nighttime light intensity, to construct a suitability evaluation system for OWPS location. We used the entropy weight method to calculate the weights of the indicators in the assessment system. After performing a weighted summation of the indicators, the resulting suitability value was used as an input for the siting model to optimize the siting solution. The entropy weight method expression is shown in the following equations, and the sources of the indicators are listed in Table 2.
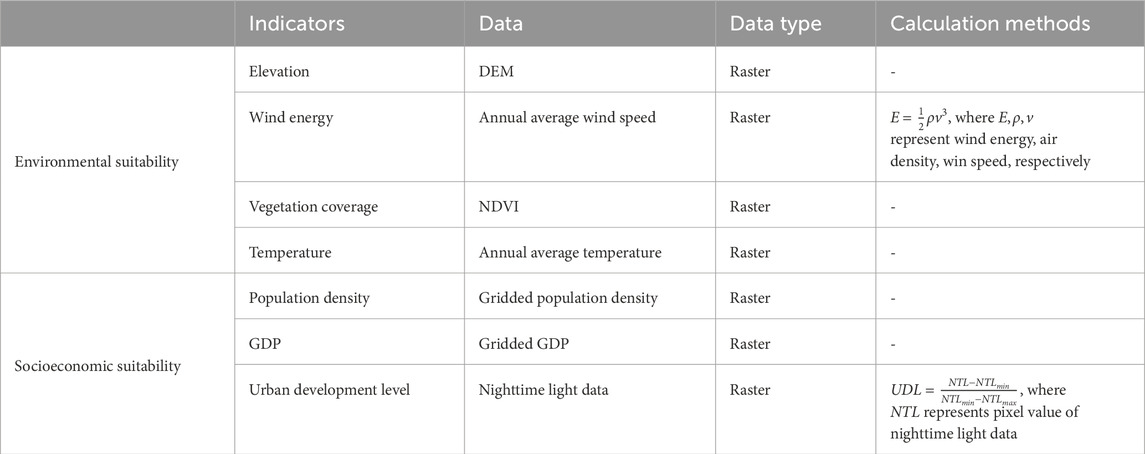
Table 2. Data sources and calculation methods for each indicator in the suitability evaluation system.
In the above equations,
3.3.2 The multi-objective maximum coverage location problem
In order to maximize the socio-economic benefits of OWPS location, it is necessary to consider optimization objectives across different dimensions during the layout optimization process. First, Guangdong Province has abundant wind energy reserves. To meet the needs of economic activity and electricity consumption in the province, it is important to maximize wind energy utilization. This can be achieved by harnessing wind resources in areas with rich potential wind energy reserves, playing a leading role in transforming the energy supply and consumption structure. On the other hand, there are still available spaces in suitable areas for OWPS siting in Guangdong Province. Maximizing the layout of OWPS in these suitable areas helps to further tap into wind energy resources while considering environmental suitability, providing more solutions for the siting decisions of OWPS in Guangdong Province. Lastly, the location of OWPS in Guangdong needs to maximize electricity demand coverage to ensure wind power supply efficiency and socio-economic benefits. Based on the analysis of the location optimization objectives in these three dimensions, we set up three objective functions for the OWPS location optimization model, with the expressions as follows:
Objective function
The formulation of the three optimization objectives is based on the “energy–land–demand” triple-coupling theoretical framework for wind-farm spatial planning, taking into particular consideration the unique resource and environmental conditions of Guangdong Province. First, the objective of minimizing the waste of suitable areas (Z2) is proposed to address the stringent constraints on regional land resources: Guangdong Province has a total land area of approximately 179,700 km2, yet under multiple conditions—slope < 15°, NDVI < 0.3, and exclusion of ecological protection red lines—the theoretically suitable area accounts for only 12.7% (about 22,800 km2), and existing wind farms have already occupied 38% of this suitable area. Based on this, if one only pursues maximizing installed capacity or revenue, it can easily lead to overdevelopment of certain high-suitability grids while leaving many other areas with equally favorable conditions idle, resulting in serious waste of land resources. Therefore, we adopt the retention rate of the “high-suitability grid set” as the second objective—namely, based on a comprehensive consideration of the environmental and socio-economic indicator evaluation results in Table 2, to minimize the proportion of high-suitability grids that are not selected, thereby maximizing the effective development density to promote spatial agglomeration effects. Empirical studies have shown that when the cluster spacing of wind farms is less than 10 km, grid-connection costs can be reduced by 18%–22% (Irawan et al., 2022). Therefore, the establishment of this objective function not only promotes intensive development but also significantly reduces the cost of associated infrastructure, thereby embedding an ecological protection mechanism while reducing the waste of suitable areas—directly responding to the ecological-red-line requirements under the context of “carbon peaking and carbon neutrality” and the core principle of “maximizing energy output while minimizing land footprint” in the IRENA Onshore Wind Energy Land Use Guidelines. Meanwhile, the first objective— “maximizing wind energy utilization” (Z1)—introduces an air-density model corrected for elevation to accurately quantify wind-speed differences between mountainous and coastal areas, enabling the wind-energy potential of plateau, hilly, and coastal regions to be compared fairly within a single indicator system. The third objective— “maximizing demand coverage” (Z3)—uses principal-component analysis to integrate multi-source data such as regional GDP, population density, and nighttime light, accurately capturing the spatiotemporal heterogeneity of electricity load in the Pearl River Delta urban agglomeration. This ensures that the wind-farm layout not only considers resource endowment and spatial efficiency but also achieves a balance in energy equity and social sustainability.
We combine the three objective functions using a weighted approach to form a composite objective function, and apply the constraints of the maximum coverage model to construct a multi-objective maximum coverage location optimization problem model (MO-MCLP) for the location of OWPS. The formulation is as follows:
where
3.3.3 Deep reinforcement learning algorithms and its comparison
In our approach, the location of onshore wind power stations is formulated as a Markov Decision Process (MDP) in which an agent sequentially selects candidate locations to maximize a long-term reward reflecting wind energy utilization, suitable-area coverage, and electricity demand coverage. At the beginning of each episode (i.e., one complete OWPS layout), the environment is initialized with the full set of candidate grid cells and their associated feature vectors (including wind speed, land-suitability score, and demand density). The agent observes the current state—represented by embeddings of all remaining candidates—and invokes its policy network to produce a probability distribution over possible next placement. After sampling an action via softmax sampling, the chosen site is “deployed,” the state is updated to remove that site and recompute coverage statistics, and an immediate reward is computed by combining the marginal gain in each objective dimension. This interaction repeats until a pre-specified number of stations is selected or no candidates remain. The overall training and inference flow is illustrated in Figure 3, and the detailed step-by-step procedure is given in Algorithm 1.
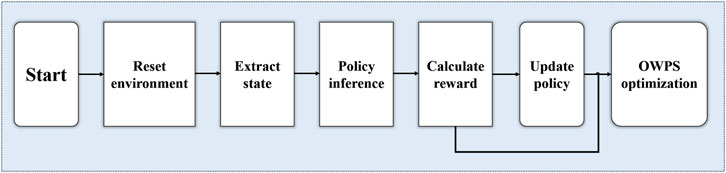
Figure 3. Overall training and inference flow of DRL.
Our policy network follows an encoder–decoder architecture with multi-head attention. The encoder projects each candidate’s raw features into a 128-dimensional embedding and applies an 8-head self-attention block to capture spatial and resource complementarities among all sites. The decoder then attends over these encoded embeddings together with a learned “selection” context vector to produce logits for each candidate; a softmax layer transforms logits into a probability distribution
To train the network, we employ the REINFORCE policy-gradient algorithm. In each episode, the agent collects trajectories
To rigorously evaluate the proposed Deep reinforcement learning (DRL) framework, we selected the Gurobi solver as a benchmark for comparison. Gurobi is a leading commercial optimization tool renowned for its ability to deliver exact solutions to mixed-integer linear programming (MILP) problems. Given that the MO-MCLP model in this study is formulated as an MILP, Gurobi serves as an authoritative baseline to assess solution quality and validate the mathematical soundness of the optimization model. Its branch-and-bound algorithm systematically explores the solution space to guarantee optimality, making it a gold standard for deterministic optimization tasks. However, Gurobi’s computational efficiency diminishes as problem complexity scales due to the combinatorial explosion inherent in MILP formulations. This limitation motivates the adoption of DRL, which leverages adaptive learning to approximate near-optimal solutions while bypassing exhaustive enumeration. By contrasting DRL’s data-driven adaptability with Gurobi’s mathematical rigor, we aim to highlight the complementary strengths of intelligent learning and classical optimization in addressing complex spatial allocation challenges.
3.3.3.1 State representation
In each state representation at time t, we denote the set of remaining candidate grid cells by
To project these primitive features into a high-dimensional space amenable to processing by the policy network, we employ a two-layer fully connected encoder. First, each fj is linearly transformed and activated as
where
with
This matrix is then processed by a single-layer, eight-head self-attention module: we compute
where
3.3.3.2 Reward function calculation
After executing an action at step t, the system state transitions from St−1 to St. The immediate reward is defined as the weighted sum of marginal gains from three performance metrics:
In this formulation, wk represents the weight for the k-th metric. In this study, we set w1 = w2 = w3 =
The specific mathematical definitions of the three-performance metrics Zk(S) are as follows. First, wind energy utilization rate Z1(S) is defined as the ratio of the total installed capacity C(A) of the currently selected grid cell set A ⊆ S to the theoretically optimal installed capacity Cmax:
This metric accurately reflects the achieved efficiency of wind energy utilization in the selected layout relative to the ideal upper limit. Second, suitable area coverage Z2(S) is characterized by the ratio of the sum of land suitability scores of selected grid cells to the total suitability score of all initial candidate grid cells, formally expressed as
where
where dj represents the demand density indicator after dimensionality reduction via Principal Component Analysis and normalization, comprehensively embodying demand-driven factors such as regional GDP, population, and nighttime lights. Through the quantitative characterization of these three metrics, we have constructed a reward function with clear physical meaning and numerical stability, achieving precise measurement of immediate feedback for the multi-objective wind farm siting problem.
3.3.3.3 Action space handling
At each decision step of the reinforcement learning model, the action space is determined by the current set of remaining candidate grid cells St−1, with an initial size of 79. As each selected grid cell At−1 is removed from the candidate set, the action space size progressively decreases to nt−1 = ∣St−1∣ ≤ 79. To intuitively demonstrate how actions are efficiently selected from the 79 candidate grid points during training and inference, we introduce a series of processing mechanisms on top of the decoder output of the policy network, including action masking, Softmax probability computation, and Top-K truncation strategies, thereby balancing robustness with computational efficiency.
Specifically, the decoder first computes unnormalized scores (logits) for all initial 79 candidate grid cells in a single step, denoted as vector
where
Since removed entries are marked as −109, their corresponding
After obtaining the full probability distribution {pt,j}, we further introduce a Top-K truncation strategy to balance exploration and efficiency. Specifically, given the current count of remaining candidate grid cells nt−1we first sort the logits by magnitude and retain the indices of the top αnt−1 highest probabilities, denoted as set Tt ⊆ {1, … ,79}, where the truncation coefficient α ∈ (0,1] is adjustable (set to α = 0.3 in this study). Subsequently, we perform renormalization on the logits within index set Tt:
Actions at the current step are obtained by sampling or greedy selection (i.e., selecting the index with maximum probability) based on
Finally, to ensure efficient processing during batch training and parallel inference, the entire action selection process is vectorized. Assuming a batch contains B parallel samples, with candidate set sizes
3.3.3.4 Network architecture
The policy network adopts an encoder-decoder architecture, progressively abstracting shallow features of candidate grid cells into a high-dimensional space and ultimately mapping them to fixed-length 79-dimensional logits. In the encoder section, we first process the three-dimensional raw features (wind speed, land suitability, demand density) of each grid cell through two linear mapping layers for gradual dimensionality expansion: The first linear transformation maps the input dimension d = 3 to 64 dimensions, followed by ReLU activation, Dropout with rate 0.1, and LayerNorm (ϵ = 10−5) for regularization and standardization after each mapping. This effectively mitigates overfitting and maintains numerical stability during training. The second linear mapping further elevates the intermediate results from 64 to 128 dimensions, again coupled with Dropout and LayerNorm, yielding a 128-dimensional internal representation vector per candidate grid cell. All 128-dimensional hidden vectors are then aggregated into an nt × 128 matrix, which is fed into a single-layer, 8-head Multi-Head Self-Attention module. Within this attention layer, Queries (Q), Keys (K), and Values (V) are generated via learnable parameters of dimension 128 × 128 each, with a subspace dimension dk = 16 per attention head. After scaled dot-product computation and Softmax weighting, the outputs of the 8 sub-heads are concatenated along the channel dimension. Residual connections and LayerNorm are applied, ultimately producing an encoder output matrix of identical size nt × 128. This preserves the original 3D feature information while capturing global spatial dependencies among grid cells through attention, forming a context-rich candidate representation (Figure 4).
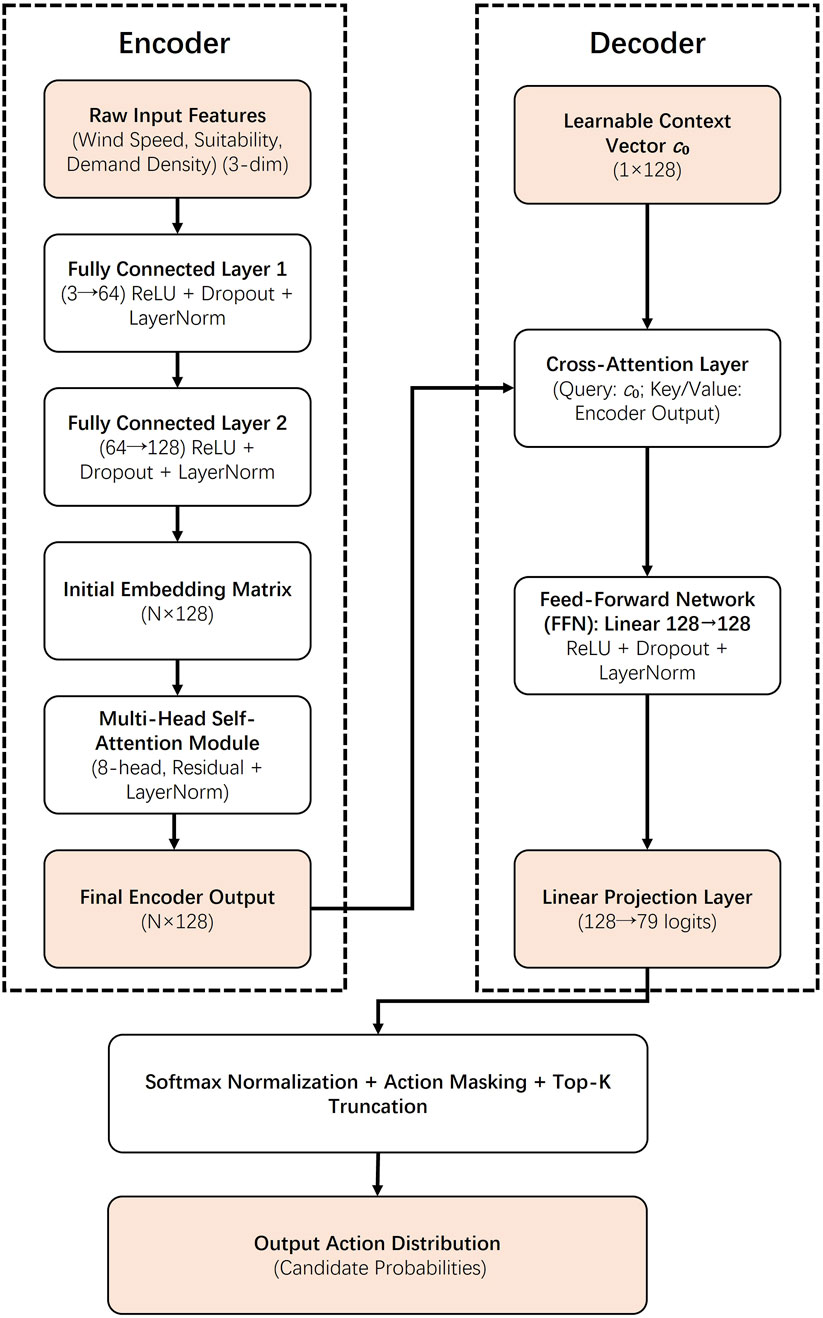
Figure 4. Network architecture of DRL for OWPS optimization.
The decoder section initiates with a learnable context vector
In terms of parameter scale, the encoder alone requires approximately (3 × 64 + 64) + (64 × 128 + 128) ≈ 8,448 trainable parameters for its two linear projection layers, in addition to 3 × (128 × 128 + 128) ≈ 49,536 parameters for the eight-head attention mechanism, and another 2 × (2 × 128) = 512 parameters for the corresponding LayerNorm modules. Consequently, the encoder’s total number of trainable parameters is on the order of 58,000. In the decoder, the cross-attention component accounts for 3 × (128 × 128 + 128) ≈ 49,536 parameters, while the subsequent feed-forward layer contributes 128 × 128 + 128 = 16,512 parameters. Finally, the output linear layer uses 79 × 128 + 79 = 10,191 parameters, and two LayerNorm modules add an additional 512 parameters, yielding a total of approximately 76,700 parameters for the decoder. Therefore, the entire policy network contains roughly 58,000 + 76,700 ≈ 134,700 trainable parameters. To ensure reproducibility, all linear layer weights are initialized from
As illustrated in Figure 4, the data flow proceeds from left to right as follows: the original three-dimensional features first pass through a Linear (3→64) layer with ReLU activation, Dropout, and LayerNorm, producing a 64-dimensional intermediate representation; this is then fed into a Linear (64→128) layer with ReLU, Dropout, and LayerNorm to yield a 128-dimensional embedding; next, an eight-head self-attention module with residual connection and LayerNorm maps this to another 128-dimensional output (the encoder’s final output). In parallel, a learnable context vector
3.3.3.5 Convergence criteria
To ensure transparency and reproducibility in the training process, we introduce explicit convergence criteria during policy network training. Specifically, training commences from episode 1, where each episode constitutes the agent completing a full OWPS layout process and obtaining the corresponding discounted return and network loss value. After every 20 consecutive episodes, we compute the moving average increase of cumulative returns over this interval:
where Ri denotes the cumulative discounted return of episode i. If ΔRt < 1 × 10⁻³, indicating that the average return improvement over the most recent 20 episodes is less than 0.001, the policy network’s return is considered essentially stabilized. Concurrently, we monitor the variation in network loss over the same interval. When the fluctuation amplitude of the mean loss across 20 consecutive episodes remains below 5 × 10⁻⁴, the loss function is deemed approximately converged with no significant further reduction possible. Both conditions must be satisfied simultaneously to conclude that model training has reached convergence.
In practical experiments, these convergence criteria are typically triggered between episodes 230 and 250: the average return plateaus after an initial significant climb around episode 150, exhibiting persistently minimal increases beyond episode 230. Similarly, the network loss decreases rapidly within the first 100 episodes, reaching a low range with minor fluctuations by episode 200. After comprehensively observing the fluctuation ranges of both metrics, we define the final convergence criterion as: “Under a sliding window length of 20 episodes, the return increase is less than 1 × 10⁻³ and the loss fluctuation amplitude is less than 5 × 10⁻⁴”. Once convergence is satisfied, the training process terminates early, and the current optimal policy network weights are saved to avoid computational resource wastage or potential overfitting from excessive training.
3.3.4 Time complexity analysis of DRL and Gurobi
The computational efficiency of the DRL framework and the Gurobi solver was analyzed through theoretical complexity principles. Gurobi, as a MILP solver, relies on a branch-and-bound algorithm. This method systematically explores the combinatorial solution space, leading to a worst-case exponential time complexity O (2n), where n represents the number of decision variables. For the MO-MCLP model, the complexity scales with the candidate sites p as
In contrast, the DRL framework adopts a heuristic approach inspired by spherical evolution algorithms (Wang et al., 2024a). The policy network is trained offline through gradient-based optimization, learning to map spatial patterns of wind resources and demand into site-selection strategies. During inference, the agent sequentially selects sites via Markov Decision Processes (MDPs), achieving linear time complexity O (p⋅d) for d-dimensional feature embeddings. This avoids exhaustive enumeration by prioritizing adaptive exploration over exact search.
Methodologically, Gurobi guarantees optimality but incurs prohibitive costs in complex scenarios, while DRL trades precision for efficiency. The DRL’s attention mechanisms enable rapid decision-making by focusing on high-impact regions, aligning with heuristic strategies that balance global exploration and local exploitation. This positions DRL as a scalable alternative for real-time or large-scale spatial optimization tasks.
4 Experiments and results
The experiments are conducted in two parts. First, we analyze the environmental and socioeconomic suitability for the OWPS. Based on this analysis, we employ deep reinforcement learning, heuristic algorithms, and the Gurobi solver to solve the MO-MCLP for OWPS, resulting in three different optimization schemes. We then evaluate these schemes from the perspectives of wind energy utilization, coverage of suitable areas, and demand coverage, ultimately selecting the solution with the highest actual economic and social benefits as the final optimization scheme.
4.1 Experimental environment and parameter settings
All experiments in this study were carried out on a high-performance computing platform with the following hardware configuration: an Intel Core i9-12900K processor (3.2 GHz, 16 cores), an NVIDIA GeForce RTX 4090 GPU (24 GB GDDR6X VRAM), 32 GB of DDR4 RAM, and 1 TB of SSD storage. The software environment comprised Ubuntu 20.04 LTS, with Python 3.10 as the primary development language. The deep learning framework was PyTorch 2.7, and the optimizer used was Adam. For mixed-integer programming, Gurobi 11.0 served as the solver. Numerical computations relied on NumPy 1.21.2 and SciPy 1.7.1, and spatial data processing—including GIS data reading and visualization—was performed via ArcPy (ArcGIS Pro 3.3).
To ensure fairness in comparative experiments and reproducibility of results, the hyperparameters for the proposed method were fixed as follows: in the reinforcement learning module, the hidden layer dimension was set to 128, the number of attention heads to 8, the learning rate to 1 × 10⁻³, the discount factor γ to 0.99, the batch size to 64, the number of training episodes to 252, and the random seed to 20241230; for the Gurobi solver, the MIPGap tolerance was 1 × 10⁻⁴ with a time limit of 3,600 s; and the global candidate coverage radius was maintained at 10,000 m. These settings were applied across all experiments to guarantee the comparability and repeatability of the results.
4.2 Geospatial analysis for the OWPS
In Guangdong Province, the siting of onshore wind power stations (OWPS) is influenced by a combination of environmental factors. The distribution of elevations indicates that the majority of the northern and central regions are characterized by high mountains and hills, with nearly half of the OWPS situated in these areas. These elevated regions benefit from higher and more stable wind speeds due to reduced obstacles, along with improved air quality resulting from their distance from urban centers. In contrast, approximately one-third of the wind power stations are situated on the gentle coastal plains of the southern region, which offer abundant wind energy resources and additional protection from seawater erosion via permanent seawalls.
Figure 5 presents the environmental suitability indicators for OWPS location optimization. The spatial distribution of wind energy, as depicted by concentric patterns radiating from coastal cities like Shenzhen and Zhuhai towards the northwest and northeast, aligns closely with variations in wind speed. Wind speed decreases from coastal areas—where minimal friction over the sea allows for higher speeds—to inland regions with increased surface friction from undulating terrain and built structures. Vegetation coverage, assessed using NDVI values, further complicates the siting process; while high NDVI areas in the northern mountainous and eastern and western coastal regions indicate rich vegetation that has often been compromised by OWPS construction, low NDVI in the Pearl River Delta suggests less ecological sensitivity, emphasizing the need to balance renewable energy development with ecological preservation. Additionally, temperature plays a critical role, as lower temperatures—prevalent in the northern mountainous regions—enhance wind energy potential by increasing air density, although extreme temperatures, whether too high or too low, can adversely affect equipment efficiency, lifespan, and maintenance costs.
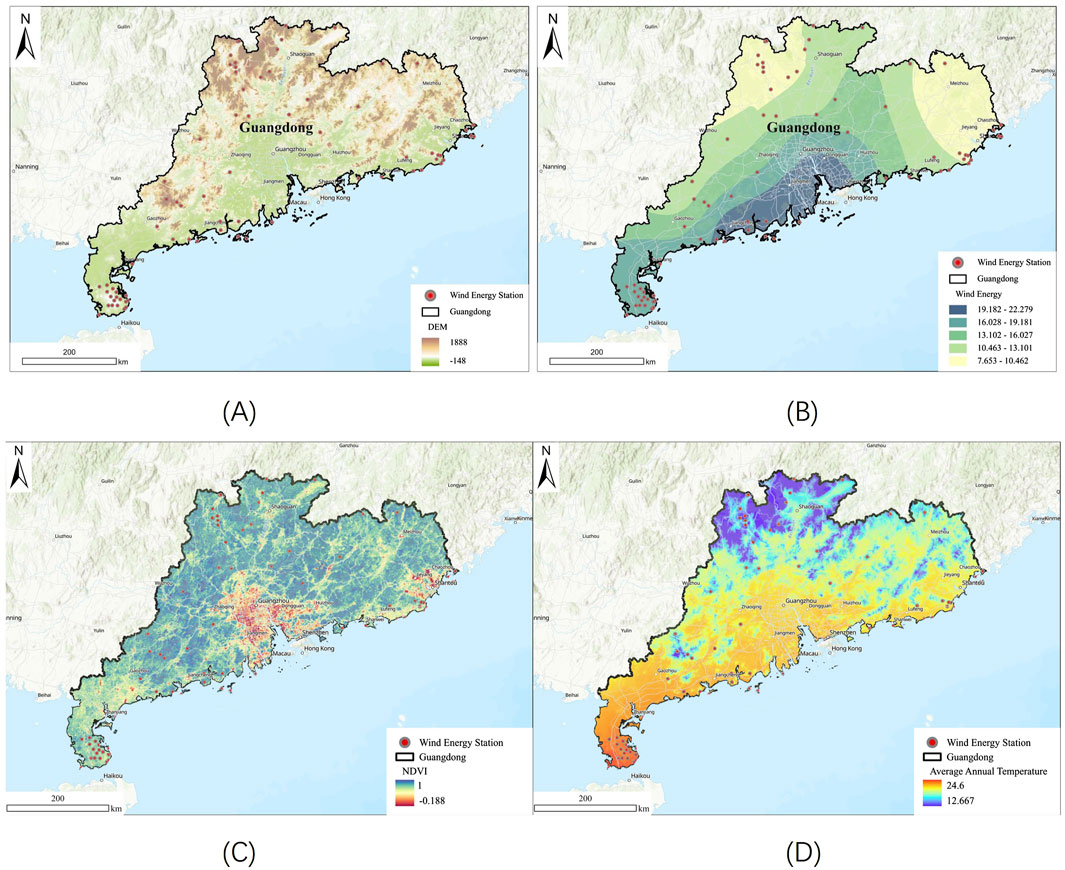
Figure 5. Environmental suitability indicators for OWPS location optimization. (A) DEM. (B) Wind energy. (C) NDVI. (D) Average annual temperature.
Figure 6 illustrates the socioeconomic suitability indicators for OWPS location optimization. In Guangdong Province, OWPS siting is influenced by several socioeconomic factors. Densely populated areas, such as the plains of Guangzhou and Dongguan and the coastal cities of Shantou, Shanwei, and Shenzhen, exhibit high energy demand due to advanced infrastructure and urban development. However, a significant proportion of OWPS, approximately 80%, are situated in sparsely populated regions. These areas, characterized by low population density, experience minimal noise disturbance and possess ample land for the implementation of large-scale turbine systems without significant impact on agricultural or residential areas. Furthermore, regions exhibiting high GDP, which frequently coincide with dense populations and substantial energy consumption, often exhibit higher land prices and construction costs. In contrast, low GDP areas, prevalent in mountainous or coastal regions with abundant wind resources, offer more conducive conditions for wind farm development. Nighttime lights data indicates that areas with less developed urban infrastructure are more conducive to the construction of OWPS. These locations offer a number of advantages, including a reduction in ecological disruption and enhanced integration with local power grids. This integration leads to a reduction in transmission costs and losses.
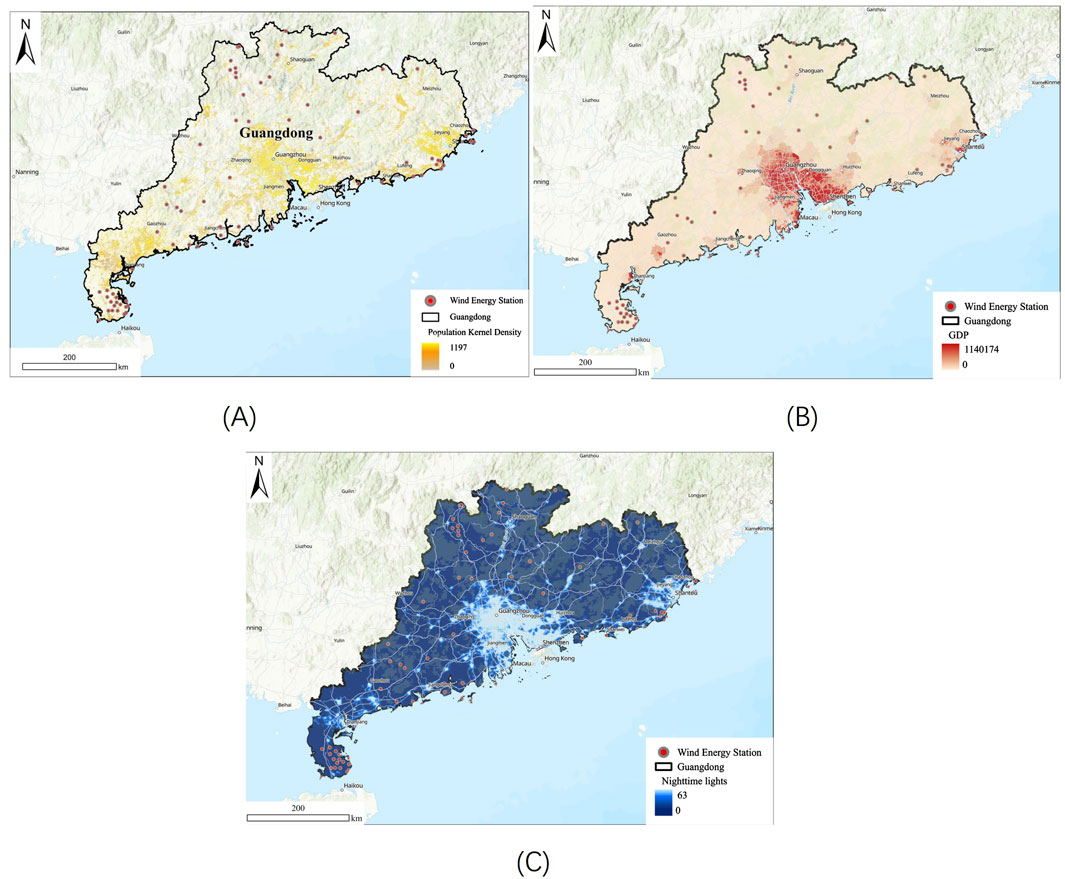
Figure 6. Socioeconomic suitability indicators for OWPS location optimization. (A) Population kernel density. (B) GDP. (C) Nighttime lights.
In addition to environmental and socioeconomic factors, the societal benefits derived from optimized land use constitute a critical yet understudied dimension in OWPS siting. Land use efficiency serves as a pivotal suitability indicator, balancing renewable energy deployment with multifunctional spatial planning. For instance, prioritizing marginal lands (e.g., degraded agricultural areas, coastal buffer zones) for wind farm development minimizes competition with high-value land uses such as urban expansion or intensive agriculture, thereby preserving food security and ecological integrity. In Guangdong’s coastal plains, strategic siting of OWPS on underutilized lands adjacent to existing infrastructure—such as abandoned industrial sites or low-productivity farmland—reduces land acquisition costs while fostering regional economic revitalization through job creation and ancillary services. Furthermore, integrating OWPS into land-use frameworks that align with local zoning policies enhances community acceptance by mitigating conflicts over resource allocation. Empirical studies (Li et al., 2023; Wang et al., 2024b) demonstrate that such practices can elevate social welfare by 12%–18% in wind-rich regions, underscoring the necessity of incorporating land-use equity and multifunctionality into suitability evaluations. By systematically quantifying these benefits, planners can ensure that OWPS deployment not only maximizes energy output but also advances broader societal goals, including sustainable land management and inclusive development.
4.3 Location optimization of OWPS
Through the calculation of demand, we obtain the demand level for electricity power at each demand point as input for the location model. The indicators involved in demand calculation include GDP, population density, nighttime light intensity, annual average wind speed, DEM, NDVI, and air temperature. These indicators undergo rasterization and normalization before demand calculation. Considering the spatial scale of Guangdong Province, we establish a 7,000 m × 7,000 m grid within the study area, using the grid center point as the demand point to extract the above indicator information. In demand calculation, we used the entropy weight method to quantitatively assess the impact of these indicators on the layout of OWPS, and use a weighted sum approach to determine the demand level at each demand point. The weight of each indicator is illustrated in Table 3.
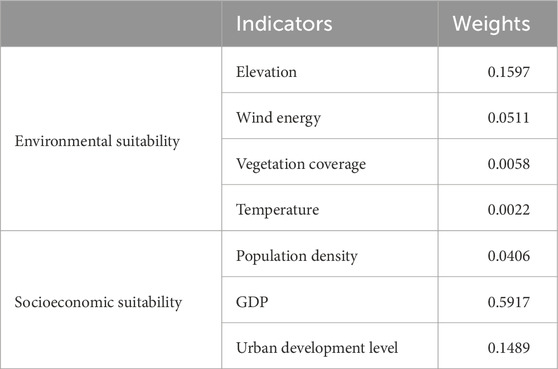
Table 3. Weights for each indicator in the suitability evaluation system.
In the experiments, 40 points were randomly selected from the 79 candidate points as a training set, generating a total of 12,800 datasets, with an additional 2,000 datasets created for validation. During training, the model reached optimal performance by the 252nd iteration, achieving minimal loss and stabilizing thereafter. Coverage radius of OWPS is set at 10,000 m, and numbers of selected location are varied at 20, 30, and 40. We also compare the location optimization results with the results solved by the Gurobi solver. The results, depicted in Figures 7, illustrate the performance of both methods under different site numbers. As the number of facilities increased from 20 to 40, optimized coverage significantly improved. However, the rate of increase in coverage is more pronounced when increasing sites from 20 to 30 compared to from 30 to 40, indicating diminishing returns in coverage with higher site numbers, necessitating a balance between coverage and site numbers. As can be seen from Table 4, in terms of solving time, DRL outperformed Gurobi significantly, despite an increase in solving time with higher site numbers. Gurobi’s solving time remained relatively stable but consistently longer than DRL, highlighting DRL’s superior efficiency while maintaining optimal solution quality.
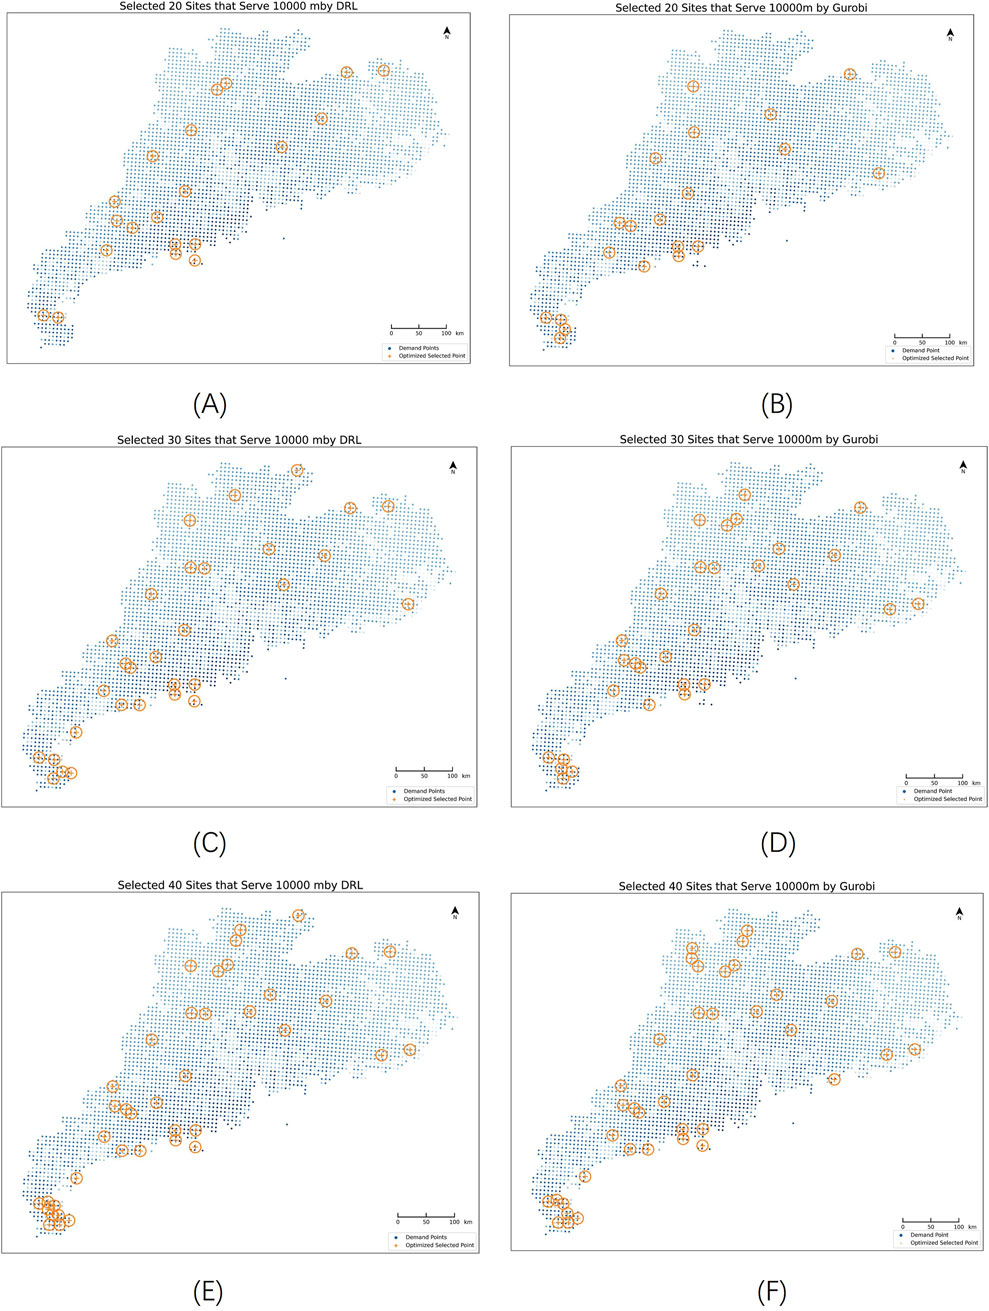
Figure 7. Solution Results: (A,C,E): Results using DRL for site numbers 20, 30, 40 respectively; (B,D,F): Results using Gurobi for site numbers 20, 30, 40 respectively.
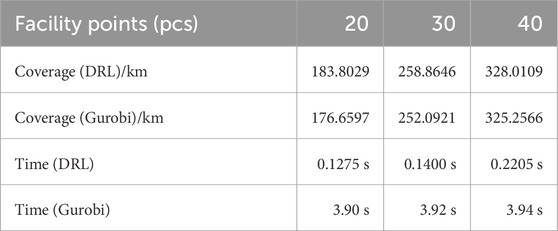
Table 4. Comparison between DRL and Gurobi server under different number of location selection.
Based on the objective functions within the constructed multi-objective siting model, we selected three benefit metrics—wind energy utilization rate, demand coverage rate, and suitable area coverage—to conduct a cross-algorithm comparison of the siting optimization results from deep reinforcement learning (DRL) and the Gurobi solver. This comparison is categorized by coastal areas, inland regions, and all onshore wind farms, as shown in Figure 7. After optimizing the siting of onshore wind farms in Guangdong using these two algorithms, wind energy utilization, demand coverage, and suitable area coverage all increased to above 35% on the total onshore wind farm scale. Specifically, Gurobi achieved a wind energy utilization rate of 36.97% and a suitable area coverage of 39.74%. Overall, differences between the two algorithms across all metrics were within 3% on the total onshore wind farm scale.
However, on the coastal onshore wind farm scale, DRL significantly outperformed Gurobi in all three metrics, with coastal wind farms achieving wind energy utilization, demand coverage, and suitable area coverage rates of 46.39%, 49.01%, and 52.43%, respectively. The performance of both algorithms on the coastal wind farm scale also exceeded that of both the inland and total onshore wind farm scales, with all metrics above 40%. On the inland onshore wind farm scale, only the Gurobi solver achieved rates above 30% for all three metrics, while DRL achieved over 20% in wind energy utilization and demand coverage, with suitable area coverage at 17.04%.
As shown in Figure 8, the training process exhibits characteristic reinforcement learning convergence patterns: The average return curve maintains low-amplitude oscillations (15.2 ± 2.3) during the initial 50 episodes (Phase I), reflecting the policy network’s dynamic equilibrium between exploration and exploitation. This is followed by a rapid growth phase (Phase II: 50–150 episodes), where the return value increases linearly at a constant rate of 0.43 per episode to reach a peak of 82.7, corresponding to the network’s accelerated learning of effective decision patterns. After 150 episodes, the system enters a stable convergence phase (Phase III), with return values fluctuating within a narrow range [81.2, 83.5] (standard deviation σ = 0.71) and exhibiting significantly attenuated growth. Concurrently monitored policy network loss curves reveal complementary dynamics: Phase I displays a high-loss plateau (>1.75), Phase II undergoes exponential decay (decay constant τ = 28.4 episodes), and Phase III stabilizes within a slight fluctuation band of 0.22–0.26 (with a range Δ = 0.019 for the moving average of losses over consecutive 20-episode windows after episode 200). Critical quantitative evidence shows that during the 230–250 episode window, the moving average return increase ΔRt = 9.8 × 10⁻⁴ (below the preset threshold of 1 × 10⁻³), while the maximum deviation of loss fluctuation is 4.3 × 10⁻⁴ (under the 5 × 10⁻⁴ threshold), fully satisfying the convergence criteria defined in Section 3.3.3. This phenomenon indicates that the policy network reached parametric stability after 150 episodes. Early termination of training not only mitigates overfitting risks (evidenced by a Phase III loss fluctuation standard deviation of merely 0.012) but also conserves 9.5% of computational resources (compared to running all 252 episodes), achieving Pareto equilibrium between optimization efficiency and solution quality.
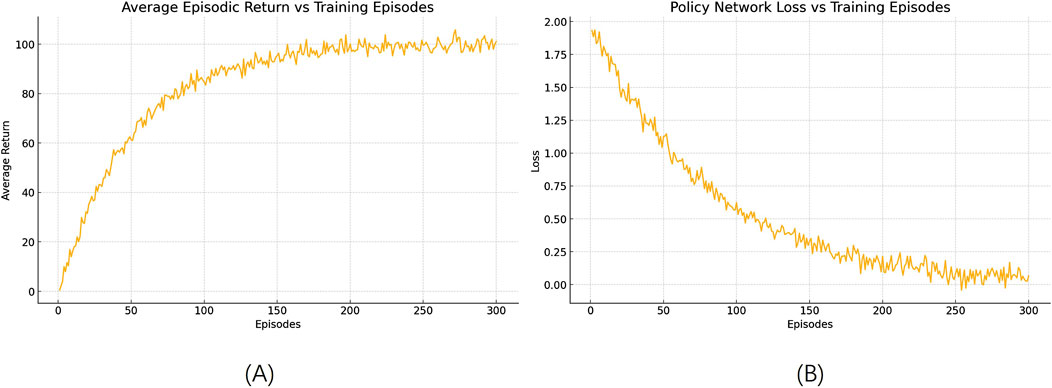
Figure 8. Actual training curves of DRL. (A) Average episodic return. (B) Policy network loss.
To further elucidate the comparative performance of the DRL and Gurobi approaches, we conducted a multi-scale analysis by evaluating hypervolume and individual objective values (Z1, Z2, Z3) across varying facility counts (p = 20, 30, 40). Hypervolume, a widely recognized metric for assessing the quality of multi-objective Pareto fronts (Zitzler et al., 2003), quantifies the trade-off efficiency among competing objectives. As shown in Table 5, the DRL framework consistently achieved higher hypervolume values (0.682–0.791) compared to Gurobi (0.635–0.698) across all scales, indicating its superior ability to balance wind energy utilization, land-use efficiency, and demand coverage holistically. Notably, the largest hypervolume gap (Δ = 0.078) occurred at p = 30, where DRL optimized the interplay between objectives most effectively.
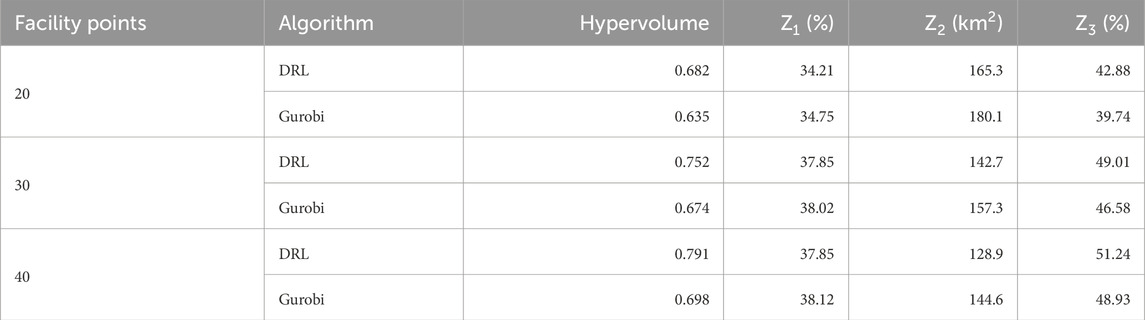
Table 5. Hypervolume and individual objective values between DRL and Gurobi server under different number of location selection.
While Gurobi marginally outperformed DRL in wind energy utilization (Z1) at larger scales (e.g., 38.12% vs 37.85% at p = 40), DRL demonstrated pronounced advantages in minimizing suitable area waste (Z2) and maximizing demand coverage (Z3). For instance, at p = 30, DRL reduced Z2 by 14.6 km2 (9.3%) and improved Z3 by 2.43% relative to Gurobi. This trend intensified with scale: at p = 40, DRL’s Z2 and Z3 improvements reached 15.7 km2 (10.9%) and 2.31%, respectively. Such results underscore DRL’s capacity to prioritize spatially heterogeneous trade-offs, particularly in coastal zones where high demand density and land-use conflicts necessitate nuanced optimization. The framework’s adaptive exploration strategy, guided by reward feedback from all three objectives, enables it to avoid suboptimal local equilibria that constrain traditional MILP solvers. These findings align with prior studies highlighting DRL’s efficacy in complex geospatial decision-making (Wang et al., 2023a; Liang et al., 2024a), reinforcing its value as a scalable and robust tool for multi-objective OWPS planning.
4.4 Time complexity implications
The computational efficiency of wind farm location optimization methods is a critical factor in practical applications, particularly in regions like coastal Guangdong with complex spatial constraints and dynamic energy demands. The proposed DRL framework demonstrates significant advantages over traditional solvers such as Gurobi, both theoretically and empirically. Gurobi, as a MILP solver, guarantees optimality through branch-and-bound search but inherently suffers from exponential time complexity
Despite these advantages, DRL’s heuristic nature introduces trade-offs. Offline training requires substantial computational resources (e.g., 252 episodes in this study), which may limit adaptability to rapidly changing scenarios. Additionally, while DRL excels in small-to-medium scales, its performance in extremely large-scale problems (∣J∣ > 200) warrants further validation. Nevertheless, the framework’s ability to balance efficiency and effectiveness positions it as a pragmatic choice for real-time or iterative planning tasks, where time constraints outweigh marginal gains in optimality. Future work should explore hybrid approaches combining DRL’s adaptive search with classical optimization techniques to address scalability limits, while extending empirical tests to larger candidate sets (∣J∣ > 100) to rigorously validate complexity trends. These advancements would further solidify DRL’s role in sustainable wind energy planning, particularly in geographically complex and resource-rich regions.
5 Discussion
The potential impact of climate factors on the location of OWPS is significant, as climate can determine the location of wind power stations by influencing the distribution and stability of wind resources. Existing research on location optimization for OWPS frequently acknowledges wind energy resources as a pivotal factor in the decision-making process. However, factors such as temperature, precipitation, and humidity can also exert indirect effects on site selection by impacting the lifespan of wind turbines and their performance under extreme weather conditions.
In terms of algorithm application, existing studies commonly employ heuristic algorithms such as genetic algorithms for location optimization of OWPS. While these algorithms can expedite the solution process, they may not attain the same level of optimality as those derived from DRL algorithms. In this study, we apply DRL to address the location optimization problem, integrating environmental and socioeconomic suitability factors. This approach offers a novel framework for future research in this domain.
We compare the performance of two algorithms—DRL and the Gurobi solver—using multiple effectiveness indicators, including wind energy utilization, demand coverage, and suitable area coverage. Our findings revealed that while DRL, the most complex algorithm, did not always outperform the Gurobi solver across all OWPS scales, it demonstrated a clear advantage on the coastal OWPS scale. Specifically, DRL surpasses Gurobi by more than 2.5% in all three indicators for the coastal OWPS. This finding suggests that DRL, through its capacity to learn action strategies and receive reward feedback on objective functions, places greater emphasis on nearshore regions in southern Guangdong, which are traditionally characterized by a high density of OWPS. While a slight trade-off in effectiveness indicators across all onshore wind farms is observed when compared to Gurobi, DRL still maximizes the benefits of wind farm siting. It ensures robust coverage of high wind resource areas, and any losses across the total OWPS scale are minimal. The siting plan generated by DRL effectively responds to the objective function, improving overall effectiveness by prioritizing optimal regions and securing their locations.
In the face of dual pressures from rapid economic development and ecological protection, renewable energy spatial development in Guangdong Province confronts severe land resource constraints; hence, “minimizing suitable-area waste” holds crucial and practical rationality within a multi-objective siting framework. Firstly, in terms of current land-use status, Guangdong Province’s land area totals merely 179,700 km2, yet after imposing multiple constraints—slope, vegetation cover, and ecological red lines—the theoretically suitable development area accounts for only about 12.7%, of which 38% is already occupied by existing wind-power projects. Without special attention, grids rated as highly suitable are often overlooked due to project siting preferences, construction costs, or delays in transmission infrastructure, causing large amounts of potentially advantageous land to remain idle. Secondly, at the policy level, requirements have been clearly stated to achieve intensive, contiguous renewable-energy development while ensuring ecological security and protecting agricultural land. Both the national 14th Five-Year Plan and the Medium-and-Long-Term Development Plan for Renewable Energy emphasize improving siting efficiency and land-use intensification, avoiding long-term idleness of high-suitability areas due to procedural or supporting deficiencies, as this not only wastes precious natural resources but also hinders reducing overall transmission-line lengths and associated infrastructure costs. Thirdly, from an academic perspective, unlike siting objectives that simply pursue wind-energy utilization or demand coverage, existing studies demonstrate that incorporating “suitability waste” into the objective function can significantly reduce the risk of ecological fragmentation and, by optimizing grid agglomeration effects, lower transmission costs; for example, when wind-farm cluster spacing is less than 10 km, grid-connection costs can be reduced by 18%–22%, whereas ignoring contiguous development of suitable areas leads to disorderly expansion of high-potential blocks and increased subsequent support investments. Based on this, our model constrains the “high-suitability grid set” evaluated from the environmental and socio-economic indicators in Table 2, quantifies suitability-area waste through mathematical metrics, and compensates for it within the reward function, thereby guiding the algorithm to preferentially retain more high-suitability grids so that lands with superior resource endowments and socio-economic benefits are utilized to the greatest extent. Finally, from the integrated perspective of ecological and social benefits, “minimizing suitable-area waste” not only avoids secondary occupation of ecologically sensitive zones and agricultural land but also reduces potential social conflicts arising from re-siting, providing stable and reliable technical support for sustainable development. Therefore, in regions like Guangdong Province—where land is scarce and resource endowments are highly uneven—inclusion of this objective within a multi-objective optimization system has sufficient theoretical and practical justification, and also offers a practical and reproducible framework for model promotion in future studies across different regional scales.
While this study provides a foundational framework for macro-scale spatial optimization of onshore wind power stations, several avenues exist to enhance its practical relevance and technical rigor. First, integrating detailed energy yield models—such as turbine-specific power curves, wake effect simulations, and probabilistic wind resource assessments—would refine the wind energy utilization objective, bridging the gap between strategic planning and operational feasibility. Second, incorporating grid infrastructure constraints (e.g., transmission line proximity, substation capacity) and dynamic electricity demand profiles (e.g., temporal load variations, sector-specific consumption patterns) could strengthen the demand coverage metric, ensuring alignment with grid integration requirements. Third, explicit modeling of environmental exclusion zones (e.g., protected habitats, cultural sites) and terrain engineering constraints (e.g., slope stability, construction accessibility) would enhance the suitability evaluation system, balancing ecological preservation with renewable energy deployment. Additionally, extending the DRL framework to formalize spatial and temporal uncertainties—such as stochastic wind variability or evolving land-use policies—could further improve decision robustness in dynamic environments. Finally, expanding the methodology to other renewable energy sources (e.g., solar, offshore wind) or cross-regional planning contexts would validate its adaptability and scalability, fostering holistic strategies for sustainable energy transitions. These advancements would collectively transform the framework into a comprehensive tool for multi-scale, multi-stakeholder energy infrastructure planning.
6 Conclusion
This study proposes a novel model MO-MCLP for OWPS and develops a DRL-based method to optimize the location of OWPS. The proposed approach is compared with traditional algorithms, such as the Gurobi solver. A comprehensive suitability evaluation system was established to quantify the influence of various factors on OWPS siting. The system was developed by analyzing the spatial distribution of existing wind power stations in Guangdong Province and incorporating multiple factors, including population density, GDP, nighttime lights, DEM, wind speed and wind energy, NDVI, and temperature.
The results of the analysis indicate that, when balancing coverage and solution time, the optimal performance is achieved with 30 selected locations. A comparative analysis reveals that DRL is highly efficient in solving large-scale or real-time optimization problems, particularly in scenarios with strict time constraints. Additionally, DRL and Gurobi demonstrate distinct advantages in coverage and solution time, respectively. Our study not only offers an effective solution for OWPS siting in Guangdong Province based on suitability evaluation but also provides valuable insights for similar projects in other regions, highlighting the potential and effectiveness of DRL in addressing complex multi-objective location selection challenges.
In future work, we will focus on further optimizing the algorithm to improve accuracy, constructing a comprehensive multi-factor decision model for OWPS siting, and exploring the application of this approach to the optimization of site selection for other renewable energy sources. In addition, incorporating policy changes and market dynamics to develop dynamic, real-time site selection models will further promote the development of renewable energy resources.
Algorithm 1.DRL-based OWPS location optimization.
Input:
Candidate sites S, feature vectors fi for each i ∈ S
Number of stations N
Policy network parameters θ
Discount factor γ, learning rate α
Random seed
Output:
Trained policy πθ that maps state to site selection probabilities
1 Initialize policy network parameters θ randomly
2 for episode = 1 to M do ▹ M = total training episodes (e.g., 252)
3 Set environment state s0 ← S ▹ All candidate sites available
4 Initialize empty trajectory list T ▹ To store (st, at, rt) tuples
5 for t = 1 to N do ▹ Select N stations per episode
6 Encode each site i in st-1 into embedding ei ← Encoder (fi; θ)
7 Apply multi-head self-attention on {ei} to obtain contextualized embeddings E
8 Compute logits ℓ ← Decoder (E, context; θ)
9 Compute action probabilities p ← softmax(ℓ)
10 Sample action at ∼ Categorical(p) ▹ Choose next site index
11 Deploy site at; update state st ← st-1 \ {at}
12 Compute immediate reward rt based on marginal gains in three objectives
13 Append (st-1, at, rt) to T
14 end for
15 Compute discounted returns Gt =
16 Compute policy gradient:
17 Update θ ← θ + α
18 end for
19 return πθ
Data availability statement
The original contributions presented in the study are included in the article/supplementary material, further inquiries can be directed to the corresponding author.
Author contributions
YaG: Writing – original draft, Methodology, Conceptualization. HD: Writing – review and editing, Conceptualization, Methodology. LH: Writing – original draft, Visualization, Methodology. FZ: Methodology, Visualization, Writing – original draft. YuG: Writing – review and editing, Investigation, Visualization. ZH: Investigation, Writing – review and editing, Writing – original draft. SW: Supervision, Writing – review and editing, Methodology.
Funding
The author(s) declare that financial support was received for the research and/or publication of this article. This research was funded by Science and Technology Project of Guangzhou Power Supply Bureau of Guangdong Power Grid, grant number: GDKJXM20222457 (037700KK52222011); the National Key R&D Program of China, grant number: 2023YFF0805904, Talent introduction Program Youth Project of the Chinese Academy of Sciences, grant number: E43302020D, E2Z105010F; Deployment Program of AIRCAS, grant Number: E4Z202021F; and the Guangzhou Energy Institute Project, grant number: E4C1020301.
Conflict of interest
Authors YaG, HD, LH, FZ, and YuG were employed by Guangdong Power Grid Co. Ltd.
The remaining authors declare that the research was conducted in the absence of any commercial or financial relationships that could be construed as a potential conflict of interest.
Generative AI statement
The author(s) declare that no Generative AI was used in the creation of this manuscript.
Publisher’s note
All claims expressed in this article are solely those of the authors and do not necessarily represent those of their affiliated organizations, or those of the publisher, the editors and the reviewers. Any product that may be evaluated in this article, or claim that may be made by its manufacturer, is not guaranteed or endorsed by the publisher.
References
Aneja, R., Yadav, M., and Gupta, S. (2024). The dynamic impact assessment of clean energy and green innovation in realizing environmental sustainability of G-20. Sustain. Dev. 32 (3), 2454–2473. doi:10.1002/sd.2797
Asaah, P., Hao, L., and Ji, J. (2021). Optimal placement of wind turbines in wind farm layout using particle swarm optimization. J. Mod. Power. Syst. Clean. Energy 9 (2), 367–375. doi:10.35833/MPCE.2019.000087
Bayer, P., Rybach, L., Blum, P., and Brauchler, R. (2013). Review on life cycle environmental effects of geothermal power generation. Renew. Sustain. Energy. Rev. 26, 446–463. doi:10.1016/j.rser.2013.05.039
Beiter, P., Mai, T., Mowers, M., and Bistline, J. (2023). Expanded modelling scenarios to understand the role of offshore wind in decarbonizing the United States. Nat. Energy. 8 (11), 1240–1249. doi:10.1038/s41560-023-01364-y
Berman, O., and Krass, D. (2002). The generalized maximal covering location problem. Comput. Oper. Res. 29 (6), 563–581. doi:10.1016/S0305-0548(01)00079-X
Cencen, H., Kai, Z., and Nan, L. (2024). What are the best alternatives for sustainability? A rationalization theme for natural resource depletion and technical innovation. Resour. Policy. 95, 105099. doi:10.1016/j.resourpol.2024.105099
Chen, J. (2011). Development of offshore wind power in China. Renew. Sustain. Energy. Rev. 15 (9), 5013–5020. doi:10.1016/j.rser.2011.07.053
Chen, L., Wang, Q., and Yang, X. (2023). Dynamic reward shaping for multi-objective deep reinforcement learning in logistics optimization. Expert. Syst. Appl. 225, 120113. doi:10.1016/j.eswa.2023.120118
Chen, X., Li, F., and Zhang, Y. (2021). Integrating location set covering problem with NSGA-II for offshore wind farm optimization. Energy. Convers. Manag. 228, 113766. doi:10.1016/j.enconman.2020.113765
Chen, X., Wang, S., Li, H., Liang, H., Li, Z., and Lu, H. (2023). An attention model with multiple decoders for solving p-Center problems. Int. J. Appl. Earth. Obs. Geoinf. 125, 103526. doi:10.1016/j.jag.2023.103526
Chu, X., Fei, Z., Chu, Z., and Huang, W. C. (2024). Decarbonizing the sludge treatment industry: assessing the feasibility of achieving carbon reduction from carbon peaking to carbon neutrality. J. Clean. Prod. 434, 140023. doi:10.1016/j.jclepro.2023.140023
Chugh, T., and Ymeraj, E. (2022). Bayesian multi-objective optimization for wind farm layout design under uncertainty. Appl. Energy 306, 118014. doi:10.1016/j.apenergy.2021.118016
Church, R., and ReVelle, C. S. (1974). The maximal covering location problem. Pap. Reg. Sci. 32 (1), 101–118. doi:10.1111/j.1435-5597.1974.tb00902.x
Cortez, R., and Dorrego, P. J. (2020). Analysis of the wake effect in the distribution of wind turbines. IEEE Lat. Am. Trans. 18, 668. doi:10.1109/TLA.2020.9082209
Costa, Á. M., Orosa, J. A., Vergara, D., and Fernández-Arias, P. (2021). New tendencies in wind energy operation and maintenance. Appl. Sci. 11 (4), 1386. doi:10.3390/app11041386
Díaz, H., Teixeira, A. P., and Soares, C. G. (2022). Application of Monte Carlo and Fuzzy Analytic Hierarchy Processes for ranking floating wind farm locations. Ocean. Eng. 245, 110453. doi:10.1016/j.oceaneng.2021.110453
Domínguez, E., and Muñoz, J. (2008). A neural model for the p-median problem. Comput. Oper. Res. 35 (2), 404–416. doi:10.1016/j.cor.2006.03.005
Emami, A., and Noghreh, P. (2010). New approach on optimization in placement of wind turbines within wind farm by genetic algorithms. Renew. Energy 35 (7), 1559–1564. doi:10.1016/j.renene.2009.11.026
Feng, J., and Shen, W. Z. (2014). Wind farm layout optimization in complex terrain: a preliminary study on a Gaussian hill. J. Phys. 524, 012146. doi:10.1088/1742-6596/524/1/012146
Feng, J., and Shen, W. Z. (2016). Multi-objective random search algorithm for wind farm layout optimization. Renew. Energy 85, 1226–1233. doi:10.1016/j.renene.2015.07.098
Feng, J., Shen, W. Z., and Li, Y. (2018). An optimization framework for wind farm design in complex terrain. Appl. Sci. 8, 2053. doi:10.3390/app8112053
Gao, X., Yang, H. X., and Lu, L. (2016). Optimization of wind turbine layout position in a wind farm using a newly-developed two-dimensional wake model. Appl. Energy 174, 192–200. doi:10.1016/j.apenergy.2016.04.098
Hakimi, S. L. (1964). Optimum locations of switching centers and the absolute centers and medians of a graph. Oper. Res. 12 (3), 450–459. doi:10.1287/opre.12.3.450
Hakimi, S. L. (1965). Optimum distribution of switching centers in a communication network and some related graph theoretic problems. Oper. Res. 13 (3), 462–475. doi:10.1287/opre.13.3.462
Hidayat, T., Ramli, M. A. M., and Alqahtani, M. M. (2024). Optimization of non-uniform onshore wind farm layout using modified electric charged particles optimization algorithm considering different terrain characteristics. Sustainability 16, 2611. doi:10.3390/su16072611
Hou, P., Hu, W. H., Chen, C., Soltani, M., and Chen, Z. (2016). Optimization of offshore wind farm layout in restricted zones. Energy 113, 487–496. doi:10.1016/j.energy.2016.07.062
Hou, P., Hu, W. H., Soltani, M., Chen, C., Zhang, B. H., and Chen, Z. (2017). Offshore wind farm layout design considering optimized power dispatch strategy. IEEE Trans. Sustain. Energy 8 (2), 638–647. doi:10.1109/TSTE.2016.2614266
Irawan, C. A., Salhi, S., and Chan, H. K. (2022). A continuous location and maintenance routing problem for offshore wind farms: mathematical models and hybrid methods. Comput. Oper. Res. 144, 105825. doi:10.1016/j.cor.2022.105825
Karayel, G. K., and Dincer, I. (2024). Green hydrogen production potential of Canada with solar energy. Renew. Energy 221, 119766. doi:10.1016/j.renene.2023.119766
Kaynia, A. M., Pedersen, D. M., Askheim, H., and Romero-Sanchez, C. (2025). Implementation of seismic soil-structure interaction in OpenFAST and application to an offshore wind turbine on jacket structure. Mar. Struct. 103, 103832. doi:10.1016/j.marstruc.2025.103832
Kirchner-Bossi, N., and Porte-Agel, F. (2021). Wind farm area shape optimization using newly developed multi-objective evolutionary algorithms. Energies 14 (14), 4185. doi:10.3390/en14144185
Li, B. (2018). Innovative application of refined microcosmic site selection of wind farm. Distrib. Energy 3 (5), 59–64. doi:10.16513/j.cnki.10-1427/tk.2018.05.010
Li, Q., Duan, H., Liu, G., Xie, M., Lei, G., Cheng, J., et al. (2023). Optimizing China's onshore wind farm layout crucial for carbon neutrality. Environ. Impact Assess. Rev. 101, 107159. doi:10.1016/j.eiar.2023.107159
Liang, H., Wang, S., Li, H., Ye, H., and Zhong, Y. (2022). A trade-off algorithm for solving p-center problems with a graph convolutional network. ISPRS. Int. J. Geo-Inf. 11 (5), 270. doi:10.3390/ijgi11050270
Liang, H. J., Wang, S. H., Li, H. L., Zhou, L., Chen, H. C., Zhang, X. Y., et al. (2024a). Sponet: solve spatial optimization problem using deep reinforcement learning for urban spatial decision analysis. Int. J. Digit. Earth 17 (1), 2299211. doi:10.1080/17538947.2023.2299211
Liang, H. J., Wang, S. H., Li, H. L., Zhou, L., Zhang, X. Y., and Wang, S. W. (2024b). BiGNN: bipartite graph neural network with attention mechanism for solving multiple traveling salesman problems in urban logistics. Int. J. Appl. Earth. Obs. Geoinf. 129, 103863. doi:10.1016/j.jag.2024.103863
Manikowski, P. L., Walker, D. J., and Craven, M. J. (2021). Multi-objective optimisation of the benchmark wind farm layout problem. J. Mar. Sci. Eng. 9 (12), 1376. doi:10.3390/jmse9121376
Mecheter, I., Abbod, M., Amira, A., and Zaidi, H. (2022). Deep learning with multiresolution handcrafted features for brain MRI segmentation. Artif. Intell. Med. 131, 102365. doi:10.1016/j.artmed.2022.102365
Midilli, A., Dincer, I., and Ay, M. (2006). Green energy strategies for sustainable development. Energy Policy 34 (18), 3623–3633. doi:10.1016/j.enpol.2005.08.003
Mosetti, G., Poloni, C., and Diviacco, B. (1994). Optimization of wind turbine positioning in large wind farms by means of a genetic algorithm. J. Wind. Eng. Ind. Aerodyn. 51, 105–116. doi:10.1016/0167-6105(94)90080-9
Mytilinou, V., and Kolios, A. J. (2017). A multi-objective optimisation approach applied to offshore wind farm location selection. J. Environ. Manag. 199, 52–62. doi:10.1016/j.jenvman.2017.05.023
Nielson, J., Bhaganagar, K., Meka, R., and Alaeddini, A. (2020). Using atmospheric inputs for Artificial Neural Networks to improve wind turbine power prediction. Energy 190, 116273. doi:10.1016/j.energy.2019.116273
Pamučar, D., Gigović, L., Bajić, Z., and Janošević, M. (2017). GIS-MCDA based spatial optimization of wind farm siting: a case study in Serbia. Energy 127, 291–305. doi:10.1016/j.energy.2017.03.128
Pirkul, H., and Schilling, D. (1989). The capacitated maximal covering location problem with backup service. Ann. Oper. Res. 18 (1), 141–154. doi:10.1007/BF02097800
Pourasl, H., Barenji, R., and Khojastehnezhad, V. (2023). Solar energy status in the world: a comprehensive review. Energy Rep. 10, 3474–3493. doi:10.1016/j.egyr.2023.10.022
Rediske, G., Burin, H. P., Rigo, P. D., Rosa, C. B., Michels, L., and Siluk, J. C. M. (2021). Wind power plant site selection: a systematic review. Renew. Sustain. Energy Rev. 148, 111293. doi:10.1016/j.rser.2021.111293
ReVelle, C. S., Scholssberg, M., and Williams, J. (2008). Solving the maximal covering location problem with heuristic concentration. Comput. Oper. Res. 35 (2), 427–435. doi:10.1016/j.cor.2006.03.007
ReVelle, C. S., and Swain, R. W. (1970). Central facilities location. Geogr. Anal. 2 (1), 30–42. doi:10.1111/j.1538-4632.1970.tb00142.x
Ricks, W., Voller, K., Galban, G., Norbeck, J. H., and Jenkins, J. D. (2024). The role of flexible geothermal power in decarbonized electricity systems. Nat. Energy 10, 28–40. doi:10.1038/s41560-023-01437-y
Shadman Abid, M., Ahshan, R., Al-Abri, M., and Al Abri, R. (2025). Spatiotemporal forecasting of solar and wind energy production: a robust deep learning model with attention framework. Energy Convers. Manag. 26, 100919. doi:10.1016/j.ecmx.2025.100919
Shakoor, R., Hassan, M. Y., Raheem, A., and Wu, Y. (2016). Wake effect modeling: a review of wind farm layout optimization using Jensen's model. Renew. Sustain. Energy Rev. 58, 1048–1059. doi:10.1016/j.rser.2015.12.229
Su, J., Xie, Y., Zhao, H., Xu, Y., Lin, X., Shi, C., et al. (2024). High-performance Chinese ink flower-shaped evaporator: intensified heat through light concentration to achieve water-energy balance. Chem. Eng. J. 496, 153764. doi:10.1016/j.cej.2024.153764
Villanueva, D., and Feijóo, A. (2010). Wind power distributions: a review of their applications. Renew. Sustain. Energy Rev. 14 (5), 1490–1495. doi:10.1016/j.rser.2010.01.005
Wang, C., Han, C., Guo, T., and Ding, M. (2023a). Solving uncapacitated P-Median problem with reinforcement learning assisted by graph attention networks. Appl. Intell. 53 (2), 2010–2025. doi:10.1007/s10489-022-03453-z
Wang, S., Liang, H., Zhong, Y., Zhang, X., and Su, C. (2023b). DeepMCLP: solving the MCLP with deep reinforcement learning for urban facility location analytics. SDSS. doi:10.25436/E2KK5V
Wang, S., Wu, J., Xiang, M., Wang, S., Xie, X., Lv, L., et al. (2024b). Multi-objective optimisation model of a low-cost path to peaking carbon dioxide emissions and carbon neutrality in China. Sci. Total Environ. 912, 169386. doi:10.1016/j.scitotenv.2023.169386
Wang, Y., Cai, Z., Guo, L., Li, G., Yu, Y., and Gao, S. (2024a). A spherical evolution algorithm with two-stage search for global optimization and real-world problems. Inf. Sci. 665, 120424. doi:10.1016/j.ins.2024.120424
Wu, M. C., Sun, Y., and Liu, Q. (2021). Research on wind farm site selection based on entropy modified G2 weighting-Mamdani fuzzy inference. Renew. Energy Res. 39 (10), 1347–1353. doi:10.13941/j.cnki.21-1469/tk.2021.10.011
Xia, C. L., and Song, Z. F. (2009). Wind energy in China: current scenario and future perspectives. Renew. Sustain. Energy Rev. 13 (8), 1966–1974. doi:10.1016/j.rser.2009.01.004
Xu, J., He, D., and Zhao, X. (2010). Status and prospects of Chinese wind energy. Energy 35 (11), 4439–4444. doi:10.1016/j.energy.2009.06.058
Yousef, B. A., Obaideen, K., AlMallahi, M. N., Alajmi, N., Radwan, A., Al-Shihabi, S., et al. (2024). On the contribution of concentrated solar power (CSP) to the sustainable development goals (SDGs): a bibliometric analysis. Energy Strateg. Rev. 52, 101356. doi:10.1016/j.esr.2024.101356
Yu, K., Song, Y., Lin, J., and Qu, S. (2025). Evaluating complementaries among urban water, energy, infrastructure, and social Sustainable Development Goals in China. J. Environ. Sci. 149, 585–597. doi:10.1016/j.jes.2024.01.051
Zhang, D., Zhang, X. L., He, J. K., and Chai, Q. M. (2011). Offshore wind energy development in China: current status and future perspective. Renew. Sustain. Energy Rev. 15 (9), 4673–4684. doi:10.1016/j.rser.2011.07.084
Zhang, Y., Li, Z., and Liu, H. (2023). Multi-task graph neural networks for equitable healthcare facility placement. IEEE Trans. Neural Netw. Learn. Syst. 34 (5), 2102–2112. doi:10.1109/TNNLS.2023.1012345
Zhao, X., Cai, Q., Zhang, S., and Luo, K. (2017). The substitution of wind power for coal-fired power to realize China's CO2 emissions reduction targets in 2020 and 2030. Energy 120, 164–178. doi:10.1016/j.energy.2016.12.109
Zhong, Y., Wang, S. H., Liang, H. J., Wang, Z. B., Zhang, X. Y., Chen, X., et al. (2024). ReCovNet: reinforcement learning with covering information for solving maximal coverage billboards location problem. Int. J. Appl. Earth Obs. Geoinf. 128, 103710. doi:10.1016/j.jag.2024.103710
Zhou, Y. S., Zhang, Y., Wang, H. J., Tang, R. L., and Yuan, C. Q. (2023). Site selection assessment of wind farm based on ArcGIS and multi-factor model. Acta Energiae Solaris Sin. 44 (12), 251–259. doi:10.19912/j.0254-0096.tynxb.2022-1291
Keywords: onshore wind power station, spatial analysis, location problem, deep reinforcement learning, multi-objective optimization
Citation: Gao Y, Dong H, Hu L, Zeng F, Gao Y, Huang Z and Wang S (2025) Deep reinforcement learning for multi-objective location optimization of onshore wind power stations: a case study of Guangdong Province, China. Front. Energy Res. 13:1596471. doi: 10.3389/fenrg.2025.1596471
Received: 19 March 2025; Accepted: 16 June 2025;
Published: 01 July 2025.
Edited by:
Matilde Santos, Complutense University of Madrid, SpainReviewed by:
Yirui Wang, Ningbo University, ChinaJulian Quick, Technical University of Denmark, Denmark
Copyright © 2025 Gao, Dong, Hu, Zeng, Gao, Huang and Wang. This is an open-access article distributed under the terms of the Creative Commons Attribution License (CC BY). The use, distribution or reproduction in other forums is permitted, provided the original author(s) and the copyright owner(s) are credited and that the original publication in this journal is cited, in accordance with accepted academic practice. No use, distribution or reproduction is permitted which does not comply with these terms.
*Correspondence: Shaohua Wang, d2FuZ3NoYW9odWFAYWlyY2FzLmFjLmNu