Lateral spread of orientation selectivity in V1 is controlled by intracortical cooperativity
- 1 Department of Neurobiology, Weizmann Institute of Science, Rehovot, Israel
- 2 Unité de Neurosciences Information et Complexité, UPR CNRS 3293, Gif-sur-Yvette, France
Neurons in the primary visual cortex receive subliminal information originating from the periphery of their receptive fields (RF) through a variety of cortical connections. In the cat primary visual cortex, long-range horizontal axons have been reported to preferentially bind to distant columns of similar orientation preferences, whereas feedback connections from higher visual areas provide a more diverse functional input. To understand the role of these lateral interactions, it is crucial to characterize their effective functional connectivity and tuning properties. However, the overall functional impact of cortical lateral connections, whatever their anatomical origin, is unknown since it has never been directly characterized. Using direct measurements of postsynaptic integration in cat areas 17 and 18, we performed multi-scale assessments of the functional impact of visually driven lateral networks. Voltage-sensitive dye imaging showed that local oriented stimuli evoke an orientation-selective activity that remains confined to the cortical feedforward imprint of the stimulus. Beyond a distance of one hypercolumn, the lateral spread of cortical activity gradually lost its orientation preference approximated as an exponential with a space constant of about 1 mm. Intracellular recordings showed that this loss of orientation selectivity arises from the diversity of converging synaptic input patterns originating from outside the classical RF. In contrast, when the stimulus size was increased, we observed orientation-selective spread of activation beyond the feedforward imprint. We conclude that stimulus-induced cooperativity enhances the long-range orientation-selective spread.
Introduction
Columnar organization is a prominent characteristic of the neocortex, in which neurons with similar response properties are grouped vertically (Mountcastle, 1957; Hubel and Wiesel, 1977). In the primary visual cortex, neurons are fed by the feedforward thalamic drive while their tuning properties are further shaped through the local recurrent intracolumnar network (Douglas and Martin, 1991). This constitutes a retinotopically organized contingent of afferents, resulting in a functionally homogeneous input set. In parallel to this retinotopic organization, an heterogenous plexus of intracortical and cortico-cortical inputs of various retinotopic origins converges onto these neurons.
Within the same cortical area, intrinsic horizontal axons link neurons that are separated laterally over distances of several millimeters and spatially distributed into regular clusters (Braitenberg, 1962; Fisken et al., 1975; Creutzfeldt et al., 1977; Gilbert and Wiesel, 1979; Rockland and Lund, 1982). Previous structural and electrophysiological studies of the connectivity rules among those clusters have yielded some controversial results. Initial studies established a notion of a “like-to-like” connectivity rules, namely that cortical columns connected by long-range horizontal connections had similar orientation tuning (e.g., Gilbert and Wiesel, 1989; Bosking et al., 1997). Other quantitative anatomical studies have demonstrated that this horizontal network preferentially connects (with an overall probability bias of about 1.5 times greater than chance) neurons having similar preferred orientations (Kisvarday et al., 1997; Schmidt et al., 1997). Electrophysiological studies reveal a more varied scenario. The orientation dependence of lateral interactions has been examined using extracellular recordings by concomitantly activating different visual positions. In one set of experiments, cross-correlation analysis showed that distant neurons indeed display stronger synchronized activity when their orientation preferences are similar (Michalski et al., 1983; Ts’o et al., 1986; Schwarz and Bolz, 1991). However, recent studies did not confirm this finding (Das and Gilbert, 1999). Interneurons (Kisvarday et al., 1994; Buzas et al., 2001), as well as stellate neurons in layer 4 (Yousef et al., 1999), and pyramidal neurons close to pinwheel centers (Yousef et al., 2001), reportedly connect lateral orientation columns in a cross-oriented or non-selective way, making the picture even more complicated. Furthermore, another set of studies provided evidence that the surround can modulate responses evoked by center stimulation yielding a high diversity of effects in terms of polarity, orientation tuning, and preference (Blakemore and Tobin, 1972; Maffei and Fiorentini, 1976; Nelson and Frost, 1978; Gilbert and Wiesel, 1990; Li and Li, 1994; Sillito et al., 1995; Levitt and Lund, 1997; Sengpiel et al., 1997; Polat et al., 1998). In addition, experiments in which horizontal interactions were selectively and locally inactivated supported the contention that lateral suppression originates from both iso- and cross-oriented sites (Crook and Eysel, 1992; Crook et al., 1998).
Feedback originating from higher cortical areas provides a more diffuse and divergent input to the primary visual cortex (Salin et al., 1989, 1992). To our knowledge, only one anatomical study, performed in the cat, has explored the orientation selectivity of feedback, suggesting that area 18 and area 17 cells are preferentially connected when they share similar preferred orientations (Gilbert and Wiesel, 1989). Electrophysiological studies of the functional impact of inactivation of higher cortical areas are more numerous, and show a much more diverse effective connectivity schema. One study showed that it is interesting to notice that, in contradiction to the results of the anatomical study referenced above, inactivation of area 18 did not affect the orientation tuning of area 17 cells (Martinez-Conde et al., 1999). Reversible inactivation was also used to explore the role of feedback from area 21a. Overall, these studies demonstrated almost no effects on preferred orientation in either broadening or sharpening of the orientation-tuning width of area 17 neurons (Wang et al., 2000, 2007; Huang et al., 2004; Liang et al., 2007; Shen et al., 2008). Along the ventral pathway, similar results were obtained by cooling of the posterotemporal visual area (Huang et al., 2007). Finally, inactivation of the posteromedial lateral suprasylvian area, a region involved in motion processing, induced no effect on orientation maps even though direction maps were affected (Galuske et al., 2002; Shen et al., 2006). Thus, feedback from higher cortical areas does not seem to influence in a systematic way the orientation preference of neurons in the primary visual cortex. Rather, it modulates the response amplitude and tuning width of area 17 neurons.
All in all, based on these observations, the effective functional selectivity of lateral (horizontal and feedback) inputs converging onto primary visual cortical neurons remains unknown. Indeed, any visual stimulation will activate, through inter- and intracortical pathways, all these lateral synaptic inputs with diverse orientation-tuning and functional interactions. What is missing is a quantitative measure of the input tuning that a given local region of area 17 or 18 receives from the periphery of its retinotopic representation. For that purpose, functional methods measuring synaptic activation at the subthreshold level are the most suitable, since stimulation of the periphery of a RF evokes only subthreshold activity (Bringuier et al., 1999). Most of the currently available knowledge relies on spiking rather than subthreshold synaptic activity for electrophysiological studies and on static rather than dynamic maps. Hence, it is not possible to tease apart the local from the lateral sources that contribute to the observed activity.
To address this question, we performed direct measurements of postsynaptic responses evoked by local oriented visual stimuli and characterized both the spatiotemporal patterns and the dynamic expression of their orientation tuning along the lateral spread of activity. Functional responses were recorded in vivo, using voltage-sensitive dye imaging (VSDI; Grinvald et al., 1984, 1999; Grinvald and Hildesheim, 2004), which allows excitatory and inhibitory synaptic responses integrated over a large population of neurons to be measured with both high spatial (<50 μm) and high temporal (millisecond) resolution. VSD signal from a single neuron soma is identical with the intracellular recording from that cell (Salzberg et al., 1973; Cohen et al., 1974; Grinvald et al., 1982). The VSD from a synchronously active population of cortical neurons is closely related to the intracellular signal of a single neuron in that population (Grinvald et al., 1999; Petersen et al., 2003). To determine the orientation selectivity and preference of lateral inputs converging onto a single target cell rather than onto a population, we also performed intracellular recordings. These combined studies offer, for the first time, both access to the divergence (VSDI) and convergence (intracellular) patterns of the visual input mediated by various connections.
Materials and Methods
Optical Imaging
Imaging experiments were conducted at the Weizmann Institute of Science. All surgical and experimental procedures were in accordance with NIH guidelines. Six hemispheres from area 18 and three from area 17 from seven cats were used for the VSDI study. Data from five more hemispheres, tested with only two orientations, confirmed the results obtained (not shown).
Surgery
Cats were initially anesthetized with i.m. ketamine (15 mg/kg) and xylazine (1 mg/kg), supplemented by atropine (0.05 mg/kg). Following tracheotomy, animals were artificially respirated and anesthetized with 1–1.5% halothane in an equal mixture of O2 and N2O. Halothane concentration was reduced to 0.6–1% during recording. The skull was opened above area 17 or 18 and the dura was resected. During recording, paralysis was achieved with pancuronium bromide administered by intravenous perfusion (0.2 mg/kg/h). Eye movements were abolished under these conditions, as proven by the stationarity over trials of cortical representation of the local stimuli (not shown) and regular checks of the area centralis position with a fundus camera. Eyes were fitted with zero-power contact lenses, and external lenses were used to focus them on the screen. A prism was placed in front of the ipsilateral eye to obtain convergence of the two eyes. ECG, EEG, expired CO2, and body temperature were continuously monitored during the experiment. Additional details have been described previously (Shoham et al., 1999).
Voltage-sensitive dye imaging
The exposed cortex was stained for 2.5–3 h with the oxonol dye RH-1691. A FUJIX HR Deltaron 1700 camera with an array of 128 × 128 detectors, each monitoring approximately 64 μm × 64 μm, was used for data acquisition. The camera was incorporated in a data acquisition environment that includes in-house software (DyeDAQ) and hardware. A detailed account of the current data acquisition set-up and procedure can be found elsewhere (Shoham et al., 1999). Data frames were acquired at a rate of 9.6 ms per frame.
Visual stimulation
Stimuli were circular high contrast sinusoidal luminance gratings with a spatial frequency of 0.6 cycles/deg (area 17) or 0.2 cycles/deg (area 18) and drifting in a single direction for 576 ms at 2 Hz (area 17) or 6 Hz (area 18). Four orientations (eight directions) were presented (0°, 45°, 90°, or 135°). The diameter of the local stimulus was 2° for area 17 and 3–4° for area 18. Local stimuli were presented at an eccentricity of 1–15°, depending on the cortical area location exposed by the craniotomy. Between stimuli the screen was blank with a uniform luminance of 49 cd/m2. Isoluminant stimuli were pseudo-randomly interleaved with recording epochs during which the screen was uniformly gray (blank condition). The stimuli were displayed binocularly using the VSG series three stimulator with a 38 cm × 29 cm, 640 pixel × 480 pixel monitor, at a distance of 57 cm from the cat’s eyes and at a refresh rate of 150 Hz.
Intracellular Recordings
These experiments were conducted in the Department of Integrative and Computational Neuroscience (UNIC) at CNRS (Gif-sur-Yvette, France). Long-duration (>1 h) intracellular recordings were performed in the area centralis representation (Horsley–Clarke coordinates P: 1.5–2.5, L: 1.5) in cat area 17. RF dynamics were studied both at the spiking and at the subthreshold level in 25 cells. Eight cells (out of 14) were selected for the Gabor dense noise analysis (Figure 7) and 11 cells were used to compare the orientation tuning of peripheral vs. center responses (Figure 10).
Surgical procedures
All surgical procedures were performed in conformity with national (JO 87–848) and European legislation (86/609/CEE) on animal experimentation, and strictly according to the recommendations of the Physiological Society, the European Commission, and NIH. Cats were initially anesthetized with althesin (Glaxo, 1.2 ml/kg; 10.8 mg/kg alfaxalone and 3.6 mg/kg alfadolone acetate given by intramuscular injection). Following tracheotomy, the cats were artificially ventilated and anesthetized with an intravenous flow of althesin (3 mg/kg/h) and pancuronium bromide (0.2 mg/kg/h) supplemented with glucose and isotonic saline. Phenylephrine chlorhydrate (5%) and atropine (1%) were instilled in the eye to retract the nictitating membranes, block adaptation, and dilate pupils. Artificial pupils (3 mm diameter) were used and appropriate corrective optical lenses were added. ECG and EEG were continuously monitored during the experiment and body temperature was maintained at 37°C. The artificial respiration rate was set to 25 breaths/min and the volume of inhaled air was adjusted to maintain expired pCO2 between 3.8 and 4.2%.
Intracellular recordings
Using an Axoclamp 2A amplifier in bridge mode, we recorded cells in the primary visual cortex intracellularly with sharp glass pipettes (70–90 MΩ) filled with 2 M potassium methyl sulfate and 4 mM potassium chloride. The average resting membrane potential was approximately −70 mV, and no retaining current was applied.
Visual stimulation
Data were processed and visual stimulation protocols were applied using in-house software (Gérard Sadoc, Acquis1-Elphy, Biologic CNRS–UNIC/ANVAR). After adequate band-pass filtering, the intracellular signal was sampled at 8 kHz. The RF map was first established using sparse noise mapping to determine the spatial extent of the RF. Orientation-tuning curves (n = 15) were measured using gratings whose spatial extent within the visual field was restricted to the “center-only” or “surround-only” configurations. For an additional population of cells (n = 12), we used a dense noise stimulation regime by stimulating with a 5 × 5 mosaic of Gabor stimuli centered on the RF. The spatial extent of the RF was used to define the location and size of the central pixel for the center/surround protocols. The optimal spatial frequency (and phase in Simple cells) was derived from the tuning protocols. Each Gabor patch could have four different orientations (separated by 45° steps) with an optimal or a null spatial phase. Therefore, for each position at each temporal frame (6.5–33 ms), the stimulus was chosen randomly among the eight possible Gabor-oriented patches and one uniform luminance patch. Background luminance was 12 cd/m2 and the Gabor patch contrast was kept high enough (0.3–0.9) to elicit a detectable subthreshold intracellular response following presentation of a single patch.
Signal and image processing for VSDI and intracellular recording are described in the Section “Appendix.”
Results
To characterize the orientation selectivity of the lateral spread of activation, we performed optical imaging in cat primary visual cortex area 17 and area 18 during presentation of local oriented sinusoidal luminance gratings. The stimulus was presented through a circular aperture whose size was adjusted to the average RF dimensions (Orban, 1984). We also compared the maps evoked by local stimuli to the cortical activation obtained with full-field.
Dynamic Activation of Cortical Territory Beyond the Feedforward Imprint
Stimuli were presented for 576 ms at four different orientations, and responses were imaged at a temporal resolution of 9.6 ms. Figure 1A shows time-series examples of the evoked response averaged over the four orientations and normalized by a “blank” stimulus, in area 17(upper row). Superimposed on each data frame, a white contour delimits the domain within which pixel activation was significantly higher, on a trial-by-trial basis, than the spontaneous level (p < 0.05, see Appendix). The time sequence shows an initial local activation at a latency of about 40 ms after stimulus onset. This activation gradually spreads over most of the imaged cortical surface (Grinvald et al., 1994; Sharon et al., 2007). The speed of this long-range lateral spread, estimated from latency analysis in successive region of interest (ROI; Figure 1B), was about 0.09 m/s. The spatial extent of the spread was 29.1 mm2 (equivalent to a radius of 3.0 mm radius for a disk of same surface hereafter abbreviated as ER) a value bounded by the optical chamber size.
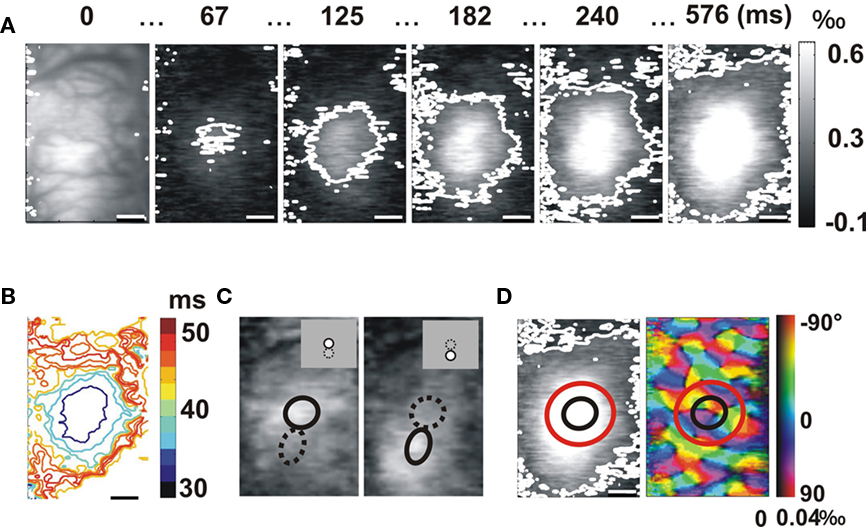
Figure 1. Voltage-sensitive dye imaging of the lateral spread away from the feedforward imprint. (A) Time-series of the cortical response propagation evoked by a local stimulus (averaged over four orientations). The example is from area 17, in response to a stimulus of diameter 2° and eccentricity of 4.1° (average of 28 trials). The white contour delineates the region significantly activated (see Appendix). Time after stimulus onset is given above each frame. The imaged cortical area is shown in the first frame. (B) Latency map. In successive regions of interest delimited by their outer boundary, the color code indicates the latency of the averaged time-course of the activation spread. (C) Retinotopy. The responses to two adjacent positions are shown, averaged over the first time frames. Each averaged cortical response was fitted by a 2D Gaussian function. The size of the retinotopic cortical areas representing the visual stimuli (black ellipses) was inferred from the cortical distance between the two Gaussians centers (stimuli were adjacent and of same size). (D) Left column: retinotopic limit (black ellipse) and feedforward imprint limit (red ellipse) of the stimulus superimposed over the late activation map (576 ms). Right column: orientation map in response to a full-field stimulus. Color hue and brightness code respectively for the preferred orientation and the strength of the orientation tuning.
An important task was to determine whether this lateral spread reaches cortical territory that is not directly activated by the thalamic input stream. For each experiment, we systematically performed retinotopic mapping by presenting local stimuli in adjacent visual positions. Figure 1C illustrates averaged response maps obtained in response to two adjacent stimuli presented one above the other (insets). A 2D Gaussian function was fitted to each activation pattern. We computed local magnification factors by comparing the cortical distance between the centers of gravity of the cortical activations and the visual distance between the centers of each stimulus. In Figure 1C, the cortical representations were 1.3 mm apart for 2° of visual separation in area 17 (2° diameter, flashed at 4.1° and 2.1° vertical eccentricity). We used these local magnification factors to approximate the extent of the retinotopic representation in Figure 1C (black ellipse). If we superimpose the retinotopic representation of the stimulus on the area covered by the spread (Figure 1D), it is obvious that the lateral spread indeed covers cortical territory representing visual positions originating from the stimulus surround.
However, this remote territory may contain neurons with RFs that can be partially activated by the stimulus. Effectively, within a given cortical column the RFs sizes and positions of each neurons are not identical but show a significant spatial scatter that was extensively quantified in the seminal paper of Albus (1975). In order to predict, under the present stimulus conditions, the proportion of neurons directly or partially activated by the feedforward stream, referred to later in the text as the “feedforward imprint,” we computed a retino-cortical mapping function on the basis of retino-cortical magnification factors, RF sizes, positions, and scatters measured by Albus (1975; see Figure A1 in Appendix). This calculation ignores, for the sake of quantitative approximation, the non-smoothness of the cortical response field (Sharon et al., 2007). For the stimuli used in the example given in Figure 1, the feedforward imprint has a Gaussian shape with a SD of 1.3 mm (see Figure A1 in Appendix), very close to our VSD retinotopic mapping measurements (1.3 mm). The total cortical region that contains activated neurons remains within a territory of 2.6 mm (95% of the Gaussian activation, mean ± 1.96 SD), closely comparable to the spatial subunit described by Albus (2.5 mm; Albus, 1975). If we superimpose this predicted feedforward imprint (red ellipses, Figure 1D) on the activation maps at a late latency (576 ms), it appears that the lateral spread (white contour) has activated distal regions where RFs were not directly activated, even partially, by the feedforward input stream (Figure 1D).
After verifying that VSDI allows to visualize activation away from the feedforward imprint, we set out to determine whether this lateral activation is orientation selective.
Loss of Orientation Selectivity Along the Lateral Activation Spread
Two extreme hypotheses are worth examining while exploring the orientation selectivity along the lateral spread of activity. If the lateral spread activates only distant orientation columns sharing similar preferred orientations (Figure 2A, patchy red spread for a vertical stimulation), any oriented stimulus will generate a feedforward activation whose orientation preference would be preserved along the lateral spread. If, however, the lateral spread over long distances activates all columns independently of the preferred orientation of the target site (Figure 2B, red spread is non-patchy at long distances), the tuning selectivity will fade out along the activation path. The predicted outcomes of these two possibilities can be visualized by using a simplified model that combines the measured spread (Figure 1A) with the observed full-field orientation map (Figure 1D, right). According to the first hypothesis, it should be possible to observe propagation of the orientation map at any location to which activation spreads (Figure 2A, lower row). In contrast, the second hypothesis predicts that the orientation-selective response will not spread (Figure 2B), but instead remain confined to the feedforward stimulus imprint (red circle in Figure 2 lower row).
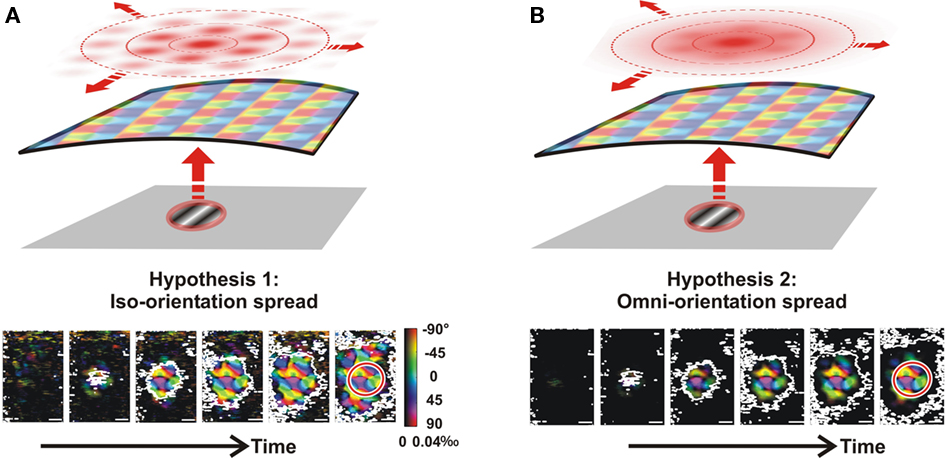
Figure 2. Predictions based on two distinct connectivity rules applied to the lateral network. (A) Iso-orientation hypothesis: a given local oriented stimulus (here vertical, red) will generate a cortical spread (top red spread) that will preferentially activate columns preferring the same orientation. To predict the expected orientation maps for this hypothesis (bottom row), we multiplied the observed single-orientation maps (full-field stimulation; Figure 1D) by the observed cortical spread function (Figure 1A). (B) Omni-orientation hypothesis: a given local oriented stimulus will activate all columns along the activation spread, irrespective of their orientation preference. The predicted pattern (bottom row) is given this time by the product of the same cortical spread function with single-orientation maps previously filtered by the feedforward imprint function (Figure 1).
Figure 3 shows the orientation tuning of the spread for two examples in area 17 (Figures 3A–C) and area 18 (Figures 3D–F). In marked contrast to the pattern of widely spreading activation that expanded continuously during the response time-course (white contour in Figure 1A), the significant orientation-selective component remained spatially confined throughout the whole time-course of the response (white contour in Figures 3A,D; also compare white and gray contours in Figures 3B,E, corresponding respectively to the averaged orientation-selective and activated areas; see Movie S1 in Supplementary Material). This result is in agreement with the prediction of the second hypothesis (Figure 2B), which postulates that the lateral spread activates columns independently of their preferred orientation. In these examples, the largest orientation-selective cortical area was found to be restricted to an average value of 5.5 mm2 (area 17) and 4.2 mm2 (area 18), comparable to the areas of the predicted feedforward imprints (see inset of Figures 3C,F, and compare the black and red contours corresponding respectively to the orientation-selective area and the predicted feedforward imprint limit), whereas an area of 31.3 mm2 and 29.1 mm2 (ER: 3.2 and 3.1 mm) was significantly activated for the same hemispheres. Note that, for the area 18 example, the retinotopic representation of the horizontal visual axis is elongated along the antero-posterior cortical axis, as expected for this area (Tusa et al., 1979). These results were consistent across cortices (n = 9, Figure 4A): the orientation-selective area averaged over nine hemispheres was 5.5 ± 1.4 mm2 (ER: 1.3 ± 0.2 mm), while the global activation gradually recruited the whole imaged cortex equivalent to 26.2 ± 2.7 mm2. Note that these areas are much larger than the number of pixels that are spontaneously active above significance level (see spurious activation at frame 0 ms in Figure 1A and 3A,D, and baseline level in Figures 3C,F).
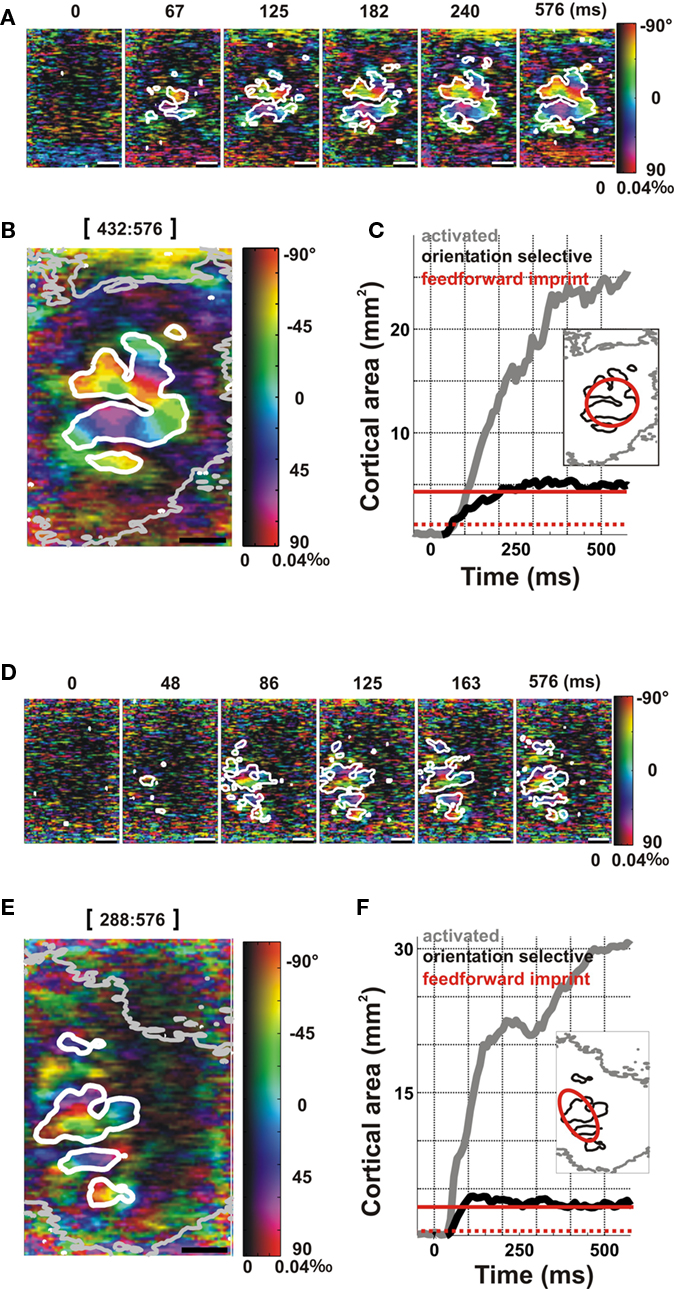
Figure 3. Orientation selectivity vanishes along the lateral spread, in response to a local oriented stimulus. Examples are from area 17 (A–C, same as Figure 1) and area 18 (D–F). (A,D) Time-series of polar orientation maps. The white contour delineates the region within which pixels are significantly selective to orientation (see Appendix). Time after stimulus onset is given above each frame. (B,E) Polar map averaged over the latest time frames of the response (indicated above the frame). Contours delineate the outer border of the cortical domain within which significant activation level (thin gray contour, see Figure 1A) or significant orientation-selective response (thick white contour) are observed. (C,F) Spatial extent of the activated area (gray) and of its orientation-selective component (black) as a function of time. Red line indicates the expected limit of the feedforward imprint, as computed in Figure 1. Dotted red line indicates the retinotopic area of the stimulus representation. Inset: The spatial extent of the activation spread (gray) and the orientation-selective activation (black) are shown in comparison with the expected limit of the feedforward imprint (red).
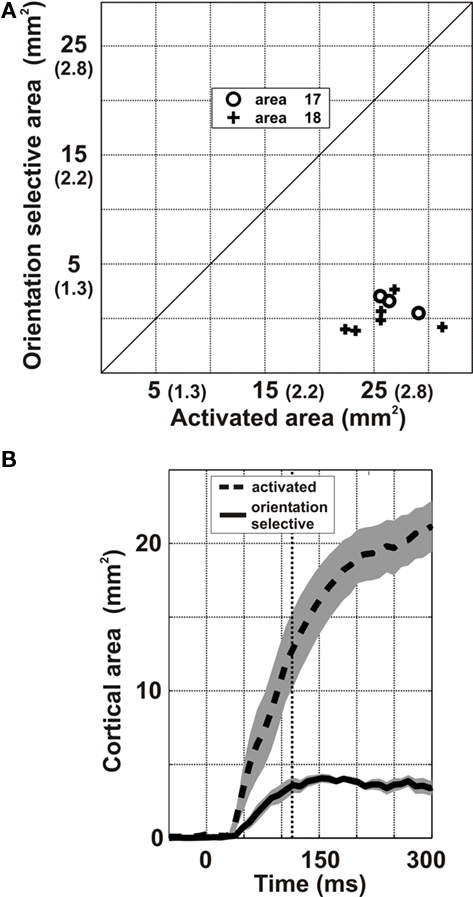
Figure 4. Group analysis of the lateral spread areas. The analysis was generalized over nine hemispheres [three in area 17 (o) and six in area 18 (+)]. (A) Maximal extent of the orientation-selective region is plotted as a function of the maximal extent of the activated region (expressed in area or equivalent radius units). (B) Averaged time-course (from stimulus onset) of the size of the activated area (dashed) and of its orientation-selective component (continuous). The shaded area indicates ±SEM around the mean, over all hemispheres.
The dynamics of the orientation-selective and activation areas (Figures 3C,F) were similar across hemispheres (Figure 4B). The extent of activation (gray curve, Figures 3C,F and 4B) increased continuously over the whole stimulation period. In contrast, the orientation-selective area (black curve, Figures 3C,F and 4B) reached a plateau within 76 ms and remained spatially restricted to the predicted feedforward imprint area (continuous red line). The possibility that the lack of orientation selectivity along the lateral activation spread is merely due to the decrease in the signal-to-noise ratio away from the center of cortical activation was ruled out by comparing the relationship between VSD activation levels and orientation selectivity in different cortical regions and stimulus conditions (Figure A2 in Appendix).
Iso-Orientation Preference of the Lateral Spread
In the previous section we showed that orientation tuning decreases when the cortical activation pattern spreads beyond the feedforward imprint of the stimulus. However, this finding does not preclude the possibilities that (i) the orientation preference of lateral activation spread remains biased toward iso-orientation or that (ii) the spread is selective but not uniform over the cortex for all the single-condition maps inspected. These two possibilities are further examined here. To quantify the decrease in orientation preference with propagation distance, we delimited cortical regions that successively reached significant activation levels along the lateral spread when moving away from the feedforward imprint limit (red contours in the insets of Figures 3C,D). This resulted in the delineation of incremental nested ROIs (nROIs) of progressively larger eccentricity relative to the initial site of feedforward activation (Figure 5A2; see Appendix for Methods). These concentric nROIs were then analyzed for two independent attributes of the orientation-selective response: preferred orientation and modulation depth.
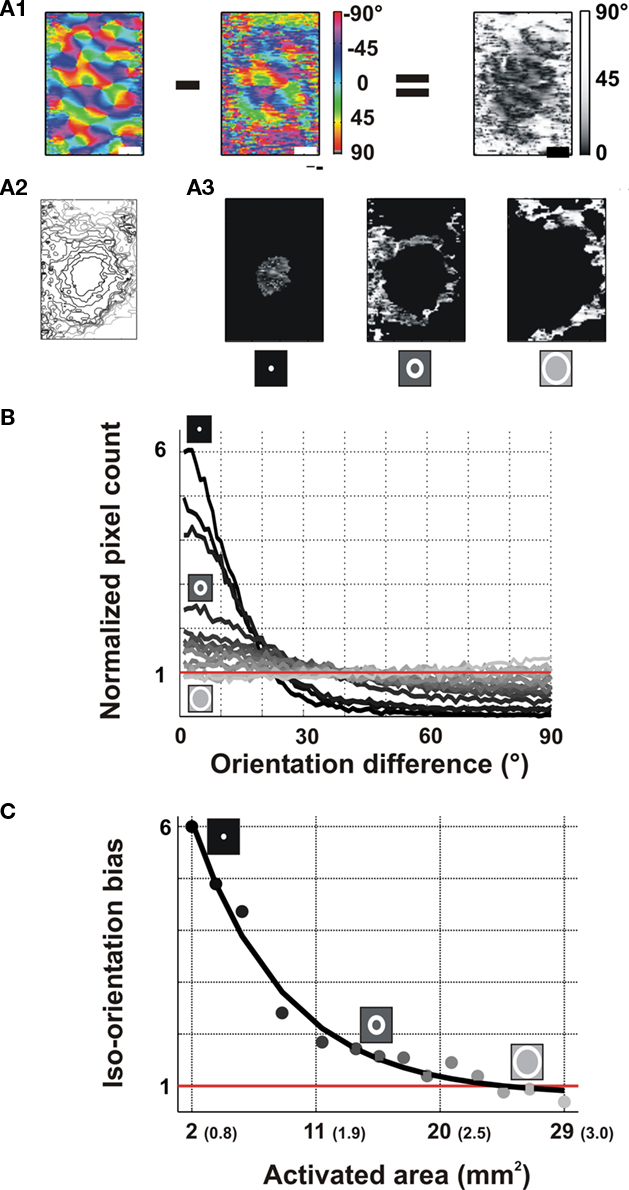
Figure 5. Spatial decay of orientation preference with cortical lateral distance. Example is from area 17 (same as Figure 1). (A) Definition of the region of interest. (A1) Preferred orientation maps evoked by full-field stimuli (left, used as a reference map) were subtracted to the one evoked by local stimuli (middle) in order to compute an orientation difference map (right). (A2) Nested regions of interest (nROI) were delineated by concentric zones of incremental activation defined by the lateral spread. (A3) These nROIs were applied on the orientation difference map. (For illustration purposes, only 3 out of 13 nROIs are shown). (B) Distributions of the orientation differences within each nROIs. These distributions were normalized by the total number of pixels. (chance level expected from a uniform distribution is 1.0). Brightness of traces codes for the more lateral nROI (cartoon insets). (C) Iso-orientation bias as a function of the spatial eccentricity of the lateral spread (total cortical area delimited by the outer edge of each nROI; equivalent radius is indicated in parenthesis). Note that the first point corresponds to the area of the initial cortical activation. Exponential fit is shown in black.
Figure 5 illustrates the decrease in orientation-preference accuracy along the lateral spread. Accuracy was defined for each pixel as the difference between the preferred orientation of the column when activated directly (feedforward activation) and its preferred orientation when activated by the lateral input. Figure 5A1 (left) shows, for the same area 17 hemisphere as in Figure 3A, the averaged orientation map obtained from responses to full-screen stimuli, which defines the reference orientation-preference maps. The orientation-preference map evoked by local stimulation (Figure 5A1, middle) matched the corresponding reference map only at the central core of the cortical activation area, as shown in the subtraction map (Figure 5A1 right). This decrease in orientation-preference accuracy occurs gradually over more and more eccentric regions delimited by the nROIs (Figure 5A2). Within each successive nROI (Figures 5A3), an iso-orientation bias was calculated as the average (over all pixels) of the difference between the preferred orientation for local stimulation and the reference value (see Appendix for Methods). Whereas the first significantly activated region showed iso-orientation biases that were six times greater than expected by chance, for more eccentric nROIs the bias disappeared (Figure 5B lighter curve). Along the lateral spread, activation of the cortical columns of all orientations became less and less accurate. In Figure 5C this observation is quantified along the entire spread (see Appendix). Decay of the iso-orientation count was fitted with an exponential function that gave a decay space constant of 6.6 mm2 (851 μm when fitted in the ER dimension). These different quantifications show that both the orientation-tuning significance and the orientation-preference accuracy decrease to baseline when the lateral activation spreads away from the feedforward imprint.
When applying this analysis to all nine hemispheres, we observed a mean decrease in orientation selectivity with an exponential decay space constant of 8.3 mm2 (ER: 1074 μm) for the loss of iso-orientation preference (Figure 6A). To gauge the functional impact of the decrease in orientation selectivity with distance, we also measured cortical distance in terms of numbers of hypercolumns (Hubel and Wiesel, 1977). For that purpose, we applied a Voronoi tessellation to partition the orientation map into pinwheel territories (Figure 6B). For each nROI, we re-identified the rates of orientation-preference loss in functional units. Pinwheel neighborhood order showed a similar tendency, although with more scatter, with decay constants of 1.0 pinwheels units (Figure 6C).
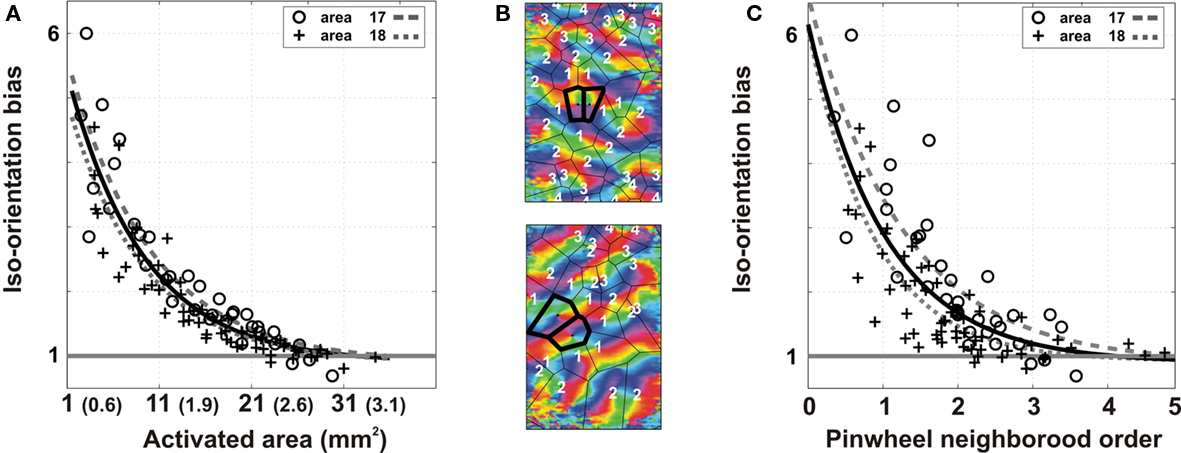
Figure 6. Group analysis of the spatial decay of orientation preference. The analysis was generalized over nine hemispheres [three in area 17 (o) and six in area 18 (+)]. (A) Decrease in the iso-orientation bias with lateral propagation distance is plotted as a function of the total area and equivalent radius. (B) Two examples of voronoi tessellation to partition orientation maps into pinwheel territories are shown (top: area 17; bottom: area 18). The first two activated pinwheel territories are identified as the primary activated hypercolumn (bold contour). Neighboring orders of all the other hypercolumns relative to this primary hypercolumn are shown as white numbers. (C) Same data as in (A) is now plotted as a function of the pinwheel neighborhood order. Exponential fits are given for the total population (dark) and for the area 17 (gray dashed) and area 18 (gray dotted) sub-populations.
Orientation-Tuning Strength of Lateral Spread in the Single-Orientation Condition
Another independent measure that is classically used to characterize the selectivity tuning of orientation maps is the modulation depth (Figure 7), defined within each single-orientation map as the difference in the responses between columns that are respectively iso-oriented and cross-oriented to the orientation of the stimulus (Sharon and Grinvald, 2002). Accordingly, to delimit the two complementary sets of orientation columns, we computed differential orientation maps from their respective responses to full-field stimuli of orthogonal orientations (Figure 7A1) for each single orientations (Figure 7A2 left, here vertical orientation is used as an example). This segmentation was then applied on local single-condition maps (Figure 7A3) for each nROI (Figure 7A2, right). Modulation depth was computed as the difference in response between pixels belonging to iso- (preferred, delimited by cyan contours in Figure 7A3) and cross-oriented (orthogonal, delimited by red contours in Figure 7A3) columns. For each oriented local stimulus, we thus obtained the amplitude dynamics of the orientation-selective component of the response along the lateral spread. In Figure 7B, modulation depth is plotted as a function of the area of the activated cortex. Data points corresponding to the four tested orientations are color coded. The black trace is the exponential fit over all four orientations and shows that modulation depth decreases gradually with lateral spread and converges to a null value. In other words, preferred and orthogonal columns were equally activated along the lateral spread. The exponential fit of the lateral decay yielded space constants of 8.2 mm2. At equivalent radial distances of 998 μm from the center of the initial activation region, orientation selectivity, as estimated by modulation depth, dropped to 1/e of its peak value. In summary, both the absolute orientation-preference bias and the tuning selectivity were found to decrease, and their spatial decay constants were identical.
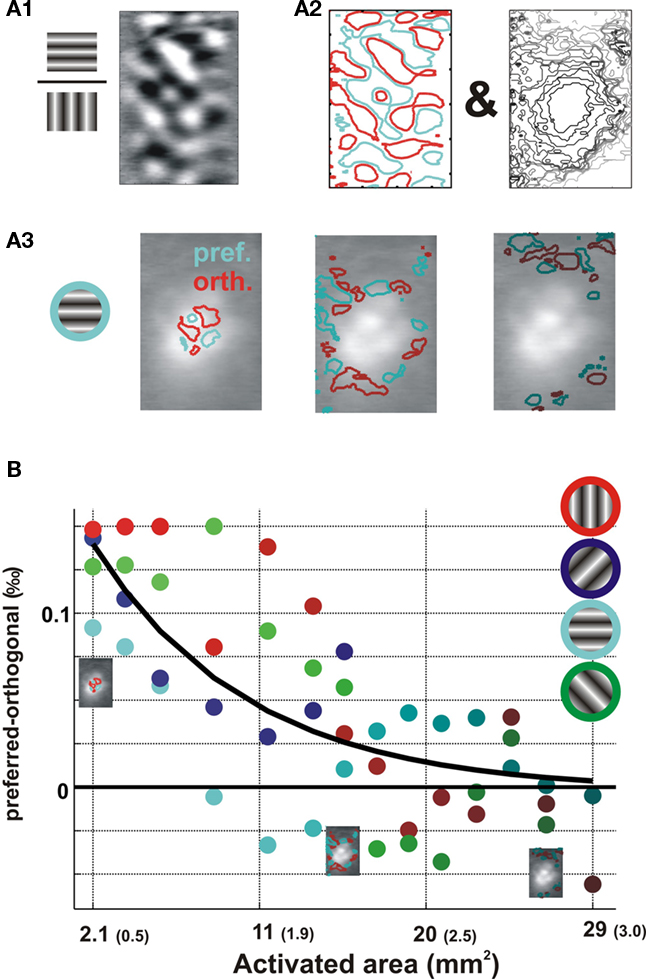
Figure 7. Spatial decay of modulation depth of the orientation tuning with cortical lateral distance. Example is from area 17 (same as Figure 1; A) Definition of the region of interest is illustrated for the horizontal orientation condition. (A1) Differential maps obtained by dividing the maps evoked by horizontal vs. vertical full-field stimuli. (A2) Two types of ROIs were defined: (i) Cortical territories preferring horizontal (cyan contour) or vertical (red contour) orientations were defined from the differential maps; (ii) and nested region of interest (nROI, right, same as Figure 5A2). (A3) The two ROIs were merged to partition the map into overlaid regions of interest of preferred- and orthogonal-orientation pixels. (B) We computed, for each nROI and for each condition, the response difference between preferred and orthogonal ROIs. This difference gives, in per mil of overall fluorescence (‰), the condition-wise response modulation depth. Modulation depth, averaged between 125 and 600 ms for each tested orientation (color coded), as a function of the total area within the outer contour of each nROI (the equivalent radius values are indicated in parenthesis). Exponential fit is shown in black.
Applying the above analysis to all of the nine imaged hemispheres revealed a similar trend, a mean decrease in modulation depth was observed with an exponential decay space constant of 9.8 mm2 (EP: 1206 μm; Figure 8A) or 1.2 pinwheels units (Figure 8B). Hence, both the absolute orientation-preference bias and the tuning selectivity decrease with identical spatial decay constants.
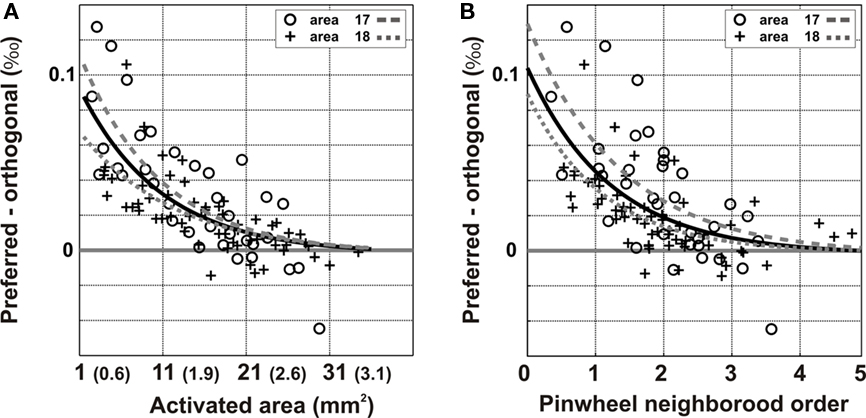
Figure 8. Group analysis of the spatial decay of modulation depth. The analysis was generalized over nine hemispheres [three in area 17 (o) and six in area 18 (+)]. (A) Decrease in condition-wise modulation depth with lateral propagation distance as a function of the total area and equivalent radius or as a function of the pinwheel neighborhood order (B). Exponential fits are given for the total population (dark) and for the area 17 (gray dashed) and area 18 (gray dotted) sub-populations.
Loss of Orientation Selectivity is the Result of a Diversity of Convergence Connectivity Patterns at the Single Cell Level
The VSD signal results from the spatial averaging of the activity of thousands of neighboring neurons (Shoham et al., 1999) and pools various sources of input impinging on cells situated in the same map pixel. Non-selective propagation revealed here by VSDI could potentially originate from different connectivity scenarios between single cells. One scenario reflects a common convergence schema: each target cell receives lateral input from all possible preferred orientations (Figure 9A). An alternative scenario is that a diversity of selective connectivity patterns are pooled along the column: each target cell receives orientation-selective lateral input but this preferred presynaptic orientation may differ from position to position (Figure 9B). When measured with VSDI, the population averaging would smooth out such microscopic diversity and detect only a global non-selective propagation.
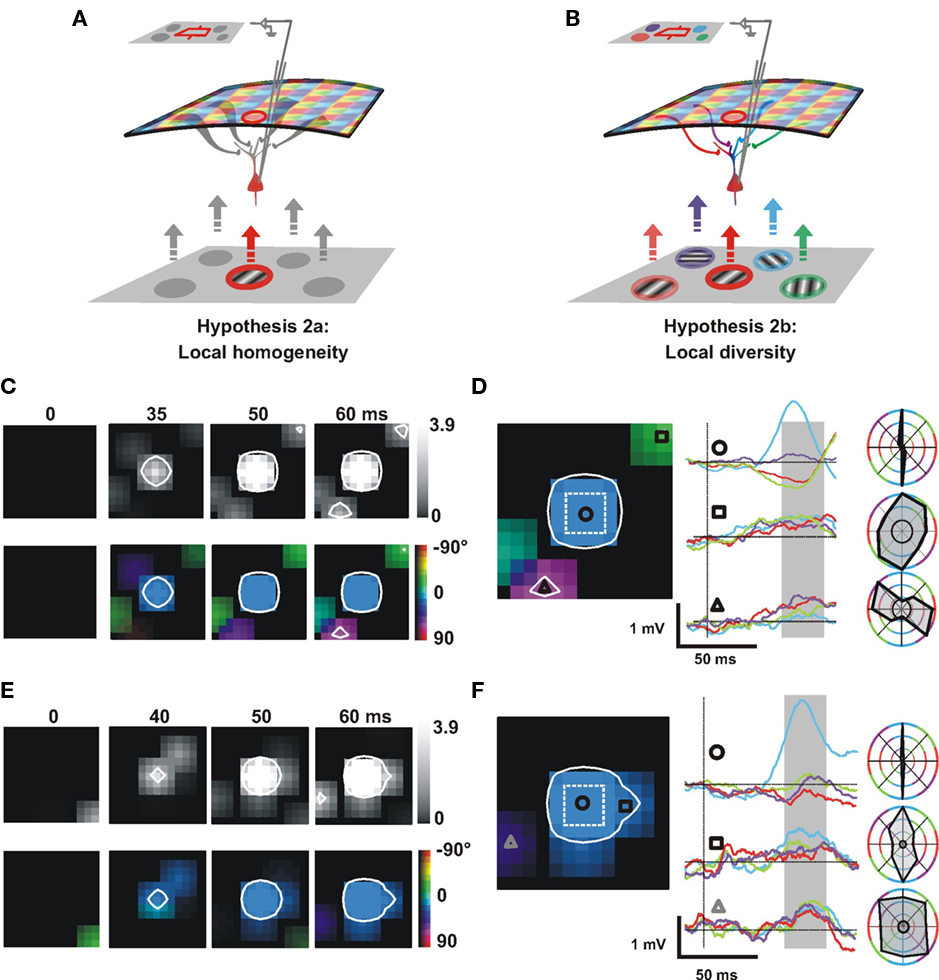
Figure 9. Orientation selectivity and preference of the lateral synaptic input explored by intracellular recordings. (A,B) Intracellular recording gives access to the convergence of lateral inputs. Local oriented stimuli presented in the surround of the receptive field (RF, cyan) activate different cortical orientation columns that evoke converging spreads integrated by the recorded cell. Two scenarios are proposed. (A) All surround positions evoke lateral spread of activity untuned to orientation or (B) responses evoked by surround positions are selective to orientation, but for different preferred orientations. (C–F) Intracellular responses to dense orientated Gabor patch noise are shown for two different cells (cell 1: C–D; cell 2: E–F). The central element of the 5 × 5 exploration grid (dotted square in D,F) matches in size the subthreshold receptive field mapped with sparse noise (3.5° × 3.5° for cell 1 and 4.5° × 4.5° for cell 2). (C,E) Time-series of the spatial extent of the subthreshold activation field (averaged over all orientations) and color coded map of the subthreshold orientation preference (see Appendix). The white contours delineate the significant responsive regions when combining both amplitude and orientation-selectivity criteria (p < 0.002; see Appendix). Time from stimulus onset is indicated above each frame. (D,F) Left: visuotopic orientation map of the intracellular subthreshold response; Middle: averaged subthreshold responses to four different orientations (same color code) presented for particular locations (circle, triangle, and square); scale bars: 50 ms and 1 mV; Right: normalized orientation-tuning curves, integrated within a fixed temporal window (shaded area of middle panel). The black circle indicates the spontaneous level for the depolarizing integral measure.
To distinguish between these two scenarios, we performed intracellular recordings to dissect the orientation tuning of synaptic inputs converging onto the recorded cell. The reasoning here is that instead of observing the divergence of the activation spread across the retinotopic map, as measured by VSDI, intracellular recording measures the visuotopic synaptic convergence onto a single neuron.
To measure the orientation selectivity of the lateral synaptic input activated by stimulation of the RF surround, we analyzed responses to a continuously updated array of local Gabor stimuli of random orientation. Subthreshold responses were averaged relative to each position and orientation of the Gabor stimulus (Figures 9C–F). From the significant responses we extracted two components: the mean response strength to the stimulation at a particular pixel position (averaged over all the possible orientations) and the selectivity of this response to the orientation of the stimulation (see Appendix). Figures 9C,E shows an example of smoothed z-score maps which describe the dynamics of these two components as a function of the spatial position. The top row corresponds to the response strength for each position, and the orientation selectivity is color coded in the bottom row (same code as for VSDI). In both cases, the white contour delineates significant synaptic response (see Appendix for Methods).
The first cell (Figures 9C,D) illustrates a case of lateral recruitment by a diversity of oriented inputs. Peripheral “hot spots” significantly activate the recorded neuron after a delay compatible with horizontal propagation at slow speed (Bringuier et al., 1999). These peripheral positions also evoke subthreshold significant orientation-selective responses but with an orientation preference depending on their location (square and triangle in Figure 9D, see another example with late peripheral responses, Movie S2 in Supplementary Material). The second cell (Figures 9E,F) illustrates a case of an untuned peripheral response. The peripheral hot spot indicated by a triangle (Figure 9F) shows significant response strength but no orientation selectivity. See Figure A3 in Appendix for a detailed quantification of the orientation-tuned responses and their statistical significance. Note that at short-range distances (square) the observed iso-orientation bias is similar to that observed with VSDI (see another example as Movie S3 in Supplementary Material).
The population analysis combines 18 hotspots of input activation originating from the subthreshold RF surrounds of eight cells. In this analysis, each hotspot is considered as an individual data point, since it corresponds to a distinct input source to the recorded cell. In Figure 10A we measure the probability for any area 17 cell to receive inputs of various selectivity and orientation preference. The graph represents the circular variance (1 – selectivity index), as a function of the relative preferred orientation for each hotspot, defined as the difference between preferred orientation measured at the spiking level when stimulating the RF center and the preferred orientation of activity evoked in the “silent” periphery. A uniform distribution is observed, with 44% of orientation differences less than 30°, 28% within the range 30–60° and 28% within 60–90°. No particular tendency was found in favor of iso-oriented configuration and linear regression showed no significant relationship between circular variance and orientation preference. Since the circular variance ranged between low (selective) and high (unselective) values, we can reject the first scenario of exclusive recruitment of untuned lateral input: cells tend to integrate a mixture of orientation-tuned sources sampled across the RF surround. In spatial terms, the activated hotspots in the RF surround were on average 4.2 ± 1.4° away from the RF center. From the delays of peripheral responses, we calculated that they were conveyed to the recorded cells with an apparent speed of horizontal propagation of 0.12 ± 0.16 m/s (see Grinvald et al., 1994; Bringuier et al., 1999; Chavane et al., 2000; Jancke et al., 2004).
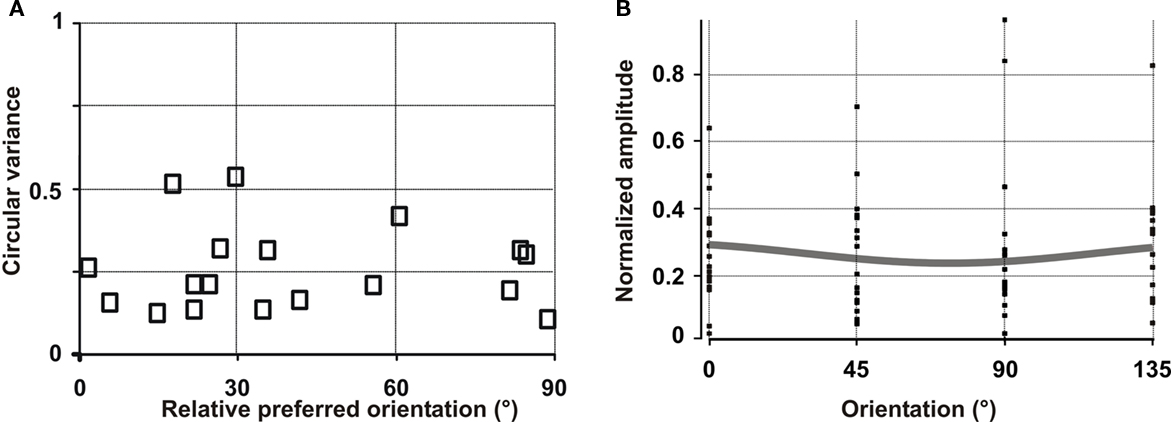
Figure 10. Population analysis of the orientation selectivity and preference of the lateral synaptic input explored by intracellular recordings. (A) The orientation tuning for each cluster of activation observed in the subthreshold receptive field of eight analyzed cells was computed (18 clusters, open squares). The preferred orientation (relative to the cell’s preferred orientation at spiking level) is plotted as a function of the circular variance (tuning strength). (B) We computed the expected optical signal from the responses obtained for each orientation condition in each cluster, realigned with each cell’s preferred orientation. Each data point corresponds to the normalized level of activity obtained in each cluster for the tested orientations. Gray curve: the resulting fitted population orientation tuning.
To further examine whether our prediction in connection with the pooling of these intracellular results was consistent with the VSDI data, we computed an estimate of the expected population response from the set of responses obtained for each cluster and each single orientation. In contrast to Figure 10A, Figure 10B displays the activity component for each test orientation before the orientation selectivity of the total composite signal was computed. This allowed us to “model” the expected VSDI signal of a virtual column simultaneously receiving all the input sources we observed from recorded clusters (Jancke, 2000). In Figure 10B, each point corresponds to the response obtained in a given cluster for one orientation condition, relative to the cell’s preferred orientation (i.e., the preferred orientation of the virtual column). The final result shows a flat orientation tuning of the composite signal amplitude with high variance. The fit of the population tuning is non-selective. Thus, at the population level, the results emerging from intracellular recordings are consistent with the VSDI data. Both measurements show that the lateral spread is untuned to orientation because each potential target column integrates input from a wide variety of orientation-selective and non-selective sources originating from their RF surround.
Emergence of Tuned Lateral Spread Through Cooperative Mechanisms
The experimental observations described so far were based on responses to local stimuli at high contrast. To test the effect of other stimulus configurations, which may recruit more extensive cortical interactions, we manipulated the stimulus characteristics. We first tested whether stimulus contrast could affect the extent of the tuned orientation-selective spread. Local stimulus contrast has indeed been shown to affect spatial summation and lateral interactions (Levitt and Lund, 1997; cat literature: Sengpiel et al., 1997; Polat et al., 1998; Nauhaus et al., 2009) but also the balance of excitation and inhibition (Contreras and Palmer, 2003). Our result indicated that lowering the contrast did not actually increase the extent of the orientation-selective spread (see Appendix, Figure A4).
In a second step we increased the spatial summation area by using annular gratings and tested for the emergence of an orientation-selective lateral spread of activation. Orientation selectivity of the lateral spread evoked by annular gratings was measured using both VSDI and intracellular recordings.
Two different VSDI examples are presented in Figure 11. In the first example (Figure 11A), we compared the polar map dynamics of VSDI responses to a full-field (top row), a local (middle row, 3° diameter) and an annular grating (bottom row, inner diameter of 6°, outer diameter 9°) precisely encroaching on the outer border of the local stimulus (see drawing on the left). As reported above, the orientation-selective component activated by the local grating remained spatially restricted (middle row, white contour). However, the annular stimulus evoked an orientation-selective response filling in the retinotopic representation of its unstimulated inner disk, which is a region devoid of direct feedforward input (bottom row). The inner ring retinotopic representation can be inferred from the retinotopic maps shown in Figure 11A (right). The lower position (continuous ellipse) corresponds to the retinotopic activation of the lower stimulus: in the middle row it is activated directly by the local patch; in the lower row, it is fed by the ring itself. In this latter case, the contiguous cortical zone activated by the upper position (dotted ellipse) corresponds to the retinotopic representation of the unstimulated inner disk of the annular stimulus. To compare the cortical area over which significant orientation-selective response is observed in the three conditions (cartoons in the left panel), we restricted the quantification inside a specific cortical ROI (Figure 11B). This ROI corresponds to a rectangle centered on the representation of the lower stimulus, and aligned to vertical visual axis representation (antero-posterior cortical axis). Therefore, it allows quantifying VSDI responses over a cortical region receiving a same amount of visual stimulation in the local and annular conditions (reddish rectangle superimposed on stimulus cartoon and averaged polar map). Within such ROI, the dynamics of the cortical area becoming significantly orientation selective (delimited by the white contour) is shown in the right column of Figure 11B. Whereas the cortical regions which are significantly activated (gray curve) in the three conditions are comparable, the spatial extent of the orientation-selective cortical area (black curve) is larger for the annular stimulation (bottom row) than the inner disk (middle row). In Figure 11C we show another example that reproduces the same result: the annular stimulus evokes an activation spread inside the cortical representation of the inner disk of the annulus that is selective to orientation.
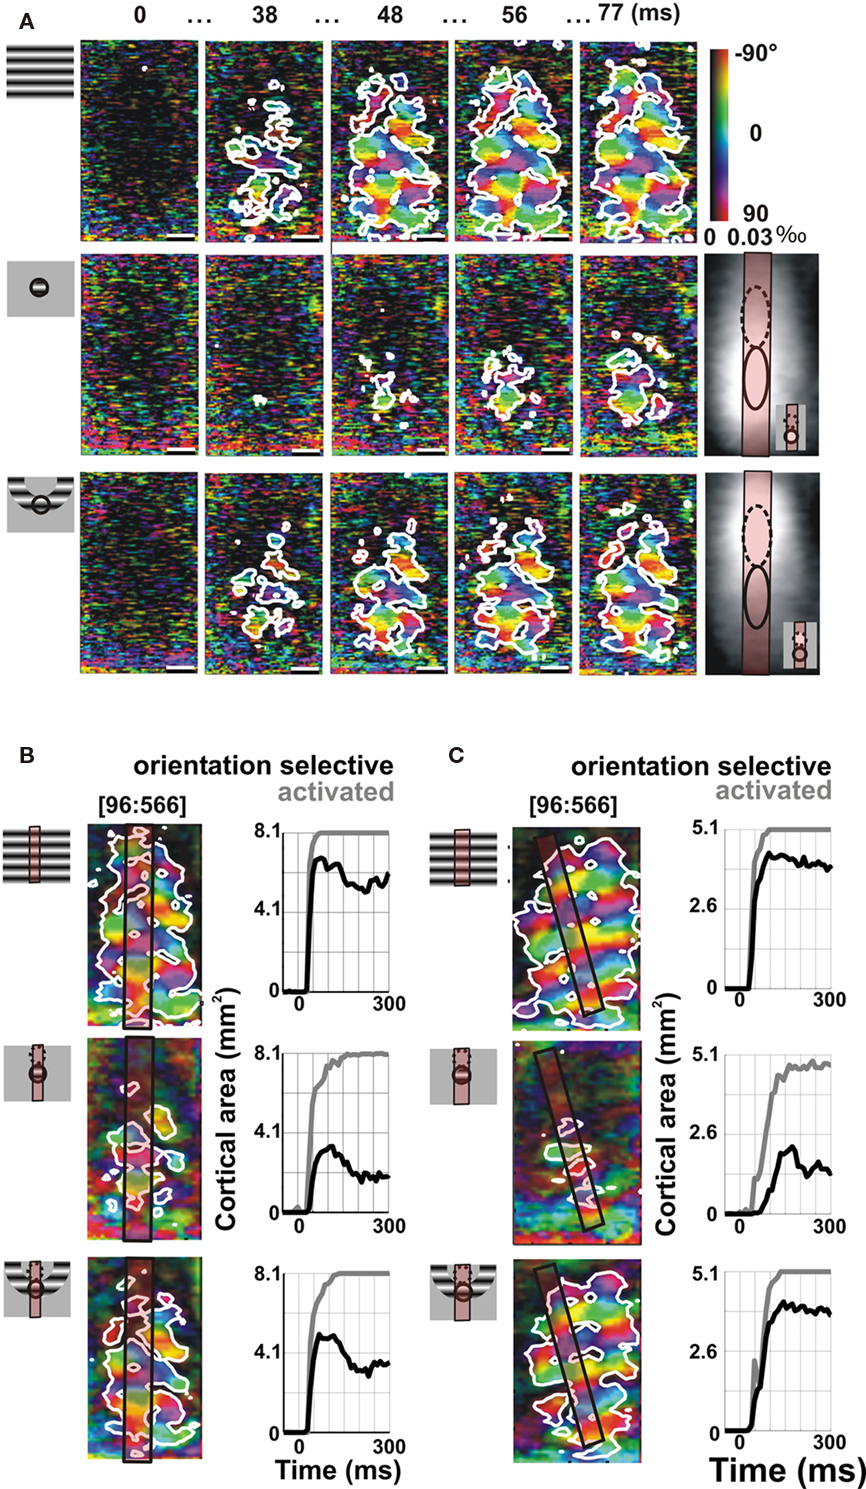
Figure 11. Propagation of iso-orientation preference emerges from spatial summation (visualized by VSDI). (A) Time-series of polar representation of orientation maps in area 18 in response to full-field (top), local (middle 3° diameter at 5.6° eccentricity), and annular stimuli (bottom, inner diameter 6°, outer diameter 9°) whose position relative to the local stimulus is shown in the stimulus cartoon on the left. White contours delineate the cortical regions significantly selective to orientation. Time from stimulus onset is indicated above each frame. Bottom right: single-condition maps of responses evoked by two adjacent stimuli. Ellipses indicate the estimated cortical limit of the stimulus’s retinotopic representation (see Figure 1). Bottom-right inset: stimuli locations in the visual space. Scale bars are 1 mm. (B) Dynamics of the cortical areas significantly activated (gray) or orientation selective (black) in response to the full-field, local disk, and annular stimuli were compared within a cortical region receiving a comparable feedforward drive. This region was defined as an elongated region of interest (ROI) aligned on the representation axis of the upper-to-lower stimuli (reddish rectangle). (C) Another example from area 18 is shown. Stimulus size was 4° diameter for the local stimulus (6°, 7° eccentricity), 8° for the inner diameter of the annulus, outer diameter 12°.
These results were confirmed in two other hemispheres, as shown by the group-averaged time-courses of orientation selectivity (Figure 12A) or significantly activated cortical areas (Figure 12B). Whereas the extent of activated cortical area is comparable for local and annular stimulations, there is a clear difference in the extent of cortical territory which remains significantly tuned to the orientation of the stimulus: the orientation-selective domain activated by the annular stimulation extends across the retinotopic representation zone of the unstimulated inner disk (dotted circle).
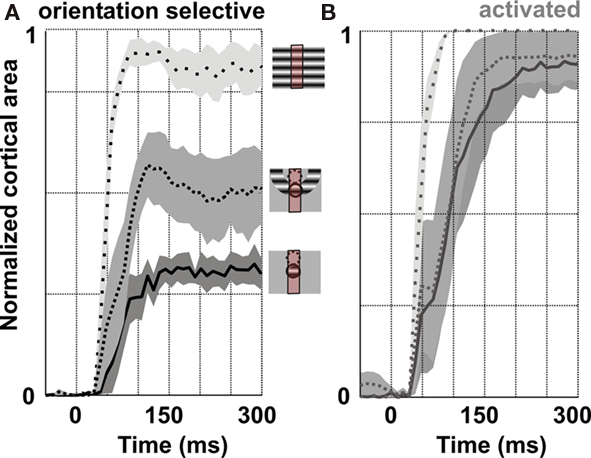
Figure 12. Group analysis of spatial summation in VSDI experiments. Dynamics of the orientation selective (A) and significantly activated (B) cortical areas, averaged over four hemispheres (full-field, sparse dotted; annulus, dotted; local, continuous). Since the ROIs were of different size, the area was normalized to the region of interest area. Gray areas are ±SEM.
In another area 18 example (Figure 13) we compared differential maps for local and annular stimuli. For local stimulation (Figure 13A), the orientation map propagated only slightly beyond the estimated retinotopic representation of the local stimulus (white ellipse). In this figure, white patches correspond to the response to a vertical stimulus (blue crosses) and dark patches to a horizontal stimulus (red crosses). However, for annular stimulation (Figure 13B), orientation-selective activity propagated within the inner, unstimulated disk, confirming the results in Figure 12A. The annular surround, but not the central disk, evoked a spatial spread of an orientation-selective response. To test for a non-symmetrical behavior of the spread, we concurrently stimulated the center and surround positions with orthogonal orientations. For such a bipartite stimulus the cortical representation of the inner disk should receive two complementary oriented inputs: one fed directly by the feedforward stream and the other relayed by the horizontal connectivity. In contrast, according to the preceding results, the cortical representation of the annulus should only receive orientation-selective input from the annulus feedforward activation. These predictions are verified in Figure 13C, where the orientation-selective response is almost abolished within the inner disk cortical representation, but not in the annulus representation. These results confirm that a stimulus configuration that recruits a higher level of spatial summation and temporal coherence can indeed initiate a strong iso-orientation-selective lateral spread of activity beyond the scale of a hypercolumn.
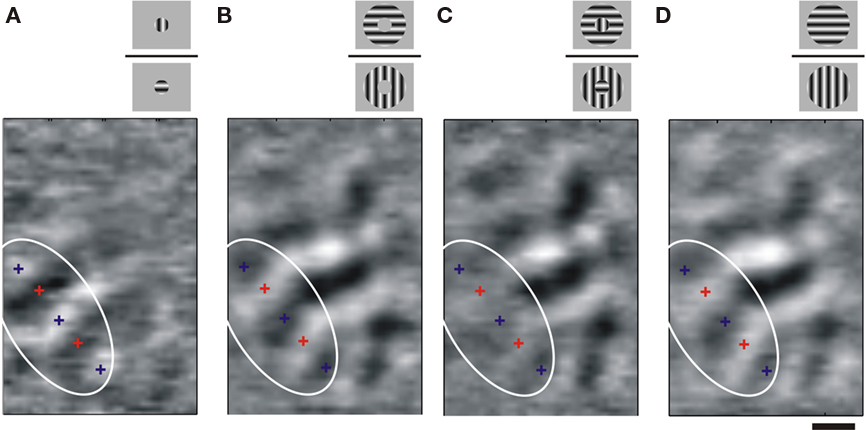
Figure 13. Lateral spread and center-surround competition. (A) Area 18 differential map obtained by dividing the responses to horizontal vs. vertical gratings presented through a central disk aperture (stimulus diameter 4° at an eccentricity of 7.6°; see cartoons). Orientation map is confined locally. (B) In comparison, displaying a larger grating through an annular aperture without stimulating the central disk (stimulus inner diameter, 4°, outer diameter, 12°, same eccentricity) results in the propagation of oriented signal within the cortical representation of the central disk region. (C) When both stimuli are competing in a composite cross-oriented configuration, the orientation map within the retinotopic representation of the local disk region disappears. (D) Control condition with iso-oriented center-surround configurations. The white elliptic contour delimits the expected retinotopic representation of the local central disk stimulus. Scale bar is 1 mm.
The above results obtained at the population level with VSDI were confirmed and extended with intracellular recordings of subthreshold activity in 11 additional single neurons. The intracellular examples of Figure 14 illustrate the stimulus-locked averaged spiking (black) and subthreshold depolarizing (red) responses of two cells to a drifting grating. Figure 14A shows the responses of a Complex cell to gratings presented at either the optimal (right column) or the orthogonal (left column) orientation/direction, and in two spatial configurations, in the RF center (upper row) or its annular surround (lower row). From the averaged subthreshold responses, the tuning curves (right) show that the annular stimulus evokes a response only for the optimal orientation/direction, suggesting that the converging lateral spread remains orientation selective with the same orientation preference as in the center. Figure 14B shows another example, this time of a Simple cell, with depolarizing responses to an annular stimulus tuned to the preferred orientation/direction of the cell.
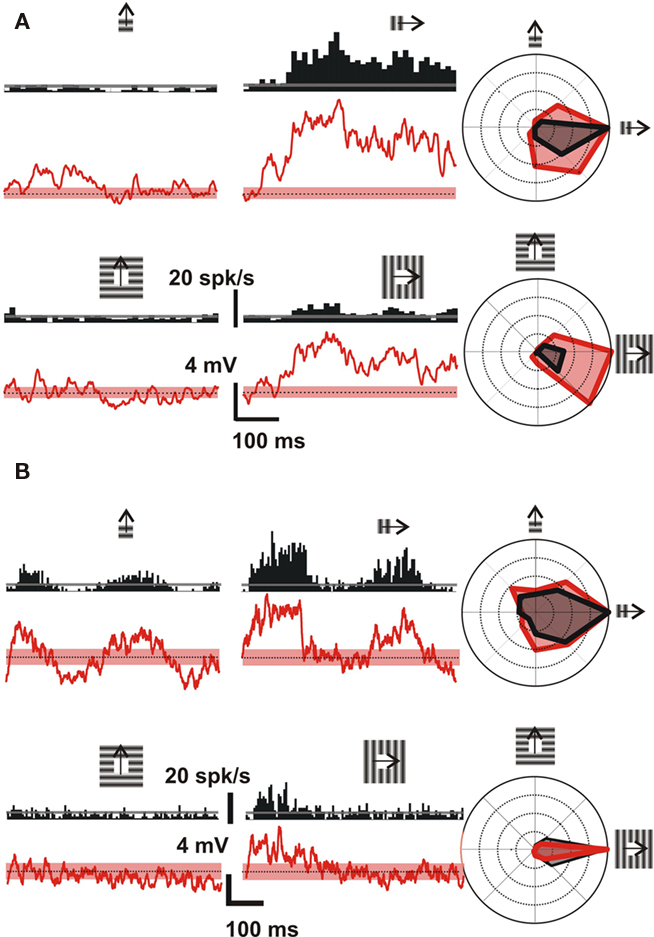
Figure 14. Iso-orientation lateral input convergence revealed by spatial and temporal summation (visualized by intracellular recordings). Conventions for (A,B): Left, stimulus-locked waveforms of the spiking (black PSTHs, upper graph) and depolarizing subthreshold (red waveforms, lower graph) responses evoked by sinusoidal luminance gratings of various orientations. These gratings were presented through the minimal discharge field aperture only (upper row) or through an annulus aperture corresponding to the RF “silent” surround (lower row). Only the responses to the cross-oriented (left column) and preferred orientation (middle column) are represented. Stimulation onset starts at the origin of the waveforms, and the dotted horizontal line and the dashed (red) stripe represent respectively the mean and the SEM of the spontaneous activity. The complete orientation-tuning curves (eight directions, 45° apart) are illustrated using the same color code on the right. Both subthreshold depolarizing (red) and spiking responses (black) are plotted in overlay, after subtracting their respective spontaneous levels. (A) Example of a Complex cell recorded in area 17 of an adult cat, with a resting potential of −72 mV. Depolarizing responses were tuned for the same orientation as the spiking response for both stimulus configurations. (B) Example of a Simple cell, with similar subthreshold iso-oriented depolarizing responses. This cell was recorded in area 17 of an adult cat, with a resting potential of −61 mV.
These results were confirmed at the population level (Figure 15), using the same calculation used for local stimulation (Figure 10A). In this figure, the circular variance of the subthreshold responses to peripheral stimuli is expressed as a function of their preferred orientation, relative to the cell’s spiking preferred orientation. Synaptic responses to peripheral stimuli were all iso-oriented with the preferred orientation of the cell, whereas local stimulation produces untuned and tuned depolarizing responses for all preferred orientations (Figure 15, gray open squares corresponding to Figure 10A).
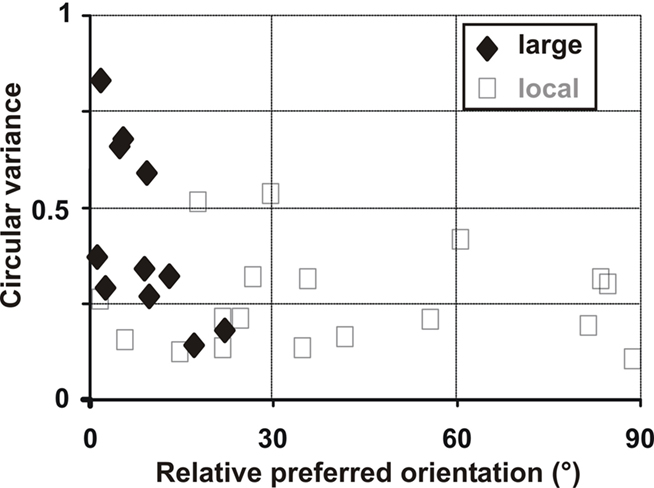
Figure 15. Group analysis of spatial and temporal summation in intracellular experiments. The preferred orientation (relative to the cell’s spiking preferred orientation) is plotted as a function of the circular variance (tuning strength) of responses evoked by larger annular stimuli. For comparison, experiments with local Gabor stimuli are shown in light gray squares (from Figure 10A).
In conclusion, the same effects of oriented stimuli seen through a local vs. an annular aperture has been found at both mesoscopic (VSDI) and microscopic (intracellular) activity levels. Our findings therefore support the view that stimulus configurations that coherently recruit spatial and temporal summation coordinate the composite impact of subthreshold responses from the “silent” periphery in such a way as to generate the propagation of iso-orientation preference over long intracortical distances.
Discussion
In this study we showed, using both VSDI and intracellular recordings, that the postsynaptic integration of long-range lateral spread evoked in areas 17 and 18 in the cat by a local oriented stimulus gradually loses its orientation selectivity. Importantly, we also found, that increasing spatial summation in the input pattern induce the emergence of long-distance propagation of iso-orientation preference beyond the functional hypercolumn scale.
Three different types of analyses confirmed the observation that, in response to a local visual stimulus, orientation selectivity decreases along the lateral spread of activity. As a function of the spread distance, we measured (i) the trial-to-trial reliability of the preferred orientation (Figures 3 and 4), (ii) the decrease in preferred orientation accuracy (Figures 5 and 6), and (iii) the decrease in modulation depth (Figures 7 and 8). VSDI methodology provides information about the average postsynaptic activation of a large population of single cells and its dynamics. It therefore cannot be ruled out that some sub-populations are sharply tuned and others are not. This question was addressed by carrying out intracellular recordings, which showed that in some cases the loss of orientation selectivity is the result of a diversity of converging functional connectivity patterns at the single cell level. Since the area of the orientation-selective activation visualized by VSDI is approximately equal to the cortical area that has to be traversed in order to find cells with non-overlapping RFs (based on estimation of the feedforward imprint from Albus, 1975), we conclude that for distances beyond the activated hypercolumn the observed spread was non-selective.
On the Origin of the Spread
In the following discussion on the synaptic origin of the observed lateral spread, we briefly overview its spatial and spatiotemporal properties and compare them with known characteristics of the horizontal and feedback networks.
Spatially, the lateral spread observed here was about 3 mm in radius, which is well within the limits of the extent of horizontal axons (Gilbert and Wiesel, 1989; Kisvarday et al., 1997), and much larger than the divergence reported for direct geniculo-cortical projections (1 mm in radius, Humphrey et al., 1985; Salin et al., 1989). Moreover, a large proportion of the lateral subthreshold inputs that were detectable by intracellular recordings were orientation selective, indicating that their origin was cortical rather than geniculo-cortical. Such long-distance interaction could also in theory be attributable to the anatomical divergence of feedback pathways, but the latter are not precise enough retinotopically and rather generate a diffuse divergence pattern (with one cortical point capable of projecting to more than 10 mm; Salin et al., 1989, 1992, 1995, see review Salin and Bullier, 1995). In the spatiotemporal domain, both VSDI and intracellular response latencies revealed a similar slow spread with a range of 0.07–0.16 m/s. These measures are in agreement with the values of propagation for horizontal unmyelinated connectivity, as documented in vitro in area 17 of the cat using intracellular recordings (Chervin et al., 1988; Komatsu et al., 1988; Hirsch and Gilbert, 1991; Nowak and Bullier, 1998) or field potential (Luhmann et al., 1990; Kitano et al., 1994). Importantly, a recent study demonstrated that the horizontal spread of activity triggered by intracortical extracellular stimulation is indeed seen in VSDI and propagates at similar speed ranges (Suzurikawa et al., 2009), confirming previous VSDI studies in vitro with different species (Nelson and Katz, 1995; Yuste et al., 1997; Contreras and Llinas, 2001; Petersen and Sakmann, 2001).
In contrast, feedback and divergent feedforward activation also cannot account for such a slow spatiotemporal pattern, since conduction by myelinated axons from the thalamus (Hoffman and Stone, 1971; Stone et al., 1979) or higher cortical areas (Toyama et al., 1969; Bullier et al., 1988; Henry et al., 1991) are faster by at least one to two orders of magnitude (1–40 m/s). Inactivation studies of higher areas in the cat have shown that feedback has no effect on RF size, surround modulation size, or orientation preference, but it does modulate the amplitude of the evoked response and broaden, or alternatively sharpen, tuning width in some cells (Wang et al., 2000, 2007, 2010; Galuske et al., 2002; Huang et al., 2004, 2007; Shen et al., 2006, 2008; Liang et al., 2007). Those studies suggest that feedback networks affect the primary visual cortex through a rapid (review in Bullier, 2001) and multiplicative scaling action (Wang et al., 2010) over a large region, generating a context-dependent modulation of the horizontal network (Ito and Gilbert, 1999). Therefore, the characteristics of myelinated input and feedback pathways conduct too fast and are spatially too diffuse to account for the observed slow and gradual spread (see also discussion in Bringuier et al., 1999; Frégnac et al., 2010). Unmyelinated horizontal axonal inputs, with the possible involvement of rolling waves of activity through polysynaptic pathways and recurrent connections, are therefore the plausible origin of the measured spread, in accordance with assumptions made in a large body of in vivo literature on VSDI and intracellular recordings from our groups as well as from many others (Grinvald et al., 1994; Bringuier et al., 1999; Chavane et al., 2000; Slovin et al., 2002; Petersen et al., 2003; Jancke et al., 2004; Roland et al., 2006; Benucci et al., 2007; Sharon et al., 2007; Xu et al., 2007; Ahmed et al., 2008; Palagina et al., 2009).
While weak contributions from other cerebral sources cannot be excluded, an important result obtained here is that a local oriented stimulus does not in itself result in an orientation-selective activation of the lateral neighboring cortex. However, the possibility of species difference in the relative contribution of the horizontal and feedback pathways should be taken into account: for example, long-range interactions in monkey may be more mediated by feedback pathways (Angelucci et al., 2002), where horizontal axons are of more limited extent (if measured in retinotopic space).
Comparison with Previous Results
The present results may seem to be at odds with the consensus reflected in the anatomical literature, namely that horizontal axons predominantly connect neurons with similar response properties (review in Schmidt and Lowel, 2002). However, this consensus is based on anatomical data, whereas the present results are based on functional data. It is known that spatiotemporal patterns of activation cannot be derived from anatomical data. (Below is a description of spatiotemporal patterns in awake and anesthetized animals, clearly the anatomical connections did not change, only their function).
The available anatomical data are not capable of providing a coherent picture of the functional nature of the long-range horizontal connections; moreover, they are controversial, possibly because of methodological and species differences. Whereas some specific examples of tracer injection sites exhibit relatively strong patchiness with a spatial periodicity matching the orientation map, quantitative analyses of the selectivity of anatomical lateral connections by some groups did not show a strong orientation bias beyond the first millimeter or two. Based on anatomical tracing and the superposition of axonal bouton location on orientation maps, the reported bias in favor of iso-oriented preference has been quantified in the cat as only 1.5 times stronger than that expected by chance. This estimate results from a sampling restricted to synaptic boutons that mostly reside within a disk radius of only 1–1.5 mm around the injection site (Kisvarday and Eysel, 1993; Kisvarday et al., 1994, 1997; Schmidt et al., 1997; Yousef et al., 1999, 2001; Buzas et al., 2001) or up to 2 mm (Buzas et al., 2006). Furthermore, the spatial density of horizontal synaptic contacts decreases with lateral separation (Creutzfeldt et al., 1977; Kisvarday et al., 1997; Buzas et al., 2006). More importantly, the iso-orientation selectivity revealed by anatomy tends to decrease with distance, with clear differences between proximal and distal boutons (Kisvarday et al., 1994, 1997; Buzas et al., 2006). Altogether, the overall bias previously reported in quantitative studies apparently results mostly from short-range horizontal connections. The present results are in line with this observation: for a lateral radius of less than 1.5 mm, an initial bias of similar value was also observed here (Figures 6A and 8A). Because optical imaging studies measure the subthreshold horizontal spread at the population level, we believe that it is currently the only technique that allows the loss of selectivity to be detected at long-range distances. Those publications may suggests that a careful examination of structural data in the literature may imply that the “like binds to like” contention should be revisited in the case of longer-range functional horizontal interactions, unless the visual input allows for cooperative effects.
At the functional level, as stated in the introduction, the published evidence for the iso-preference binding rule was obtained mostly on the basis of spiking activity. However, even when restricting the visual stimulation within the classical RF, it is well established that there are no unique rules linking the tuning of synaptic inputs to that of the spike-based preference (Vidyasagar et al., 1996; Monier et al., 2003). Cross-correlation between pairs of extracellularly recorded neurons indicated that the spiking activity of laterally separated cells tends to be more synchronized when their preferred orientation is similar (Michalski et al., 1983; Ts’o et al., 1986; Schwarz and Bolz, 1991). However, the peaked correlograms at zero latency that were obtained in those studies are more indicative of a common input, rather than cell-to-cell connectivity. Moreover, the visual stimulation used to reveal those cross-correlations was not optimal for testing whether one cell is horizontally connected to the other, as both sites were directly stimulated (sometimes by two different stimulations) and therefore triggered spiking activity at both columnar locations. It follows that basing connectivity inferences solely on evoked spiking activities in different neurons may be inappropriate for dissecting the propagation of subthreshold horizontal inputs (Bringuier et al., 1999). Furthermore, all of those studies relied on a low sampling density (less than one neuron per iso-preference orientation column width). This may be of importance, since counter-findings have also been published (see for instance Figure 4 in Michalski et al., 1983; Figure 5 in Schwarz and Bolz, 1991). Lastly, a more recent contradictory publication reported that the probability of synchronous activation decreases rapidly with lateral distances of up to 1 mm between cells, independently of their relative preferred orientations (Das and Gilbert, 1999). The origin of the apparent discrepancy with the findings of Ts’o et al. (1986) is more difficult to ascertain, since these authors tested distances up to 3 mm but pooled their results over the entire range of lateral separations. The data presented by Das and Gilbert (1995) and Toth et al. (1996) showing a strong decrease in orientation selectivity over less than a millimeter from the retinotopic border of the stimulus, point to conclusions that do not contradict the present results (although not stated specifically in these latter studies). The tree shrew data from the Fitzpatrick laboratory (Chisum et al., 2003) are also in line with the present results.
In a more recent work using multielectrode array, Nauhaus et al. (2009) unraveled a tendency for iso-orientation biases for lateral connectivity inspected with spike-triggered LFP. However these authors used large visual stimulus, hence stimuli that induce cooperative effects and that evoked suprathreshold activity at all sites. All in all, detailed inspection of the literature presents a picture that is mostly in agreement with our report of a loss of orientation selectivity of the observed spread.
Previous VSDI findings of ongoing activity (Tsodyks et al., 1999; Kenet et al., 2003) might raise expectations that the spontaneous appearance of orientation maps over a small cortical area could spread to a large area, thus suggesting by inference that orientation-tuning activity may spread over a large area. However, as shown by Kenet et al. (2003; Figure 3), orientation maps mostly seem to arise simultaneously over the entire imaged cortical surface (about 6 mm × 2 mm) rather than spreading across it. Furthermore, no spread could be detected on inspection of the related high temporal resolution movies. On inspecting spatiotemporal patterns in anesthetized monkey V1, we also observed that maps of iso-orientation domains or ocular dominance domains often appear spontaneously rather than by slow spread (Grinvald et al., 2010). It is interesting to compare the results from anesthetized and awake monkey V1, since no spontaneous emergence of orientation maps, or ocular dominance maps could be detected at all in the latter case (Grinvald et al., 2010). In the context of this paper, this result underscores once again the lack of predictability of functional activation-patterns from known connectivity.
Effect of Stimulus Configuration
Here we found that the stimulus contrast does not affect the extent of the orientation-selective spread (Figure A4 in Appendix). Using spike-triggered LFP, Nauhaus et al. (2009) recently showed an increase in the lateral spread detectability with lower contrast. However, these authors did not measure whether orientation bias change with the stimulus’s contrast. Furthermore, because of the different stimulus paradigms used and the different electrical parameters that were measured, a comparison of their results with our study is not warranted.
Contrary to what was observed when manipulating the contrast, we found that increasing the spatial summation of sensory input can induce the emergence of iso-orientation-preference propagation (Figures 11–15). This observation precludes in part a potential pitfall of our stimulus configuration, i.e., the fact that we used circular aperture with sharp edge borders. These oriented borders could potentially stimulate orientation columns whose preference may be orthogonal to the grating orientation. However, the multiple orientation content of the stimulus does not seem to be the explanatory mechanism of our effect, since similar sharp edge borders are present in the annular condition for which a tuned spread was observed. We suggest that this orientation-selective spread observed using annular stimulation could emerge from intracortical cooperative mechanisms. A simple schema is proposed here (see Figure A5 in Appendix) as a possible way to produce orientation selectivity in the lateral spread through non-linear summation mechanisms, analogous to what was proposed for the thalamo-cortical pathway (Hubel and Wiesel, 1962). One possible mechanism is a differential convergence rule for long-range horizontal connections between columns, depending on whether they have identical or different preferred orientations. If identical, the horizontal input would converge onto a specific subpopulation of cells within the recipient cortical column (Figure 9F), whereas in the columns have different preferred orientations the horizontal input would be more divergent and spatially diffuse (Figure 9D; Figure A5 in Appendix). When an annular stimulus has the proper orientation, synaptic convergence onto a small number of cells would lead to suprathreshold activation that could then ignite the cooperative firing of the whole target column through local recurrency (Douglas and Martin, 1991).
Conclusion
The present study shows two different behaviors of the same network for two distinct stimulus configurations: a single local stimulus evokes a lateral cortical spread that does not maintain orientation preference over long distances, whereas stimulation allowing spatial summation and temporal coherence facilitates the build-up of propagating cortical spread exhibiting a strong orientation preference.
Our results support the existence of a flexible and dynamic binding operations that presumably are important for integrating the higher-order interactions found in natural images (Simoncelli and Olshausen, 2001; Geisler, 2008; Karklin and Lewicki, 2009; for reviews). An advantage of such versatile binding rules would be to decrease redundant interactions and generate sparser (Olshausen and Field, 1996) and more dynamic (Lorenceau and Shiffrar, 1992) integration. The annular stimulation experiments (Figures 11–15) show that cooperativity at the global network level can induce tuned propagation of activation. Many other high-order features in the spatiotemporal coherence of the stimulus may influence the propagation of tuned information in the primary visual cortex. Further studies employing dynamic imaging are warranted to uncover binding laws that may originate from higher-order lateral interactions.
Supplementary Movies
The Movies 1, 2, and 3 for this article can be found online at http://www.frontiersin.org/Systems_Neuroscience/10.3389/fnsys.2011.00004/abstract
Conflict of Interest Statement
The authors declare that the research was conducted in the absence of any commercial or financial relationships that could be construed as a potential conflict of interest.
Acknowledgments
We thank Chaipi Winjbergen, Y. Toledo and D. Ettner for excellent engineering and technical assistance, R. Hildesheim for the dye and great continuous help. We are also grateful to Drs Guillaume Masson, Laurent Perrinet, Cyril Monier, Julian Budd, Andrew Davison, Kirsty Grant and A. Boghadi for helpful comments at various stages of the manuscript. Amiram Grinvald was supported by the Grodetsky Center for Research of Higher Brain Functions and by grants from ISI, BMBF, and the EC (FP6-2004-IST-FETPI-015803, DAISY); Frédéric Chavane was supported by an EC Marie Curie fellowship and the Grodetsky Center for Research of Higher Brain Functions; Dirk Jancke was supported by the Minerva Foundation, Germany. The intracellular electrophysiological work was supported by CNRS and by an EC Integrated Project contract (FP6-2004-IST-FETPI-15789, FACETS) awarded to Yves Frégnac. Olivier Marre was supported by bursaries from the DGA, Ministry of Defense, France, and by the FRM.
References
Ahmed, B., Hanazawa, A., Undeman, C., Eriksson, D., Valentiniene, S., and Roland, P. E. (2008). Cortical dynamics subserving visual apparent motion. Cereb. Cortex 18, 2796–2810.
Albus, K. (1975). A quantitative study of the projection area of the central and the paracentral visual field in area 17 of the cat. I. The precision of the topography. Exp. Brain Res. 24, 159–179.
Angelucci, A., Levitt, J. B., Walton, E. J., Hupe, J. M., Bullier, J., and Lund, J. S. (2002). Circuits for local and global signal integration in primary visual cortex. J. Neurosci. 22, 8633–8646.
Benucci, A., Frazor, R. A., and Carandini, M. (2007). Standing waves and traveling waves distinguish two circuits in visual cortex. Neuron 55, 103–117.
Blakemore, C., and Tobin, E. A. (1972). Lateral inhibition between orientation detectors in the cat’s visual cortex. Exp. Brain Res. 15, 439–440.
Bosking, W. H., Zhang, Y., Schofield, B., and Fitzpatrick, D. (1997). Orientation selectivity and the arrangement of horizontal connections in tree shrew striate cortex. J. Neurosci. 17, 2112–2127.
Bringuier, V., Chavane, F., Glaeser, L., and Fregnac, Y. (1999). Horizontal propagation of visual activity in the synaptic integration field of area 17 neurons. Science 283, 695–699.
Bullier, J., McCourt, M. E., and Henry, G. H. (1988). Physiological studies on the feedback connection to the striate cortex from cortical areas 18 and 19 of the cat. Exp. Brain Res. 70, 90–98.
Buzas, P., Eysel, U. T., Adorjan, P., and Kisvarday, Z. F. (2001). Axonal topography of cortical basket cells in relation to orientation, direction, and ocular dominance maps. J. Comp. Neurol. 437, 259–285.
Buzas, P., Kovacs, K., Ferecsko, A. S., Budd, J. M., Eysel, U. T., and Kisvarday, Z. F. (2006). Model-based analysis of excitatory lateral connections in the visual cortex. J. Comp. Neurol. 499, 861–881.
Chavane, F., Monier, C., Bringuier, V., Baudot, P., Borg-Graham, L., Lorenceau, J., and Fregnac, Y. (2000). The visual cortical association field: a Gestalt concept or a psychophysiological entity? J. Physiol. Paris 94, 333–342.
Chervin, R. D., Pierce, P. A., and Connors, B. W. (1988). Periodicity and directionality in the propagation of epileptiform discharges across neocortex. J. Neurophysiol. 60, 1695–1713.
Chisum, H. J., Mooser, F., and Fitzpatrick, D. (2003). Emergent properties of layer 2/3 neurons reflect the collinear arrangement of horizontal connections in tree shrew visual cortex. J. Neurosci. 23, 2947–2960.
Cohen, L. B., Salzberg, B. M., Davila, H. V., Ross, W. N., Landowne, D., Waggoner, A. S., and Wang, C. H. (1974). Changes in axon fluorescence during activity: molecular probes of membrane potential. J. Membr. Biol. 19, 1–36.
Contreras, D., and Llinas, R. (2001). Voltage-sensitive dye imaging of neocortical spatiotemporal dynamics to afferent activation frequency. J. Neurosci. 21, 9403–9413.
Contreras, D., and Palmer, L. (2003). Response to contrast of electrophysiologically defined cell classes in primary visual cortex. J. Neurosci. 23, 6936–6945.
Creutzfeldt, O. D., Garey, L. J., Kuroda, R., and Wolff, J. R. (1977). The distribution of degenerating axons after small lesions in the intact and isolated visual cortex of the cat. Exp. Brain Res. 27, 419–440.
Crook, J. M., and Eysel, U. T. (1992). GABA-induced inactivation of functionally characterized sites in cat visual cortex (area 18): effects on orientation tuning. J. Neurosci. 12, 1816–1825.
Crook, J. M., Kisvárday, Z. F., and Eysel, U. T. (1998). Evidence for a contribution of lateral inhibition to orientation tuning and direction selectivity in cat visual cortex: reversible inactivation of functionally characterized sites combined with neuroanatomical tracing techniques. Eur. J. Neurosci. 10, 2056–2075.
Das, A., and Gilbert, C. D. (1995). Long-range horizontal connections and their role in cortical reorganization revealed by optical recording of cat primary visual cortex. Nature 375, 780–784.
Das, A., and Gilbert, C. D. (1999). Topography of contextual modulations mediated by short-range interactions in primary visual cortex. Nature 399, 655–661.
Douglas, R. J., and Martin, K. A. (1991). A functional microcircuit for cat visual cortex. J. Physiol. 440, 735–769.
Fisken, R. A., Garey, L. J., and Powell, T. P. (1975). The intrinsic, association and commissural connections of area 17 on the visual cortex. Philos. Trans. R. Soc. Lond., B, Biol. Sci. 272, 487–536.
Frégnac, Y., Baudot, P., Chavane, F., Lorenceau, J., Marre, O., Monier, C., Pananceau, M., Carelli, P., and Sadoc, G. (2010). “Multiscale functional imaging in V1 and cortical correlates of apparent motion,” in Dynamics of Visual Motion Processing, eds G. Masson and U. Ilg (New York: Springer), 73–94.
Galuske, R. A., Schmidt, K. E., Goebel, R., Lomber, S. G., and Payne, B. R. (2002). The role of feedback in shaping neural representations in cat visual cortex. Proc. Natl. Acad. Sci. U.S.A. 99, 17083–17088.
Geisler, W. S. (2008). Visual perception and the statistical properties of natural scenes. Annu. Rev. Psychol. 59, 167–192.
Gilbert, C. D., and Wiesel, T. N. (1979). Morphology and intracortical projections of functionally characterised neurones in the cat visual cortex. Nature 280, 120–125.
Gilbert, C. D., and Wiesel, T. N. (1989). Columnar specificity of intrinsic horizontal and corticocortical connections in cat visual cortex. J. Neurosci. 9, 2432–2442.
Gilbert, C. D., and Wiesel, T. N. (1990). The influence of contextual stimuli on the orientation selectivity of cells in primary visual cortex of the cat. Vision Res. 30, 1689–1701.
Grinvald, A., Anglister, L., Freeman, J. A., Hildesheim, R., and Manker, A. (1984). Real-time optical imaging of naturally evoked electrical activity in intact frog brain. Nature 308, 848–850.
Grinvald, A., Omer, D., and Sharon, D. (2010). “Imaging the dynamics of mammalian neocortical population activity in-vivo,” in Membrane Potential in the Nervous System, Chapter 9, eds D. Zecevic and M. Canepari (New-York: Springer), 97–111.
Grinvald, A., and Hildesheim, R. (2004). VSDI: a new era in functional imaging of cortical dynamics. Nat. Rev. Neurosci. 5, 874–885.
Grinvald, A., Hildesheim, R., Farber, I. C., and Anglister, L. (1982). Improved fluorescent probes for the measurement of rapid changes in membrane potential. Biophys. J. 39, 301–308.
Grinvald, A., Lieke, E. E., Frostig, R. D., and Hildesheim, R. (1994). Cortical point-spread function and long-range lateral interactions revealed by real-time optical imaging of macaque monkey primary visual cortex. J. Neurosci. 14, 2545–2568.
Grinvald, A., Shoham, D., Shmuel, A., Glaser, D., Vanzetta, I., Shtoyermann, E., Slovin, H., Sterkin, A., Wijnbergen, C., Hildesheim, R., and Arieli, A. (1999). “In-vivo optical imaging of cortical architecture and dynamics,” in Modern Techniques in Neuroscience Research, eds H. Johansson and U. Windhorst (New York: Springer Verlag), 893–969.
Henry, G. H., Salin, P. A., and Bullier, J. (1991). Projections from areas 18 and 19 to cat striate cortex: divergence and laminar specificity. Eur. J. Neurosci. 3, 186–200.
Hirsch, J. A., and Gilbert, C. D. (1991). Synaptic physiology of horizontal connections in the cat’s visual cortex. J. Neurosci. 11, 1800–1809.
Hoffman, K. P., and Stone, J. (1971). Conduction velocity of afferents to cat visual cortex: a correlation with cortical receptive field properties. Brain Res. 32, 460–466.
Huang, J. Y., Wang, C., and Dreher, B. (2007). The effects of reversible inactivation of postero-temporal visual cortex on neuronal activities in cat’s area 17. Brain Res. 1138, 111–128.
Huang, L., Chen, X., and Shou, T. (2004). Spatial frequency-dependent feedback of visual cortical area 21a modulating functional orientation column maps in areas 17 and 18 of the cat. Brain Res. 998, 194–201.
Hubel, D. H., and Wiesel, T. N. (1962). Receptive fields, binocular interaction and functional architecture in the cat’s visual cortex. J. Physiol. 160, 106–154.
Hubel, D. H., and Wiesel, T. N. (1977). Ferrier lecture. Functional architecture of macaque monkey visual cortex. Proc. R. Soc. Lond., B, Biol. Sci. 198, 1–59.
Humphrey, A. L., Sur, M., Uhlrich, D. J., and Sherman, S. M. (1985). Projection patterns of individual X- and Y-cell axons from the lateral geniculate nucleus to cortical area 17 in the cat. J. Comp. Neurol. 233, 159–189.
Ito, M., and Gilbert, C. D. (1999). Attention modulates contextual influences in the primary visual cortex of alert monkeys. Neuron 22, 593–604.
Jancke, D. (2000). Orientation formed by a spot’s trajectory: a two-dimensional population approach in primary visual cortex. J. Neurosci. 20, RC86.
Jancke, D., Chavane, F., Naaman, S., and Grinvald, A. (2004). Imaging cortical correlates of illusion in early visual cortex. Nature 428, 423–426.
Karklin, Y., and Lewicki, M. S. (2009). Emergence of complex cell properties by learning to generalize in natural scenes. Nature 457, 83–86.
Kenet, T., Bibitchkov, D., Tsodyks, M., Grinvald, A., and Arieli, A. (2003). Spontaneously emerging cortical representations of visual attributes. Nature 425, 954–956.
Kisvarday, Z. F., and Eysel, U. T. (1993). Functional and structural topography of horizontal inhibitory connections in cat visual cortex. Eur. J. Neurosci. 5, 1558–1572.
Kisvarday, Z. F., Kim, D. S., Eysel, U. T., and Bonhoeffer, T. (1994). Relationship between lateral inhibitory connections and the topography of the orientation map in cat visual cortex. Eur. J. Neurosci. 6, 1619–1632.
Kisvarday, Z. F., Toth, E., Rausch, M., and Eysel, U. T. (1997). Orientation-specific relationship between populations of excitatory and inhibitory lateral connections in the visual cortex of the cat. Cereb. Cortex 7, 605–618.
Kitano, M., Niiyama, K., Kasamatsu, T., Sutter, E. E., and Norcia, A. M. (1994). Retinotopic and nonretinotopic field potentials in cat visual cortex. Vis. Neurosci. 11, 953–977.
Komatsu, Y., Nakajima, S., Toyama, K., and Fetz, E. E. (1988). Intracortical connectivity revealed by spike-triggered averaging in slice preparations of cat visual cortex. Brain Res. 442, 359–362.
Levitt, J. B., and Lund, J. S. (1997). Contrast dependence of contextual effects in primate visual cortex. Nature 387, 73–76.
Li, C. Y., and Li, W. (1994). Extensive integration field beyond the classical receptive field of cat’s striate cortical neurons – classification and tuning properties. Vision Res. 34, 2337–2355.
Liang, Z., Shen, W., and Shou, T. (2007). Enhancement of oblique effect in the cat’s primary visual cortex via orientation preference shifting induced by excitatory feedback from higher-order cortical area 21a. Neuroscience 145, 377–383.
Lorenceau, J., and Shiffrar, M. (1992). The influence of terminators on motion integration across space. Vision Res. 32, 263–273.
Luhmann, H. J., Greuel, J. M., and Singer, W. (1990). Horizontal interactions in cat striate cortex: II. A current source-density analysis. Eur. J. Neurosci. 2, 358–368.
Maffei, L., and Fiorentini, A. (1976). The unresponsive regions of visual cortical receptive fields. Vision Res. 16, 1131–1139.
Martinez-Conde, S., Cudeiro, J., Grieve, K. L., Rodriguez, R., Rivadulla, C., and Acuña, C. (1999). Effects of feedback projections from area 18 layers 2/3 to area 17 layers 2/3 in the cat visual cortex. J. Neurophysiol. 82, 2667–2675.
Michalski, A., Gerstein, G. L., Czarkowska, J., and Tarnecki, R. (1983). Interactions between cat striate cortex neurons. Exp. Brain Res. 51, 97–107.
Monier, C., Chavane, F., Baudot, P., Graham, L. J., and Frégnac, Y. (2003). Orientation and direction selectivity of synaptic inputs in visual cortical neurons: a diversity of combinations produces spike tuning. Neuron 37, 663–680.
Mountcastle, V. (1957). Modality and topographic properties of single neurons of cat’s somatic sensory cortex. J. Neurophysiol. 20, 408–434.
Nauhaus, I., Busse, L., Carandini, M., and Ringach, D. L. (2009). Stimulus contrast modulates functional connectivity in visual cortex. Nat. Neurosci. 12, 70–76.
Nelson, D. A., and Katz, L. C. (1995). Emergence of functional circuits in ferret visual cortex visualized by optical imaging. Neuron 15, 23–34.
Nelson, J. I., and Frost, B. J. (1978). Orientation-selective inhibition from beyond the classic visual receptive field. Brain Res. 139, 359–365.
Nowak, L. G., and Bullier, J. (1998). Axons, but not cell bodies, are activated by electrical stimulation in cortical gray matter. I. Evidence from chronaxie measurements. Exp. Brain Res. 118, 477–488.
Olshausen, B. A., and Field, D. J. (1996). Natural image statistics and efficient coding. Network 7, 333–339.
Palagina, G., Eysel, U., and Jancke, D. (2009). Strengthening of lateral activation in adult rat visual cortex after retinal lesions captured with voltage-sensitive dye imaging in vivo. Proc. Natl. Acad. Sci. U.S.A. 106, 8743–8747.
Petersen, C. C., Grinvald, A., and Sakmann, B. (2003). Spatiotemporal dynamics of sensory responses in layer 2/3 of rat barrel cortex measured in vivo by voltage-sensitive dye imaging combined with whole-cell voltage recordings and neuron reconstructions. J. Neurosci. 23, 1298–1309.
Petersen, C. C., and Sakmann, B. (2001). Functionally independent columns of rat somatosensory barrel cortex revealed with voltage-sensitive dye imaging. J. Neurosci. 21, 8435–8446.
Polat, U., Mizobe, K., Pettet, M. W., Kasamatsu, T., and Norcia, A. M. (1998). Collinear stimuli regulate visual responses depending on cell’s contrast threshold. Nature 391, 580–584.
Rockland, K. S., and Lund, J. S. (1982). Widespread periodic intrinsic connections in the tree shrew visual cortex. Science 215, 1532–1534.
Roland, P. E., Hanazawa, A., Undeman, C., Eriksson, D., Tompa, T., Nakamura, H., Valentiniene, S., and Ahmed, B. (2006). Cortical feedback depolarization waves: a mechanism of top-down influence on early visual areas. Proc. Natl. Acad. Sci. U.S.A. 103, 12586–12591.
Salin, P. A., and Bullier, J. (1995). Corticocortical connections in the visual system: structure and function. Physiol. Rev. 75, 107–154.
Salin, P. A., Bullier, J., and Kennedy, H. (1989). Convergence and divergence in the afferent projections to cat area 17. J. Comp. Neurol. 283, 486–512.
Salin, P. A., Girard, P., Kennedy, H., and Bullier, J. (1992). Visuotopic organization of corticocortical connections in the visual system of the cat. J. Comp. Neurol. 320, 415–434.
Salin, P. A., Kennedy, H., and Bullier, J. (1995). Spatial reciprocity of connections between areas 17 and 18 in the cat. Can. J. Physiol. Pharmacol. 73, 1339–1347.
Salzberg, B. M., Davila, H. V., and Cohen, L. B. (1973). Optical recording of impulses in individual neurons of an invertebrate central nervous system. Nature 246, 508–509.
Schmidt, K. E., Kim, D. S., Singer, W., Bonhoeffer, T., and Lowel, S. (1997). Functional specificity of long-range intrinsic and interhemispheric connections in the visual cortex of strabismic cats. J. Neurosci. 17, 5480–5492.
Schmidt, K. E., and Lowel, S. (2002). “Long-range intrinsic connections in cat primary visual cortex,” in The Cat Primary Visual Cortex, eds A. Peters and B. R. Payne (San Diego: Academic Press), 387–426.
Schwarz, C., and Bolz, J. (1991). Functional specificity of a long-range horizontal connection in cat visual cortex: a cross-correlation study. J. Neurosci. 11, 2995–3007.
Sengpiel, F., Sen, A., and Blakemore, C. (1997). Characteristics of surround inhibition in cat area 17. Exp. Brain Res. 116, 216–228.
Sharon, D., and Grinvald, A. (2002). Dynamics and constancy in cortical spatiotemporal patterns of orientation processing. Science 295, 512–515.
Sharon, D., Jancke, D., Chavane, F., Na’aman, S., and Grinvald, A. (2007). Cortical response field dynamics in cat visual cortex. Cereb. Cortex 17, 2866–2877.
Shen, W., Liang, Z., Chen, X., and Shou, T. (2006). Posteromedial lateral suprasylvian motion area modulates direction but not orientation preference in area 17 of cats. Neuroscience 142, 905–916.
Shen, W., Liang, Z., and Shou, T. (2008). Weakened feedback abolishes neural oblique effect evoked by pseudo-natural visual stimuli in area 17 of the cat. Neurosci. Lett. 437, 65–70.
Shoham, D., Glaser, D. E., Arieli, A., Kenet, T., Wijnbergen, C., Toledo, Y., Hildesheim, R., and Grinvald, A. (1999). Imaging cortical dynamics at high spatial and temporal resolution with novel blue voltage-sensitive dyes. Neuron 24, 791–802.
Sillito, A. M., Grieve, K. L., Jones, H. E., Cudeiro, J., and Davis, J. (1995). Visual cortical mechanisms detecting focal orientation discontinuities. Nature 378, 492–496.
Simoncelli, E. P., and Olshausen, B. A. (2001). Natural image statistics and neural representation. Annu. Rev. Neurosci. 24, 1193–1216.
Slovin, H., Arieli, A., Hildesheim, R., and Grinvald, A. (2002). Long-term voltage-sensitive dye imaging reveals cortical dynamics in behaving monkeys. J. Neurophysiol. 88, 3421–3438.
Stone, J., Dreher, B., and Leventhal, A. (1979). Hierarchical and parallel mechanisms in the organization of visual cortex. Brain Res. Rev. 1, 345–394.
Suzurikawa, J., Tani, T., Nakao, M., Tanaka, S., and Takahashi, H. (2009). Voltage-sensitive-dye imaging of microstimulation-evoked neural activity through intracortical horizontal and callosal connections in cat visual cortex. J. Neural Eng. 6, 066002.
Toth, L. J., Rao, S. C., Kim, D. S., Somers, D., and Sur, M. (1996). Subthreshold facilitation and suppression in primary visual cortex revealed by intrinsic signal imaging. Proc. Natl. Acad. Sci. U.S.A. 93, 9869–9874.
Toyama, K., Matsunami, K., and Ohno, T. (1969). Antidromic identification of association, commissural and corticofugal efferent cells in cat visual cortex. Brain Res. 14, 513–517.
Ts’o, D. Y., Gilbert, C. D., and Wiesel, T. N. (1986). Relationships between horizontal interactions and functional architecture in cat striate cortex as revealed by cross-correlation analysis. J. Neurosci. 6, 1160–1170.
Tsodyks, M., Kenet, T., Grinvald, A., and Arieli, A. (1999). Linking spontaneous activity of single cortical neurons and the underlying functional architecture. Science 286, 1943–1946.
Tusa, R. J., Rosenquist, A. C., and Palmer, L. A. (1979). Retinotopic organization of areas 18 and 19 in the cat. J. Comp. Neurol. 185, 657–678.
Vidyasagar, T. R., Pei, X., and Volgushev, M. (1996). Multiple mechanisms underlying the orientation selectivity of visual cortical neurones. Trends Neurosci. 19, 272–277.
Wang, C., Huang, J. Y., Bardy, C., FitzGibbon, T., and Dreher, B. (2010). Influence of ‘feedback’ signals on spatial integration in receptive fields of cat area 17 neurons. Brain Res. 1328, 34–48.
Wang, C., Waleszczyk, W., Burke, W., and Dreher, B. (2007). Feedback signals from cat’s area 21a enhance orientation selectivity of area 17 neurons. Exp. Brain Res. 182, 479–490.
Wang, C., Waleszczyk, W. J., Burke, W., and Dreher, B. (2000). Modulatory influence of feedback projections from area 21a on neuronal activities in striate cortex of the cat. Cereb. Cortex 10, 1217–1232.
Xu, W., Huang, X., Takagaki, K., and Wu, J. Y. (2007). Compression and reflection of visually evoked cortical waves. Neuron 55, 119–129.
Yousef, T., Bonhoeffer, T., Kim, D. S., Eysel, U. T., Toth, E., and Kisvarday, Z. F. (1999). Orientation topography of layer 4 lateral networks revealed by optical imaging in cat visual cortex (area 18). Eur. J. Neurosci. 11, 4291–4308.
Yousef, T., Toth, E., Rausch, M., Eysel, U. T., and Kisvarday, Z. F. (2001). Topography of orientation centre connections in the primary visual cortex of the cat. Neuroreport 12, 1693–1699.
Keywords: primary visual cortex, lateral interaction, horizontal propagation, orientation selectivity, functional connectivity, voltage-sensitive dye, imaging, intracellular recordings
Citation: Chavane F, Sharon D, Jancke D, Marre O, Frégnac Y and Grinvald A (2011) Lateral spread of orientation selectivity in V1 is controlled by intracortical cooperativity. Front. Syst. Neurosci. 5:4. doi: 10.3389/fnsys.2011.00004
Received: 10 December 2010;
Accepted: 14 January 2011;
Published online: 23 February 2011.
Edited by:
Raphael Pinaud, University of Oklahoma Health Sciences Center, USAReviewed by:
Jose-Manuel Alonso, State University of New York, USAMarcello Rosa, Monash University, Australia
Copyright: © 2011 Chavane, Sharon, Jancke, Marre, Frégnac and Grinvald. This is an open-access article subject to an exclusive license agreement between the authors and Frontiers Media SA, which permits unrestricted use, distribution, and reproduction in any medium, provided the original authors and source are credited.
*Correspondence: Frédéric Chavane, CNRS and Aix-Marseille University, 31, Chemin Joseph Aiguier, 13402 Marseille CEDEX 20, France. e-mail: chavane@incm.cnrs-mrs.fr