Actively Driven Fluctuations in a Fibrin Network
 Qingda Hu1,2,3
  Tessa Altair Morris2,3,4 Anna Grosberg1,2,3,4 Alex J. Levine5,6,7
  Elliot L. Botvinick1,2,3,8,9*
- 1Department of Biomedical Engineering, UCI, Irvine, CA, United States
- 2Center for Complex Biological Systems, UCI, Irvine, CA, United States
- 3Edwards Lifesciences Center for Advanced Cardiovascular Technology, UCI, Irvine, CA, United States
- 4NSF-Simons Center for Multiscale Cell Fate Research, UCI, Irvine, CA, United States
- 5Department of Physics and Astronomy, UCLA, Los Angeles, CA, United States
- 6Department of Chemistry and Biochemistry, UCLA, Los Angeles, CA, United States
- 7Department of Computational Medicine, UCLA, Los Angeles, CA, United States
- 8Beckman Laser Institute, UCI, Irvine, CA, United States
- 9Department of Surgery, UCI, Irvine, CA, United States
Understanding force propagation through the fibrous extracellular matrix can elucidate how cells interact mechanically with their surrounding tissue. Presumably, due to elastic nonlinearities of the constituent filaments and their random connection topology, force propagation in fiber networks is quite complex, and the basic problem of force propagation in structurally heterogeneous networks remains unsolved. We report on a new technique to detect displacements through such networks in response to a localized force, using a fibrin hydrogel as an example. By studying the displacements of fibers surrounding a two-micron bead that is driven sinusoidally by optical tweezers, we develop maps of displacements in the network. Fiber movement is measured by fluorescence intensity fluctuations recorded by a laser scanning confocal microscope. We find that the Fourier magnitude of these intensity fluctuations at the drive frequency identifies fibers that are mechanically coupled to the driven bead. By examining the phase relation between the drive and the displacements, we show that the fiber displacements are, indeed, due to elastic couplings within the network. Both the Fourier magnitude and phase depend on the direction of the drive force, such that displacements typically propagate farther, but not exclusively, along the drive direction. This technique may be used to characterize the local mechanical response in 3-D tissue cultures, and to address fundamental questions about force propagation within fiber networks.
1 Introduction
The extracellular matrix (ECM) interacts with and provides a variety of mechanical and biochemical cues to cells [1,2]. Experimental systems using naturally derived ECMs more closely mimic in vivo cell-ECM interactions than, for example, plastic [3]. Common naturally derived ECMs such as collagen and fibrin hydrogels exhibit important characteristics such as micron-scale pores and cell adhesion sites [4]. The fibrous nature of these ECMs plays potentially critical roles in cell-cell communication through the ECM, especially in 3-D culture systems [5,6]. For example, cells respond to forces an order-of-magnitude farther away in naturally derived fibrous materials than materials with sub-micron pores, often treated as a continuum at the cellular scale [7–10]. Therefore, understanding force propagation through naturally derived fibrous materials at the cellular scale is of great interest. Fibrin, a major component of hemostasis, is well suited for studying force propagation through fiber networks. Fibrin forms the provisional ECM of a blood clot, is used as tissue glue, and is a substrate for the study of wound healing and in tissue engineering [11–14]. Fibrin hydrogels can be formed by activating soluble fibrinogen with thrombin, which forms a randomly arranged 3-D network of fibrin fibers.
At the fiber scale, experimental observations using optical tweezers and atomic force microscopy (AFM) as well as computational simulations show that individual fibers act as strain stiffening elastic beams [15–20]. While force transmission at the scale of single fibers is well understood, force transmission in assembled networks has not been fully elucidated [21]. At scales much larger than the average pore size, the material can be treated as a continuum, but at the scale of pores, and even cells, it is necessary to consider that forces cannot elastically transmit through the liquid region and are confined to the fibers [9,22]. At this mesoscale, the existence of a preferred pathway for force transmission or a ‘force transmission highway’ has been observed in simulations and inferred in experimental observations [7,9,21,23–25]. Simulations that take into account the fibrous structure of the ECM show that when the matrix is extended, subsets of fibers within the network carry higher tension than would be expected from a continuum model of the material, while other fibers carry less tension or are buckled under compression [22,23]. How and where these high tension pathways form and change may play a role in cell orientation [26], cell migration or invasion [27,28], and capillary sprouting [29]. A method for directly assessing which fibers in a network carry tension can provide insight into force transmission at this mesoscale.
Here, we describe an approach to detect which fibers within a 3-D fibrin hydrogel are involved in force transmission. Optical tweezers are used to apply a low frequency oscillatory force to a bead embedded in a fibrin network. We measure the response of the fibers within the network using confocal microscopy by analyzing the fluctuation of the fluorescence intensity. Both confocal microscopy and optical tweezers are able to access regions deep within a hydrogel without invasive disruption of the structure, unlike AFM. Future studies will aim to extend this method for identifying force transmission pathways around cells and to study how naturally derived ECMs participate in cell-cell and cell-ECM communication.
2 Materials and Methods
2.1 Fibrin Gel
Bovine fibrinogen (Sigma-Aldrich, F8630) was dissolved in Phosphate buffered saline (PBS; ThermoFisher, 14040117) and sterile filtered 0.22 μm. 2 μm beads (Bang Laboratories, SC05000) were added to the fibrin solution (final concentration 1.5 mg/ml clottable protein) and thrombin (final concentration 4 U/mL; Sigma-Aldrich, 605,157) was added immediately before casting the hydrogel in glass bottom dishes (MatTek, P35G-1.5–10-C). After at least 12 h incubation at
2.2 Bead Oscillation
A 1064 nm continuous wave laser (IPG, YLR-5-1064-LP) was used to optically trap a 2 m diameter silica bead embedded approximately 35 μm above the glass in a fibrin network with a 60×1.45 NA oil immersion microscope objective (Olympus). The focused laser beam was steered as a sine wave in the image plane using galvanometer mirrors (Thorlabs, GVS102). Bead displacement was detected by a co-aligned 785 nm (Thorlabs, LP785-SF100) laser-diode beam. The beam was back scattered from the bead and directed onto a quadrant photodetector (Newport, 2,901 and 2,903). Trap stiffness was determined by trapping a bead without oscillation of the trap and measuring the corner frequency of the displacement power spectrum in water [30]. Laser power was adjusted to achieve a trap stiffness of 34 pN/m for all experiments. Schematic of the optical tweezer system can be found in Supplementary Figure S1. Optical tweezers were used to oscillate the bead in the x (horizontal in the image) or y (vertical in the image) directions at the desired frequency (driving frequency,
2.3 Fluorescence Microscopy
Fluorescence microscopy images were recorded using an Olympus Fluoview 1,200 laser scanning confocal microscope. The Atto 488 NHS-ester fluorophore was excited using the 488 nm laser line operating at 0.7% of maximum power as indicated in the Olympus Fluoview software. Images of fibrin were acquired using the rapid-scanning imaging mode to achieved maximum frame rates of 15.4 frames/second. This imaging mode limits image resolution to 256 by 256 pixels to cover a field of view of 21.1 μm by 21.1 μm unless otherwise stated. 400 consecutive images were recorded over 26 s. Z-stacks of at least 10 μm thickness (5 μm above and below the bead) were acquired prior to bead oscillation in order to identify the local fiber network around each bead.
2.4 Image Analysis
Images in the Olympus OIF format were converted to TIFF files using ImageJ [31]. Pixel-by-pixel 1-D Fourier transforms were performed in MATLAB (MathWorks). Figures were generated with MATLAB. Binary image masks were generated by setting a threshold of mean intensity (in time) of each pixel that is 20% greater than mean intensity (in space and time) of all pixels. Pseudo-color 3-D image stacks were generated using the ‘temporal-color code’ function in ImageJ and all figures were arranged in Microsoft PowerPoint. Our custom MATLAB code is made available in Supplementary Materials along with all TIFF images. One must first execute pixelflucatuation.m for image input and fast Fourier transform computation. Next, pixelflucatuationfigures.m should be executed. It operates on the output from pixelflucatuation.m to generate all figures. The code as provided assumes all files are placed in the same folder.
2.5 Quantification of Local Phase Variance
The Orientational Order Parameter (OOP), also known as the nematic order parameter [32,33], was used to determine local organization in phase (θ) images. For OOP, the variance in the orientation of n unit pseudovectors (
In order to calculate the OOP, the tensor,
The orientational order tensor,
In order to quantify local phase organization, the OOP was calculated at each pixel in a 7 × 7 pixel neighborhood. The MATLAB functions calculate_OOP.m and hoodOOP.m, found in the Supplementary Materials, were used for the OOP calculations.
3 Results
Fluorescence confocal microscopy videos were recorded while optical tweezers applied an oscillatory force on a 2 μm bead entangled in a fibrous fibrin network. Supplementary Video S1 shows a bead with no applied oscillation. Supplementary Video S2 shows the same bead oscillated in the horizontal x-direction. The bead and some of the surrounding fibers move noticeably in response to the oscillation of the optical tweezers. For many fibers, motion is difficult to track precisely from frame to frame due to noise. However, a subset of pixels show increased intensity fluctuations at the optical tweezers’ drive frequency (
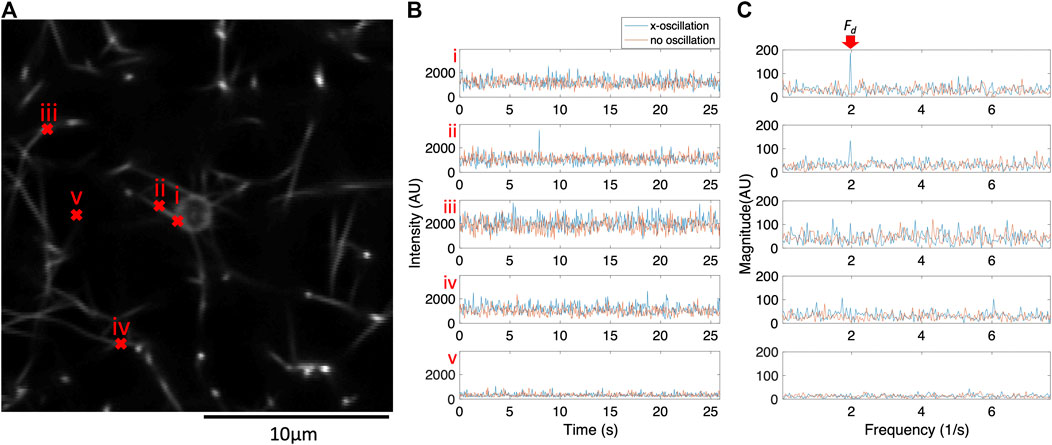
FIGURE 1. The frequency components of pixel intensity fluctuations for a subset of pixels respond to the physical oscillations of the bead. For this subset of pixels, peak intensity fluctuations occur at the same frequency as the optical tweezers oscillation (
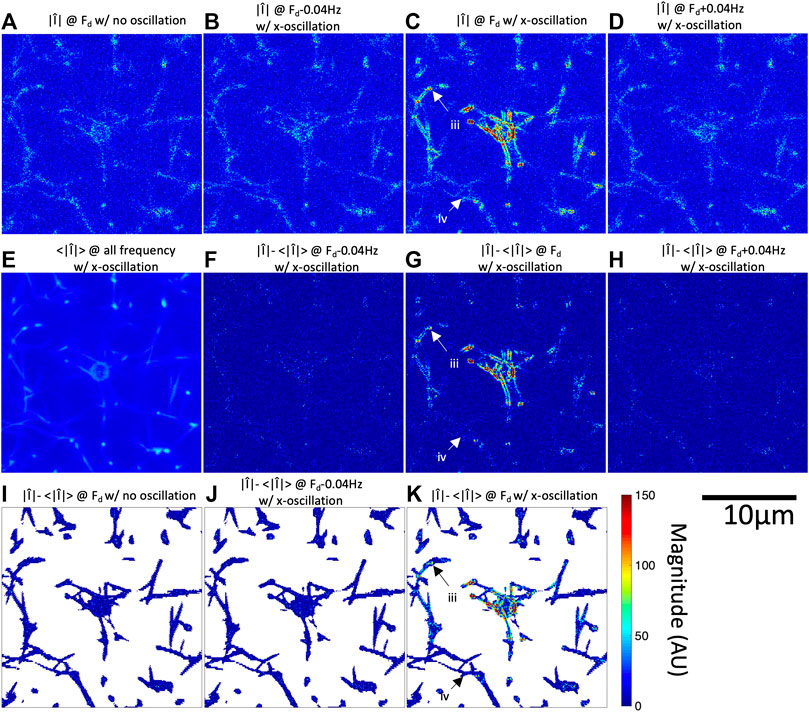
FIGURE 2. Fourier magnitude image at
In addition to
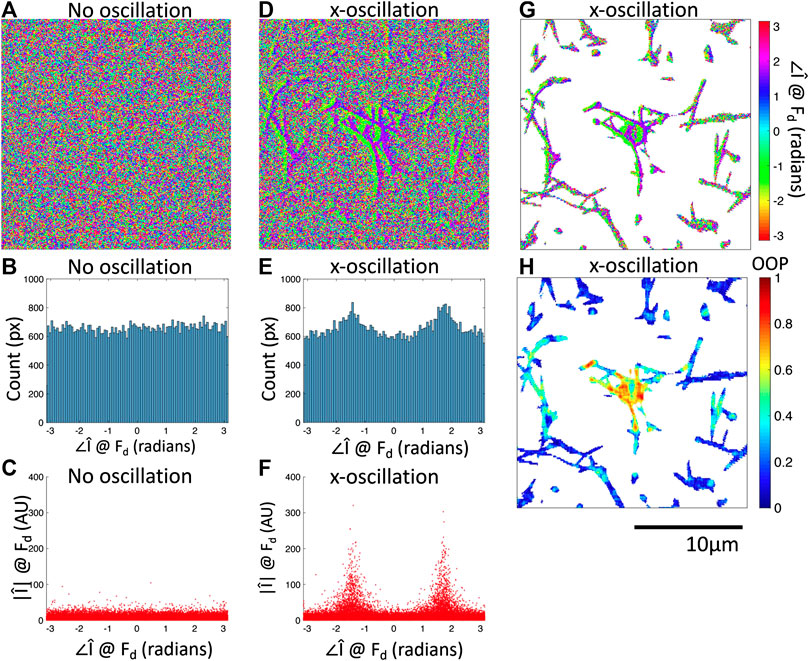
FIGURE 3. Fourier phase images at
We have shown that oscillation of the optical tweezers with an amplitude of 1 m results in a response from the bead and a subset of the fiber network detectable by the
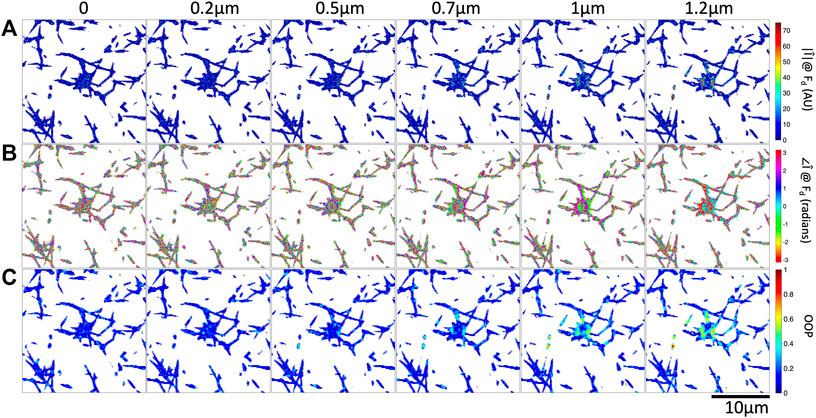
FIGURE 4. Increasing optical tweezers oscillation amplitude results in increased Fourier magnitude and more organized Fourier phase at
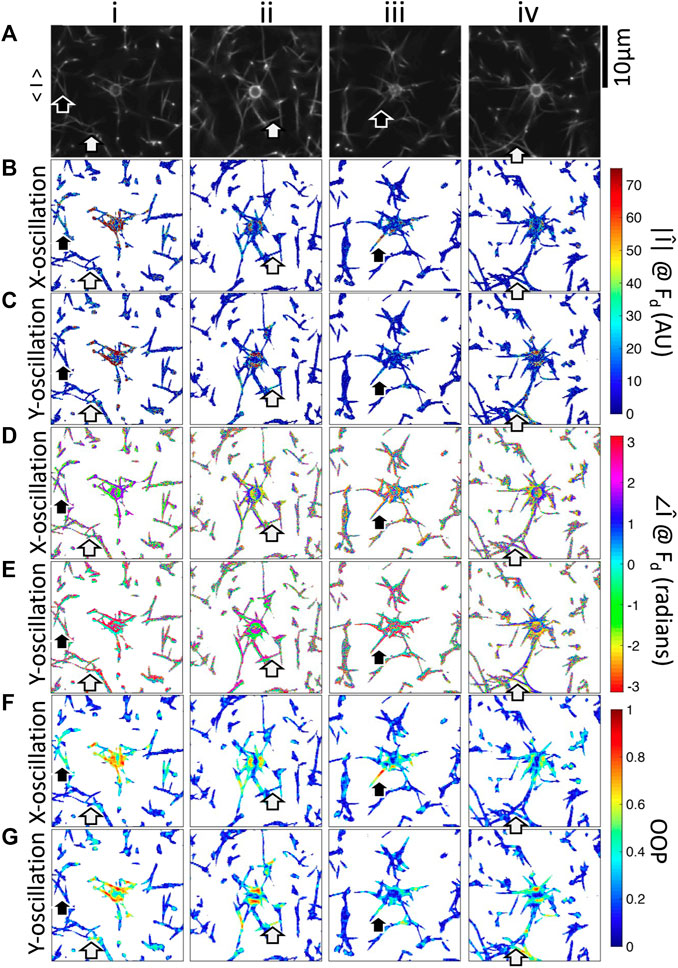
FIGURE 5. Fourier magnitude, phase, and OOP images of four beads embedded in fibrin networks oscillated in the x-direction or y-direction. i–iv are different beads. (A) Fluorescence microscopy images showing the bead and fibers. Mean-magnitude subtracted images at
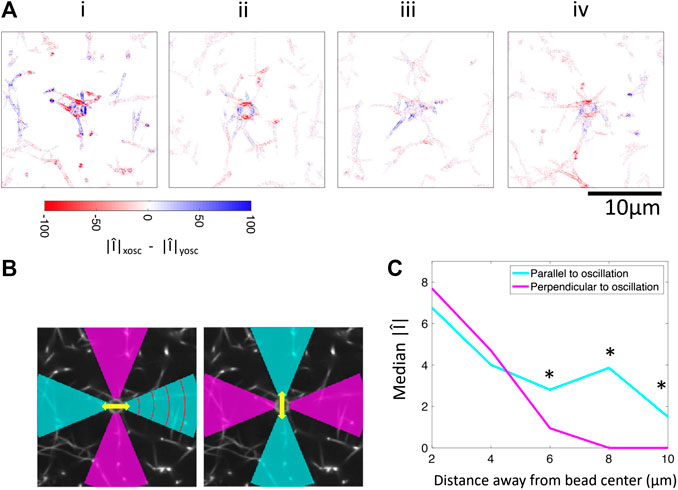
FIGURE 6. Comparison of Fourier magnitudes in response to applied oscillations in the x-direction and y-direction. (A) Difference between Fourier magnitude at
4 Discussion
We have shown a method to identify which fibers within a 3-D fiber network carry tension in response to the application of a localized force. Specifically, the method determines which fibers are oscillating in phase with an actively driven bead embedded within a pore of the network and assumes that pure elastic forces are driving these fiber motions. Here, fiber oscillation is measured by quantifying intensity fluctuations of all pixels in a plane confocal to the bead. As expected, Fourier magnitudes of pixel intensity fluctuations (
Force transmission pathways as detected by fiber fluctuation analysis is highly variable from bead to bead due to the different network structure. One consistent observation is that fibers not appearing to be connected to the bead in the confocal
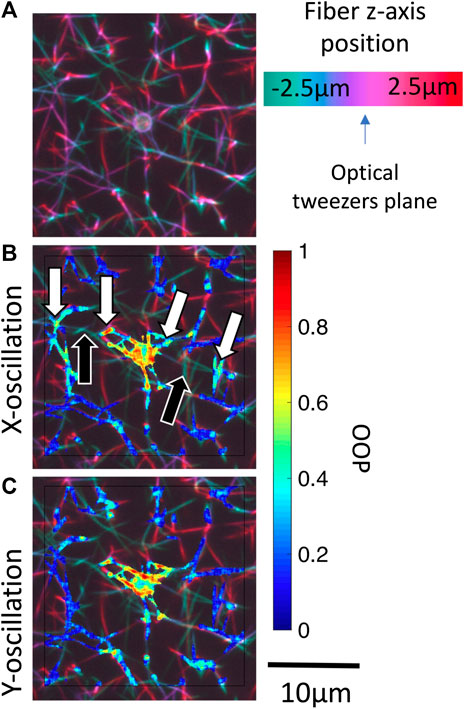
FIGURE 7. Identification of potential out-of-plane force transmission pathways. (A) Pseudo color projection is used to encode depth within a 3-D confocal image stack for bead i (Figure 5). Masked local OOP images are superposed onto the depth images for oscillations in the (B)x-direction and (C)y-direction. Black arrows indicate out-of-plane fibers which may be transmitting forces. White arrows indicate the oscillating fiber network regions on either side of the out-of-plane fiber. Supplementary Figure S3 shows OOP overlaid on 3-D confocal image stack for beads i-iv.
Lastly, we discuss a caveat of this intensity fluctuation analysis.
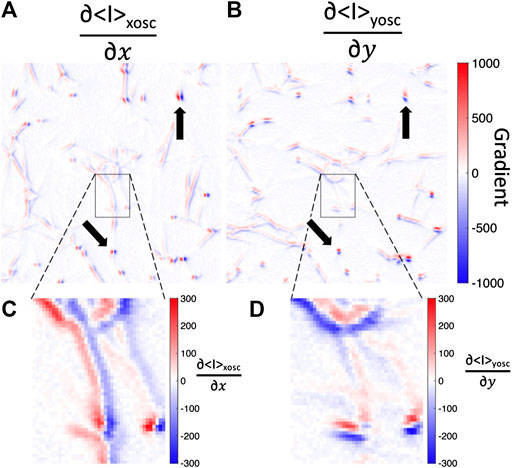
FIGURE 8. Fluorescence image intensity gradients are steep across fibers but not along fibers. Spatial gradients in the (A)x-direction or (B)y-direction of the mean-intensity image while the bead is oscillated in the (A)x-direction (
In conclusion, we developed a straightforward approach to quantitatively determine which fibers are participants in force transmission highways. The use of local variations in the phase of intensity fluctuations provides sensitivity to even small displacements in the fiber network, where magnitude of intensity fluctuations were not distinguishable from noise. Ultimately, we aim to observe changes to the force transmission characteristics of biologically derived fiber networks and how these characteristics change as cells interact with the ECM. While we have shown the response of a fiber network in its relaxed state, future application of this technique lies in exploring how the response changes when the network contains cells. For example, cell contractile forces will apply a tensile preload that may change the subset of tensed fibers thus altering the scope of cell-cell force communication. Such observations of how force transmission pathways change in response to cellular contraction and ECM remodeling offers potentially new insights into processes such as growth, wound healing, cancer growth and metastasis.
Data Availability Statement
The raw data supporting the conclusions of this article will be made available by the authors, without undue reservation. Raw data related to the article can also be found at the following Dryad link: https://doi.org/10.7280/D1ZT21.
Author Contributions
QH was responsible for planning, data acquisition, analysis, and writing for the paper. TM and AG were responsible for analysis and writing for the paper. AL and EB were responsible for planning, analysis, and writing for the paper.
Conflict of Interest
The authors declare that the research was conducted in the absence of any commercial or financial relationships that could be construed as a potential conflict of interest.
Acknowledgments
We would like to thank Micah Lim for assisting with data acquisition and editing the manuscript. We would like to thank Dr. Mark Keating and Alicja Jagiełło for their contribution in building the optical tweezers microscopy system. QH and EB acknowledges support from the United States Air Force Office of Scientific Research FA9550-17-1-0,193 and the Office of the President of the University of California. TM and AG acknowledges support from NIH R01 HL129008 and NIH T32 HL116270. AL acknowledges partial support from NSF-DMR-1709785.
Supplementary Material
The Supplementary Material for this article can be found online at: https://www.frontiersin.org/articles/10.3389/fphy.2020.568736/full#supplementary-material.
References
1. Janmey PA, Winer JP, Murray ME, Wen Q. The hard life of soft cells. Cell Motil Cytoskeleton (2009) 66:597–605. doi:10.1002/cm.20382
2. Falvo PA, Fletcher D, Reinhart-King CA. Stiffness sensing in cells and tissues. Physiol Rev (2019) 100:455–506. doi:10.1007/978-1-4020-9003-5_11
3. Edmondson R, Broglie JJ, Adcock AF, Yang L. Three-dimensional cell culture systems and their applications in drug discovery and cell-based biosensors. Assay Drug Dev Technol (2014) 12:207–18. doi:10.1089/adt.2014.573
4. Caliari SR, Burdick JA. A practical guide to hydrogels for cell culture. Nat Methods (2016) 13:405–14. doi:10.1038/nmeth.3839
5. Pedersen JA, Swartz MA. Mechanobiology in the third dimension. Ann Biomed Eng (2005) 33:1469–90. doi:10.1007/s10439-005-8159-4
6. Buxboim A, Rajagopal K, Brown AE, Discher DE. How deeply cells feel: methods for thin gels. J Phys Condens Matter (2010) 22:194116. doi:10.1088/0953-8984/22/19/194116
7. FabryMünster C, Pastore JJ, MacKintosh FC, Lubensky TC, Janmey PA. Nonlinear elasticity in biological gels. Nature (2005) 435:191–4. doi:10.1038/nature03521
8. Rudnicki MS, Cirka HA, Aghvami M, Sander EA, Wen Q, Billiar KL. Nonlinear strain stiffening is not sufficient to explain how far cells can feel on fibrous protein gels. Biophys J (2013) 105:11–20. doi:10.1016/j.bpj.2013.05.032
9. Ma X, Schickel ME, Stevenson MD, Sarang-Sieminski AL, Gooch KJ, Ghadiali SN, et al. Fibers in the extracellular matrix enable long-range stress transmission between cells. Biophys J (2013) 104:1410–8. doi:10.1016/j.bpj.2013.02.017
10. Ronceray P, Broedersz CP, Lenz M. Fiber networks amplify active stress. Proc Natl Acad Sci USA (2016) 113:2827–32. doi:10.1073/pnas.1514208113
11. Clark RA. Fibrin and wound healing. Ann N Y Acad Sci (2001) 936:355–67. doi:10.1111/j.1749-6632.2001.tb03522.x
12. Morin KT, Tranquillo RT. In vitro models of angiogenesis and vasculogenesis in fibrin gel. Exp Cell Res (2013) 319:2409–17. doi:10.1016/j.yexcr.2013.06.006
13. de la Puente P, Ludeña D. Cell culture in autologous fibrin scaffolds for applications in tissue engineering. Exp Cell Res (2014) 322:1–11. doi:10.1016/j.yexcr.2013.12.017
14. Weisel JW, Litvinov RI. Fibrous proteins: structures and mechanisms formation, structure and properties. Subcell Biochem Springer (2017) 82:405–56. doi:10.1007/978-3-319-49674-0_13
15. Collet JP, Shuman H, Ledger RE, Lee S, Weisel JW. The elasticity of an individual fibrin fiber in a clot Proc Natl Acad Sci USA (2005) 102:9133–7. doi:10.1073/pnas.0504120102
16. Liu W, Carlisle C, Sparks E, Guthold M. The mechanical properties of single fibrin fibers. J Thromb Haemostasis (2010) 8:1030–6. doi:10.1111/j.1538-7836.2010.03745.x
17. Sun OV, Litvinov RI, Weisel JW, Alber MS. Structural basis for the nonlinear mechanics of fibrin networks under compression. Biomaterials (2014) 35:6739–49. doi:10.1016/j.biomaterials.2014.04.056
18. Hudson NE, Houser JR, O'Brien ET, Taylor RM, Superfine R, Lord ST, et al. Stiffening of individual fibrin fibers equitably distributes strain and strengthens networks. Biophys J (2010) 98:1632–40. doi:10.1016/j.bpj.2009.12.4312
19. Yesudasan S, Averett RD. Multiscale network modeling of fibrin fibers and fibrin clots with protofibril binding mechanics. Polymers (2020) 12:1223. doi:10.3390/polym12061223
20. Lim BB, Lee EH, Sotomayor M, Schulten K. Molecular basis of fibrin clot elasticity. Structure (2008) 16:449–59. doi:10.1016/j.str.2007.12.019
21. Grill MJ, Kernes J, Slepukhin VM, Wall WA, Levine AJ (2020). Directed force propagation in semiflexible networks. arXiv preprint arXiv:2006.15192.
22. Wang H, Abhilash A, Chen CS, Wells RG, Shenoy VB. Long-range force transmission in fibrous matrices enabled by tension-driven alignment of fibers. Biophys J (2014) 107:2592–603. doi:10.1016/j.bpj.2014.09.044
23. Notbohm J, Lesman A, Rosakis P, Tirrell DA, Ravichandran G. Microbuckling of fibrin provides a mechanism for cell mechanosensing. J R Soc Interface (2015) 12:20150320. doi:10.1098/rsif.2015.0320
24. Hart A, Sopher RS, Goren S, Shelah O, Tchaicheeyan O, Lesman A. Force chains in cell–cell mechanical communication. J R Soc Interface (2019) 16:20190348. doi:10.1098/rsif.2019.0348
25. Natan S, Koren Y, Shelah O, Goren S, Lesman A. Long-range mechanical coupling of cells in 3d fibrin gels. Mol Biol Cell (2020) 31:1474–85. doi:10.1091/mbc.E20-01-0079
26. Vader D, Kabla A, Weitz D, Mahadevan L. Strain-induced alignment in collagen gels. PLoS One (2009) 4:e5902. doi:10.1371/journal.pone.0005902
27. Kim J, Feng J, Jones CAR, Mao X, Sander LM, Levine H, et al. Stress-induced plasticity of dynamic collagen networks. Nat Commun (2017) 8:842–7. doi:10.1038/s41467-017-01011-7
28. CardonaPreibisch Q, Ghosh RP, Engelke H, Rycroft CH, Cassereau L, Sethian JA, et al. Rapid disorganization of mechanically interacting systems of mammary acini. Proc Natl Acad Sci USA (2014) 111:658–63. doi:10.1073/pnas.1311312110
29. Korff T, Augustin HG. Tensional forces in fibrillar extracellular matrices control directional capillary sprouting. J Cell Sci (1999) 112 (Pt 19):3249–58
30. Keating M, Kurup A, Alvarez-Elizondo M, Levine A, Botvinick E. Spatial distributions of pericellular stiffness in natural extracellular matrices are dependent on cell-mediated proteolysis and contractility. Acta Biomater (2017) 57:304–12. doi:10.1016/j.actbio.2017.05.008
31. Schindelin J, Arganda-Carreras I, Frise E, Kaynig V, Longair M, Pietzsch T, et al. Fiji: an open-source platform for biological-image analysis. Nat Methods (2012) 9:676–82. doi:10.1038/nmeth.2019
32. Meier G, Saupe A. Dielectric relaxation in nematic liquid crystals. Mol Cryst Liq Cryst (1966) 1:515–25.
33. Chaikin P, Lubensky T. Principles of condensed matter physics. Cambridge: cambridge univ. Press (1995).
34. Umeno A, Kotani H, Iwasaka M, Ueno S. Quantification of adherent cell orientation and morphology under strong magnetic fields. IEEE Trans Magn (2001) 37:2909–11. doi:10.1109/20.951344
35. Grosberg A, Kuo PL, Guo CL, Geisse NA, Bray MA, Adams WJ, et al. Self-organization of muscle cell structure and function. PLoS Comput Biol (2011) 7:e1001088. doi:10.1371/journal.pcbi.1001088
36. Morris TA, Naik J, Fibben KS, Kong X, Kiyono T, Yokomori K, et al. Striated myocyte structural integrity: automated analysis of sarcomeric z-discs. PLoS Comput Biol (2020) 16:e1007676. doi:10.1371/journal.pcbi.1007676
37. Grosberg PM, Feshbach H. Methods of theoretical Physics. New York: McGraw-Hill Book Campany, Inc (1954). Vol. 1.
38. Levine AJ, Lubensky T. One- and two-particle microrheology. Phys Rev Lett (2000) 85:1774. doi:10.1103/PhysRevLett.85.1774
39. Han YL, Ronceray P, Xu G, Malandrino A, Kamm RD, Lenz M, et al. Cell contraction induces long-ranged stress stiffening in the extracellular matrix. Proc Natl Acad Sci USA (2018) 115:4075–80. doi:10.1073/pnas.1722619115
40. Horn BK, Schunck BG. Determining optical flow techniques and applications of image understanding. Int Society Opt Photonics (1981) 281:319–31
41. Beauchemin SS, Barron JL. The computation of optical flow. ACM Comput Surv (1995) 27:433–66. doi:10.1109/wvm.1989.47101
42. Mesbah M. Gradient-based optical flow: a critical review. In: ISSPA’99. Proceedings of the fifth international symposium on signal processing and its applications, 1 (1999). Brisbane, Queensland, Australia, Australia; 22-25 August 1999; p. 467–70. IEEE Cat. No. 99EX359).
43. Chen JG, Davis A, Wadhwa N, Durand F, Freeman WT, Büyüköztürk O. Video camera–based vibration measurement for civil infrastructure applications. J Infrastruct Syst (2017) 23:B4016013. doi:10.1061/(asce)is.1943-555x.0000348
44. Yang J, Bhattacharya K. Augmented lagrangian digital image correlation. Exp Mech (2019) 59:187–205. doi:10.1007/s11340-018-00457-0
45. Pan B, Qian K, Xie H, Asundi A. Two-dimensional digital image correlation for in-plane displacement and strain measurement: a review. Meas Sci Technol (2009) 20:062001. doi:10.1088/0957-0233/20/6/062001
46. LiphardtWeaver J, Metzner C, Skodzek K, Lang N, Thievessen I, Mark C, et al. Three-dimensional force microscopy of cells in biopolymer networks. Nat Methods (2016) 13:171–6. doi:10.1038/nmeth.3685
47. ParkerSheehy E-Y, Chawla N, Jing T, Torquato S, Jiao Y. Accurate modeling and reconstruction of three-dimensional percolating filamentary microstructures from two-dimensional micrographs via dilation-erosion method. Mater Char (2014) 89:33–42. doi:10.1016/j.matchar.2013.12.011
48. Liang L, Jones C, Chen S, Sun B, Jiao Y. Heterogeneous force network in 3d cellularized collagen networks. Phys Biol (2016) 13:066001. doi:10.1088/1478-3975/13/6/066001
Keywords: fibrin, fiber, force transmission, fluctuations, optical tweezers, extracellular matrix, microrheology
Citation: Hu Q, Morris TA, Grosberg A, Levine AJ and Botvinick EL (2021) Actively Driven Fluctuations in a Fibrin Network. Front. Phys. 8:568736. doi: 10.3389/fphy.2020.568736
Received: 02 June 2020; Accepted: 14 December 2020;
Published: 25 February 2021.
Edited by:
Halina Rubinsztein-Dunlop, The University of Queensland, AustraliaReviewed by:
Nobuhiko Yokoshi, Osaka Prefecture University, JapanChristoph F. Schmidt, Duke University, United States
Copyright © 2021 Hu, Morris, Grosberg, Levine and Botvinick. This is an open-access article distributed under the terms of the Creative Commons Attribution License (CC BY). The use, distribution or reproduction in other forums is permitted, provided the original author(s) and the copyright owner(s) are credited and that the original publication in this journal is cited, in accordance with accepted academic practice. No use, distribution or reproduction is permitted which does not comply with these terms.
*Correspondence: Elliot L. Botvinick, elliot.botvinick@uci.edu