1
Section of Integrative Biology, University of Texas at Austin, Austin, TX, USA
2
Institute of Neuroscience and the Department of Psychology, University of Texas at Austin, Austin, TX, USA
3
Laboratory of Behavioral Neuroendocrinology, Graduate School of Comprehensive Human Sciences, University of Tsukuba, Ibaraki, Japan
In mammals, the formative environment for social and anxiety-related behaviors is the family unit; in the case of rodents, this is the litter and the mother-young bond. A deciding factor in this environment is the sex ratio of the litter and, in the case of mice lacking functional copies of gene(s), the ratio of the various genotypes in the litter. Both Sex and Genotype ratios of the litter affect the nature and quality of the individual’s behavior later in adulthood, as well as metabolic activity in brain nuclei that underlie these behaviors. Mice were raised in litters reconstituted shortly after to birth to control for sex ratio and genotype ratio (wild type pups versus pups lacking a functional estrogen receptorα). In both males and females, the Sex and Genotype of siblings in the litter affected aggressive behaviors as well as patterns of metabolic activity in limbic nuclei in the social behavior network later in adulthood. Further, this pattern in males varied depending upon the Genotype of their brothers and sisters. Principal Components Analysis revealed two components comprised of several amygdalar and hypothalamic nuclei; the VMH showed strong correlations in both clusters, suggesting its pivotal nature in the organization of two neural networks.
Adult sociosexual behavior is the cumulative result of genetics and experience. These experiences begin prenatally in the intrauterine environment, and continue in early postnatal life according to litter composition and maternal behavior, influencing how the individual interacts with the social environment in adulthood (Crews, 1999
; Crews and Groothuis, 2005
; Fleming et al., 2002
; Meaney, 2001
; Moore, 1995
; Moore et al., 1997
; Sakata et al., 2001
). Various studies indicate that experiences can be imprinted epigenetically to influence future generations (Bateson, 2005
; Crews, 2008
; Crews et al., 2007
; Crews and McLachlan, 2006
; Gottlieb, 2002
; Jablonka and Lamb, 1995
; Lewontin, 2000
; Waddington, 1942
, 1953
; West-Eberhard, 2003
).
Complex behaviors such as aggressive, affiliative behaviors, and anxiety-related behaviors depend upon concerted interaction of many brain nuclei acting together, not in isolation. Extensive research has revealed that specific nuclei involved in the regulation of behavior are reciprocally interconnected, often express receptors for steroid hormones, and function in concert as a neural network. Newman (1999)
proposed that behavioral traits depend ultimately upon this social behavior network. Behavioral traits depend ultimately upon the ability of this network(s) of nuclei and neurons to sustain a certain level of metabolic activity necessary for interaction. Of particular interest is how these nuclei might be functionally associated in the adult, and how early environment might change these functional associations. A method that enables study of the long-term consequences of life history changes is cytochrome oxidase IV (COX) quantitative enzyme histochemistry (Sakata et al., 2005
). COX, complex IV of the mitochondrial respiratory chain, the rate-limiting enzyme for the production of utilizable energy derived by coupling oxidative metabolism to the production of ATP. Thus, the abundance of COX serves as an endogenous marker of metabolic capacity in nuclei and neurons, portraying the result of long-term metabolic demand as well as the capacity of a network of nuclei to support specific behaviors. Previous work with rodents reveals that early experience (both pre- and postnatal) significantly affects COX activity in the adult limbic forebrain nuclei and that early experience can modify functional associations of nuclei within integrated neural circuits (c.f., Crews et al., 2006
; Jones et al., 1997
; Sakata et al., 2002
).
In behavioral research with rodents in general, and genetically modified mice in particular, the sex and/or genotype ratios of the litter in which individuals are reared are often ignored. Previous research with estrogen receptor α knockout (ERKO) mice suggests that litter composition influences the sociosexual behaviors of these KO mice in adulthood (Crews et al., 2004
). Namely, when Genotype is considered as a component of litter composition, behavioral differences between the Genotypes are more sharply defined and less variable than reported previously. The present study utilized the same paradigm as described in Crews et al. (2004)
. Thus, pups derived from mating males and females heterozygous (HTZ) for a null mutation of estrogen receptor α (ERα) were sexed and genotyped within 2 days after birth. With this information litters were reconstituted, forming either same-sex/same-genotype controls, same-sex/mixed-genotype litters of equal numbers of KO and wildtype (WT) individuals, mixed-sex/same-genotype, or mixed-sex/mixed-genotype litters of equal numbers of male or female young.
We hypothesized that behavioral variations caused by genetic and developmental factors within the litter environment correlate with differences in behavior and COX activity in specific brain areas later in adulthood. Using genetically-modified mice we demonstrate that the sex and genotype ratio of the litter has a powerful effect on the organization of the neural mechanisms controlling social and anxiety-related behaviors.
Mice
Mice were produced by mating male and nulliparous female mice HTZ for a dysfunctional ERα gene, which were backcrossed to C57B/6J mice. These mice were obtained from the breeding colony maintained at Rockefeller University. Two to three females were housed with a male, and, when they were visibly pregnant (3–5 days before the day of delivery based on post hoc analyses), they were singly housed. Animal rooms were maintained on a 12:12 h Light:Dark cycle at constant temperature (22°C) with food (PicoLab Rodent Diet 20, Oakville, ON, Canada) and water available ad libitum. All procedures were approved by the Rockefeller University, University of Tsukuba, and University of Texas Animal Use and Care Committees.
All pups were sexed and genotyped within 2 days of birth and the litters re-constituted on PND 2. During this period, each pup received individual identification marks on the body by a Sharpie™ permanent marker, a procedure that was repeated each day. After genotyping, individuals were identified with individually specific toe clips for permanent identification. In all instances, HTZ females that had contributed young to the study served as foster mothers.
Littermates were separated in a systematic manner to insure that litter source was not overrepresented in each group. Pups were reared in litters of four; all individuals survived to weaning. As in previous studies with these animals, individuals continued to be group-housed with littermates of the same sex and genotype following weaning. Unlike previous studies, individuals were housed according to genotype (e.g., ♂WT with only ♂WT) after weaning. Two weeks before behavior testing, all animals were individually housed. Behavioral testing began at approximately 8 weeks of age for all mice and included tests of anxiety (Light:Dark transition test) and of social and aggressive behaviors (resident-intruder test) in this order. All animal husbandry, testing, and euthanasia followed approved institutional IACUC guidelines and NIH Guidelines for the Use of Animals in Research.
Reconstitution of Litters
Two separate studies were performed, one focusing on males and the other on females. Experimental litters were reconstituted from natal litters into one of 16 possible combinations: same-sex, same-genotype; same-sex, mixed-genotype; mixed-sex, same-genotype; mixed-sex, mixed-genotype totaling more than 450 pups. Only four litter types of the 16 possible combinations were impossible to construct in adequate sample sizes and so the present report is limited to the 12 litter types that were reconstituted in sufficient sample sizes for statistical analysis. Table 1
details the distribution of a male or a female animals’ genotype (experimental cohort) with respect to the sex and genotype of the other half of the animals in the litter (Sibling Type) along with the number of litters from each of these groups. The number of individuals and experimental litters reconstituted from natal litters totaled were as follows: for males, a total of 200 individuals divided into 39 same-sex, and 22 mixed-sex litters; for females, a total of 168 individuals divided into 42 same-sex, and 13 mixed-sex litters.
As adults an individual of each sex and genotype from the experimental cohort was chosen at random from each of the litters and tested for anxiety and affiliative behaviors. Another individual was selected at random for the COX histochemistry. Hence individuals used for assessment of brain metabolic activity were not tested before sacrifice, but were the same age as those individuals that were tested.
Behavioral Testing
Light:Dark transition test
The test apparatus consisted of clear plastic box (50 cm × 50 cm × 35 cm) and a black (light opaque) covered-plastic box (50 cm × 25 cm × 25 cm) was inserted in one side (the dark side). The black box had an open doorway (2 cm × 5 cm) that led to the light side of the apparatus, which was illuminated by a 40-W white bulb. Mice were moved from the living room to the experimental room at least 1 h before the test. At the beginning of the tests, mice were removed from their cages, gently placed at the doorway, and released into the dark side of the apparatus (Ogawa et al., 2003
, 2005
). A Digiscan analyzer and software (Omnitech Electronics Inc., Dartmouth, NS, Canada) were used to collect and store horizontal-activity, which was monitored by infrared beams. For each mouse, total activity (total number of beam breaks) and cumulative time spent in each compartment were recorded during 10 min tests. Gonadally intact male and female mice were tested once at 8 weeks of age.
Resident-intruder test
To determine if litter composition influences affiliative behavior in adulthood, mice were tested in a resident-intruder paradigm as in previous studies from this laboratory (Ogawa et al., 1996
, 1997
, 1998a
,b
). All individuals were gonadally intact. In females, the stage of estrous cycle at the time of testing was not determined for experimental females. Behavior tests lasted for 15 min during the dark phase (4–8 h after lights off) under red light. Experimental males were tested with olfactory bulbectomized C57BL/6J male intruders and females were tested with ovariectomized C57BL/6J female intruders. Cumulative duration of social interaction including sniffing, genital licking, and grooming was recorded for each experimental mouse. Experimental males and females were tested on two consecutive days at 9 weeks of age.
Statistics for Behavioral Measures
Behavioral data were analyzed after they were log-transformed, if necessary, so as to normalize the distributions and remove non-homogeneity. They were then analyzed for group differences of each sex by ANOVAs followed by t-test post hoc analyses.
Tissue Preparation and Cytochrome Oxidase Imaging
Brains were removed immediately following decapitation and prepared for COX imaging as per Gonzalez-Lima and Cada (1998)
. The same individual measured all of the areas after extensive training in neuroanatomy. All measures were done blind, the key being broken only after the completion of all measurements.
For the purposes of comparing COX activity between each batch, a two-way ANOVA was performed using whole brain (WB) measures that were partitioned into the factors of three anatomical regions and into the batches in which these brains were stained. The three anatomical regions (rostral, medial, and caudal) as well as the nuclei measured are depicted in Figure 1
. Testing the arbitrary subdivisions of the mouse brain with a small representative random sample of the study population (n = 12) indicated that further subdivision of WB regions from the original subdivisions did not yield significant regional effects on individual nuclei activity after normalization (two-way ANOVA, F = 0.845, df = 9, p = 0.575). This finding suggests that subdivision into three regions is sufficient to capture the regional variation in WB activity. Normalization is used to correct for observed staining variability and allow comparisons between different groups of animals or nuclei. For normalization, the average COX activity of a given nucleus was divided by the respective averaged regional WB COX activity for each individual to generate this value for normalized nucleus activity. This correction was made for all nuclei in the entire population of experimental animals and was used in all subsequent analyses other than ANOVA comparisons; in the latter instance a two-way ANOVA was performed for the factors of Genotype and Sex for WB activity and for each of the 20 nuclei using Hochberg’s GT2 post hoc analysis.
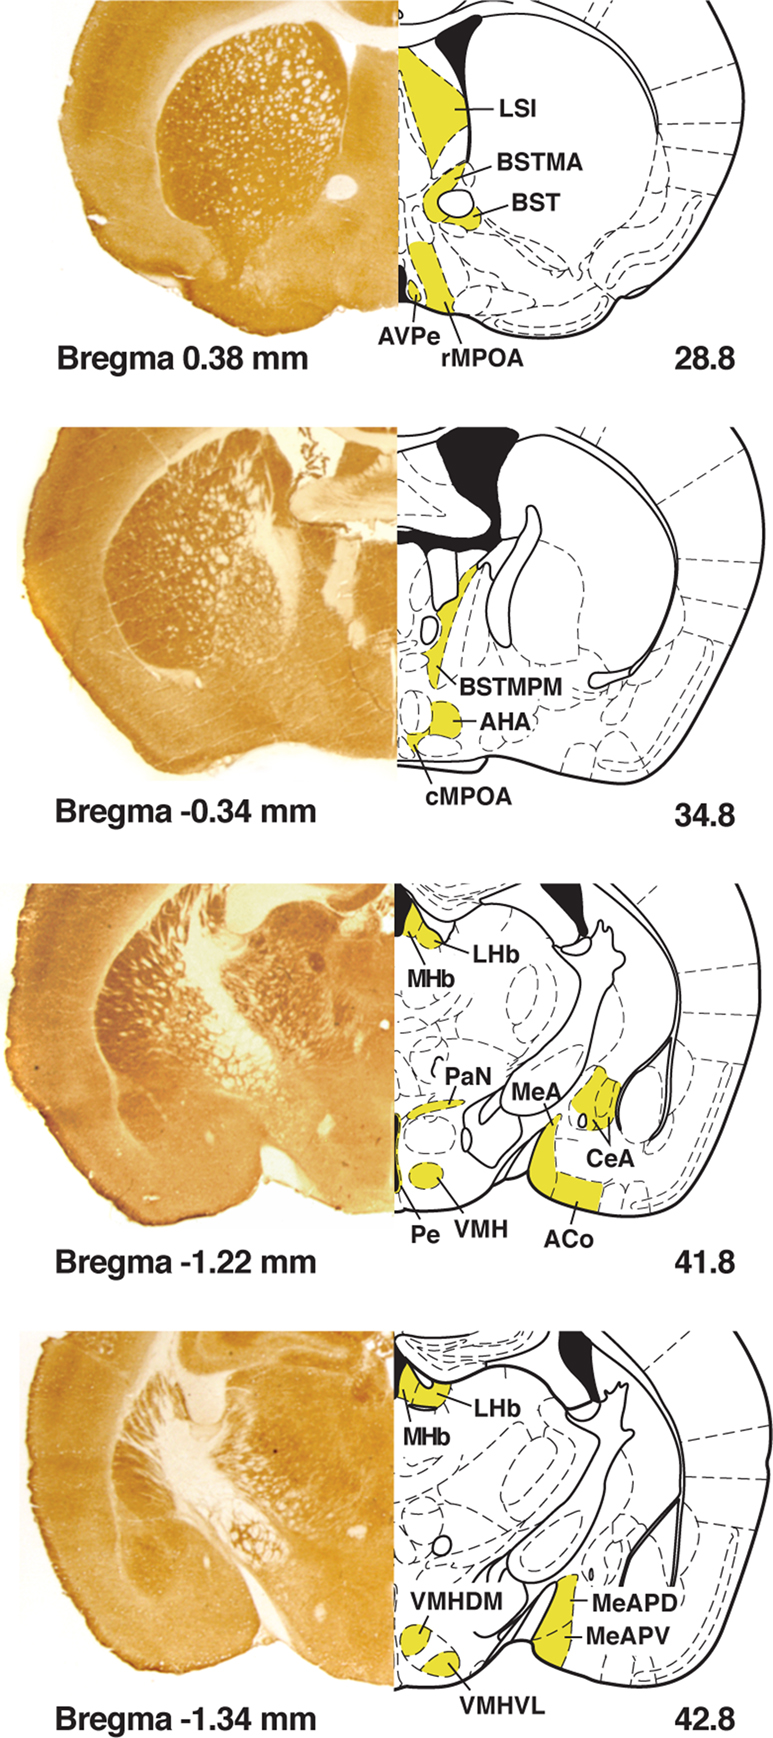
Figure 1. Left column is a composite of sample mouse brain images histochemically stained for cytochrome oxidase with immediate right column delineating the boundaries of nuclei measured in yellow in the corresponding coronal sections in Paxinos and Franklin (2001)
; the bottom left number refers to Bregma and the bottom right number refers to the figure number.
Principal Components Analysis
Data reduction performed with principal component (PC) analysis was used to decompose the full set of all nuclei influences between one another into eigenvectors or PCs that selected a few nuclei that were contributing to most of the variance. In this study, PCs were derived in iteratively repeated attempts to account for as much of the variance in the original correlation matrix as possible, with each subsequent PC accounting for less variance than the PC before it. A plot of these ordered eigenvalues is called a SCREE plot, and can be used to help visually interpret the following criteria for the significance of a PC as outlined by Ecker et al. (2007)
(Figure 2
):
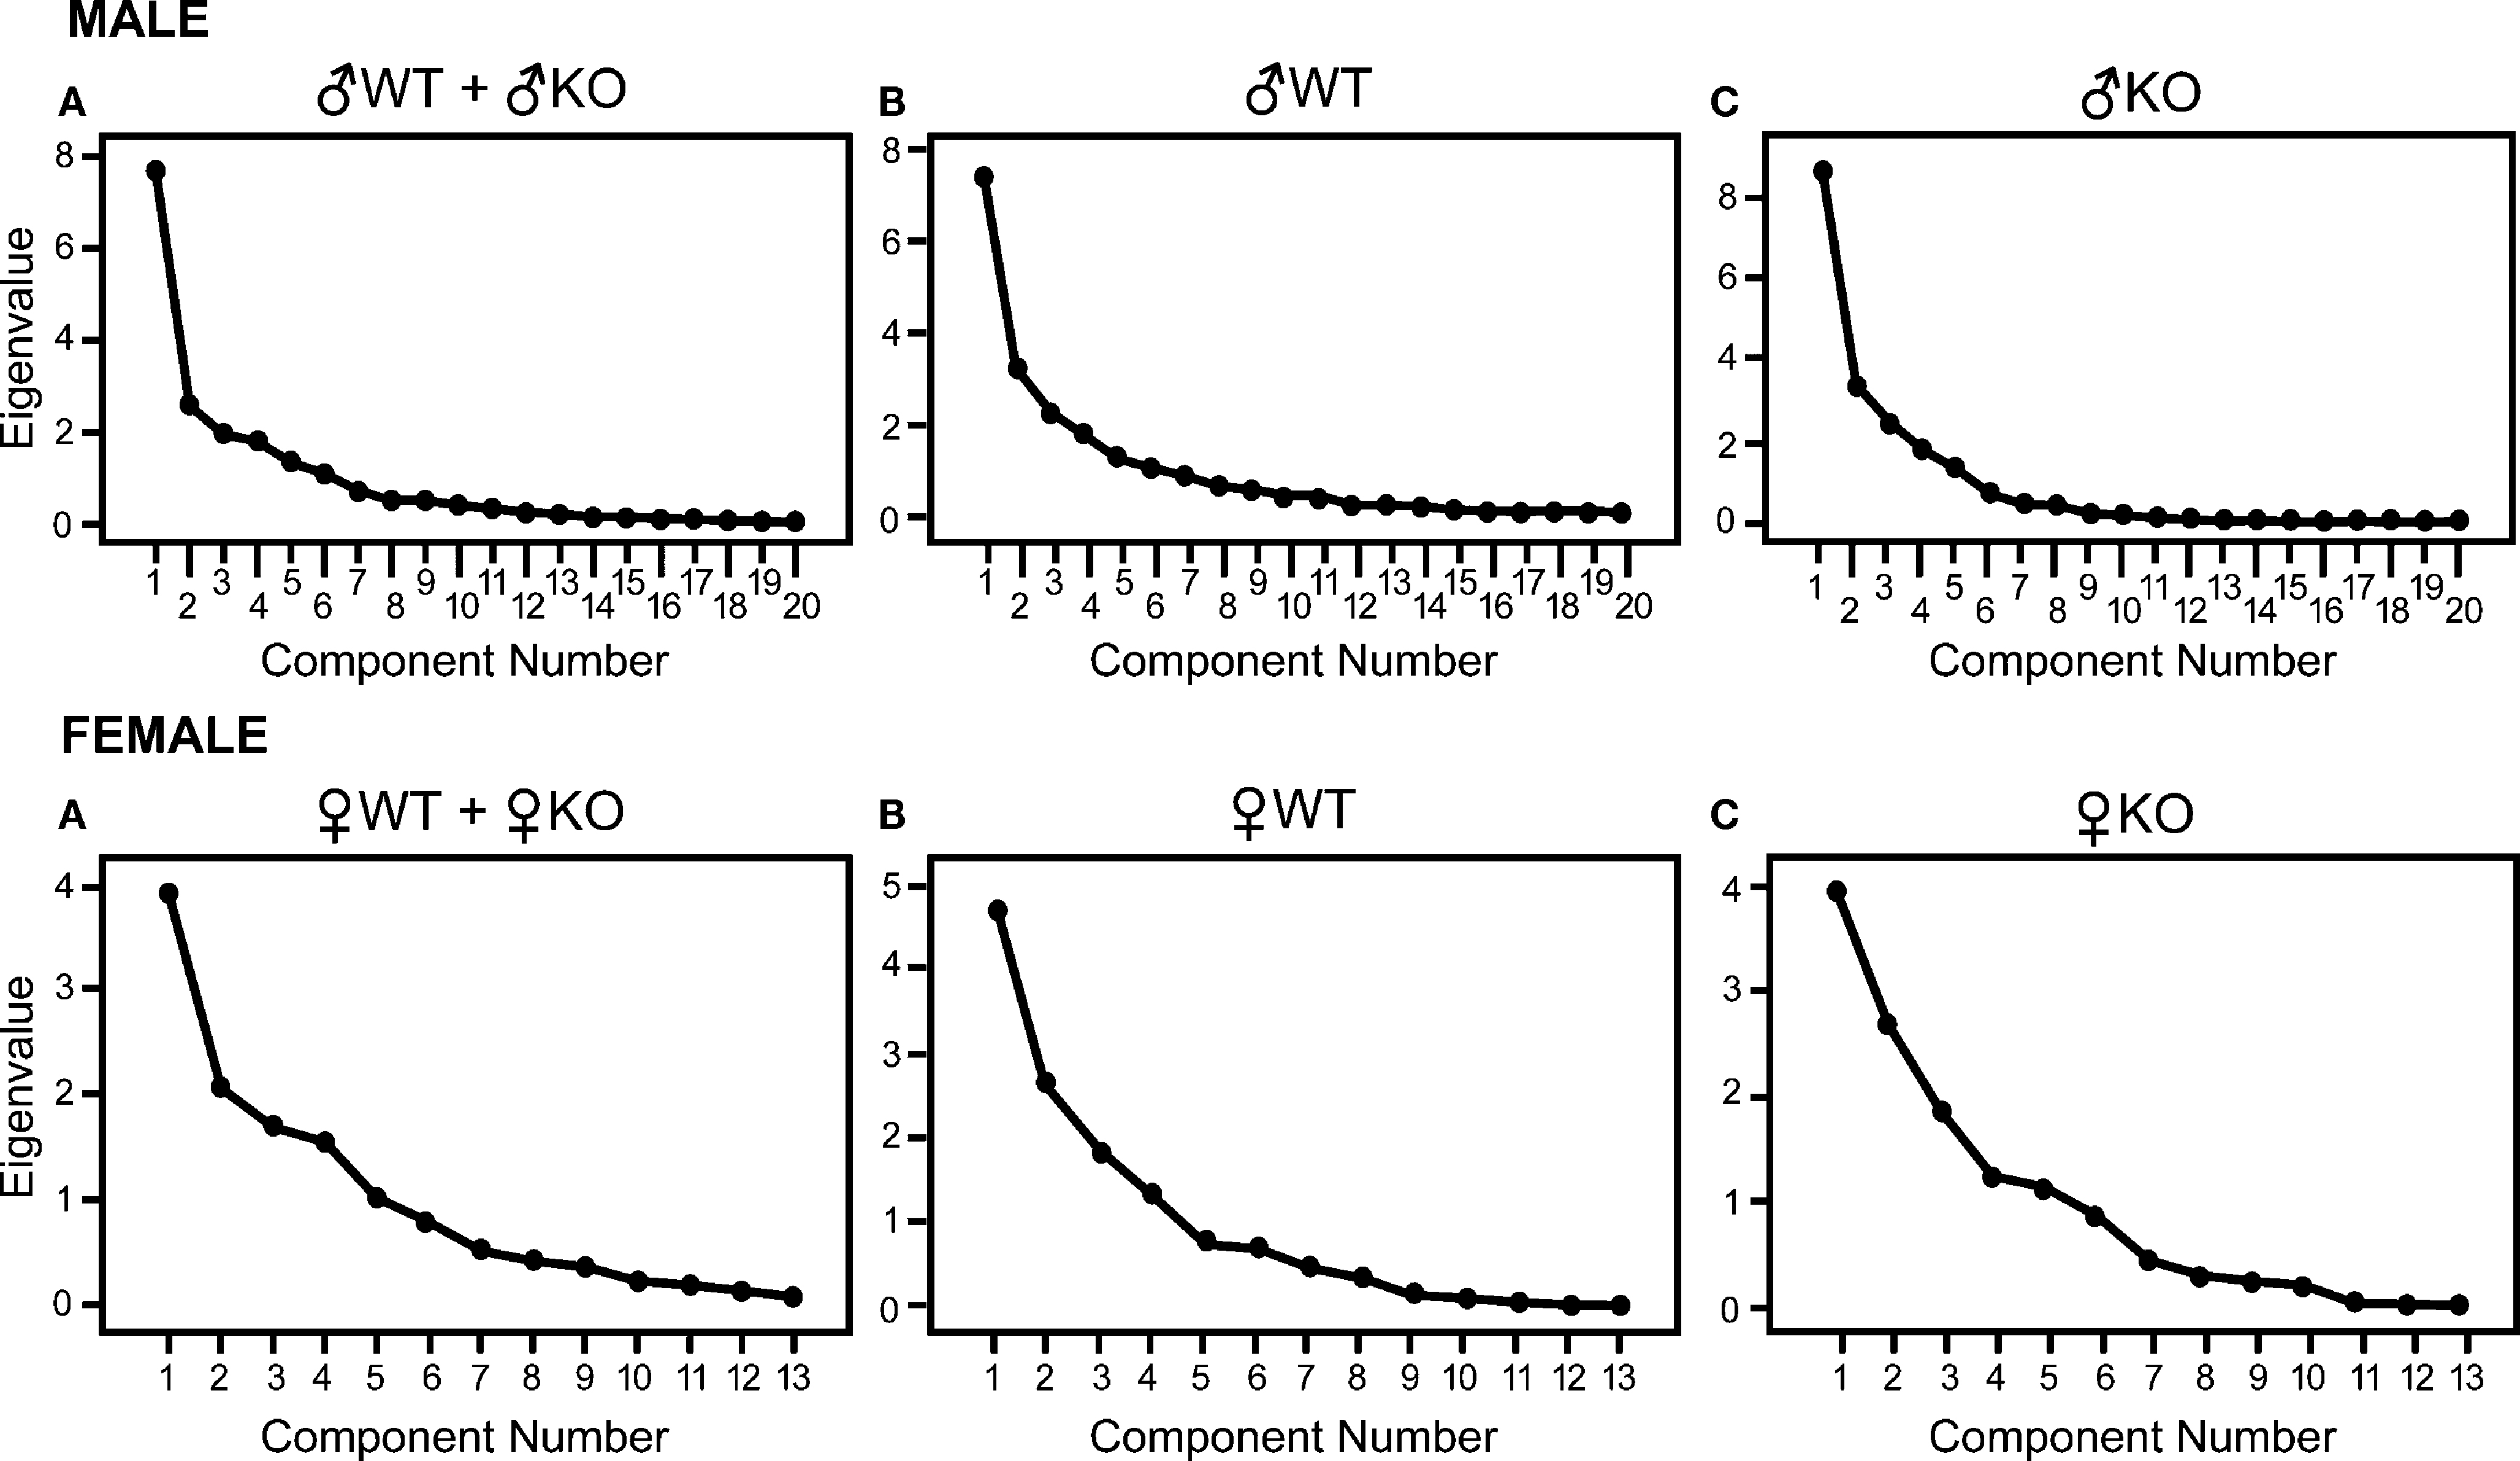
Figure 2. SCREE plots corresponding to the amount of variance that each eigenvalue accounts for. The largest point on the left of each plot is the eigenvalue representing the first principal component derived, which is the first in an iterative process of attempting to account for as much variance as possible in the correlation matrix and its subsequent residual matrices. A precipitous slope, as seen in each SCREE plot, indicates that the amount of variance accounted for by the following component is not nearly as great as the previous. This observation is the basis of Eq. 1. For males each plot shows a main component and a few less significant components that quickly become trivial (triviality is λ2 < 1, see Table 4
), indicating that among the 20 nuclei considered there is an underlying group of nuclei that is primarily driving the strength of the correlation matrix. Females show a less steep slope. Eigenvalues shown in SCREE plots were derived using principal component analysis for males on the top row and females on the bottom. Top row: (A): all males (♂WT + ♂KO; n = 37), (B): ♂WT only (n = 21), and (C): ♂KO only (n = 16). Bottom row: (A): all females (♀WT + ♀KO; n = 34), (B): ♀WT only (n = 17), and (C): ♀KO only (n = 17).
(1) Kaiser’s rule, stated in the following way: l2 > 1, was used to find PCs that account for non-trivial variance within the correlation matrix (Loehlin, 2004
).
(2) If only a few PCs account for most of the variance, as would be expected in the case where there was some amount of shared variance between multiple nuclei, then a few PCs would have a high l2 and the rest would have a low l2. If one PC’s eigenvalue  , where n is the index representing the ordered occurrence of each PC, accounts for more variance than the following PCs, then
  – the difference between the large eigenvalue and the subsequent smaller eigenvalue – should be large in comparison to the difference between the next pair of eigenvalues
  . Following this reasoning, Ecker et al. (2007)
used Equation 1 to determine the significance of the nth PC:
. Following this reasoning, Ecker et al. (2007)
used Equation 1 to determine the significance of the nth PC:
, where n is the index representing the ordered occurrence of each PC, accounts for more variance than the following PCs, then – the difference between the large eigenvalue and the subsequent smaller eigenvalue – should be large in comparison to the difference between the next pair of eigenvalues . Following this reasoning, Ecker et al. (2007)
used Equation 1 to determine the significance of the nth PC:
Each time that this equation is true, a significant drop in the eigenvalues has occurred, and should correspond to a large drop on the SCREE plot.
(3) Only eigenvalues occurring before the end of the first series of large drops in the SCREE plot are considered significant. This is also called the elbow criterion after Catell (1966)
for reasons that become apparent when viewing Figure 2
.
Principal components analysis (PCA) was used to derive PCs from a data set containing all males (n = 37) and later all females (n = 34) in their respective studies that had no missing values for a given set of nuclei used in their analyses. The analysis was also used on each sex for subsets of each of the genotypes used in the analysis. In all, PC analysis was performed three times for each sex: once for all animals in the parsed data set, again for the WT, and then KO within those data sets. After the significant PCs for each group were determined, the coefficients of each nucleus for the significant PCs were checked against the following criterion: if the value of the coefficient was found to be greater than 0.60, then the nucleus of that coefficient is placed into a set of nuclei for further analysis using Pearson’s bivariate correlation along with the jackknifing procedure. All nuclei found significant in a single PC were considered independently of the nuclei considered in another PC unless the same nuclei occurred with a coefficient greater than 0.60 in both PCs; this rule had one exception during analysis of the male tissue that served as a control. The coefficient value used in this analysis was selected for its ability to separate nuclei into smaller groups that did not have a large number of shared nuclei and following the observation that nuclei values below this coefficient were often much lower (0.00–0.30) than the value of 0.6.
Inter-Regional Correlations in Metabolic Activity
Each nucleus selected from a given PC was subjected to a modified jackknifing procedure similar to that used by Sakata et al. (2000)
to find correlations that were consistently significant between nuclei. To find group differences when appropriate, groups were segregated into subsets of the full data set depending upon an experimental factor (i.e., Genotype or Sibling Type) and then subjected to the jackknifing procedure. Correlations found to be significant after jackknifing in multiple groups were tested for a statistically significant difference in correlations between groups. This was done by taking the correlation coefficient from each n − 1 step in the jackknifing procedure and comparing this set of correlations with the equivalent correlations in the comparison group using the t-test with assumed unequal variance.
Limbic Landscapes
For visualization of how discrete nuclei are modified by the litter environment, the limbic landscape method described in Crews et al. (2006)
was utilized.
Behavior: Males
Resident-intruder test
Aggression in male mice was significantly influenced by both the Sex and Genotype of the littermates (Figure 3
A). When raised in litters having either ♂KO or ♀KO littermates, ♂WT were more aggressive than when raised in litters containing either ♂WT or ♀WT littermates. KO males were not aggressive when raised in litters containing either ♂KO or ♂WT littermates.
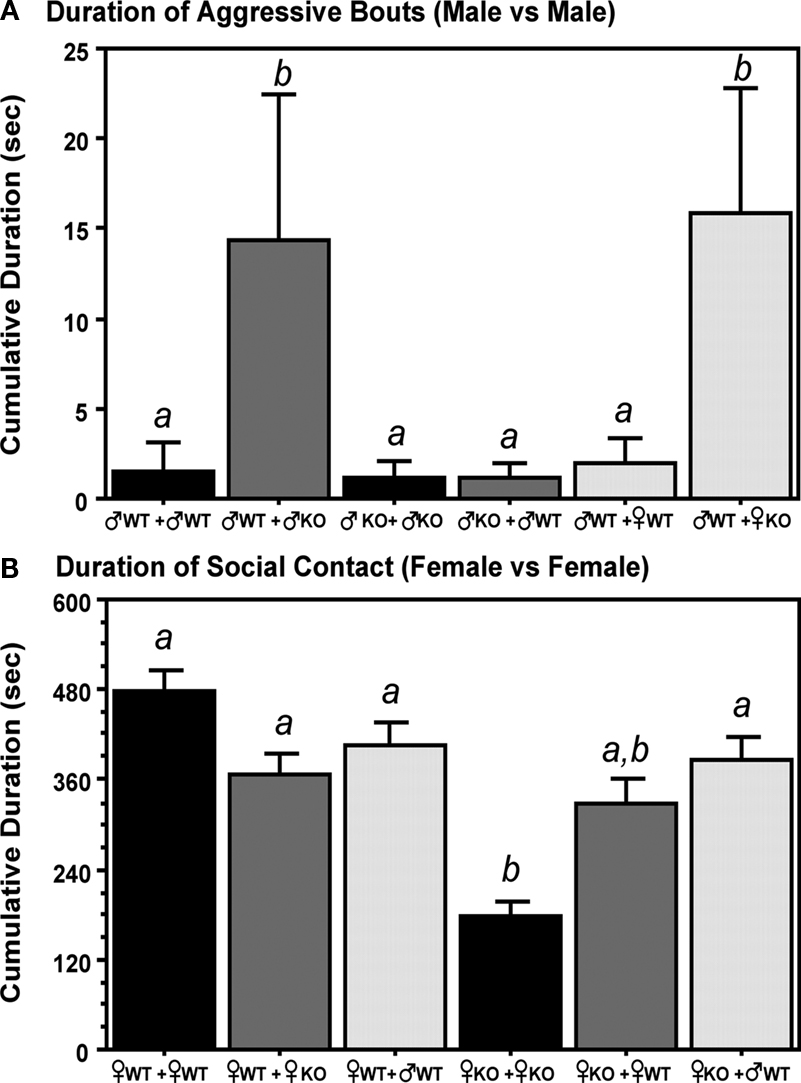
Figure 3. Litter composition affects the sociosexual behaviors of adult male and female estrogen receptor α knockout (ERKO) mice. (A) Represents the duration (seconds) of aggressive bouts exhibited by male mice in resident-intruder tests. (B) Represents the duration seconds) of social contact exhibited by females in resident-intruder tests. Mean and SE is indicated; letters above bars indicate significant differences.
Light:Dark transition test
The cumulative duration spent in the light compartment was significantly increased in ♂WT mice raised with ♀WT littermates, but not when raised with ♀KO littermates (Figure 4
). The latency to move to the light compartment was increased by the presence of ♂KO or ♀KO pups in the litter, but not when the littermates were ♀WT or ♂WT.
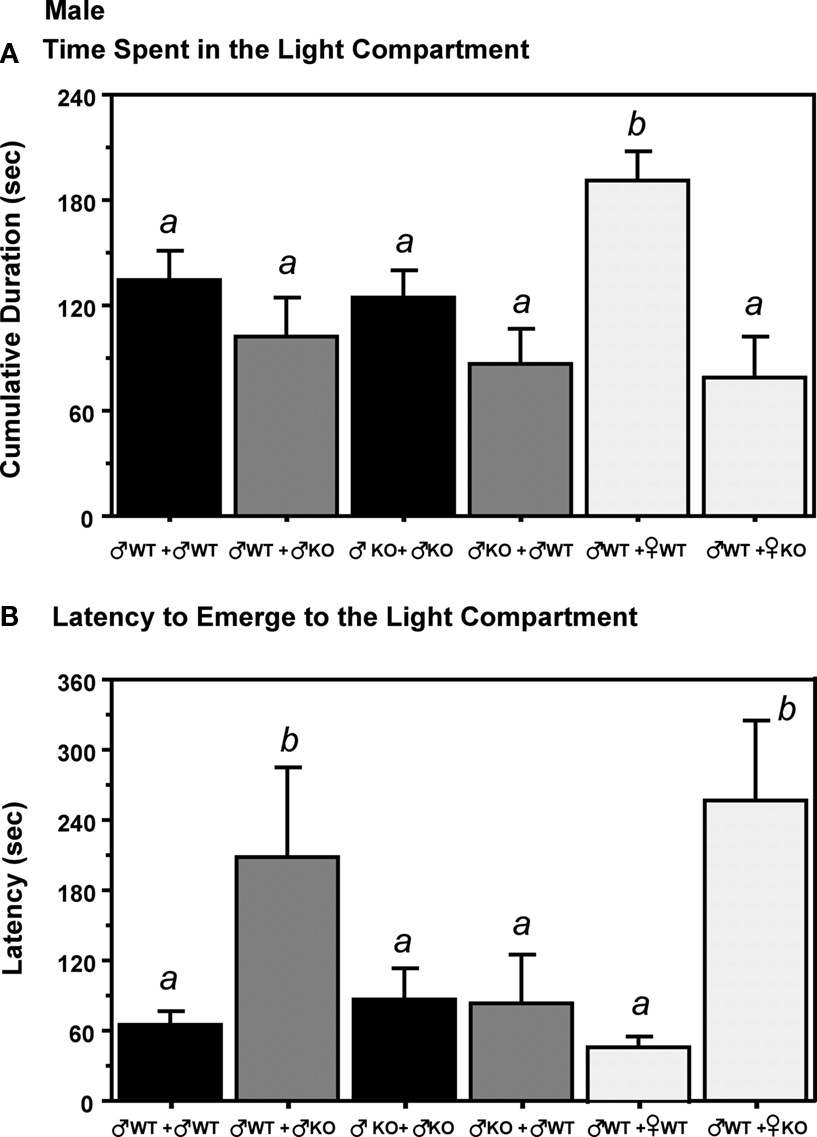
Figure 4. The presence of different genotype of littermates influence later adult behavior in gonadally intact adult male estrogen receptor α knockout (ERKO) mice in Light:Dark transition tests. (A) Represents the time (s) spent in the light compartment. (B) Indicates the latency to emerge to the light compartment. Mean and SE is indicated; letters above bars indicate significant differences.
Behavior: Females
Resident-intruder test
Overall, ♀KO reared only with ♀KO sisters showed significantly less social contact in the resident-intruder test compared to ♀WT raised with ♀WT sisters or when raised with ♀KO or ♂WT littermates (Figure 3
B). Social contact time in ♀KO mice was increased by the presence of ♂WT brothers or ♀WT sisters in the litter; although in the latter instance ♀KO were not significantly from those raised with ♀KO sisters. In contrast, ♀KO raised with ♂WT brothers were not different from ♀WT regardless of litter type.
Light:Dark transition test
There were no significant differences among females according to the Sex or Genotype of their littermates.
Cytochrome Oxidase Activity: Males
There was a significant effect (p < 0.01) on WB activity due to Sibling Type but not to Genotype or an interaction between the Sibling Type and Genotype (Table 2
). Further analysis (two-way ANOVA with WB region and Sibling Type as main factors) indicated no significant effect of Sibling Type on interaction between regional WB activity and Sibling Type (F = 0.112, df = 6, p = 0.995). A Bonferroni corrected post hoc analysis of these results for Sibling Type revealed that male mice raised with KO brothers had an increased level of WB activity with respect to males raised with WT brothers (p = 0.016).
Subsequent analysis on individual non-normalized male nuclei using a two-way ANOVA for Genotype and Sibling type with Hochberg’s GT2 post hoc indicated that significant differences were attributable only to Sibling type and not to Genotype type, conferring with the results seen in the WB analysis. In five of the 20 nuclei measured (BSTMA, AHA, MeAPD, MeAPV, and VMHVL) (Figure 5
), males raised with WT brothers had significantly lower mean COX activity (p < 0.05) compared to males raised with KO brothers. For example, ♂WT raised with WT brothers had significantly lower average metabolic activity in the AHA, BSTMA, MeAPD, and MeAPV when compared to ♂WT raised with KO brothers, and lower activity in the MeAPV and VMHVL relative to ♂WT raised with WT sisters.
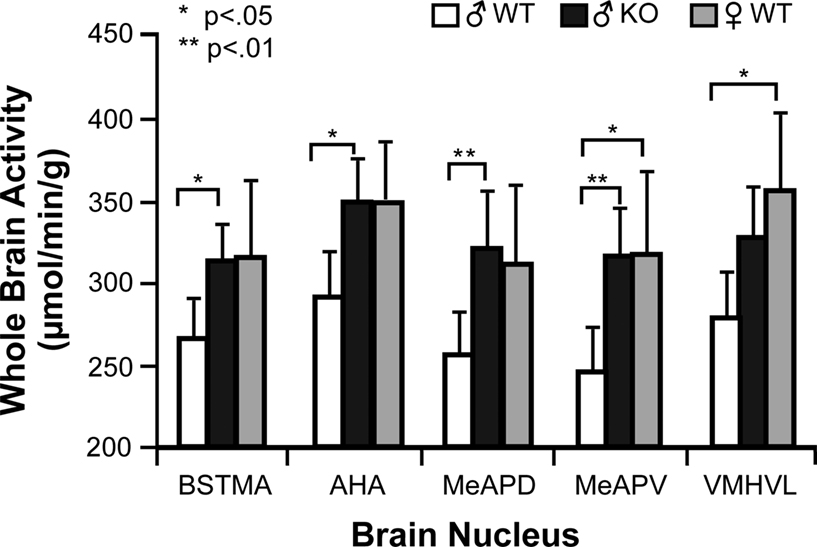
Figure 5. Sibling Type affects metabolic activity in limbic nuclei of male mice in this study. Hochberg’s GT2 post hoc analysis for a two-way ANOVA comparing sibling type and genotype effects per nucleus showed only significant sibling type effects on metabolic activity in 5 of the 20 limbic nuclei studied in the male mice. Mean and 95% confidence intervals depicted with one asterisk indicating a significance of p < 0.05 and two asterisks a significance of p < 0.01. Abbreviations: BSTMA, bed nucleus of the stria terminalis medial division, anterior; AHA, anterior hypothalamic area, anterior; MeAPD, medial amygdaloid (MeA) nucleus, posterodorsal; MeAPV, medial amygdaloid (MeA) nucleus, posteroventral; VMHVL, ventromedial hypothalamic nucleus, ventrolateral.
Cytochrome Oxidase Activity: Females
Analysis of female WB activity showed that both the experimental factors of Genotype and Sibling Type significantly affected the mean WB activity (Table 2
). Comparison of the means for Genotype shows that ♀WT show a greater overall WB activity when compared to ♀KO (p < 0.001). A Bonferroni post hoc analysis showed female mice raised with ♀WT siblings had a significantly greater (p < 0.01) mean WB activity when compared to females raised with ♂WT or ♀KO littermates. These results for females differ from results for males as males had no significant effect of Genotype on WB, and the effect of Sibling Type on each sex appears to differ reciprocally.
A two-way ANOVA on each nucleus using the factors of Sibling Type and Genotype with Hochberg’s GT2 post hoc analysis indicate that both Sibling Type and Genotype caused significant (p < 0.05) mean differences in certain nuclei activities for the females. In 10 nuclei the mean COX activity differed significantly for Genotype: cMPOA (p = 0.013), AHA (p = 0.009), PaN (p = 0.004), MeAA (p = 0.005), CeA (p = 0.033), VMH (p = 0.001), MeAPV (p = 0.049), VMHDM (p = 0.027), and VMHVL (p = 0.004). In each, the ♀KO had consistently lower mean nuclei activity, which agrees with the lower activity seen for the same comparison with mean WB activity in females. The analysis also showed a less extensive affect on mean nuclei activity due to Sibling Type, with significant effects found only in the cMPOA (p = 0.016), AHA (p = 0.043), and VMHVL (p = 0.017).
Correlations in Cytochrome Oxidase Activity in Males and Females
After assessing the effects on overall mean activity of the WB and individual nuclei, interactions between the nuclei were assessed for significance. An initial analysis using Pearson’s bivariate correlations on normalized nuclei measures with a two-tailed test of significance showed that males had 83 out of 190 possible pair-wise correlations significant at p < 0.05 and 60 out of 190 pair-wise correlations significant at p < 0.01 without jackknifing. Females showed 87 out of 210 possible interactions that were significant at p < 0.05, and 37 out of 210 at p < 0.01 (the increased number of possible interactions due to the inclusion of extra nuclei). When females are compared to the males, the fraction of significant interactions and number of reliably significant interactions is lower in females. This indicates that female nuclei interactions, as shown by correlated COX activity between nuclei tested, are probably not as strong as that shown in males.
Principal Components Analysis, Inter-Regional Correlations in Metabolic Activity, and Limbic Landscapes
To find functionally interactive networks, PCs were extracted for three different groups in each sex, making a total of six groups overall. These groups were all ♂(both WT and KO), all ♀ (both WT and KO), ♂WT males only, ♀WT only, ♂KO only, and ♀KO only. Finally, the Limbic Landscape method described in Crews et al. (2006)
to illustrate how activity in a defined network of limbic nuclei was modified by the litter environment.
Males
Principal components analysis. Principal components for males were extracted for three different groups: all males (♂WT and ♂KO), ♂WT only, and ♂KO only. The plots of sequentially derived eigenvalues are given as SCREE plots for each group subjected to PCA, shown in Figure 2
. Using the eigenvalues derived from PCA, the three criteria for determining significant PCs were applied to the eigenvalues of each PC in the three groups. Those eigenvalues that passed the first criterion of l2 > 1 are given in Tables 3
A,B along with the test for significance based on Eq. 1 from the second criterion; there was no case where the third criterion was invalid and all other criteria were found significant.
When both ♂WT and ♂KO were combined there were two significant PCs (significance ≥ 3.0) and when ♂WT and ♂KO males were considered separately, there was only one significant PC in each. The significant PCs in the individual ♂WT and ♂KO groups had several nuclei with coefficients greater than 0.60 (Table 3
A) that shared coefficients of similar strength to those in the PCA of combined males. Furthermore, in the ♂WT and ♂KO groups the second, non-significant PC (included for comparison in Table 3
A) differed from the first significant PC in its respective group for the values of its coefficients, but shared many similarities in coefficient values with the significant PC of the other male group as well as a significant PC of the combined males group. For example, the second PC for ♂WT was dissimilar to the first PC in that group, but similar to the first significant PC in ♂KO and the second significant PC in the combined males group (Table 3
A).
After consideration, the similarity between PCs in each group of males suggests only two significant PCs that are consistent across genotype. Consequently, nuclei with a coefficient greater than 0.60 in significant PCs believed to be similar were placed together to represent one of the two putatively conserved clusters of nuclei (Table 3
B). The first significant cluster contained several rostral amygdalar and hypothalamic nuclei. This cluster was labeled as the male rostral limbic cluster (mRLC) and contained the following nuclei: AVPe, cMPOA, AHA, PaN, VMH, MeAA, CeA, and ACo. The second cluster was labeled the male caudal limbic cluster (mCLC) and contained hypothalamic and amygdalar nuclei that were caudal to those used in the mRLC. The nuclei in the mCLC were VMH, PaN, MeAPD, MeAPV, VMHDM, and VMHVL. The inclusion of the PaN, which was not significant in any PCs of the mCLC, served as a control of between cluster correlations as the VMH showed strong correlations in both clusters. It also served as a control for demonstrating that the choice of 0.6 as the coefficient of significance was reasonable.
Inter-regional correlations in metabolic activity. Before the jackknifing procedure could be conducted, the combined male data set was subdivided into groups of shared experimental traits. These groups consisted of all animals that had the same treatment with regard to a given experimental variable. For example, ♂WT mice raised with either ♂WT or ♂KO brothers shared a similar Genotype but not Sibling Type, and were grouped together to form a ♂WT group for Genotype comparison. When the groups had been appropriately partitioned, only the nuclei within a certain cluster were used during the jackknifing procedure for that group. At the completion of jackknifing all groups had been jackknifed for both the mRLC and the mCLC (Table 1A in Supplementary Material). In many groups there were still several between nuclei correlations that maintained significance at α = 0.05 throughout the jackknifing procedure. Further analysis also used a values of α = 0.02 and 0.01. Within each colored cell of Table 1A in Supplementary Material is the averaged pair-wise correlation coefficient following jackknifing for the two nuclei that are denoted above and to the right of the cell. The significance of each correlation, significant and insignificant, is shown in Table 1B in Supplementary Material. Only half of each table is shown due to the symmetric nature of a pair-wise correlations table. Those correlations that were not significantly different from r = 0 at α = 0.05 were deemed insignificant and were not included in Table 1B in Supplementary Material. If after jackknifing two nuclei maintain a significant correlation, then the two nuclei may be considered functionally associated, coupled, or connected. If functional connections were found between comparable groups, then a t-test with an assumption of unequal variance was performed on the correlation coefficients for the connection in each group. This analysis yielded several significant differences for functional connections between different Genotypes and Sibling Types.
Several nuclei showed functional associations in both ♂WT and ♂KO mice (Figure 6
, top panel), while other functional associations were unique to ♂WT and ♂KO mice (Figure 6
, bottom panel). Common functional associations, at α = 0.01, were found among the amygdalar nuclei in the mRLC are: the ACo with the CeA and MeAA, and the MeAA with the CeA, PaN and VMH. In the mCLC common associations were between proximal subnuclei – the MeAPD with the MeAPV and the VMHVL with the VMHDM. It should be noted that there were no significant associations between these two clusters that are shared across genotypes.
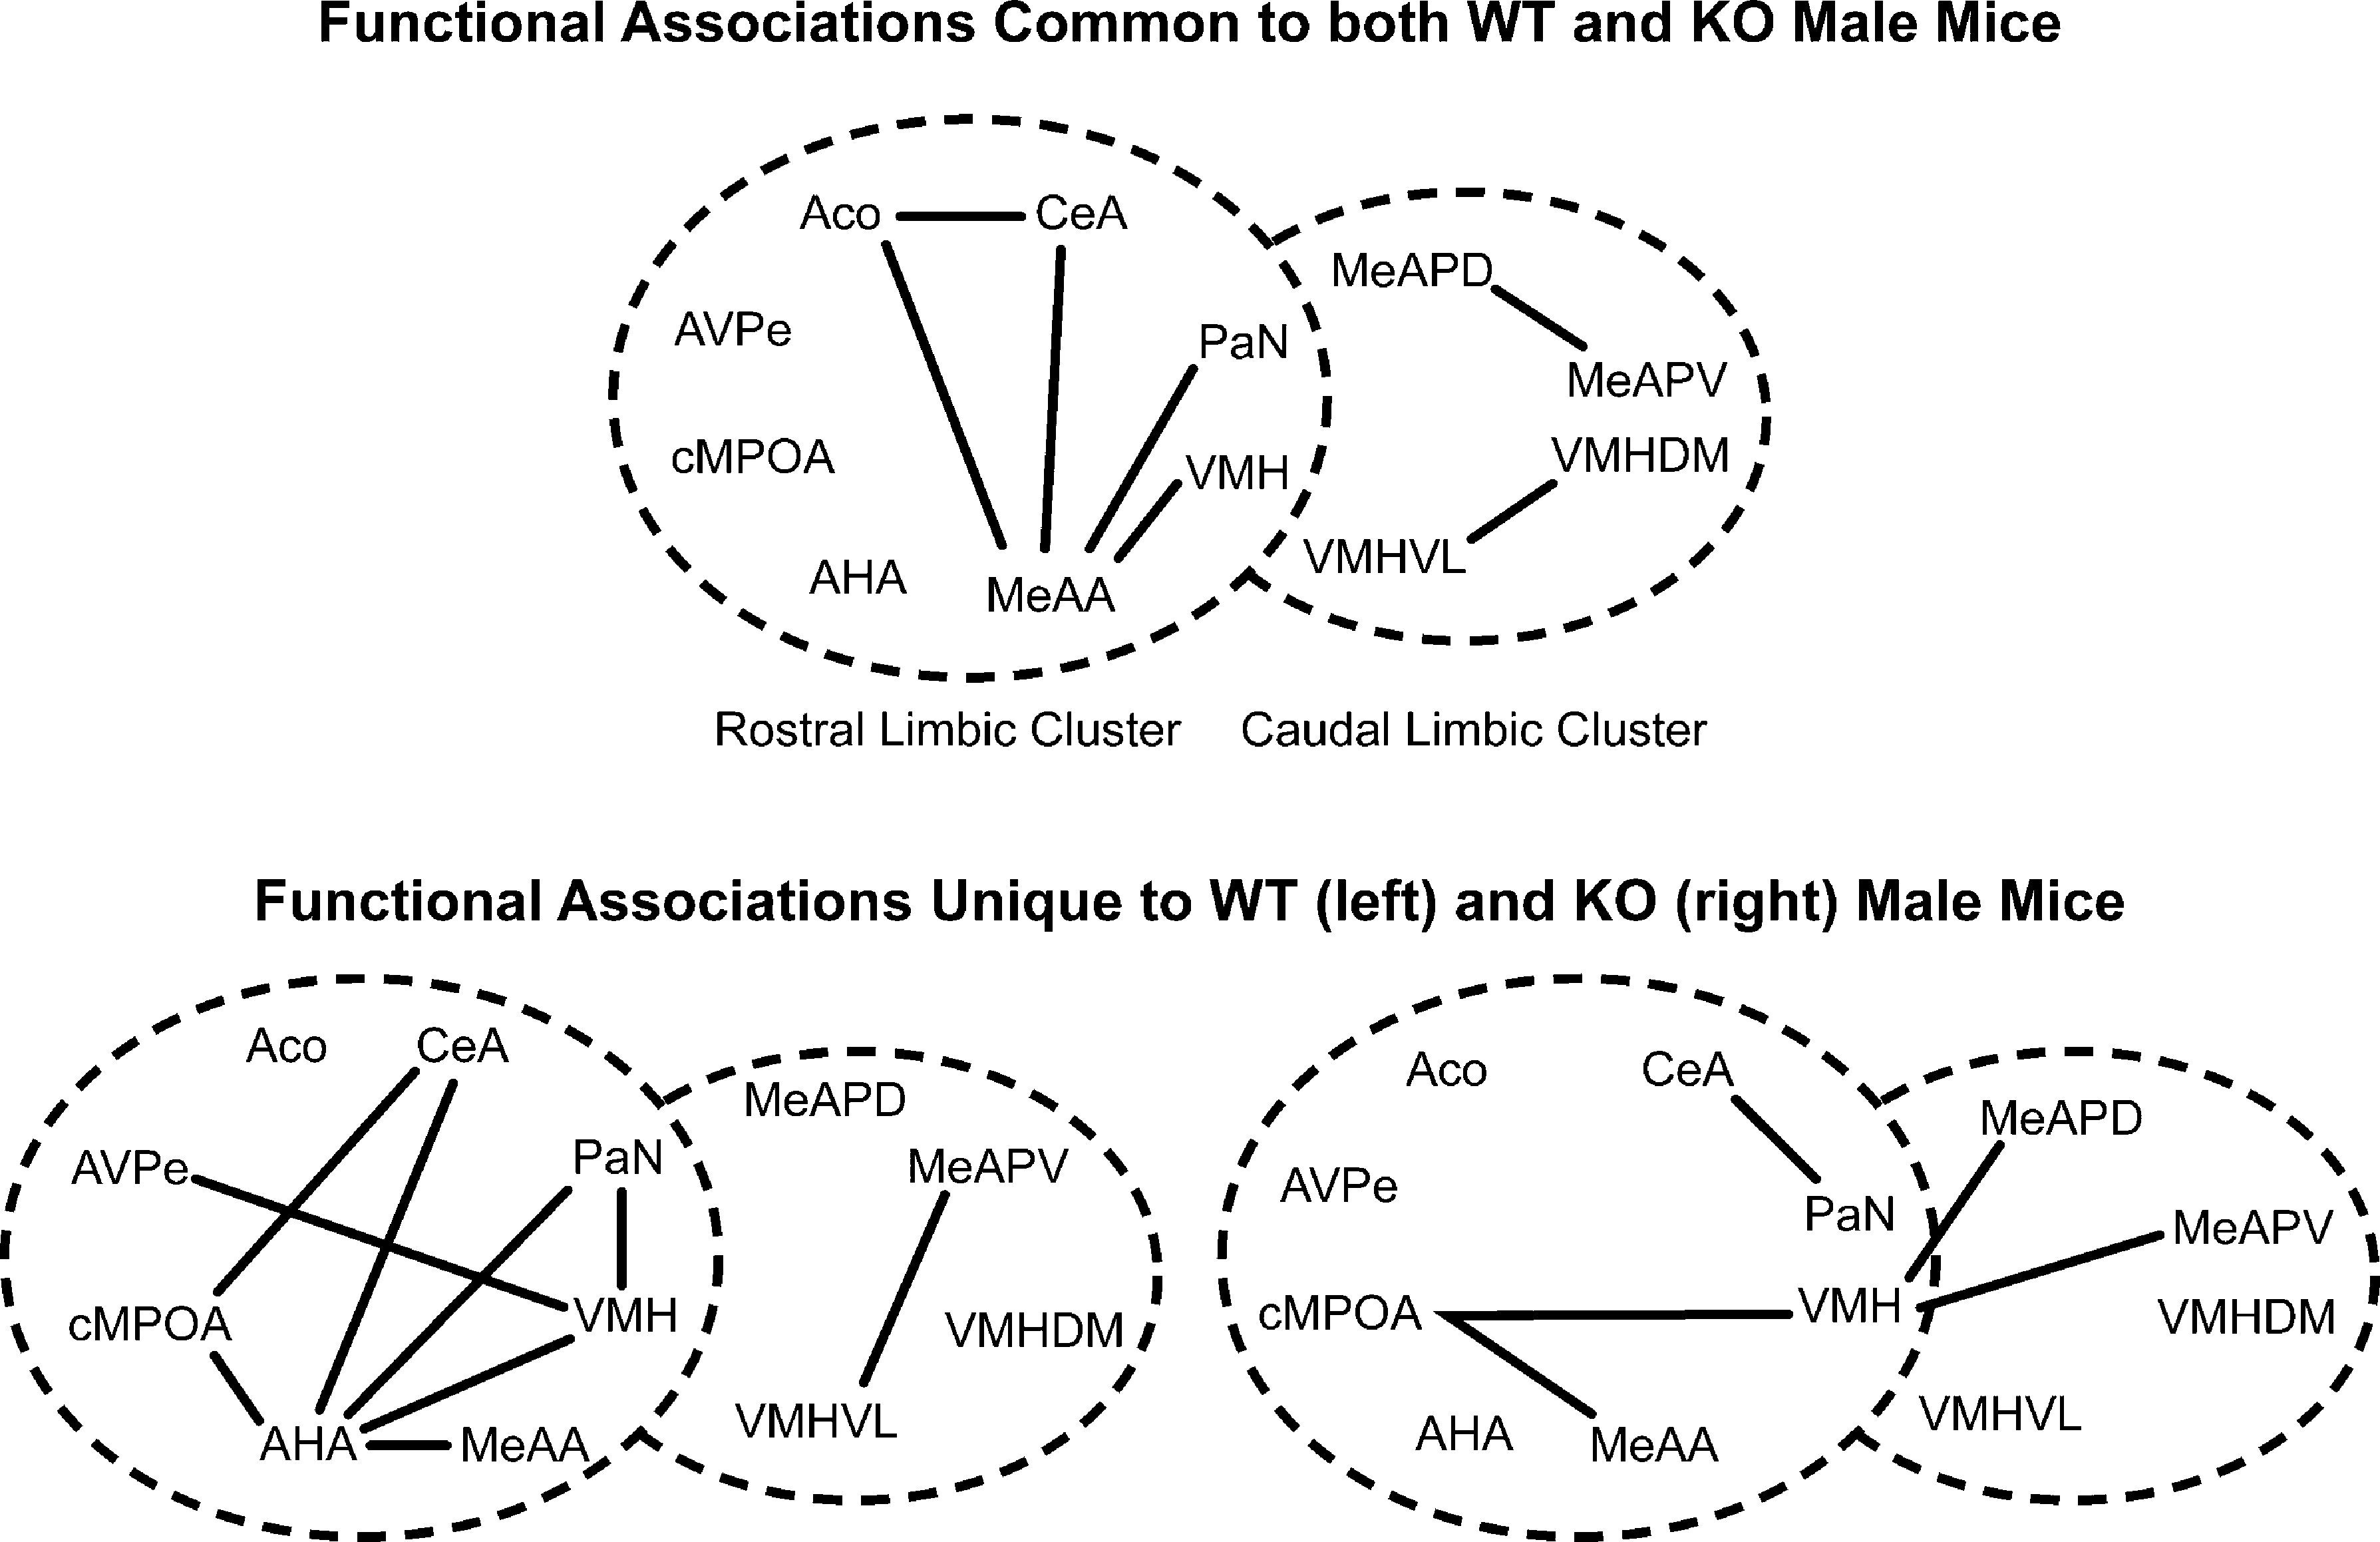
Figure 6. Effect of the individual’s Genotype on functional connectivity in male mice independent of the sibling’s genotype or sex. Top panel indicates functional connections common to ♂WT and ♂ERKO mice. Bottom panel indicates functional connections unique to ♂WT (left) or ♂ERKO mice (right). Connections based on Table 1A in Supplementary Material, α = 0.01. Each series of nuclei encircled by a dotted line represents a limbic cluster. The left circle in the foreground is the mRLC and the right circle in the background is the mCLC.
Given the large number of functional associations shared by either genotype, there were still many functional associations that were unique to ♂WT mice. In the mRLC these include associations by the AHA with the cMPOA, CeA, PaN, VMH, and MeAA; by the VMH with the PaN, AVPe; and by the CeA with the cMPOA. In the mCLC of the ♂WT mice, unique functional associations are limited to the MeAPV with the VMHDM and VMHVL. In the ♂KO mice there are fewer functional associations: in the mRLC these are made by the cMPOA with the VMH and the MeAA and by the CeA with the PaN. In the mCLC, ♂KO mice had a functional association of the VMH with the MeAPD and the MeAPV.
Similarly, there were common functional associations among males that are housed with either ♂WT or ♂KO brothers (Figure 7
, top panel), but other functional associations that were unique to males raised with ♂WT or ♂KO brothers (Figure 7
, bottom panel). Common associations were found among the amygdalar nuclei: the ACo with CeA, the CeA with MeAA, and the MeAA with the VMH in the mRLC. Functional associations also occurred between the MeAPD and MeAPV and between the VMHDM and VMHVL in the mCLC. Again, there were no significant associations between nuclei of the mRLC and mCLC suite of nuclei shared between Sibling Type groups. As with the male mice in this study, having a WT brother resulted in a number of unique functional associations, including significant associations between nuclei in the mRLC and mCLC suite of nuclei (Figure 7
, top panel). These included associations of the PaN with the CeA, AHA, and VMH; the AHA with the VMH and cMPOA; and the cMPOA with the VMH in the mRLC. In the mCLC, the MeAPV associated with the PaN, VMH, and VMHVL. There were only two functional associations unique to males having KO brothers, and these were between the ACo and the MeAA in the mRLC and between the MeAPV and the VMHVL in the mCLC. The paucity of interactions for males raised with ♂KO may be due to the small sample size.
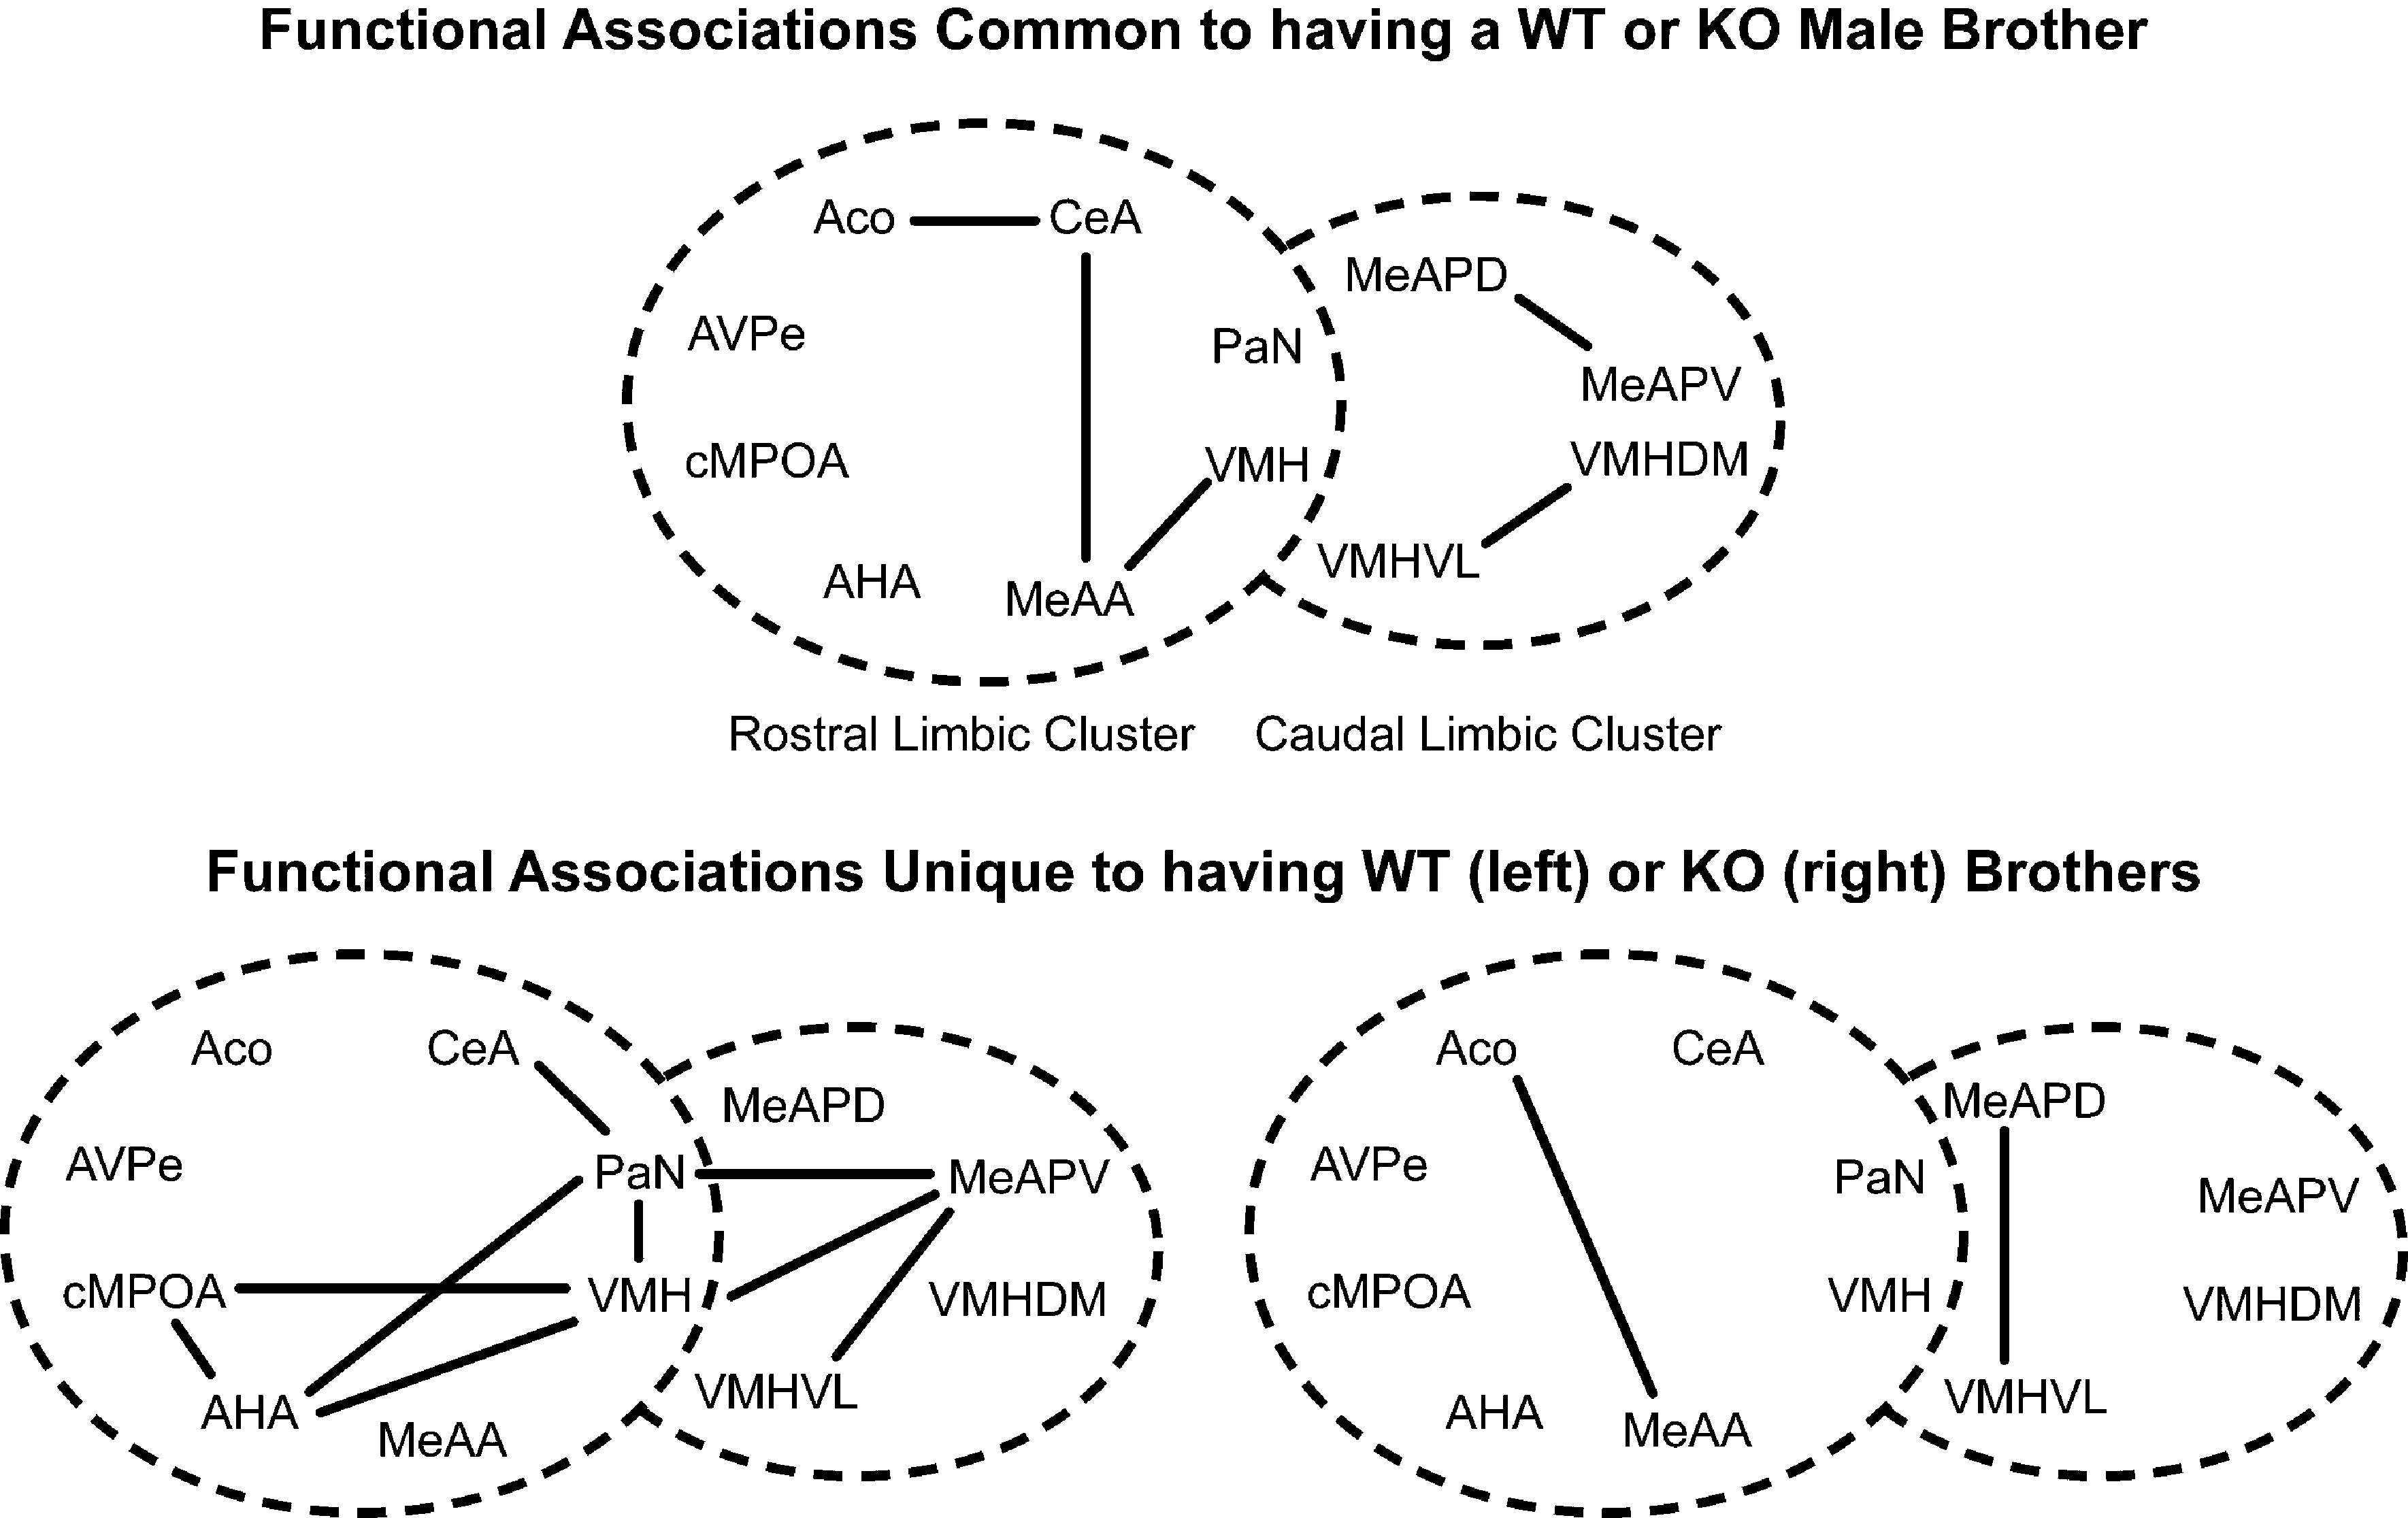
Figure 7. Effect of sibling genotype on functional connectivity in male mice that were raised in litters consisting of ♂WT or ♂KO brothers independent of the genotype of the individual. Top panel indicate functional connections common to males having either WT or KO brothers. Bottom panel indicates functional connections unique to males having WT brothers (left) or KO brothers (right). Connections based on Table 1A in Supplementary Material, α = 0.01. Each series of nuclei encircled by a dotted line represents a limbic cluster. The left circle in the foreground is the mRLC and the right circle in the background is the mCLC.
Limbic landscapes. To illustrate changes in the metabolic activity in selected nuclei (BNSTma; AVPe; MPOA; AHA; MeAPD; MeAPV; VMHVL) with defined neural connections, it is clear that the effect of having KO brothers or sisters in the litter have different consequences on WT males (Figure 8
, bottom row). Further, in the mixed-sex, mixed-genotype litters, the effect of the genotype of the brothers or sisters had different effects on the limbic landscape of WT males (Figure 8
, right column). The effect of Genotype in all-male litters indicated an overall decrease in activity, but no differences in activity pattern among the nuclei (Figure 9
).
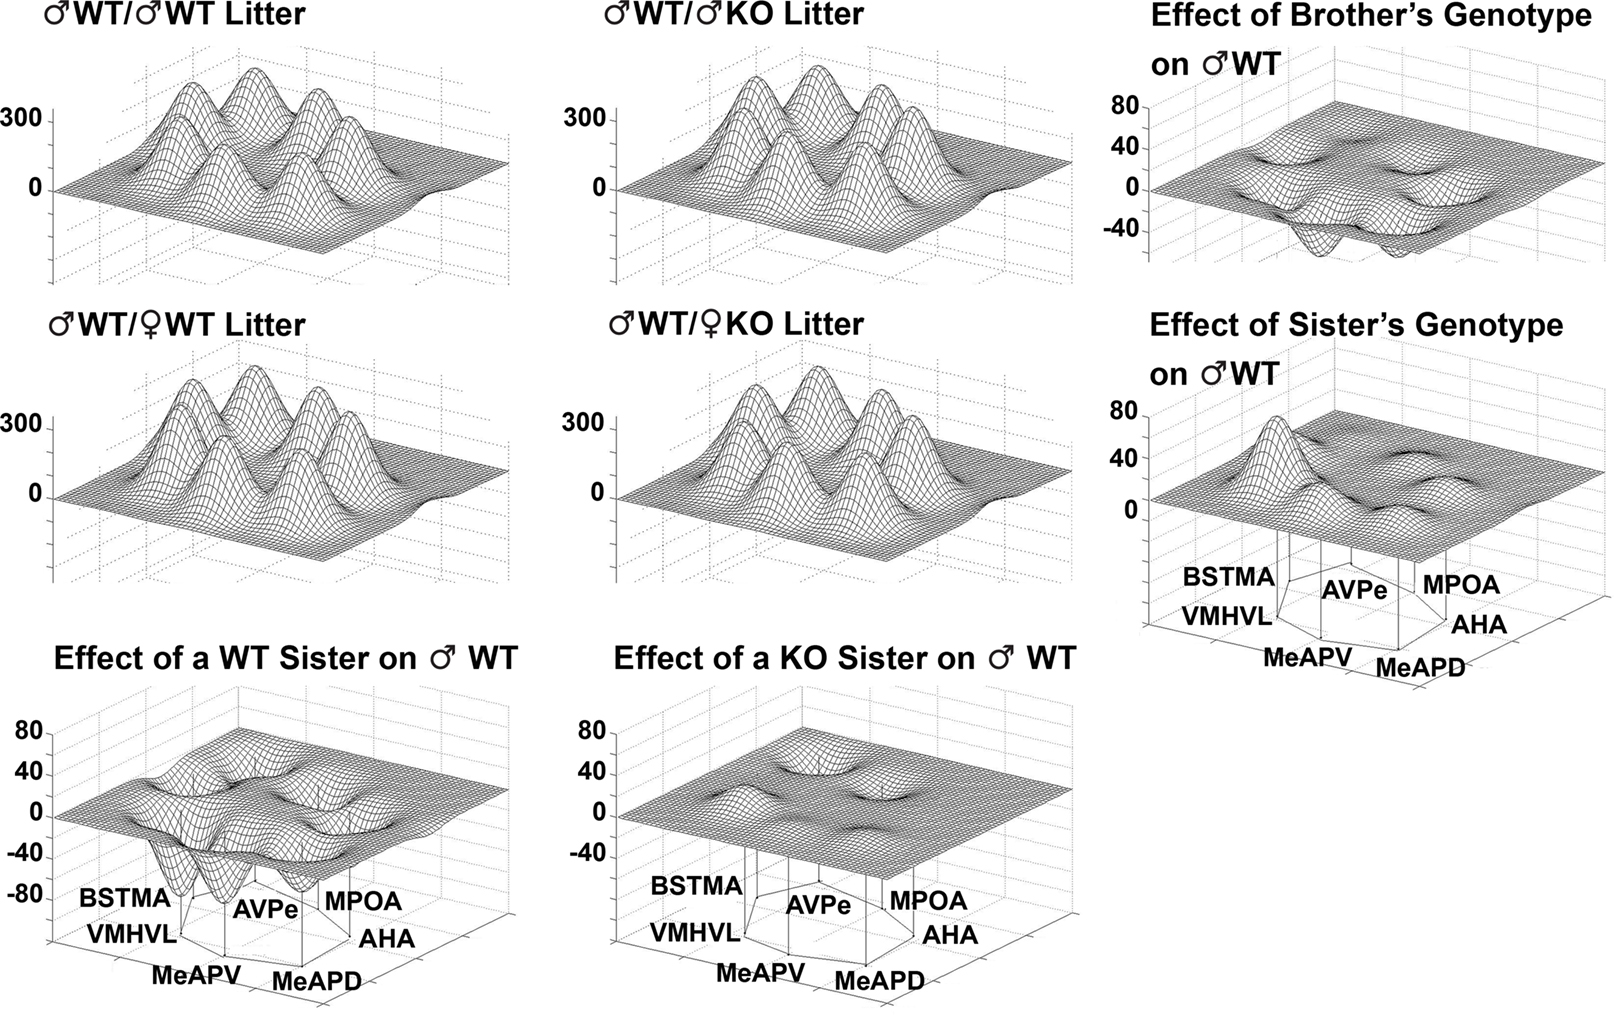
Figure 8. The Sex and Genotype of siblings in the litter influences metabolic activity in the limbic landscape of adult male mice wildtype (WT) for the estrogen receptor a gene. Limbic landscapes of ♂WT raised with brothers or sisters of the same or different genotype are depicted. Illustrated is the mean cytochrome oxidase (COX) activity in each nucleus of each ♂WT. Groups are presented according to the type of sibling with which the ♂WT individual was raised; ♂WT; ♂KO; ♀WT; ♀KO. The limbic landscape maps on the bottom row give the difference between the ♂WT/♂WT and ♂WT/♀WT (left) and the ♂WT/♂WT and ♂WT/♀KO maps (right), indicating the effect of the sister’s genotype on ♂WT. The far right column indicates the effect of sibling’s genotype; on the right top is the effect of the brother’s genotype and in the middle row is the effect of sister’s genotype; the far right column is the difference between the ♂WT/♂WT and ♂WT/♂KO (top right) and the ♂WT/♀WT and ♂WT/♀KO maps (middle right). The nuclei are presented in a clockwise fashion reflecting a rostral-caudal dimension: main bed nucleus of the stria terminalis (BNSTma); anteroventral periventricular nucleus (AVPe); medial preoptic area (MPOA); anterior hypothalamus, anterior (AHA); medial amygdaloid nucleus, posterodorsal (MeAPD); medial amygdaloid nucleus, posteroventral (MeAPV); ventromedial hypothalamic nucleus, ventrolateral (VMHVL).
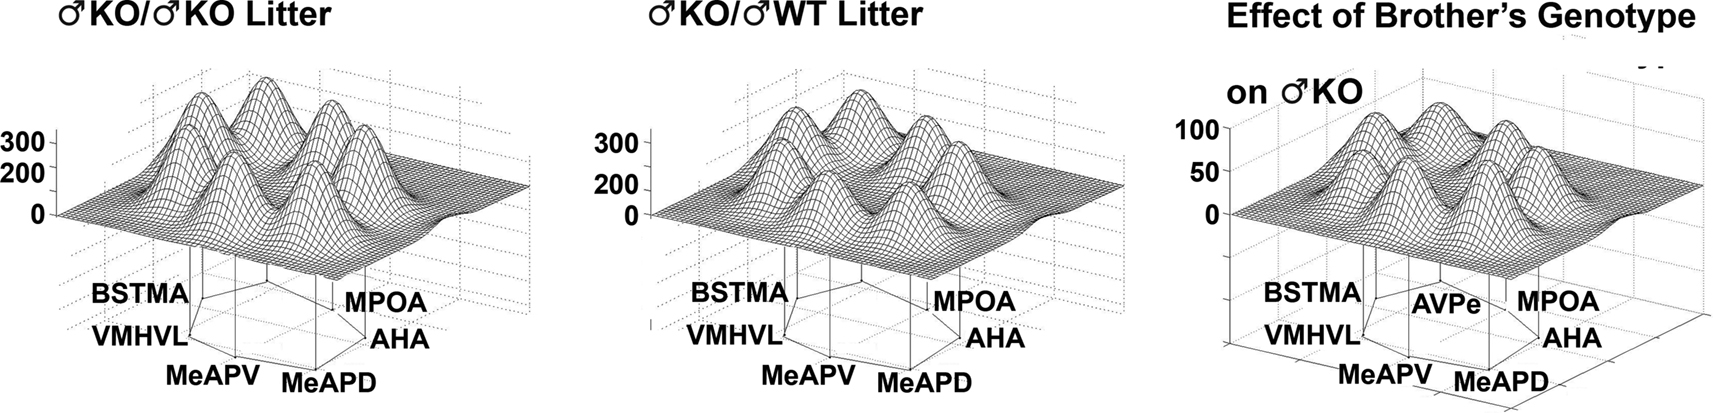
Figure 9. The genotype of brothers in the litter influences metabolic activity in the limbic landscape of adult male estrogen receptor α knockout mice (♂KO). Groups presented according to the type of sibling with which the male was raised (with ♂KO or ♂WT brothers). The limbic landscape map on the right represents the difference between ♂KO/♂KO litter and ♂KO/♂WT litter, or the Effect of the Brother’s Genotype on ♂KO mice. Other details as in Figure 8
.
Females
Principal components analysis. In order to further compare the functional connectivity between males and females PCA was performed as before on three different groups generated from a subset of the female study population. Because of a large number of missing nuclei measures for individual animals, the full set of animals and nuclei had to be parsed to avoid the problem of missing values when performing PCA. The data set was then optimized for the maximum number of animals and nuclei. The best result featured 34 animals and 13 nuclei. Those nuclei were the LSI, MPOA, Pe, ACo, MeAA, CeAA, VMH, LHb, MHb, MeAPD, MeAPV, VMHDM, and VMHVL. It should be noted that the number of female animals used for PCA is nearly the same size as that used in the PCA of males, but with seven fewer nuclei considered. The types of groups used for PCA were discussed above.
The results of PCA for the three female groups can be visualized using the SCREE plots (Figure 2
), and the analysis for significant PCs (Tables 4
A,B). The number of significant PCs between groups and significant nuclei in each of those PCs are dissimilar to the results found in males. When all females were considered in the PCA there was only one significant PC, and the nuclei that showed significance were all amygdalar: ACo, MeAA, CeA, MeAPD, MeAPV. Although the subdivided groups of ♀WT and ♀KO females were evenly numbered at 17, PCA performed on each group resulted in PCs with significant nuclei that were not represented in both genotypes. The significant PCs and the significant nuclei within each of those PCs for all three groups (Table 4
A) indicated one significant PC for all females, four significant PCs for ♀WT, and three significant PCs for ♀KO females (Figures 10 and 11
).
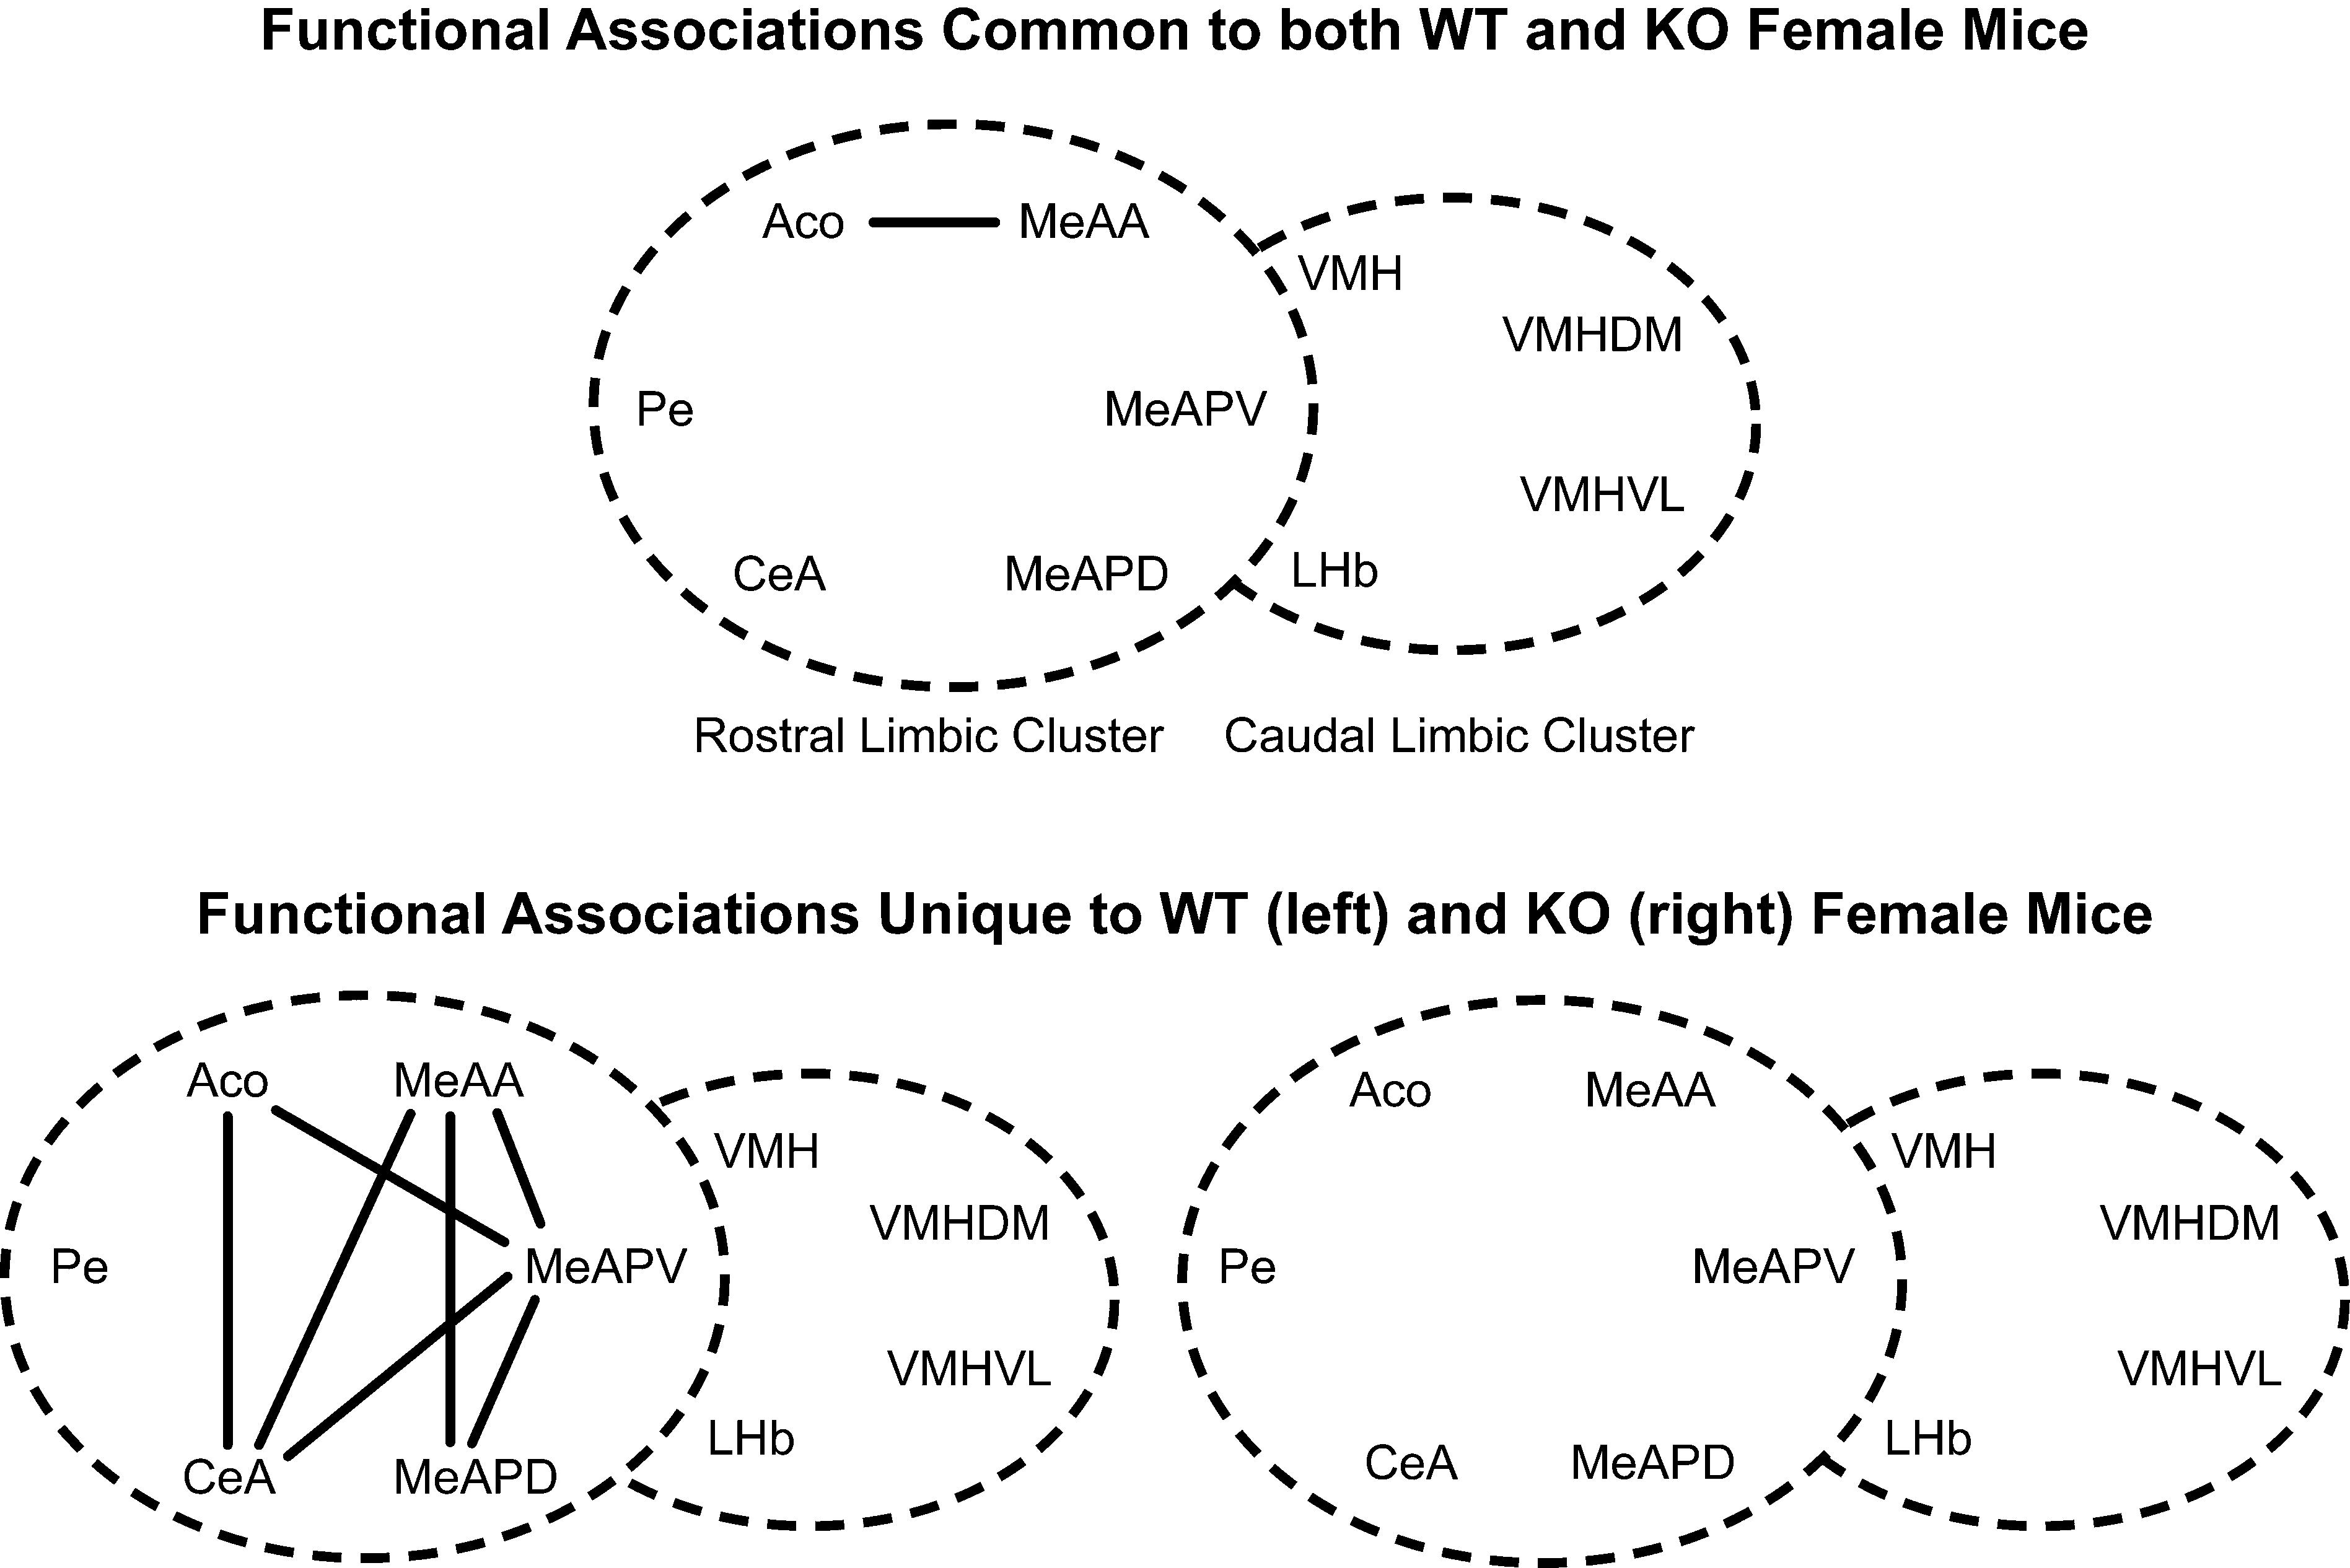
Figure 10. Effect of the individual’s genotype on functional connectivity in female mice independent of the sibling’s genotype or sex. The top panel represents the shared correlations after jackknifing common to WT and KO females. The bottom panel represents the shared correlations connections unique to WT (left) or KO (right) females. Connections based on Table 2A in Supplementary Material, α = 0.01. Each series of nuclei encircled by a dotted line represents a limbic cluster. The left circle in the foreground is the mRLC and the right circle in the background is the mCLC between each genotype.
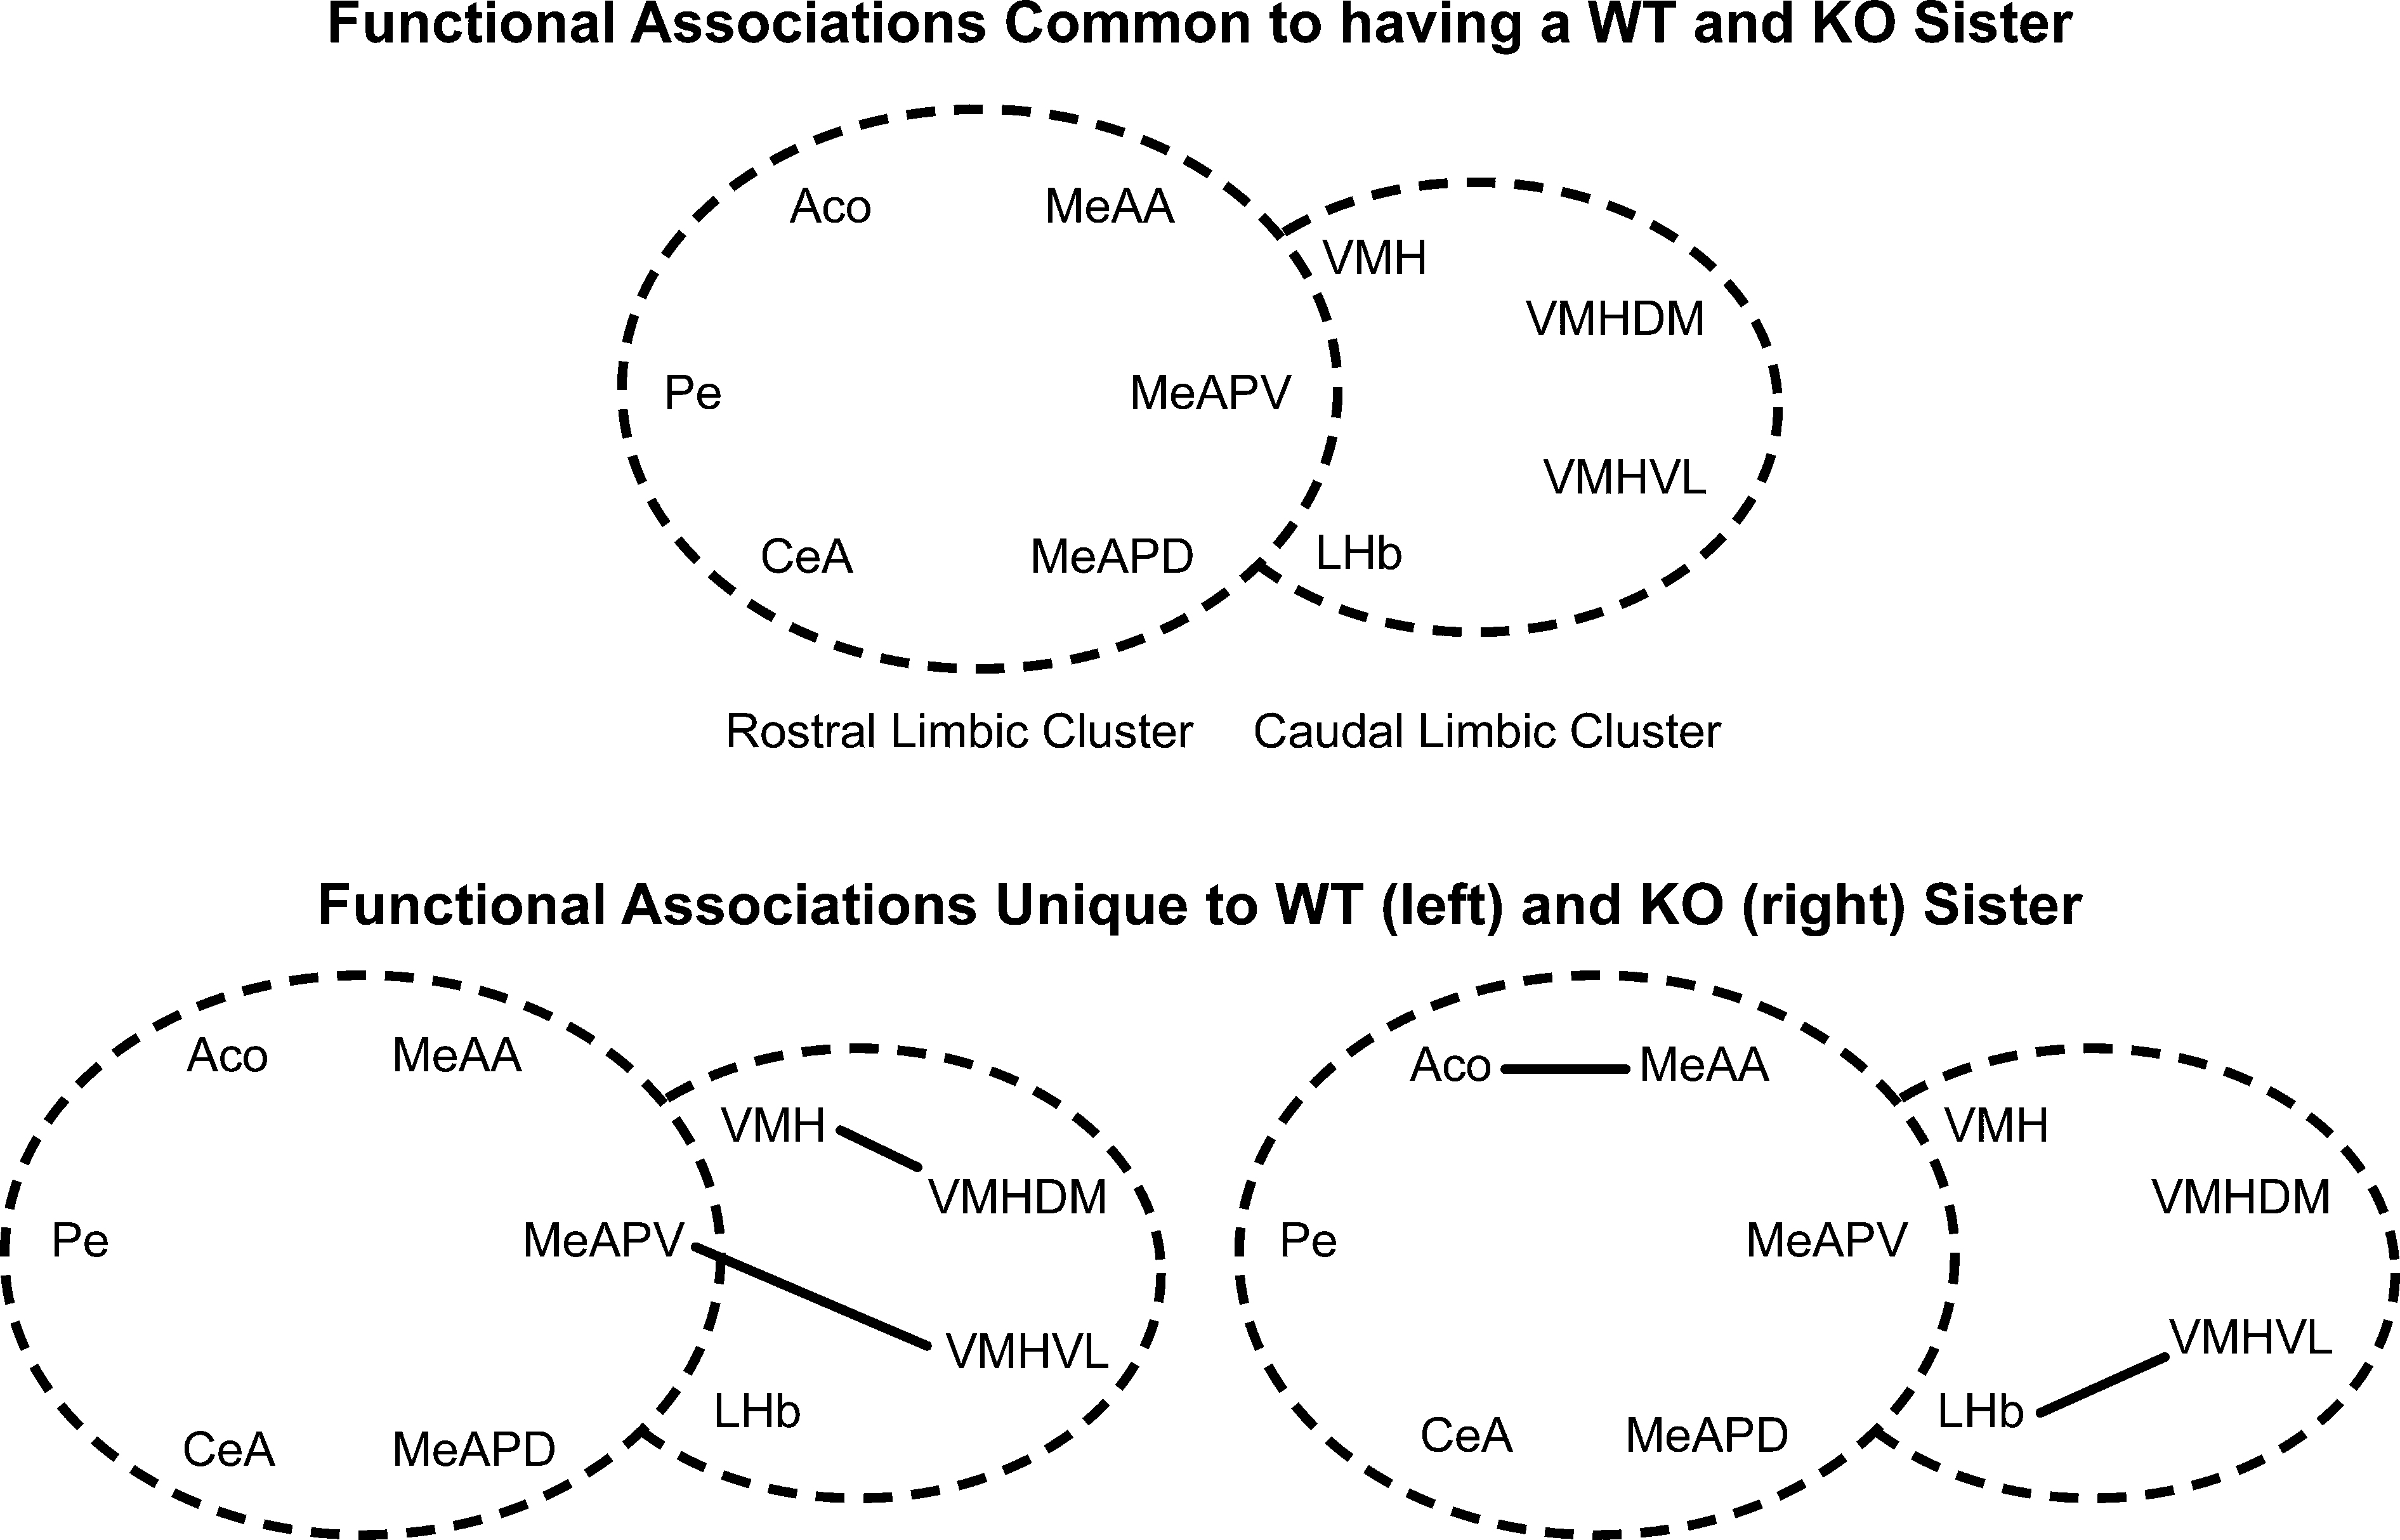
Figure 11. Effect of sibling genotype on functional connectivity in female mice raised in litters consisting of WT or KO sisters independent of the genotype of the individual. Top panel indicates functional connections common to females regardless of genotype of littermates. Bottom panel indicates functional connections unique to females having WT sisters (left) or KO sisters (right). Connections based on Table 2A in Supplementary Material, α = 0.01. Each series of nuclei encircled by a dotted line represents a limbic cluster. The left circle in the foreground is the mRLC and the right circle in the background is the mCLC.
These results differ from males due to two reasons: (i) There was a significant PC (PC2) in WT females with no analog in ♀KO females. (ii) Unlike males, where almost all significant nuclei in similar PCs were at or near significance between genotypes, similar PCs in females only contained a majority of shared significant nuclei between genotypes. Also, when comparing similar PCs between genotypes many nuclei showing significance in one genotype were not even near significance in the other.
Inter-regional correlations in metabolic activity. Although these significant clusters were less conserved than in the males, a jackknifing analysis was still conducted by genotype to distinguish the nature of the connectivity between different genotypes and to indicate qualitatively the difference between sexes. From the three possible similar PCs, only two showed an indication of multinuclei connections or clusters (>2 shared nuclei, with a majority of the nuclei in each PC shared) among female mice (Table 4
B). These clusters shared some similarities to males in the nuclei considered, but were otherwise quite distinct (Figures 10 and 11
). The more rostral of the two clusters, the female rostral limbic cluster contained the Pe, ACo, MeAA, CeA, MeAPD, and MeAPV, while the more caudal cluster, female caudal limbic cluster contained the LHb, MeAPV, VMH, VMHDM, and VMHVL. Like the males, the females maintained a cluster of nuclei associated with the amygdala and a cluster associated with the VMH and subnuclei, however this appeared to be the extent of the similarity. As before, nuclei were selected to enter into the cluster if significance was shown in either of the putative clusters. Results of the jackknifing can be seen in Table 4
B for a comparison of genotype, and further demonstrated the differing nature of male and female connectivity.
Limbic landscapes. Mapping the limbic landscape in selected nuclei with defined neural connections, it is clear that the effect of having KO brothers or sisters in the litter have different consequences on WT females (Figure 12
, bottom row). Further, in the mixed-sex, mixed-genotype litters, the effect of the genotype of the brothers or sisters had different effects on the limbic landscape of WT males (Figure 8
, right column). The effect of Genotype in all male litters indicted an overall decrease in activity, but no differences in the pattern of activity among the nuclei (Figure 9
).
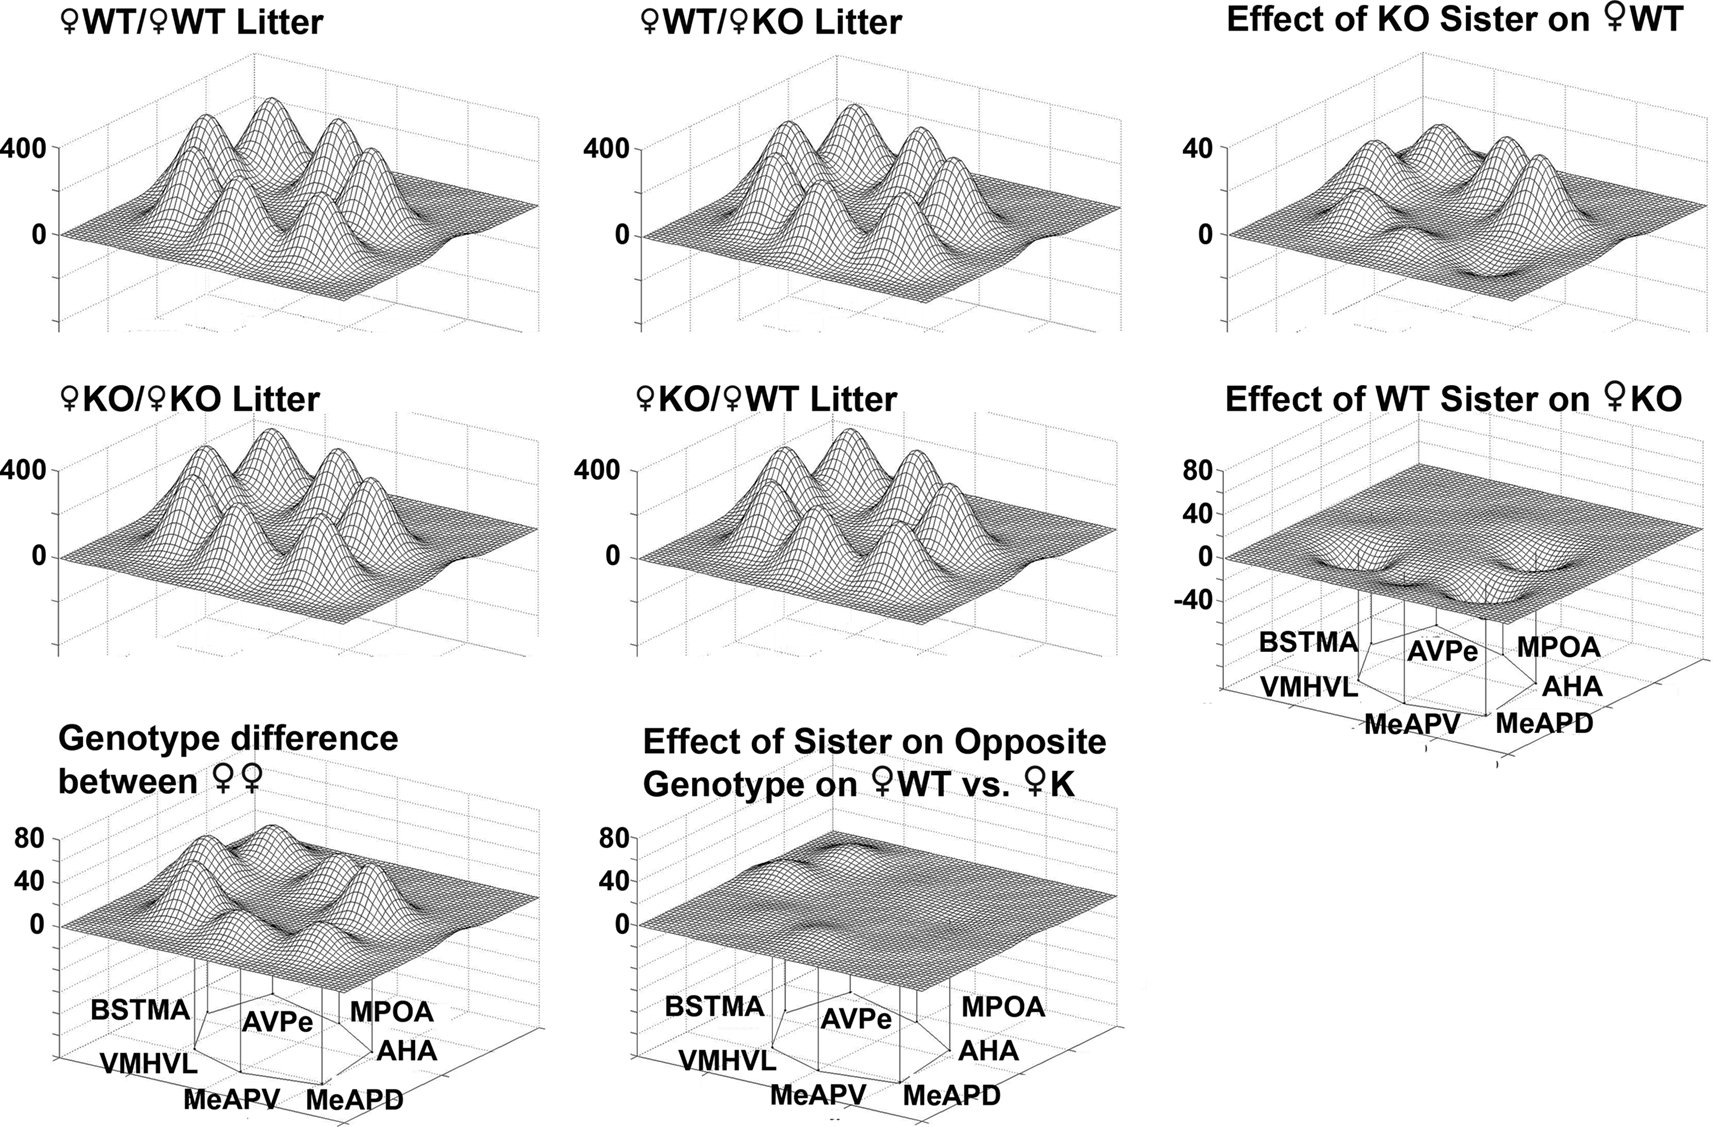
Figure 12. Effect of genotype of sisters of on metabolic activity in a social behavior network in female wildtype (WT) and estrogen receptor a knockout (KO) mice. Groups are presented according to the type of sibling with which the WT (top row) or KO female (middle row) was raised with ♀KO or ♀WT sisters, respectively. The limbic landscape map on the upper right represents the difference in ♀WT raised with ♀KO sister. Below that is the complement, that is, the effect of a WT sister on the metabolic activity in ♀KO females. The bottom row indicates genotype differences between ♀WT and ♀KO females raised in same-sex, same-genotype litters. Right column is the effect of having a sister having the opposite genotype. Other details as in Figure 8
.
An individual’s genotype interacts with its environment throughout life to continuously shape the phenotype. In mammals, the formative environment for social and anxiety-related behaviors is the family unit; in the case of rodents, this is the litter and the mother-young bond. A deciding factor in this environment is the sex ratio of the litter and, in the case of mice lacking functional copies of gene(s), the ratio of the various genotypes in the litter. A summary of the behavioral data obtained with males indicate that when raised in litters having either ♂KO or ♀KO littermates, ♂WT are more aggressive than when raised in litters containing either ♂WT or ♀WT littermates. KO males are not aggressive when raised in litters containing either ♂KO or ♂WT littermates. Anxiety-like behaviors, reflected in behavior in the Light:Dark box, were modified in WT males if they had WT sisters in the litter, an effect that was absent if the sisters were KO mice. A summary of the behavioral data obtained with females indicate that the social behavioral profile of ♀KO mice is most clearly distinguished from that of ♀WT mice when ♀KO mice are raised in litters containing only ♀KO mice; ♀KO mice raised with ♂WT mice behave similarly. ♀KO mice are more similar to ♂WT mice than they are to ♀WT mice in their behavior, metabolic activity, and functional connectivity, suggesting that ♀KO mice play a male-type role in the preweaning sibling environment.
Regarding the effect of Genotype and Sex ratios of the litter on brain metabolic activity later in adulthood, it is noteworthy that ♂WT and ♂KO do not differ in their WB metabolic activity, but when male mice were raised in litters having ♂KO, or females of either Genotype, overall brain activity was higher than if raised in litters having only WT males. In females, those having ♀WT siblings had higher WB activity, and the presence of ♀KO or ♂WT siblings had the effect of lowering WB activity. Whether this and the other observed effects were due to direct interactions of the pups, or indirectly a consequence of differences in maternal behavior with different types of litters is not known. It appears there may be a neural mechanism affected by the sex of the individual that reinforces the complete activation or depression of COX activity when a WT sibling of the same sex is present. This can be taken to mean that a WT sibling of the same sex induces a physiological or neurological response that alters nuclei and WB activity. Since KO and opposite sex siblings do not induce this response, there is likely some differentiation by the individual (or possibly mother) of what is a normal sibling.
Most social information is gained through olfaction in rodents and, after transduction of chemosensory signals, transmitted through well-defined neural circuits ( Blaustein, 2008
; De Vries and Simerly, 2002
; Hull and Rodriguez-Manzo, 2008
; Newman, 1999
). Prominent nuclei in this system are the medial amygdala (including the MEAA, MeAPD, and MeAPV), which project to the bed nucleus of the stria terminalis (including the BST, BSTMA, and BSTMPM) and, in turn, to the medial preoptic area and anterior hypothalamus. In the present study COX activity in the MeAPD, MeAPV, BSTMA, and AHA, was significantly lower in males raised with WT brothers compared to males raised with KO brothers. Further, males raised with WT sisters had higher COX activity in the MeAPV and the VMHVL compared to males raised with WT brothers. The functional associations of metabolic activity in the network of nuclei was also significantly modified by the litter composition. The differences in limbic landscapes of male and female mice of different genotype and sibling type captured in Figures 8
, 9
, 12
, and 13
illustrate the effects of Sex versus Genotype in both WT and KO male and female mice. Note that the effect of Sex (male versus female) is substantially different among WT and KO mice, just as the effect of Sibling Genotype is different between male and female mice. It is of interest that ♂KO and ♀WT share similar means, although the female is not statistically different from male WT (possibly due to decreased sample size) for all nuclei except the VMHVL, suggesting this nucleus may be affected by female siblings preferentially. Further, the behavioral differences observed are likely a function of some combination of altered WB, nuclei, or network activity. For example, males raised with ♂WT siblings behave differently than do males raised with ♂KO siblings. This may result from lowered WB activity or from one or more specific nuclei being significantly lowered in activity. The AHA is significantly lowered in activity for males raised with ♂WT siblings and also appears to be strongly correlated with several other nuclei in the RLC and not at all in males raised with ♂KO siblings.
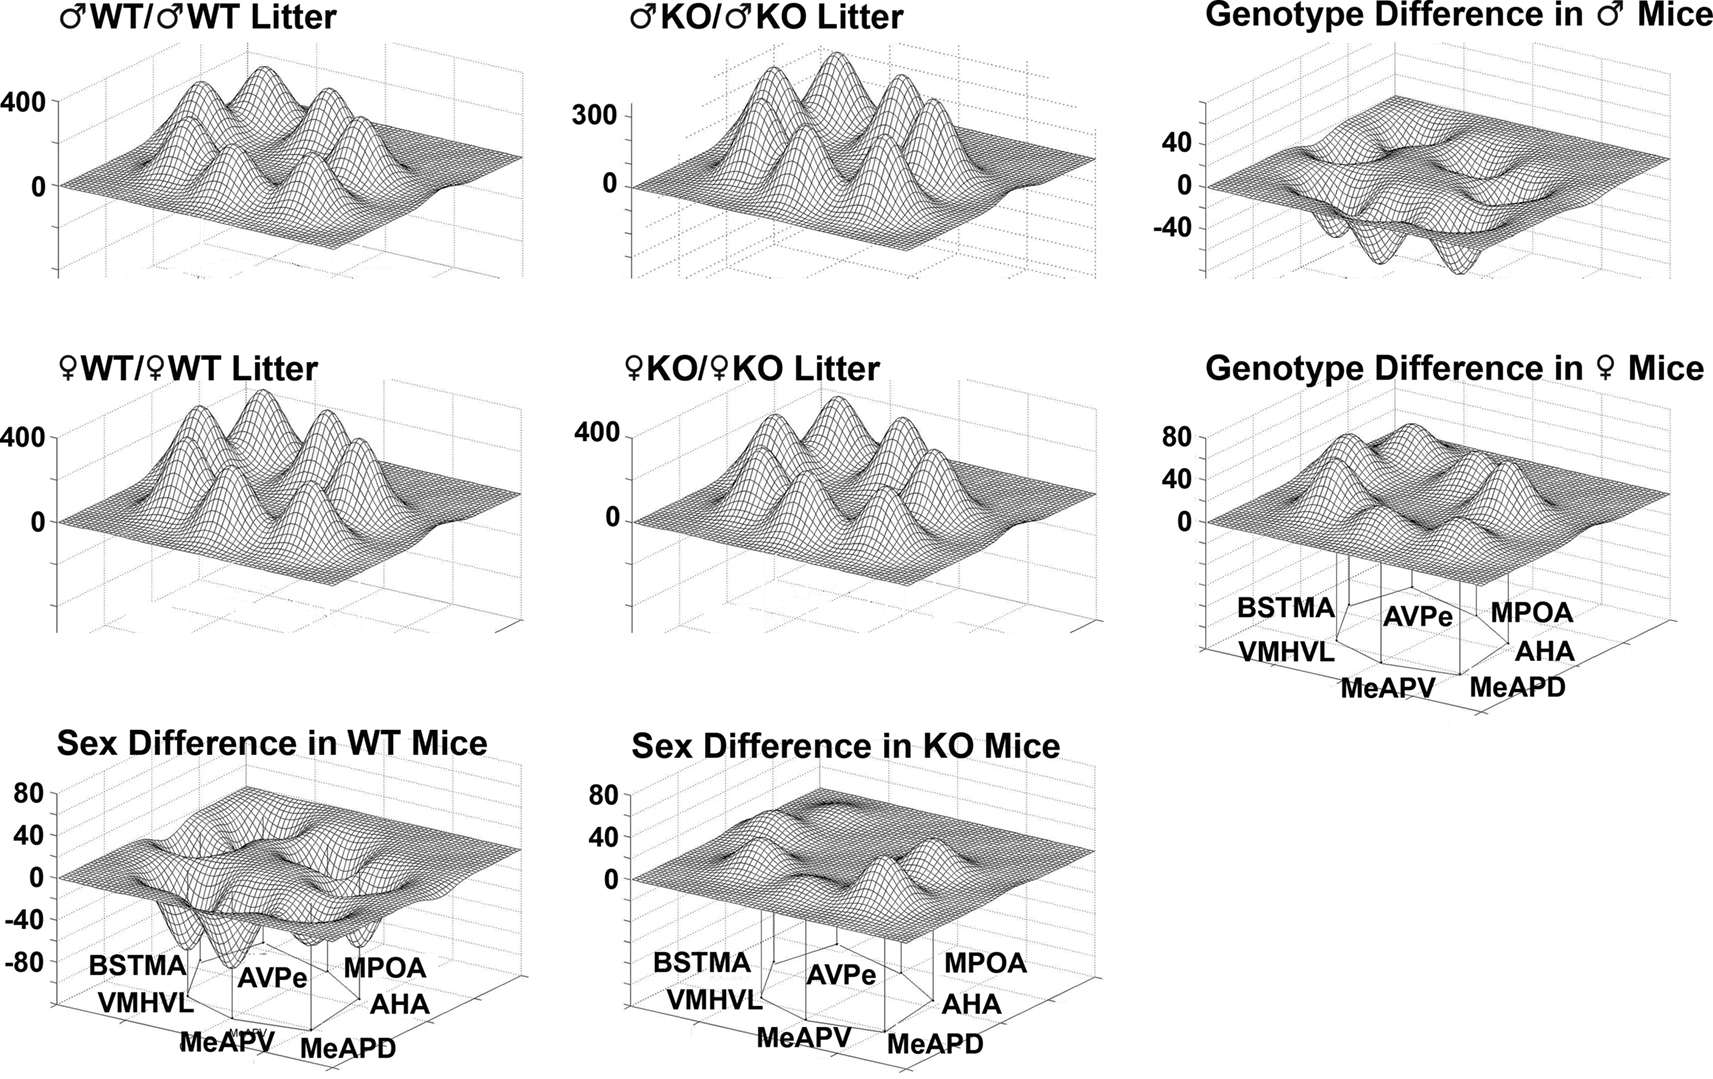
Figure 13. Sex versus genotype differences in wildtype (WT) mice and mice having a dysfunctional estrogen receptor a (KO) mice. Groups consisted of same-sex, same-genotype litters (♂WT/♂WT; ♂KO/♂KO; ♀WT/♀WT; ♀KO/♀KO). The limbic landscape map on the upper right represents the genotype difference in male mice and below that is the genotype difference in female mice. The bottom row indicates sex differences between male and female WT mice and to the right is the sex difference in KO mice. Other details as in Figure 8
.
Principal Component Analysis appeared to successfully determine portions of underlying networks of functionally coupled nuclei. Applying the jackknifing procedure to these networks can be thought of as looking for strong correlations in nuclei preselected for probable strong correlations (Sakata et al., 2000
). In support of what appears to be an arbitrary choice of significance in the use of PCs, the resulting functional connections in the cluster were not completely interconnected (which would imply too high of a selection criteria for the PC coefficient), nor too large to begin interpretation (too low of a selection criteria for the coefficient), nor was there an excessively large list of nuclei to even begin interpretation and comparison (also suggesting too low of a selection criteria). Using PCA revealed males to have a network of functional associations more conserved between genotypes than females, possibly due to a smaller nuclei sample in females. The observation that the first and second PCs shared similar coefficients between Genotypes led to the reduction of the 20 nuclei into two independent clusters, the RLC and the CLC. These clusters shared two nuclei throughout jackknifing, the VMH and the PaN. While the VMH met the selection criterion in one of the PCs for both clusters, the PaN did not meet selection criteria in the mCLC. Thus, the PaN was used to determine if lower selection criterion for the PCs would yield more meaningful results. This comparison showed only four significant functional correlations between the PaN and some other nucleus in the CLC across all groups; three of these connections occurring between the PaN and VMH in the RLC. On the other hand, the VMH had nine connections in the CLC across all groups, three of which were shared with the PaN. There were six unique connections with the VMH in the CLC, compared to one in the PaN, suggesting that the VMH was actually functionally connected in both clusters of nuclei, whereas the PaN was likely just part of the RLC, the cluster in which it met selection criterion. The one connection of the PaN in the CLC with the MeAPV (Figure 7
) is likely a functional circuit involving the VMH as this nucleus connects with both the PaN and the MeAPV. Consequently, the functional connection between the MeAPV and PaN could be mediated by the VMH.
The selection of clusters according to the results of PCA suggest a physically relevant cluster of nuclei, as the clusters were relatively conserved between Genotypes and the nuclei were placed in clusters without preconceptions about interactions between nuclei (excluding the placement of the PaN in the CLC). The nuclei considered in the RLC are associated with very different functions, albeit all of which have been related to mediating aggressive and sexual behaviors. The nuclei constituting the CLC have been implicated in sociosexual behaviors as well as feeding behavior. It is interesting that in certain instances anatomically associated nuclei were in different clusters. Nuclei that are very close to one another were usually quite similar in metabolic activity, so functional connectivity often follows. However, subnuclei in the medial amygdala – containing the MeAA, MeAPD, and MeAPV – and in the ventromedial hypothalamus – containing the VMH, VMHVL, and VMHDM, did not show strong correlations to one another. The MeAA was placed in the RLC and the MeAPD and MeAPV were placed in the CLC with little support for the MeAA to be placed with the posterior medial amygdaloid nuclei. This segregation of anterior and posterior medial amygdalar nuclei agrees with Newman (1999)
who argued that the “medial extended amygdala” is divided into an anterior functional circuit and a posterior functional circuit. The VMH, on the other hand, divided independent of the VMHDM and VMHDL into the RLC, but also divided with these nuclei into the CLC. This suggests that two functional circuits, one which shares the anterior nuclei, that is the MeAA and VMH, and another posterior functional circuit that shares functional connectivity between the VMH, VMHVL, VMHDM, MeAPD, MeAPV. In support of the expected functional connectivity of proximal anatomic nuclei, the MeAPV connecting with the MeAPD, and the VMHVL connecting with the VMHDM, showed some of the most consistent functional connections among all groups. However, in the CLC the VMH showed functional connectivity with the MeAPV more frequently than either of the more caudal VMH subnuclei across groups. The reason for this functional dissociation of the VMH from the posterior VMH nuclei is not known, but may be related to the anterior–posterior division of the medial amygdala and ventromedial hypothalamus subnuclei discussed above.
The significant correlation coefficients (Table 3
B) can be thought of as functional connections or associations, meaning that these correlations associate the COX activity in one nucleus with the COX activity in another nucleus, demonstrating that the two nuclei are functionally coupled in the animal. These associations do not imply directionality of an effect, or, even in the case of a demonstrated neuroanatomical connection, that the correlation is caused by direct activation of one nucleus upon another (Gonzalez-Lima and McIntosh, 1995
). The correlation coefficients can only show how well the COX activity in one nucleus can predict the COX activity in another nucleus. The physiological meaning of this correlation, and, consequently, how the jackknifed correlations are to be interpreted depends on what a functional connection between nuclei reveals about the biological system. When a significant correlation occurs between two nuclei using COX activity, it may be understood that increased or decreased activity in one nucleus associates with the increased or decreased activity of the other nucleus. As COX activity shows the capacity of a cell to perform under metabolic demand, functional connectivity may be thought of as showing that the maximal metabolic capability of two nuclei to perform is associated (Sakata et al., 2005
).
At the cellular level, this association is given greater meaning. Increased demand in energy by the cell has been shown to activate the bigenomic machinery responsible for the production of COX (Scarpulla, 2006
), and, in the neuron, metabolic demand is mostly attributed to maintaining the proper membrane potential using the Na+/K+ ATPase (Wong-Riley, 1989
). Since the depolarized neuron has a greater demand repolarize its membrane, it follows that energy consumption and the amount of COX present will depend upon the amount of tonic activation of a neuron due to excitatory signals from other neurons (Wong-Riley, 1989
). Consequently, abundant COX activity within a given nucleus represents consistent activation by excitatory signals. Thus, functional connectivity reflects regions whose activity is correlated to some degree. Strong functional connections (high correlations ∼0.8–0.9) can even be thought of as functional circuits due to the near complete coupling of activity between the two nuclei. However, such functional connections cannot be thought of as anatomical circuits due to the possibility of an unmeasured nuclei being involved. In fact, in the case of measurements made in the limbic brain, such as this study, it is almost impossible to consider every nucleus involved in a hypothesized circuit. Functional connections found between nuclei in this study should then be considered as possible components of circuits.
Within each cluster certain functional connections are conserved independent of litter composition (i.e. Genotype or Sibling Type), suggesting that these functional connections are maintained independent of treatment. Both KO or WT males shared certain functional connections: MeAA with ACo, CeA, PaN, and VMH, and the ACo with CeA in the mRLC, and MeAPD with MeAPV and the VMHDM with VMHVL in the mCLC. Some of these functional connections are reasonable to expect due to the close proximity of each nuclei or subnuclei such as the functional connections between the MeAPD with MeAPV, and the VMHDM with VMHVL, or the slightly more distant functional connections between the MeAA, ACo and CeA. However the relatively distant functional connections between the MeAA and the PaN and VMH suggests that the MeAA is acting in a conserved functional connection or circuit. In comparing the effect of male Sibling Type on functional connectivity the following relationships maintained significance at α = 0.01 level: the CeA with ACo and MeAA, MeAA with VMH, MeAPD with MeAPV, and VMHVL with VMHDM. This differs from the conserved connection between Genotypes in the loss of a functional connection of the MeAA with the ACo, CeA, and PaN. The above comparisons of functional connections are given at α = 0.01, but there are some differences in correlations between comparable groups for Genotype or Sibling Type that are maintained at α = 0.05. However, many other functional connections become significant for both Genotype and Sibling Type at α = 0.05. Those new functional connections that are significant across treatments are the AHA with the PaN, the MeAA with the PaN, and the MeAPV with the VMHVL.
Large differences between groups in functional connectivity are possible indicators of connections and circuits that may contribute to differing behavioral phenotypes. In comparing Genotype, it appears that WT males have many more significant functional connections that appear in the mRLC in comparison to KO males, who have relatively few unique functional connections in this cluster (Figure 6
). WT males show several strong connections that are not present in KO males (e.g., AHA with CeA, VMH, MeA, and cMPOA; cMPOA with CeA and AHA). Many of these nuclei are known to be involved in male sexual behavior and social interactions. The AVPe only shows one functional connection in the WT males (AVPe with VMH) and this connection is likely due to a large axonal connection between the AVPe and the BST that is known to be dependent upon estrogen for its formation. In KO animals, a unique functional connection between the VMH and the MeAPD and MeAPV was seen that had no counterpart in WT males.
The males having either WT or KO brothers shared certain functional associations: the ACo with the CeA, the CeA with the MeA, and the MeA with the VMH in the RLC and between the MeAPD and the MeAPV and between the VMHVL and the VMHDM (Figure 7
). Males having WT brothers had many more functional associations than if they had KO brothers, although this may have been due to the number of males considered in each group.
Behavioral neuroscience has been characterized by a candidate nuclei/gene approach that is a gross oversimplification of what occurs in the brain during behavior. The fact that nuclei (or genes) do not operate in isolation but in networks may seem obvious, but this is not reflected in how most scientists write or communicate. Newman (1999)
argued that an extended network of interconnected brain nuclei, including many of the nuclei measured in this study, functions in most basic social behaviors in rodents and, further, that this network is modulated by gonadal sex steroid receptors to function differently under different conditions. Another recent study taking alternative approaches has also emphasized a network approach to describe neural systems involved in responding to subordinate conspecific intruders (Motta et al., 2009
). The present results indicate that an individual’s experience in the litter influences its behavior as an adult by influencing the metabolic activity in integrated limbic circuits. This and previous research indicate that such experiences also shape how different individual respond to events later in life. This work is important for several reasons. First, it demonstrates a profound effect of the Sex and Genotype ratio of the litter on brain and behavior of genetically modified mice. Even in highly inbred rodents all litters are different, varying not only in the sex ratio and parity of the mother, but in the case of genetically modified animals, the genotype of the individual members. Such animals have been a mainstay in the area of molecular behavioral neuroscience, yet virtually every study to date has ignored the litter as a source of variation. By deconstructing the two variables (Sex and Genotype) that define the litter we show how the interplay of these factors shapes the neural substrates of behavior in the commonly used estrogen receptor KO mouse model. Second, we demonstrate how complex behavioral traits depend upon networks of nuclei whose functional relationships are altered fundamentally as a result of the litter environment in which the individual is raised. Third, we show how the potential for behavioral differences is based on the abundance of COX in specific brain nuclei and how the genotype (WT or KO) of brother and sister littermates modifies the amount of COX in limbic nuclei identified. Fourth, the work addresses key issues in how experiments in this very large field should be designed to yield a deeper understanding of how neural systems are organized early in life, particularly if the scientist’s goal is to reveal more about how the individual is formed and functions. We argue that most studies today focus at the level of the control and consequences of gene action and hence miss the larger picture. Finally, this work touches on fundamental concepts of development of the neural substrates of behavior, such as how functional systems can be re-organized depending upon the composition of the litter in which the individual develops. Most important in this genocentric age, the ever-increasing use of genetically modified animals in behavioral neuroscience research makes in imperative that practitioners be aware of this important formative element.
The authors declare that the research was conducted in the absence of any commercial or financial relationships that could be construed as a potential conflict of interest.
This research supported by MH 068273 (DC). We thank Nicolle Mathews, Samantha Luk, and Laura Murphy, Tomoko Soga, and Kazuya Tomihara for research assistance, Gwen Gage and Vicky Huang for help in the graphics, and Kyoko Matsui and Vivian Chin for behavioral data analysis and Lauren Ancel Myers for her helpful suggestions about statistical methods.
The Supplementary Material for this article can be found online at http://www.frontiersin.org/behavioralneuroscience/paper/10.3389/neuro.08/012.2009/
De Vries, G. J., and Simerly, R. B. (2002). Anatomy, development, and function of sexually dimorphic neural circuits in the mammalian brain. In Hormones Brain and Behavior, Vol. 4, D. W. Pfaff, A. P. Arnold, A. M. Etgen, S. E. Fahrbach, and R. T. Rubin, eds (San Diego, CA, Academic Press), pp. 137–191.
Sakata, J. T., Gonzalez-Lima, F., Gupta, A., and Crews, D. (2001). Animal models of experiential effects on neural metabolism: Plasticity in limbic circuits. In Neuroplasticity, Development and Steroid Hormone Action, R. Handa, S. Hayashi, E. Terasawa, and M. Kawata, eds (Boca Raton, FL, CRC Press), pp. 257–272.