Cellular imaging of visual cortex reveals the spatial and functional organization of spontaneous activity
- Department of Neurobiology, Harvard Medical School, Boston, MA, USA
The cerebral cortex is never silent; even in primary sensory areas there is ongoing neural activity in the absence of sensory input. Correlations in spontaneous activity can provide clues about network structure, but it has been difficult to record from enough nearby neurons to sample these correlations well. We used in vivo two-photon calcium imaging to demonstrate sparse patterns of correlated spontaneous activity among groups of ∼150 simultaneously imaged cells. In cat visual cortex, correlations fell off sharply with distance, by 50% within ∼240 μm, but in the rat there was little dependence on spatial separation up to 400 μm. In both species, cells that responded best to visual contours of a specific orientation were spontaneously co-active, suggesting that functionally related cells are organized into distinct subnetworks. Although these subnetworks are clustered in the cat, they are intermingled in the rodent, arguing for specific connections within the local cortical network.
Introduction
Since the early days of microelectrode recordings, neurons in the cerebral cortex have been known to fire spontaneously (Hubel and Wiesel, 1962; Noda and Adey, 1970) and to be correlated in their firing patterns (Arieli et al., 1995; Tsodyks et al., 1999; Chiu and Weliky, 2002; Kenet et al., 2003). Excitatory synaptic connections between neurons result in tight correlations between them, so correlations on the scale of a few milliseconds have been used to study the connectivity between thalamus and cortex (Reid and Alonso, 1995; Miller et al., 2001; Bruno and Sakmann, 2006), between layers in the cortex (Alonso and Martinez, 1998) and between widely separated neurons within a cortical layer (Ts’o et al., 1986). Slower correlations, at scales from 10 ms to >1 s, provide evidence for ensembles of cells whose members might be directly or indirectly connected (Kohn and Smith, 2005).
Although electrical recordings of neurons first demonstrated the existence of correlated ensembles, only with the advent of optical imaging techniques could the spatial organization of correlated activity be appreciated. In the visual cortex of cats, correlated spontaneous activity is organized in patterns very similar to those evoked by visual stimuli. However, this close relationship between spontaneous activity and functional architecture (the clustering of neurons with similar response properties) had only been shown with voltage sensitive dye imaging in vivo, which blurs the signals from thousands of neurons (Arieli et al., 1995; Tsodyks et al., 1999; Kenet et al., 2003). Therefore, optical imaging could only demonstrate correlations between nearby cortical modules, typically on the scale of several millimeters, presumably as a result of long-distance connections between modules (Ts’o et al., 1986; Bosking et al., 1997).
In contrast to optical imaging and microelectrode recordings, calcium imaging permits the sampling of activity in all cells within a region hundreds of micrometers across, and is better suited for interrogating spatial patterns of spontaneous activity at cellular resolution within local cortical circuits. In vitro calcium imaging in rodent visual cortex has revealed sparse patterns of spontaneous activity (Mao et al., 2001) that are spatially (Cossart et al., 2003) and temporally (Ikegaya et al., 2004) repeatable, but these patterns of activity have never been studied in relation to sensory physiology.
We therefore examined patterns of spontaneous calcium activity in the visual cortex of two species: the cat, which has an organized map of orientation preference (Hubel and Wiesel, 1962; Grinvald et al., 1986; Swindale et al., 1987; Hübener et al., 1997), and the rodent, which does not (Girman et al., 1999; Ohki et al., 2005; Van Hooser et al., 2005). We wished to examine at the cellular level how correlated spontaneous activity was affected by two variables: (1) the distance between neurons and (2) the similarity of their visually evoked response properties, specifically their preferred orientations. Since neurons with different preferred orientations are spatially mixed in the rodent, the dependence of correlations on these two variables – distance and relative orientation preference – is not confounded, as it is in the cat. Thus, the rodent visual cortex provides an excellent model system for studying the relationship between spontaneous and sensory-evoked activity.
Materials and Methods
Animal Preparation and Surgery
Long Evans rats (postnatal days 27–30, seven animals) and cats (postnatal days 30–40, six animals) were anesthetized with isoflurane (1–2% in surgery, 0.5–1% during imaging) and prepared for two-photon scanning laser microscopy as previously described (Ohki et al., 2005). Briefly, a small craniotomy was performed over either primary visual cortex (rats) as previously described (Ohki et al., 2005) or visual cortex area 18 (cats), as defined by Horsley–Clarke coordinates, A2-6 and L1-3. The dura was reflected and the underlying cortex covered with agarose (3% in artificial cerebrospinal fluid, ACSF). During imaging, animals were maintained under light surgical anesthesia as reflected in the electroencephalogram, with occasional periods of high voltage slow activity and roughly one spindle per second; the anesthetic dose was titrated to maintain the animals in this regime.
Dye Loading and in vivo Two-Photon Imaging
Cell permeant calcium indicator (0.8 mM Oregon Green 488 BAPTA-1 AM with 8% dimethyl sulfoxide, 2% pluronic acid, and 40 μM Alexa-594, all from Invitrogen) was injected with a glass pipette at a depth of 300–400 μm, which corresponds to layer 2/3 in the visual cortex of both species. Changes in fluorescence of cortical neurons were monitored with a custom-built microscope with Olympus 40× WI objective (0.8 NA) and a Tsunami (Spectra-Physics) mode-locked Ti:sapphire laser (920 nm; power after the objective <50 mW).
Visual Stimulation
For visual stimulation, square-wave gratings (black and white bars) were drifted at 1.7 Hz (rats) or 2 Hz (cats) in eight directions of motion in steps of 45°. Each stimulus started with a blank period (8 s) followed by the same period of visual stimulation. The eight stimuli were presented sequentially and repeated four or five times. For spontaneous activity trials, the animals’ eyes were covered with a black cloth to eliminate stray light. In some test cases, spontaneous activity was obtained with a neutral gray stimulus screen, which gave similar results.
Data Analysis
Images were analyzed in Matlab (Mathworks) and ImageJ (National Institutes of Health). Cells were automatically identified (4,110 cells in rat, 2,230 cells in cat) through a series of morphological filters that delineated the contours of cell bodies. To make a correspondence between evoked and spontaneous trials, the images in each evoked-spontaneous trial pair were aligned to compensate for slight shifts. Next, all the pixels within a cell outline were summed to give a single time-course (ΔF/F) over the entire duration of the spontaneous activity trial. Time-courses of individual cells were extracted by summing pixel values within cell contours. Cell outlines from the spontaneous trial that overlapped with cell outlines in the evoked trial were then assigned orientation preference values from the overlapping cells in the evoked trial. For the analysis in Figure 2, all cells were used regardless of overlap. In some experiments, the cell outlines from the spontaneous trial were used to obtain time-courses and orientation values from the evoked trial. Visually responsive cells were defined by analysis of variance (ANOVA) across the blank and eight directions (p < 0.05; 1,393 cells from rats, 44%; 1,883 cells from cats, 84%). Of these, selective cells were defined by ANOVA across eight directions (p < 0.05; 1,097 cells from rats, 79%; 1,861 cells from cats, 99%). Preferred orientation and tuning curves were obtained by fitting with the sum of two circular Gaussian functions (Swindale et al., 2003). Selective cells were further selected by orientation tuning width (<60° HWHM, 979 cells from rats, 1,807 cells from cats). Slow drift of the baseline signal over minutes was removed by a low-cut filter (cut-off, 100 s). Event thresholds were defined as the greater of 6% ΔF/F, or ΔF/F above 3 SD of the negative-going portion of the time-course. Thresholded event data was only used for reporting spontaneous event frequencies and for co-activation map calculations. Population statistics of thresholded event data are presented in Figure S2 in Supplementary Material. All quantitative analysis was based on unthresholded time-courses; previous analysis performed on thresholded time-courses yielded similar results, but analysis based on unthresholded time-courses yielded a clearer and stronger result. Co-activation maps were calculated by averaging frames from the spontaneous trial during events of the selected trigger cell, with the remainder of the frames in the trial averaged and subtracted as background. As images were scanned with a fast horizontal and slow vertical axis, artificially elevated correlations were sometimes seen between horizontally aligned cells. This was seen most often in experiments with strong neuropil staining, in which fast events (Kerr et al., 2005) were observed as bright horizontal bands. To minimize this effect, correlation coefficients were calculated from unthresholded spontaneous activity time-courses R1 and R2 or between adjacent frames as the average of <R1(t), R2(t + 1)> and <R1(t + 1), R2(t)>. Correlation coefficients between single frames <R1(t), R2(t)> were also calculated and yielded similar results except in experiments with strong neuropil staining. Unless otherwise specified, Wilcoxon rank-sum tests were used to evaluate significance throughout. All error bars are specified as standard error of the mean (SEM).
Results
We examined patterns of spontaneous activity in vivo in a preparation that allowed us to study the functional properties of the participating neurons. We labeled cortical cells with a fluorescent indicator of intracellular calcium (Stosiek et al., 2003; Ohki et al., 2005) (Oregon Green BAPTA-1 AM; Figure 1A) and collected series of 400 μm × 400 μm planar images every 1.6 s. As in previous studies both in vitro (Cossart et al., 2003; Ikegaya et al., 2004) and in vivo (Kerr et al., 2005; Greenberg et al., 2008), we observed transient increases of relative fluorescence (ΔF/F) in cell bodies. These events are characterized by a fast rise and slow decay (1–4 s) which makes them easily detectable even at low imaging rates. Since there is a trade-off between image area and imaging speed, we opted for a large area at a low frame rate (0.6 Hz, 1.6 s/frame) so that the fluorescent events were typically one or a few frames in duration by our threshold parameters (see Materials and Methods). Our measurements could therefore detect both fast (millisecond-scale) as well as slow (second-scale) correlations, but not differentiate between them. Our low sampling rate also helped minimize photodamage during the long imaging time at a given image plane (at least 20 min during spontaneous activity and at least 10 min for visually evoked trials).
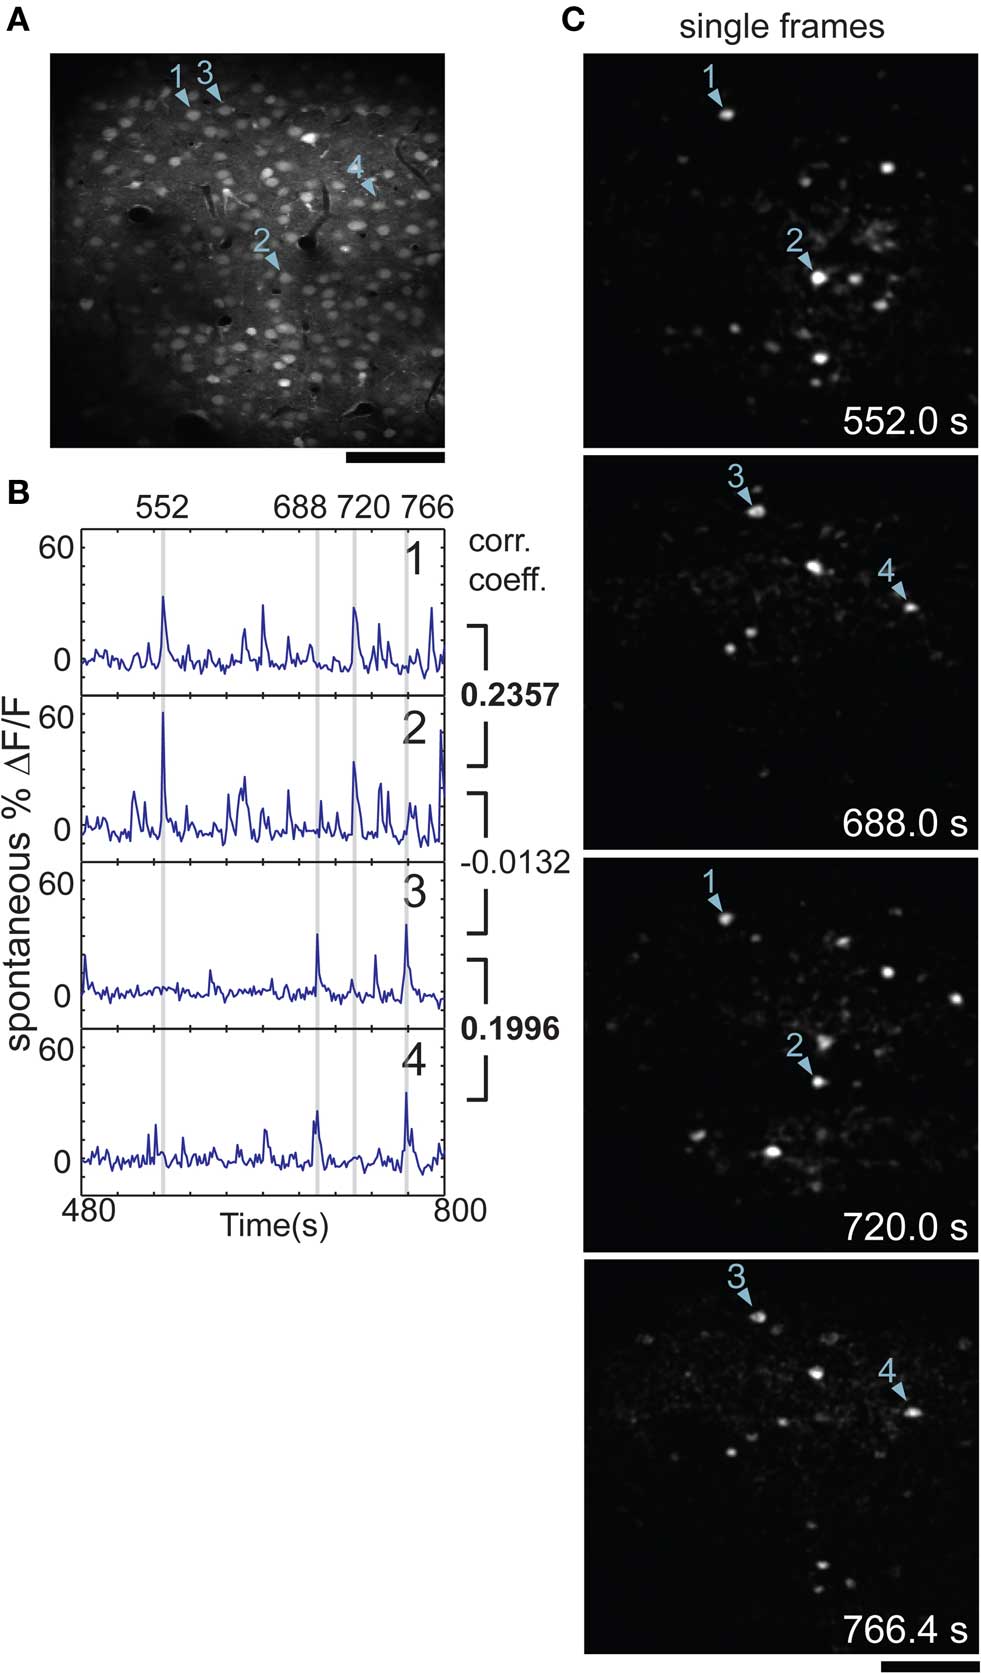
Figure 1. Neuronal activity is correlated during spontaneous activity in rat visual cortex. (A) Two-photon image of cells in rat visual cortex stained with calcium indicator, imaged in vivo 180 μm below the pial surface. (B) Time-courses of cells 1–4 as marked in (A); gray bars mark the times of the images shown in (C). Cell 1 was well correlated with cell 2 [correlation coefficient (CC) = 0.2357] and cell 3 was well correlated with cell 4 (CC = 0.1996). Both cells 1 and 2 were uncorrelated with cells 3 or 4, e.g., CC = −0.0132 for cells 2 and 3. (C) Single frames from the same time-series as shown in (B), after subtraction of mean fluorescence (ΔF). Cells 1 and 2 were active at 552.0 and 720.0 s, along with several others. Cells 3 and 4 were active at 688.0 and 766.4 s. Time of frame is noted in bottom corner of each panel. Scale bars, 100 μm.
Prior calcium imaging studies in vitro (Cossart et al., 2003; Ikegaya et al., 2004) and in vivo (Kerr et al., 2005; Greenberg et al., 2008) have demonstrated that the relative fluorescence increase (ΔF/F) in the cell body is proportional to the number of action potentials fired. When Oregon Green BAPTA-1 AM is used under conditions similar to our experiments, single spikes correspond to a ΔF/F of approximately 5% (Kerr et al., 2005; Greenberg et al., 2008). Therefore, even though we cannot quantify the exact number of spikes in each transient, the correlation coefficients we report are nonetheless closely related to the correlation coefficients that would be derived from electrophysiological measurements of action potentials.
Spontaneously Co-Active Neurons are Clustered in the Cat, but Not in the Rat
Even in the absence of visual input, almost all cells demonstrated some degree of spontaneous activity (up to 70–80% ΔF/F; Figure 1B; Figure S1 and Movies S1 and S2 in Supplementary Material). We defined spontaneous calcium events as significant increases of ΔF/F in cell bodies, as described in Section Materials and Methods. In rats the spontaneous event rate ranged from 0 to 0.126 Hz (mean: 0.040 ± 0.017 Hz (SD); n = 4,110 cells from 25 imaging planes in seven animals), consistent with past studies in vivo that have measured activity with bulk-loaded calcium indicators (Kerr et al., 2005; Greenberg et al., 2008); in cats the spontaneous event rate ranged from 0.007 to 0.084 Hz (mean: 0.034 ± 0.010 Hz; n = 2,230 cells from 14 planes in six animals; Figure S1 in Supplementary Material).
We found that small groups of cells tended to co-activate repeatedly over the course of many minutes. This is illustrated in a short segment of data during which two pairs of cells were co-active at different times (Figures 1B,C). To quantify the relationship between co-active cells, we performed cross-correlation analysis between cell pairs (Figure 1B).
We visualized the spatial layout of correlated activity by calculating co-activation maps, obtained by averaging all images triggered by events from a single cell. Although these maps show multiple cells, they illustrate pair-wise relationships, with the trigger cell being one of the pair. In rats, correlated cells were scattered throughout the 400 μm field of view (Figure 2B) whereas in cats, they tended to cluster in a spatially restricted area (Figure 2B). We quantified these relationships by plotting correlation coefficient vs. distance between all cell pairs in the rat (Figures 2C,E, cf. Greenberg et al., 2008) and in the cat (Figures 2D,F). Each experiment had roughly 150 cells, which yielded more than 10,000 pair-wise combinations. In the cat, the average correlation coefficient fell by 50% within several hundred micrometers: from a peak of 0.12 for distances <80 μm, to <0.06 for distances above 240 μm (Figure 2F; p < 0.001, Wilcoxon rank-sum test). In the rat, the average correlation coefficients were weaker for nearby neurons (0.07 for distances <80 μm), and declined only slightly (to ∼0.06 for distances >80 μm; Figure 2E; p < 0.001).
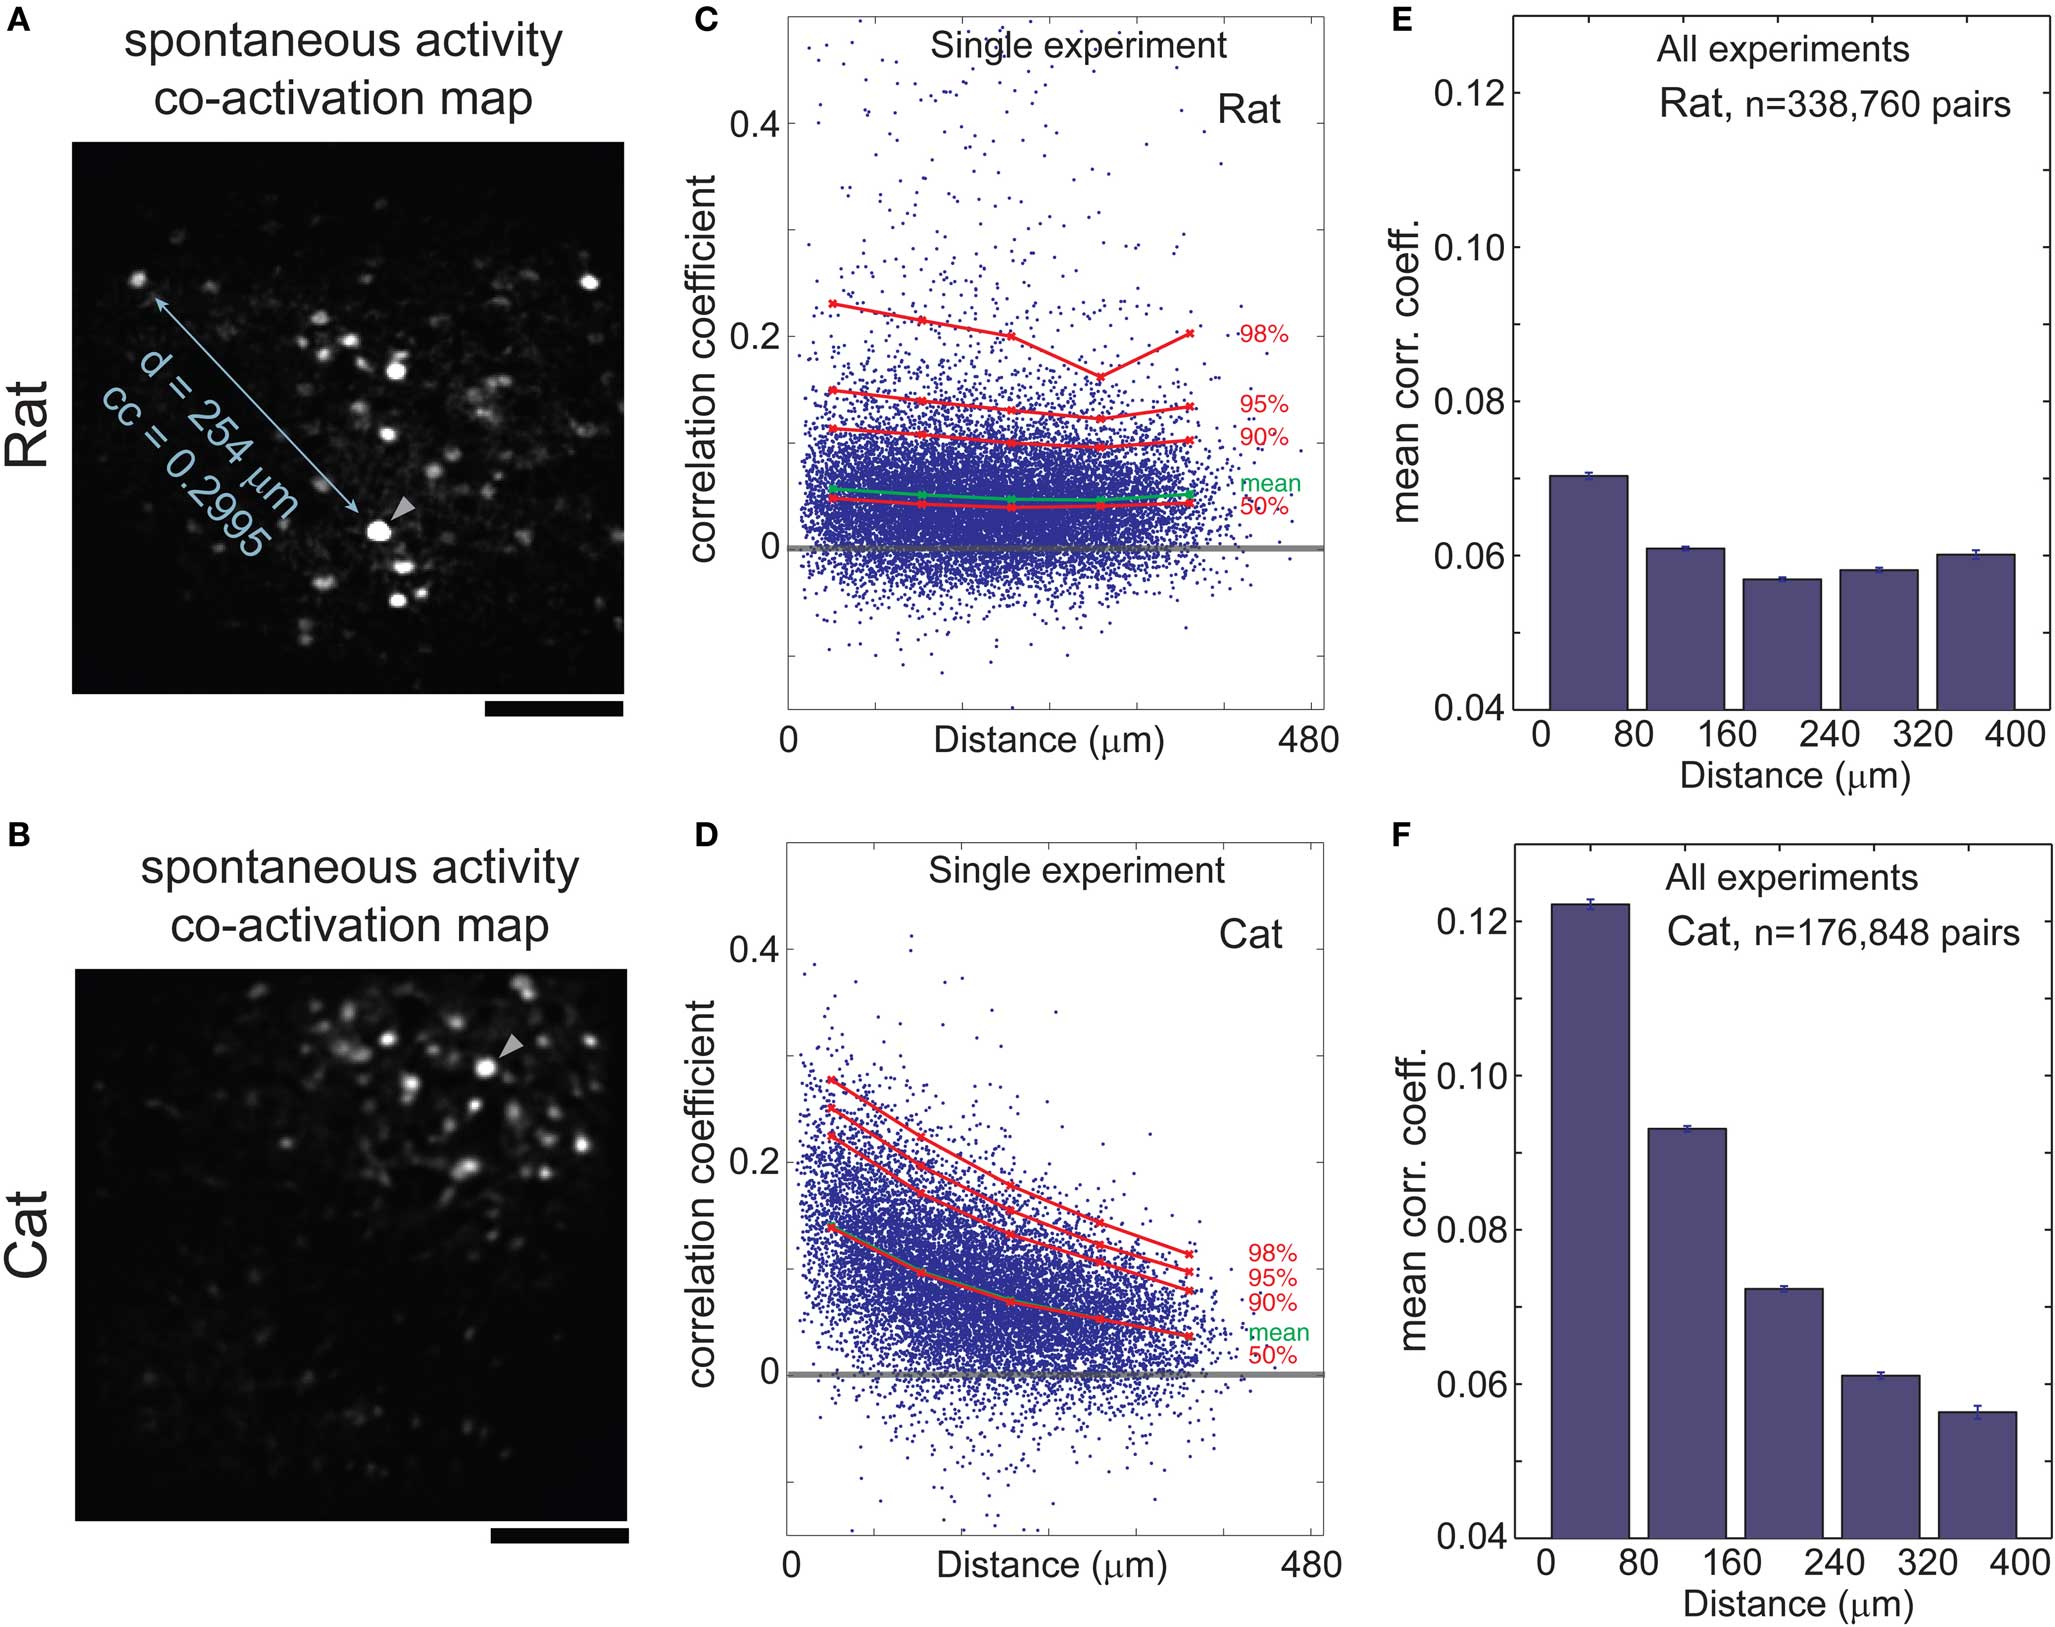
Figure 2. Correlations in spontaneous activity depends on the distance between cells in cat but not rat visual cortex. (A) Co-activation map in rat visual cortex; cells that are correlated with trigger cell (arrowhead) are scattered throughout the frame. (B) Co-activation map in cat visual cortex area 18; correlated cells are clustered close to the trigger cell. (C,D) Correlation coefficient (CC) of each cell pair during spontaneous activity plotted against distance between the given cells in rat (C) and cat (D) visual cortex. Mean CC, green; 50th to 98th percentiles, red. Note the inverse relationship of CC with distance between cell pairs in the cat (D), in contrast to the almost flat distribution in the rat (C). (E,F) Mean CC vs. distance between cell pairs, in seven rats (E) and six cats (F). Error bars, SEM. Scale bars, 100 μm.
Dependence of Pair-Wise Correlations on Orientation Preference
We hypothesized that this striking difference between species is due in part to the differences in the underlying functional architecture; cells with similar visual response properties are spatially clustered in the cat (Hubel and Wiesel, 1962; Grinvald et al., 1986; Swindale et al., 1987) but not in the rat (Girman et al., 1999; Ohki et al., 2005). We therefore compared the patterns of correlated spontaneous activity to the patterns of orientation selectivity of the participating cells, measured by presenting drifting gratings (light and dark bars) in four orientations and eight directions. We took great care to ensure that the same cells were studied during spontaneous and evoked activity, excluding trials if brain movements during imaging made the correspondence uncertain.
In the rat, we found that cells with similar orientation preferences tended to be co-active. Cells that responded preferentially to different orientations (shown in false color in Figure 3B) were intermingled in a salt-and-pepper fashion (Ohki et al., 2005). When orientation maps and co-activity maps are overlaid (Figure 3C), it is clear that co-active cells share the same orientation preference (the same color in Figures 3A,C). We quantified this relationship by plotting correlation coefficients of all pairs of oriented cells against their difference in orientation preference (Δorientation; Figure 3D, from a single imaged plane; Figure 3E, across the entire population). On average, the correlation coefficient fell from more than 0.07 to 0.05 as the difference in orientation preference approached 90° (Figure 3E, p < 0.001, Wilcoxon rank-sum test).
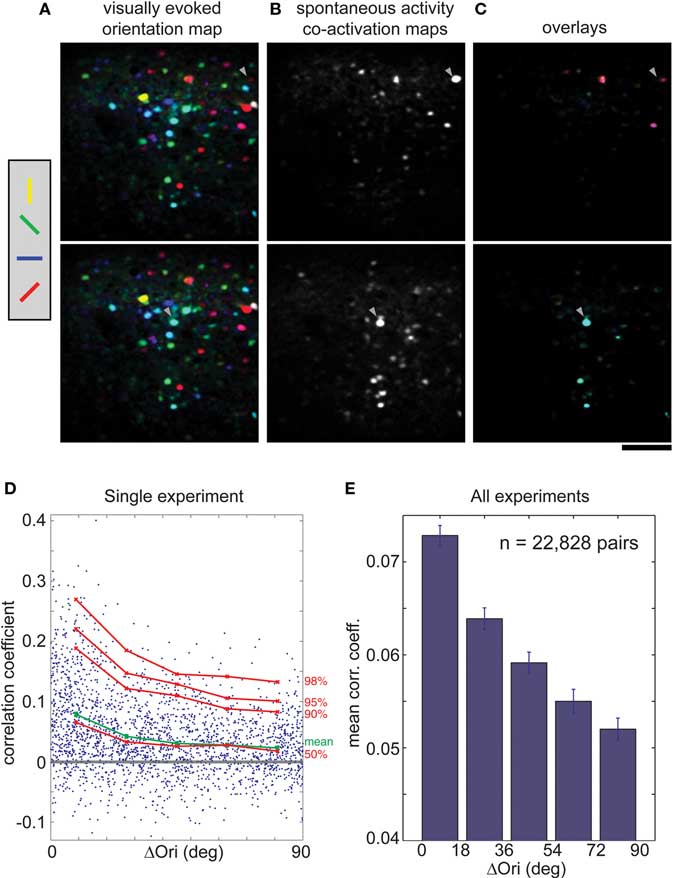
Figure 3. Correlations in spontaneous activity is greater for cells with similar orientation preference in rat visual cortex. (A) Orientation map (shown twice), where hue is determined by the orientation that evoked strongest response when animal viewed drifting black and white bars at four orientations. (B) Co-activation maps (ΔF), obtained during spontaneous activity, which illustrate cells correlated with two different trigger cells (arrowheads). (C) Overlay of the single orientation map (A) with the two different co-activation maps (B). Note that co-active cells share the same orientation (hue). (D) CC of each cell pair during spontaneous activity plotted against the difference in orientation preference (ΔOri) for a single experiment. Mean CC, green; 50th to 98th percentiles, red. (E) Mean spontaneous CC vs. ΔOri over all experiments (n = 22,828 cell pairs, seven rats). Error bars, SEM. Scale bars, 100 μm.
In cat visual cortical area 18, cells with similar visual response properties were spontaneously co-active, as might be expected from the spatial clustering of correlated cells (Figures 2B,D,F) and the well-known clustering of cells with similar orientation and direction preference (Hubel and Wiesel, 1962; Grinvald et al., 1986; Swindale et al., 1987; Hübener et al., 1997; Ohki et al., 2005) (Figure 4A). Examples of co-activation maps derived from two different trigger cells, obtained from the spontaneous activity from the same imaging plane, show that co-active cells are clustered and share both orientation and direction preference (Figures 4B,C). We rarely had enough cells on both sides of a direction fracture for quantitative analysis, so we concentrated on differences in orientation preference. Plots of correlation coefficient against Δorientation confirm that functionally similar cells are more likely to be correlated during spontaneous activity (Figure 4D, from a single imaged plane; Figure 4E, across the entire population), although the correlations for iso-oriented cells were greater than in the rat, ∼0.09 vs. ∼0.07. Further, the correlation coefficient decreased more rapidly as the difference in orientation preference increased, to ∼0.065 at 50° (Figure 4E, p < 0.001, Wilcoxon rank-sum test; larger orientation differences were too rarely sampled for a statistically significant measurements). As discussed below, however, these differences are hard to interpret given the differences in spatial clustering between the two species.
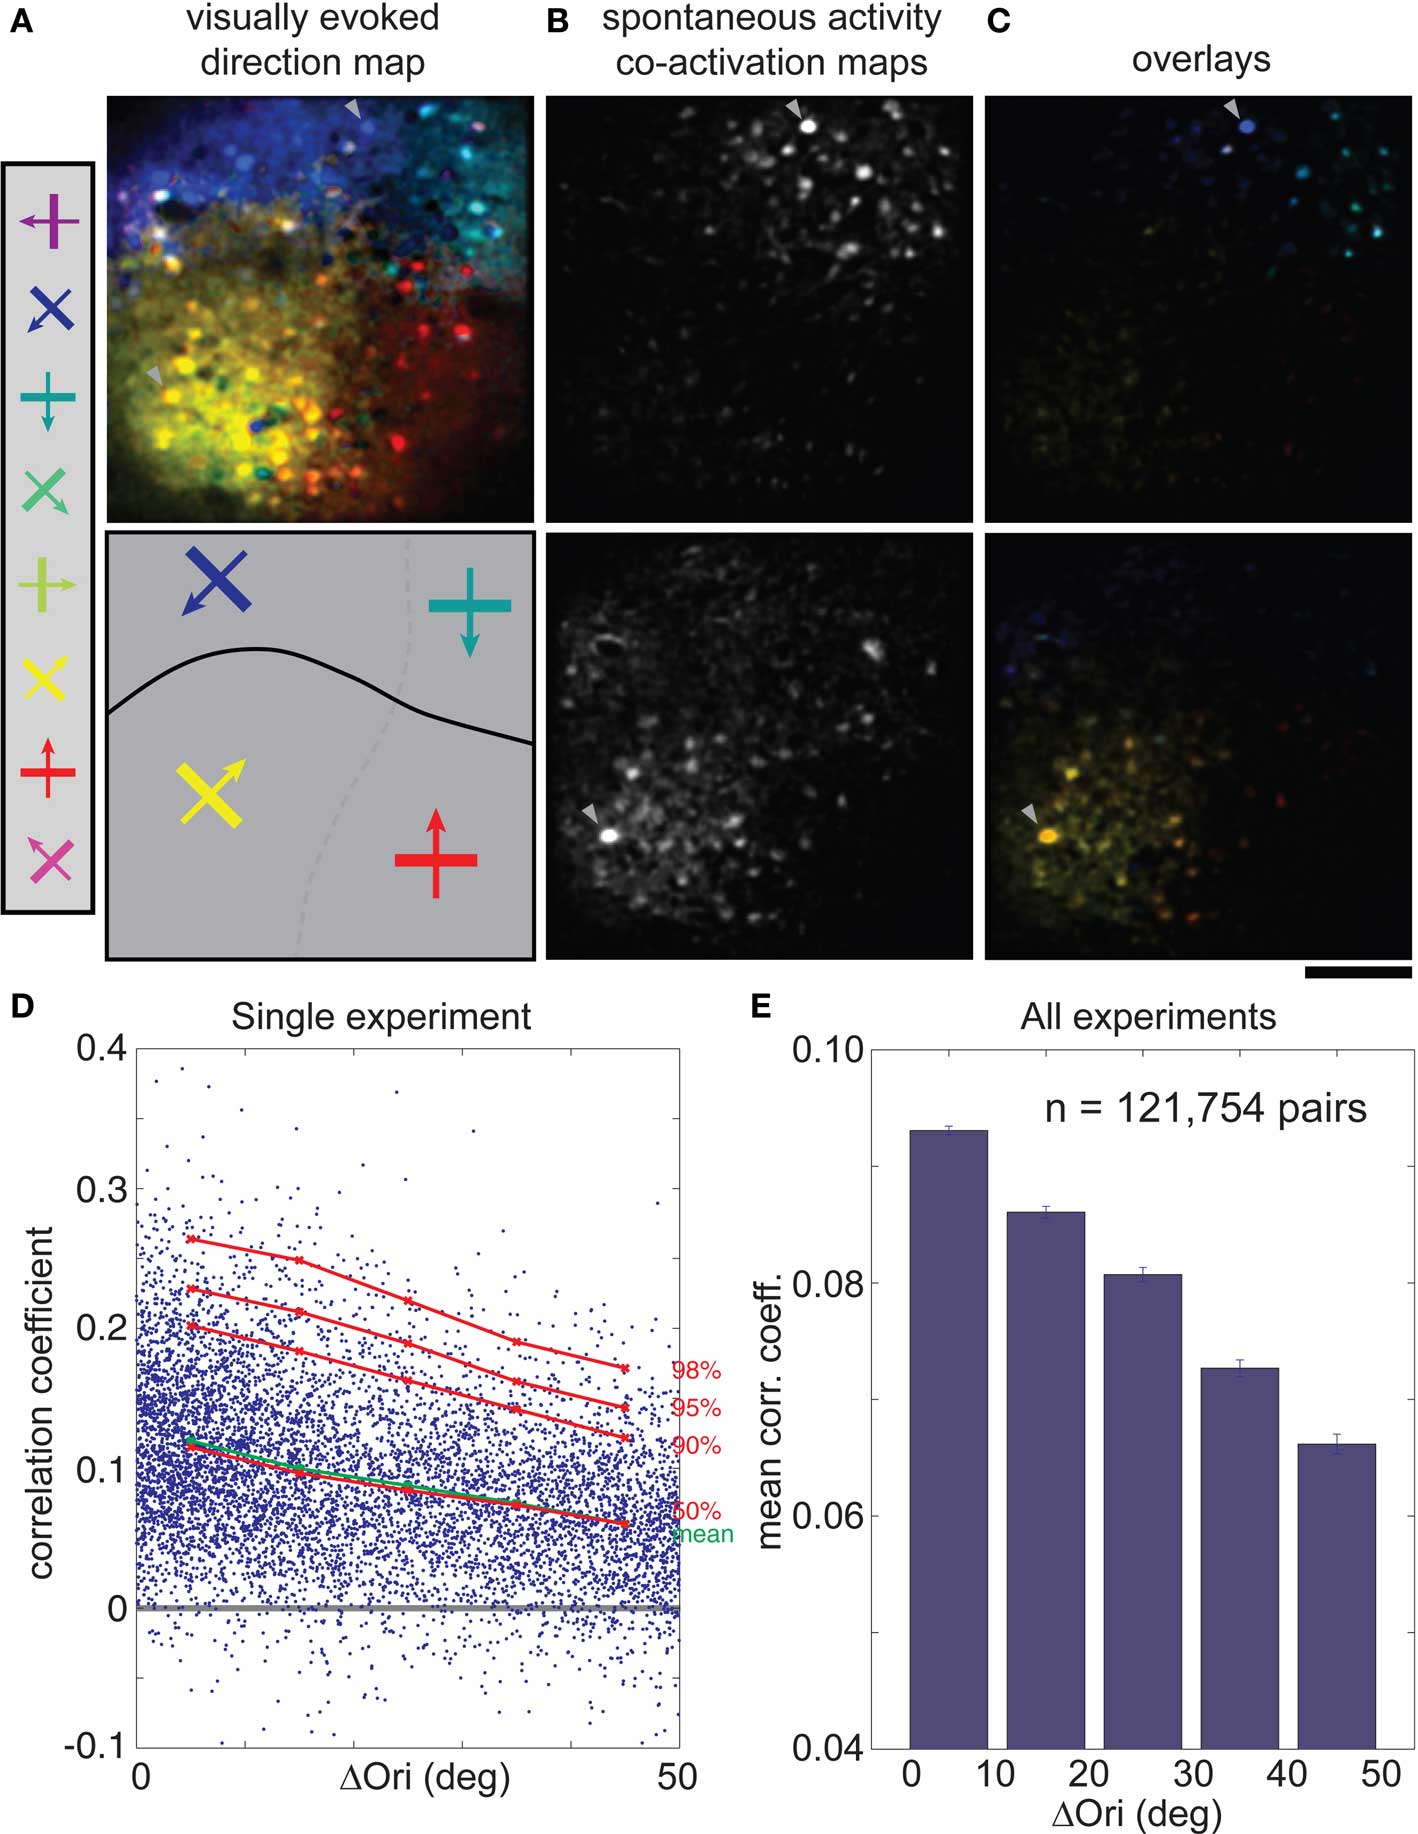
Figure 4. Correlations in spontaneous activity is greatest for cells with similar orientation or direction preference in cat visual cortex. (A) Top, direction map where hue is determined by the direction that evoked the strongest response when stimulated with eight directions of motion. Bottom, schematic diagram of orientation and direction domains (solid line: fracture between domains with opposite direction preference). (B) Co-activation maps (ΔF), obtained during spontaneous activity, for two different trigger cells (arrowheads). (C) Overlay of the single direction map (A) with the two different co-activation maps (B). Note that co-active cells share the same orientation and direction preferences (hue). (D) CC for each cell pair plotted against their difference in orientation preference (ΔOri) for a single experiment. Mean CC, green; 50th to 98th percentiles, red. (E) Mean spontaneous CC vs. ΔOri over all experiments (n = 121,754 cell pairs, six cats). Error bars, SEM. Scale bars, 100 μm. ΔOri is limited to a maximum of 50° because there were few cell pairs with ΔOri above that value.
To examine the relative contributions of distance and Δorientation, we examined how correlation coefficients varied with distance when Δorientation was kept relatively constant and vice versa. In the rat, this yielded similar results to those presented in Figures 2 and 3 (Figure S3 in Supplementary Material). In the cat, when Δorientation was held within narrow ranges, we found that correlation coefficients in all cases dropped off sharply with increasing inter-cell distance (Figure 5A; 35–51% decrease with distance, p < 0.001, Wilcoxon rank-sum test) similar to that seen in Figure 2F. This dependence on proximity for cells within a fixed Δorientation is likely related to the spatial clustering of cells with similar visual response properties that we do not interrogate here, such as ocular dominance, spatial frequency and direction selectivity. The dependence of correlation strength on Δorientation was not as consistent; when inter-cell distance was held within a narrow range, a strong inverse relationship of correlation coefficient and Δorientation was seen only in cells that are separated by roughly 300–400 μm (Figure 5B; p < 0.001, Wilcoxon rank-sum test). The relative lack of dependence on Δorientation for nearby cells in the cat may be related to the anatomical finding that axonal arbors are unrelated to orientation maps locally (at distances <400 μm) but are segregated with respect to orientation at longer distances (Malach et al., 1993; Bosking et al., 1997; Buzás et al., 2006). A more thorough examination of this question would require studying regions, such as pinwheels, where a range of orientations are represented in close proximity.
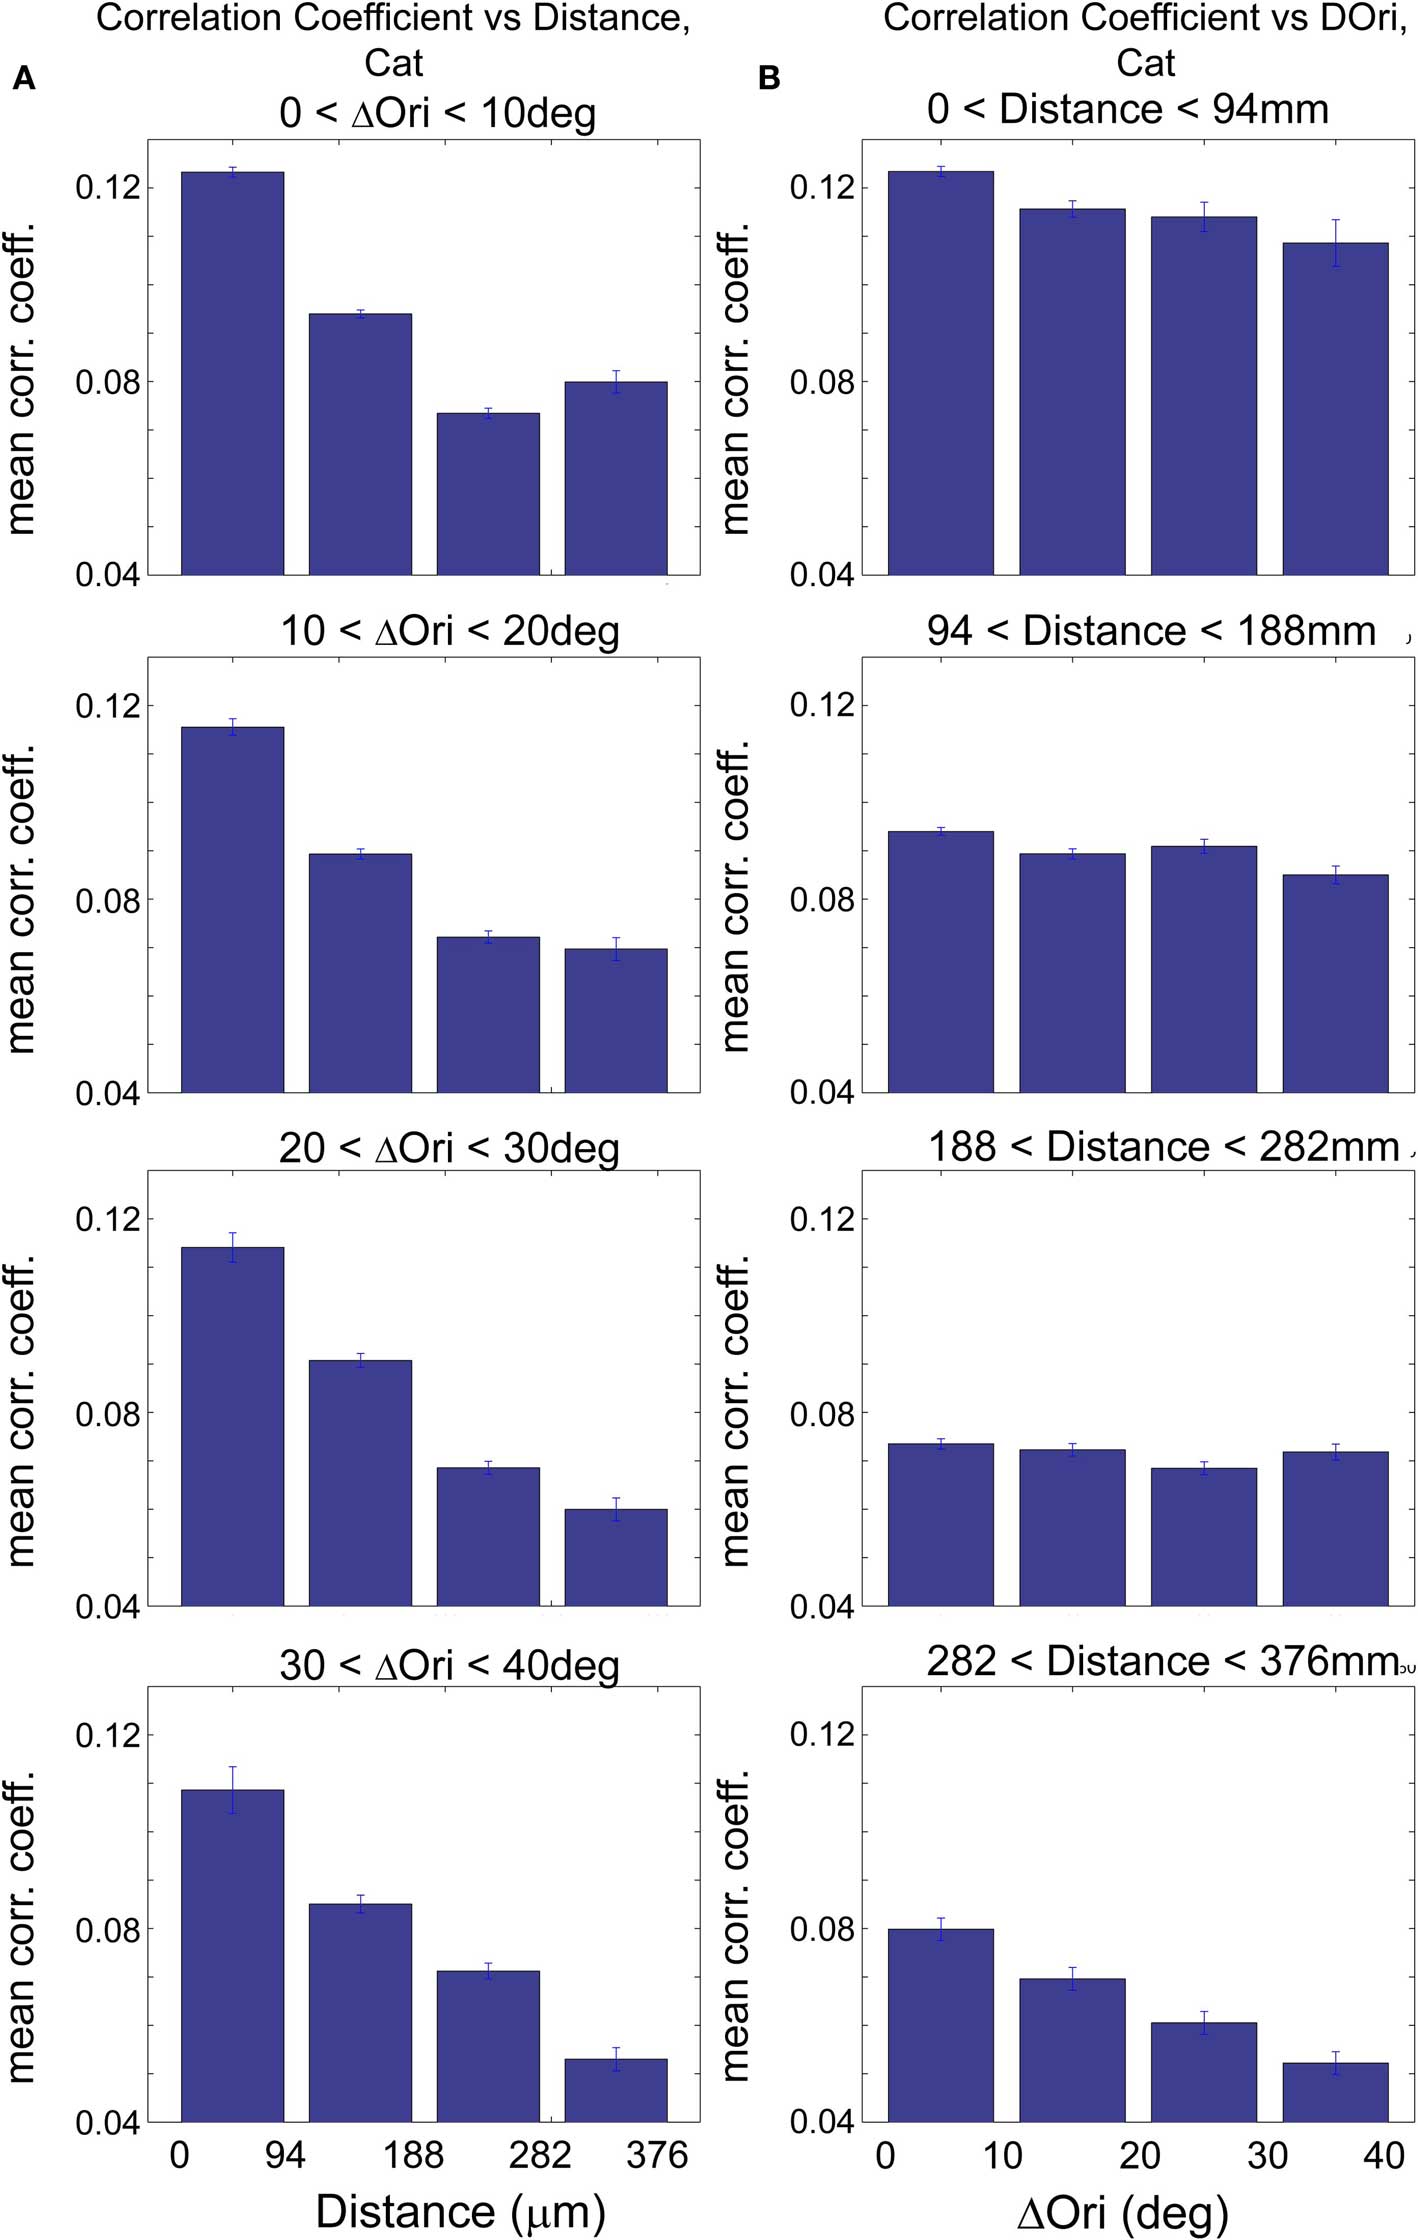
Figure 5. Correlations in spontaneous activity in cat visual cortex are influenced mainly by spatial proximity and also by similarity in functional properties between cells. (A) Spontaneous correlation coefficient (CC) vs. distance for a narrow range of Δorientation preference as indicated above each histogram series, in cat visual cortex. Here, we evaluate the correlations in spontaneous activity with increasing inter-cell distance while keeping Δorientation relatively constant. Note the significant decrease in CC with increasing distance in all four cases (p < 0.001, Wilcoxon rank-sum test). Cells that are more proximal to each other were thus more likely to be correlated, independent of their relative orientation preference, possibly due to the presence of other functional maps like ocular dominance that are not evaluated in this study. (B) Spontaneous correlation coefficient vs. Δorientation preference, while inter-cell distance is kept relatively constant. CC decreases with increasing Δorientation most notably for distant cells (e.g., >300 mm; p < 0.001, Wilcoxon rank-sum test). Here, ΔOri is limited to a maximum of 40° because there were insufficient numbers of cell pairs with ΔOri above ∼40° in this analysis after the additional binning by proximity.
Discussion
We have found that cells with the same orientation preference tend to be co-active during spontaneous activity. Further, the patterns of correlations are spatially scattered in rodent visual cortex, as had been seen in vitro (Mao et al., 2001; Cossart et al., 2003; Ikegaya et al., 2004), but are more localized in the cat. The degree of spatial clustering of correlated cells in the cat was significantly greater than would be predicted by orientation maps alone (Figures 2F, 4E, and 5). This is likely the result of other spatially organized maps in the same region of cortex, such as fine-scale retinotopy, ocular dominance, and spatial frequency (Hübener et al., 1997). Conversely, the weaker clustering in the rat, particularly in the range from 80 to 400 μm, suggests that there are not highly organized maps in rat visual cortex at this scale. Nonetheless, the slightly stronger correlations for neurons spaced by <80 μm is intriguing (Figure 2E and Figure S3A in Supplementary Material), and might be related to anatomical mini-columns (Rockland and Ichinohe, 2004) or functional clustering at a very fine scale.
The strongest average correlations we observed were >12% for nearby neurons in the cat, particularly of the same orientation (Figures 2F and 5B), compared to 8% for nearby, iso-oriented neurons in the rat (Figure S3B in Supplementary Material). If we accept that correlations of nearby neurons in cat are partially due to functional maps other than orientation, one might speculate that if these other visual response properties could be used to identify functionally similar neurons in rat, higher average correlations might be found. It must be emphasized, however, that the average values are derived from broad distributions of correlation coefficients in both species (Figures 2C,D, 3D, and 4D), so an analysis of the distributions rather than the means is warranted before drawing strong conclusions.
Past work in vitro has demonstrated that there are disjoint but strongly interconnected subnetworks of cells in rodent cortex (Yoshimura et al., 2005); our results imply that these subnetworks consist of groups of cells with similar sensory response properties. More importantly, we find that these subnetworks maintain an orientation preference identity distinct from other adjacent subnetworks, despite being closely intermingled in the rodent.
It has been proposed that strong and rare connections determine the dynamics and function of cortical or thalamocortical networks, while the multitude of weaker connections play a secondary or modulatory role (Thomson et al., 1993; Sherman and Guillery, 1998; Kalisman et al., 2005; Song et al., 2005). For this reason, we draw attention to the cell pairs with correlations above the 90th percentile (Figures 2–4, red lines), corresponding to correlation coefficients above 0.15–0.20 (for example, pair 1–2 and 3–4 in Figure 1B). Although we base our conclusions on the average correlation coefficients, the dependence of correlations on spatial separation (Figure 2) or functional similarity (Figures 3 and 4) is clearest when one considers the strongest correlations (>90th percentiles, Figures 2–4). These most highly correlated pairs likely reflect the strongest connections in the circuit (Song et al., 2005), or subnetworks of highly interconnected cells (Yoshimura et al., 2005), and may give the best representation of circuit function.
It is well-known that synchronous activity in the cortex is modulated by the overall level of consciousness. Synchrony decreases as alertness increases through different depths of anesthesia, into wakefulness and active attention (Noda and Adey, 1970; Contreras and Steriade, 1997; Greenberg et al., 2008; Kuhn et al., 2008). Here, we have reported on correlations during light anesthesia – with neither the global synchrony induced by deep anesthesia nor the complex modulation of correlated firing induced by behavior (Fries et al., 2001) – in which we found a strong relationship between the function of a cortical network and its correlational structure.
It has been suggested by prior theoretical work (Koulakov and Chklovskii, 2001) that the salt-and-pepper configuration of rodent visual cortex is evidence for less precise like-to-like connectivity between neurons of similar orientation preference. Instead, we found that spontaneously co-active cells in the visual cortex, which are presumably the reflection of local subnetworks in cortical circuits, tend to share the same orientation preference in both cat and rat despite the different spatial organization of functional micro-architecture in these species. This provides evidence for a high level of specificity in synapse formation even in the seemingly disorganized milieu of the rodent visual cortex.
Authors Contributions
Conceived and designed the experiments: R. Clay Reid and Yeang H. Ch’ng. Performed the experiments: Yeang H. Ch’ng. Analyzed the data: Yeang H. Ch’ng. Wrote the paper: R. Clay Reid and Yeang H. Ch’ng.
Conflict of Interest Statement
The authors declare that the research was conducted in the absence of any commercial or financial relationships that could be construed as a potential conflict of interest.
Acknowledgments
We thank V. Bonin, M. Andermann, L. Glickfeld, K. Ohki, and A. Kerlin for critical discussions and reading of the manuscript; A. Vagodny for surgical assistance; S. Yurgenson for technical support and programming. This work was supported by grants from the NEI and fellowships from HHMI (Y.H.C.).
Supplementary Material
The Supplementary Material for this article can be found online at http://www.frontiersin.org/integrativeneuroscience/paper/10.3389/fnint.2010.00020/
References
Alonso, J. M., and Martinez, L. M. (1998). Functional connectivity between simple cells and complex cells in cat striate cortex. Nat. Neurosci. 1, 395–403.
Arieli, A., Shoham, D., Hildesheim, R., and Grinvald, A. (1995). Coherent spatiotemporal patterns of ongoing activity revealed by real-time optical imaging coupled with single-unit recording in the cat visual cortex. J. Neurophysiol. 73, 2072–2093.
Bosking, W. H., Zhang, Y., Schofield, B., and Fitzpatrick, D. (1997). Orientation selectivity and the arrangement of horizontal connections in tree shrew striate cortex. J. Neurosci. 17, 2112–2127.
Bruno, R. M., and Sakmann, B. (2006). Cortex is driven by weak but synchronously active thalamocortical synapses. Science 312, 1622–1627.
Buzás, P., Kovács, K., Ferecskó, A. S., Budd, J. M., Eysel, U. T., and Kisvárday, Z. F. (2006). Model-based analysis of excitatory lateral connections in the visual cortex. J. Comp. Neurol. 499, 861–881.
Chiu, C., and Weliky, M. (2002). Relationship of correlated spontaneous activity to functional ocular dominance columns in the developing visual cortex. Neuron 35, 1123–1134.
Contreras, D., and Steriade, M. (1997). Synchronization of low-frequency rhythms in corticothalamic networks. Neuroscience. 76, 11–24.
Cossart, R., Aronov, D., and Yuste, R. (2003). Attractor dynamics of network UP states in the neocortex. Nature 423, 283–288.
Fries, P., Reynolds, J. H., Rorie, A. E., and Desimone, R. (2001). Modulation of oscillatory neuronal synchronization by selective visual attention. Science 291, 1560–1563.
Girman, S. V., Sauve, Y., and Lund, R. D. (1999). Receptive field properties of single neurons in rat primary visual cortex. J. Neurophysiol. 82, 301–311.
Greenberg, D. S., Houweling, A. R., and Kerr, J. N. (2008). Population imaging of ongoing neuronal activity in the visual cortex of awake rats. Nat. Neurosci. 11, 749–751.
Grinvald, A., Lieke, E., Frostig, R. D., Gilbert, C. D., and Wiesel, T. N. (1986). Functional architecture of cortex revealed by optical imaging of intrinsic signals. Nature 324, 361–364.
Hubel, D. H., and Wiesel, T. N. (1962). Receptive fields, binocular interaction and functional architecture in the cat’s visual cortex. J. Physiol. 160, 106–154.
Hübener, M., Shoham, D., Grinvald, A., and Bonhoeffer, T. (1997). Spatial relationships among three columnar systems in cat area 17. J. Neurosci. 17, 9270–9284.
Ikegaya, Y., Aaron, G., Cossart, R., Aronov, D., Lampl, I., Ferster, D., and Yuste, R. (2004). Synfire chains and cortical songs: temporal modules of cortical activity. Science 304, 559–564.
Kalisman, N., Silberberg, G., and Markram, H. (2005). The neocortical microcircuit as a tabula rasa. Proc. Natl. Acad. Sci. U.S.A. 102, 880–885.
Kenet, T., Bibitchkov, D., Tsodyks, M., Grinvald, A., and Arieli, A. (2003). Spontaneously emerging cortical representations of visual attributes. Nature 425, 954–956.
Kerr, J. N., Greenberg, D., and Helmchen, F. (2005). Imaging input and output of neocortical networks in vivo. Proc. Natl. Acad. Sci. U.S.A. 102, 14063–14068.
Kohn, A., and Smith, M. A. (2005). Stimulus dependence of neuronal correlation in primary visual cortex of the macaque. J. Neurosci. 25, 3661–3673.
Koulakov, A. A., and Chklovskii, D. B. (2001). Orientation preference patterns in mammalian visual cortex: a wire length minimization approach. Neuron 29, 519–527.
Kuhn, B., Denk, W., and Bruno, R. M. (2008). In vivo two-photon voltage-sensitive dye imaging reveals top-down control of cortical layers 1 and 2 during wakefulness. Proc. Natl. Acad. Sci. U.S.A. 105, 7588–7593.
Malach, R., Amir, Y., Harel, M., and Grinvald, A. (1993). Relationship between intrinsic connections and functional architecture revealed by optical imaging and in vivo targeted biocytin injections in primate striate cortex. Proc. Natl. Acad. Sci. U.S.A. 90, 10469–10473.
Mao, B. Q., Hamzei-Sichani, F., Aronov, D., Froemke, R. C., and Yuste, R. (2001). Dynamics of spontaneous activity in neocortical slices. Neuron 32, 883–898.
Miller, L. M., Escabi, M. A., Read, H. L., and Schreiner, C. E. (2001). Functional convergence of response properties in the auditory thalamocortical system. Neuron 32, 151–160.
Noda, H., and Adey, W. R. (1970). Firing variability in cat association cortex during sleep and wakefulness. Brain Res. 18, 513–526.
Ohki, K., Chung, S., Ch’ng, Y. H., Kara, P., and Reid, R. C. (2005). Functional imaging with cellular resolution reveals precise micro-architecture in visual cortex. Nature 433, 597–603.
Reid, R. C., and Alonso, J. M. (1995). Specificity of monosynaptic connections from thalamus to visual cortex. Nature 378, 281–284.
Rockland, K. S., and Ichinohe, N. (2004). Some thoughts on cortical minicolumns. Exp. Brain Res. 158, 265–277.
Sherman, S. M., and Guillery, R. W. (1998). On the actions that one nerve cell can have on another: distinguishing “drivers” from “modulators”. Proc. Natl. Acad. Sci. U.S.A. 95, 7121–7126.
Song, S., Sjöström, P. J., Reigl, M., Nelson, S., and Chklovskii, D. B. (2005). Highly nonrandom features of synaptic connectivity in local cortical circuits. PLoS Biol. 3, e68. doi:10.1371/journal.pbio.0030068.
Stosiek, C., Garaschuk, O., Holthoff, K., and Konnerth, A. (2003). In vivo two-photon calcium imaging of neuronal networks. Proc. Natl. Acad. Sci. U.S.A. 100, 7319–7324.
Swindale, N. V., Grinvald, A., and Shmuel, A. (2003). The spatial pattern of response magnitude and selectivity for orientation and direction in cat visual cortex. Cereb. Cortex 13, 225–238.
Swindale, N. V., Matsubara, J. A., and Cynader, M. S. (1987). Surface organization of orientation and direction selectivity in cat area 18. J. Neurosci. 7, 1414–1427.
Thomson, A. M., Deuchars, J., and West, D. C. (1993). Large, deep layer pyramid-pyramid single axon EPSPs in slices of rat motor cortex display paired pulse and frequency- dependent depression, mediated presynaptically and self- facilitation, mediated postsynaptically. J. Neurophysiol. 70, 2354–2369.
Ts’o, D. Y., Gilbert, C. D., and Wiesel, T. N. (1986). Relationships between horizontal interactions and functional architecture in cat striate cortex as revealed by cross-correlation analysis. J. Neurosci. 6, 1160–1170.
Tsodyks, M., Kenet, T., Grinvald, A., and Arieli, A. (1999). Linking spontaneous activity of single cortical neurons and the underlying functional architecture. Science 286, 1943–1946.
Van Hooser, S. D., Heimel, J. A., Chung, S., Nelson, S. B., and Toth, L. J. (2005). Orientation selectivity without orientation maps in visual cortex of a highly visual mammal. J. Neurosci. 25, 19–28.
Keywords: cortex, v1, spontaneous activity, calcium, two-photon imaging
Citation: Ch’ng YH and Reid RC (2010) Cellular imaging of visual cortex reveals the spatial and functional organization of spontaneous activity. Front. Integr. Neurosci. 4:20. doi: 10.3389/fnint.2010.00020
Received: 30 March 2010;
Paper pending published: 14 April 2010;
Accepted: 12 July 2010;
Published online: 19 August 2010
Edited by:
Martin W. Usrey, University of California, Davis, USAReviewed by:
Jose-Manuel Alonso, State University of New York, USAMartin W. Usrey, University of California, Davis, USA
Copyright: © 2010 Ch’ng and Reid. This is an open-access article subject to an exclusive license agreement between the authors and the Frontiers Research Foundation, which permits unrestricted use, distribution, and reproduction in any medium, provided the original authors and source are credited.
*Correspondence: R. Clay Reid, Department of Neurobiology, Harvard Medical School, 220 Longwood Avenue, Boston, MA 02115, USA. e-mail: clay_reid@hms.harvard.edu