Circulation weather types and spatial variability of daily precipitation in the Iberian Peninsula
 Alexandre M. Ramos
 Nicola Cortesi
 Ricardo M. Trigo
- 1Instituto Dom Luiz, Faculdade de Ciências, Universidade de Lisboa, Lisboa, Portugal
- 2Centre Européen de Recherche et de Formación Avancée en Calcul Scientifique, Meteo France, Toulouse, France
The relationships between atmospheric circulation patterns and daily Iberian rainfall are here explored at high spatial resolution (0.2°) using the Jenkinson and Collison automated classification scheme with 26 Weather Types (WTs). The WTs were computed by means of the daily EMULATE Mean Sea Level Pressure dataset (EMSLP) while the high resolution precipitation database corresponds to the recent Iberia02 daily gridded precipitation dataset over the 1950–2003 period. Six monthly indexes relating the WTs and precipitation were analyzed: their Frequency, the Mean Precipitation, the Percentage Contribution, the Area of Influence, the Precipitation Intensity, and Efficiency. Except for the Frequency of the WTs, all other indexes were evaluated studying their spatial distribution over the Iberian Peninsula, focusing on a WT and a month at time. A small number of WTs (7) was found to capture a high percentage (~70%) of monthly Iberian precipitation. The Westerly WT is the most influent one, followed by the Cyclonic, the Northwesterly and the Southwesterly WTs. Westerly flows, however, do not affect the Mediterranean fringe or the Cantabrian coast, which are dominated by the Easterly and Northerly WTs, respectively. Rainfall along the Mediterranean coastline and the Ebro basin depends on a variety of WTs, but their effects are confined to narrow areas and short temporal intervals, suggesting that local factors such as convective processes, orography and the proximity to a warm water body could play a major role in precipitation processes. We show that the use of daily gridded precipitation dataset holds the advantage of measuring the daily rainfall amount due to each WT directly instead to relying on the predicted values of the regression model as done in previous works.
Introduction
Rainfall variability is a well know characteristic of Mediterranean climate, and it has been particularly well studied around Mediterranean Basin particularly at the monthly and seasonal scales (Corte-Real et al., 1995; Kutiel et al., 1996; Xoplaki et al., 2004; Paredes et al., 2006). A comprehensive analysis for the entire Mediterranean is presented in Dünkeloh and Jacobeit (2003), which the authors show that their main modes of variability capture 75% of precipitation variability, with up to five significant atmospheric patterns responsible for Mediterranean seasonal precipitation.
In the context of Mediterranean basin, the Iberian Peninsula (IP) has been recognized as one of the most challenging places for analyzing spatial and temporal climate variability due to a number of reasons (Lionello et al., 2012), namely: (1) the singular location of the IP in the transition between tropical to mild climate in western area of Mediterranean basin; (2) its confinement between two contrasted water masses (the Atlantic Ocean and the Mediterranean sea); (3) its compact configuration with the vast majority of the Peninsular area (circa 500,000 km2) being enclosed by mountain chains. Additionally, the east-west alignment of the major mountain chains contributes to shape the high spatial variability of the region (Martin-Vide, 2004; Morata et al., 2006; Valero et al., 2009; Casado et al., 2010). In particular the IP orography has a strong influence on how low pressure systems affect the climate at a more local scale, as mountain ranges can shield eastern regions from the predominant Atlantic moisture advection (Gimeno et al., 2010). Some of these constraining factors can produce a relative disconnection from general circulation in some areas of IP, particularly in what concerns the Mediterranean fringe and Ebro basin to the east, where local factors can give marked regional variations as well as a high regional variability of precipitation (Muñoz-Diaz and Rodrigo, 2004; Martin-Vide and Lopez-Bustins, 2006).
As an example of rainfall variability in the IP, Table 1 shows a brief list of previous studies focusing on the regionalization of precipitation. Differences in the number of regions retained can result from different choices in what concerns: length of periods considered, different spatial station density, but also distinct statistical methods used. Nevertheless, it is possible to state that three main areas are often defined: northern and eastern fringes, (i.e., Cantabrian and Mediterranean coastland), and central-south, being the mountain chains the frontiers (see Figure 1A), although they do not exactly match between authors.
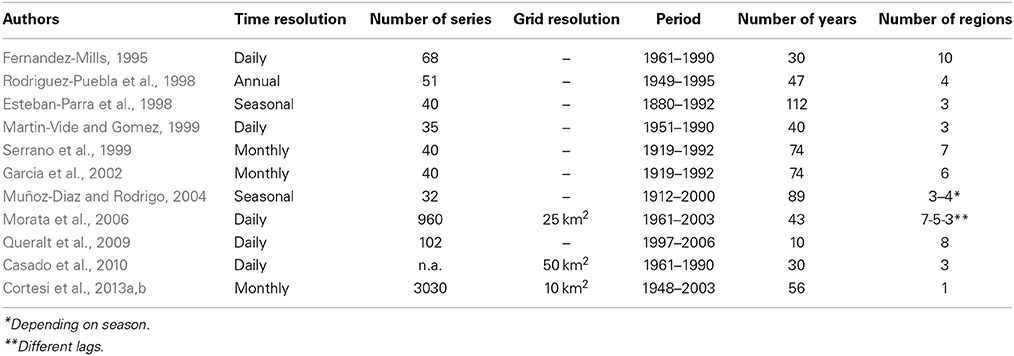
Table 1. Examples of regionalization of precipitation in the IP.
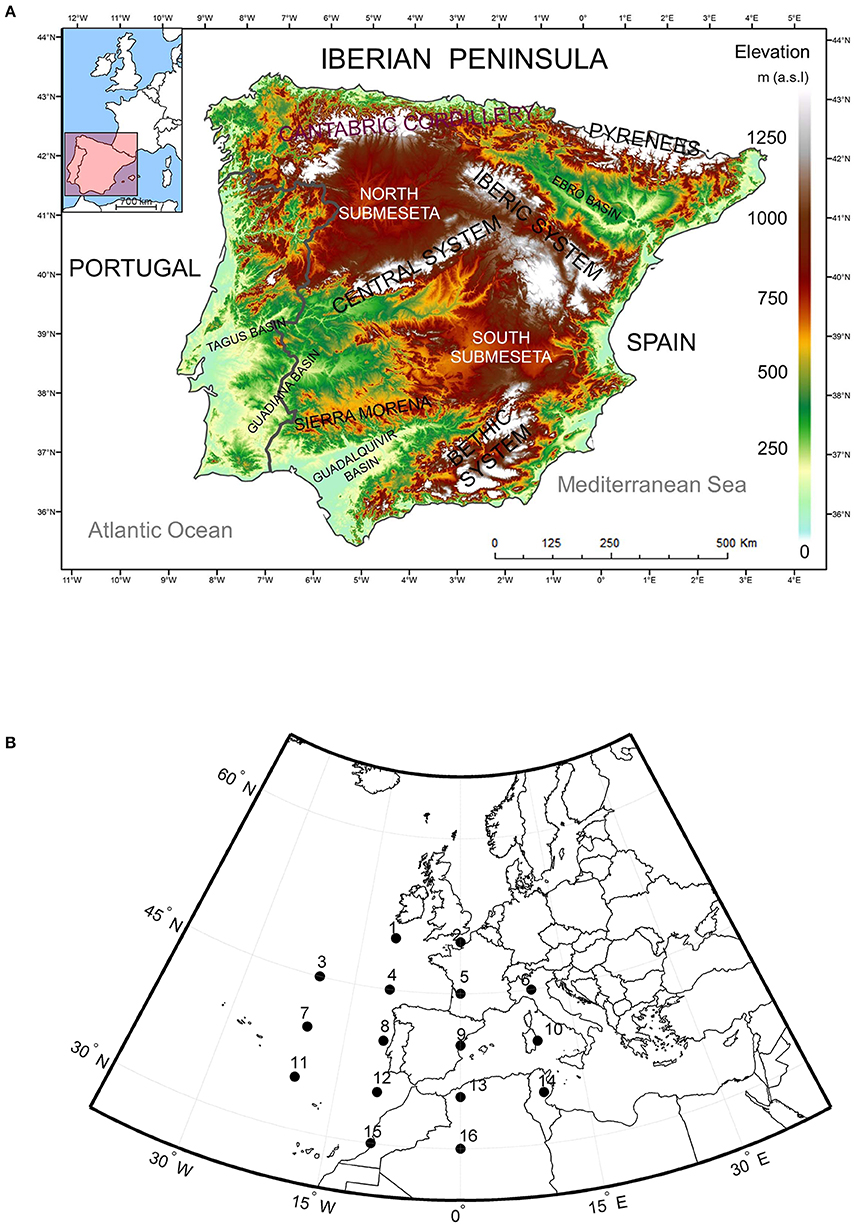
Figure 1. (A) Main Mountain Ranges and Depressions of the Iberian Peninsula and (B) 16 SLP grid points used in the WTs computation.
The aforementioned variability introduces difficulties when modeling IP precipitation regimes particularly within the scope of generation of climate change scenarios. Thus, downscaling of precipitation over a limited region is often attempted through the identification of the dynamical-statistical links between local precipitation features and large scale atmospheric circulation patterns (e.g., Quadrelli et al., 2001; Trigo and Palutikof, 2001; Ramos et al., 2010).
There are several previous examples of atmospheric circulation approach and precipitation analyses around the Mediterranean basin. Kostopoulou and Jones (2007a,b) developed a classification of circulation types for the Eastern Mediterranean and established links with temperature and precipitation. In Greece, Michailidou et al. (2009) presented a method for grouping weather types (WTs) restricted to the cold and wet sub-period of the year. In Israel, Saaroni et al. (2010) analyzed the relationship between the low of Cyprus and precipitation during wet period (November March). In Italy, Tartaglione et al. (2009) analyzed intense precipitation events covering the period from 1951 to 2000, comparing the resemblance between two states of the atmosphere leading to the same outcome. In the boundary region of the Swiss Alps, Hanggi et al. (2011) analyzed how changes in WTs were related to precipitation trends.
Likewise, there have also been developed downscaling approaches linking the large scale atmospheric circulation and the precipitation over the IP. The first objective classifications of the atmospheric circulation were developed in the 1990s (e.g., Zorita et al., 1992; Zhang et al., 1997; Romero et al., 1999; Santos et al., 2005). At the same time a number of researchers was also interested in adopting a different approach, using slightly different versions of the automated version of the Lamb WTs (e.g., Goodess and Palutikof, 1998; Spellman, 2000; Trigo and DaCamara, 2000; Goodess and Jones, 2002).
Queralt et al. (2009) presents an analysis of winter intensity and frequency of precipitation based on 102 daily precipitation stations over Spain which have been merged in eight different regions. It was shown the complex regional relationship between the most important large-scale atmospheric pattern, the North Atlantic Oscillation (NAO) and precipitation which was also revealed through the modulation of the NAO in the preferred WTs associated to precipitation in each region. Casado et al. (2010) using a grid of 203 points, described the variability of winter precipitation over different climatic regions of Spain for the period 1961–1990 using different WTs classification. In the Ebro basin (northeast inland of IP), Vicente-Serrano and Lopez-Moreno (2006) analyzed WTs and drought in winter period during 1952–1999; they found a high spatial variability, and identified different sectors and WTs related to intensification of droughts. All of the above mentioned works deal with datasets characterized in general by a low station density for the vast area (circa 500,000 km2) of IP, but also the use of different periods, and the tendency to restrict the analysis to wet winter season. In this regard, the accuracy of spatial detail is quite low and information for not-winter months is scarce. As a consequence, the spatial and temporal variability of precipitation in the IP is not entirely captured and transitional areas, relief barrier effects, altitudinal effect and subregional details, between other research targets, are not well known. Last but not least, an extended area of IP registers its maximum precipitation in transitional seasons, i.e., in spring or autumn (de Luis et al., 2010) being information about such periods virtually absent in many cases.
This limitation prompted the authors to use a much denser dataset with ~3000 stations for all Iberia (Cortesi et al., 2013a,b) to model the monthly relationship between WTs and precipitation following the approach of Trigo and DaCamara (2000). In that work a large number of regression models were developed at the monthly scale (one per station, about 3000 stations). Such a vast amount of long-term (1948–2003) time series was obtained after merging the dense network of monthly precipitation series from MOPREDAS database (MOnthly PREcipitation DAtabase of Spain) for Spanish land (Gonzalez-Hidalgo et al., 2011) and a Portuguese database from INAG—Instituto da Água (Servicio Nacional de Informaçao de Recurcos Hídricos) (Lorenzo-Lacruz et al., 2011). According to this high density analysis it was found that precipitation depends on higher number of WTs to the west than to the East and in general better prediction is expected to the west.
However, despite the massive number of stations employed in Cortesi et al. (2013a,b) it became apparent that modeling monthly precipitation based on monthly frequency of WTs implied major disadvantages. The main caveat is related with the unavoidable large estimation errors due to the limited number of predictors, but also as a consequence of multicollinearity and heteroscedasticity that hamper the overall quality of attained models (Wilks, 2006). Another serious limitation found was a positive (negative) bias for the wet (dry) WTs, overestimating the contribution for the WTs selected as predictors and underestimating it for the WTs not selected by the regression model. Therefore, the use of a daily dataset, even with a smaller total number of stations, could represent an advantage to the analysis. This goal has become feasible only recently due to the merging of Spanish (Herrera et al., 2012) and Portuguese (Belo-Pereira et al., 2011), into the high density daily gridded precipitation data set “Iberia02.”
To a certain extent, this work provides the extension of the previous studies by the authors Cortesi et al. (2013a,b), with several major changes; on the one hand, unlike the monthly regression model widely used in Cortesi et al. (2013a), the analysis in this work was performed using the daily gridded “Iberia02” precipitation dataset. The use of a daily dataset holds the obvious advantage of measuring the daily rainfall amount due to each WT directly instead to relying on the predicted values of the regression model as done by the authors in their previous works. On the other hand, the use of daily data allows the study of several precipitation intensity related indices that are highly informative and impossible to measure directly with monthly data, including the mean precipitation of each WT and its relative Precipitation Contribution, Precipitation Intensity, and Efficiency. Thus, the broad objective of this work is to analyze at the higher possible spatial and temporal detail the role played by each individual WT at the daily scale and how they determine the Iberian precipitation regime. To the best of our knowledge no previous work has defined these daily WTs characteristics with so many stations covering the entire IP.
Database and Methods
Precipitation Database
As previously mentioned, the current work relies on the use of the new daily gridded precipitation database “Iberia02,” which spans the period 1950–2003 with a resolution of 0.2° (~16 × 22 km at latitude 40°), for a total of 1673 pixels. It is based on a dense network of rain gauges, combining two national data sets, “Spain02” for peninsular Spain and Balearic islands (Herrera et al., 2012), and “PT02” for mainland Portugal (Belo-Pereira et al., 2011), with a total of more than 2000 station over Spain and four hundred stations over Portugal, all quality-controlled and homogenized. Although the actual number of stations in any given year varies substantially due to variable availability of stations. Specifically, Spain02 is based on 2756 stations with at least 20 years of data and was interpolated by an indicator Kriging (to select pixel with rainfall) followed by an ordinary Kriging. The Portuguese dataset is based on a total of 806 station, most of which (726) have at least 10 years of data. Although several interpolation methods were tested to build the Portuguese gridded dataset (Belo-Pereira et al., 2011), the final choice was the same ordinary Kriging employed for the Spanish data (Herrera et al., 2012).
Although Iberia02 results from a combination of two different data sets, albeit with a common grid, there is no evidence of artificial features at the border between Spain and Portugal, neither at the monthly scale nor at daily scale (Belo-Pereira et al., 2011). The most important difference between Spain02 and PT02 is in the start of the daily accumulation period: daily precipitation records obtained in Portugal for any given day n correspond to the precipitation registered between 0900 UTC of day n − 1 and 0900 UTC of day n. On the other hand, Spanish rainfall records for the same day n correspond to the precipitation registered between 0700 UTC of day n and 0700 UTC of day n + 1 (notice the difference in both the hours and the days). Thus, in order to derive the most consistent common data set, the Portuguese daily precipitation database was shifted by 1 day, reducing the temporal difference between the two database from 22 h to only 2 h. The Spain02 has been recently used by the authors to rank precipitation events in the IP and several major river basins (Ramos et al., 2014).
Weather Types Classification
In this study we applied the WT classification methodology adopted by Trigo and DaCamara (2000) for Portugal and that takes into account physical and geometrical considerations, i.e., the direction and strength of airflow, the direction and vorticity of geostrophic flow, and the signal and intensity of cyclonicity. This approach is based on the corresponding objective classification defined for the British Isles (Jenkinson and Collison, 1977; Jones et al., 1993).
To determine the daily WTs for period 1950–2003, a set of 16 points (Figure 1B—p1 to p16) centered in IP was used to extract daily SLP series from EMULATE Mean Sea Level Pressure dataset (EMSLP), compiled by Ansell et al. (2006) with a resolution of 5° latitude by 5° longitude. Compared with Trigo and DaCamara (2000), these points were shifted 5° eastwards in order to center the entire grid in the middle of the IP. The indices used to compute the WTs by means of the 16 daily SLP points were the following: southerly flow (SF), westerly flow (WF), total flow (F), southerly shear vorticity (ZS), westerly shear vorticity (ZW), and total shear vorticity (Z):
The conditions established to define different types of circulation are the same as in Trigo and DaCamara (2000), and thus the same set of rules were adopted:
(a) Direction of flow was given by tan−1(WF/SF), 180° being added if WF was positive. The appropriate direction was computed using an eight-point compass, allowing 45° per sector.
(b) If |Z| < F, the flow is essentially straight and was considered to be of a pure directional type (eight different cases, according to the directions of the compass).
(c) If |Z| > 2F, the pattern was considered to be of a pure cyclonic type if Z > 0, or of a pure anticyclonic type if Z < 0.
(d) If F < |Z| < 2F, the flow was considered to be of a hybrid type and was therefore characterized by both direction and circulation (8 × 2 different types).
Taking into account this set of rules, a total of 26 WTs were defined, 10 pure types (Figure 2: NE, E, SE, S, SW, W, NW, N, C, and A), and 16 hybrid types (8 for each C or A hybrid). The 8 pure types associated to a specific wind direction are called Directional types. We disseminated the fairly few cases (<1%) with possibly unclassified situations among the 26 classes.
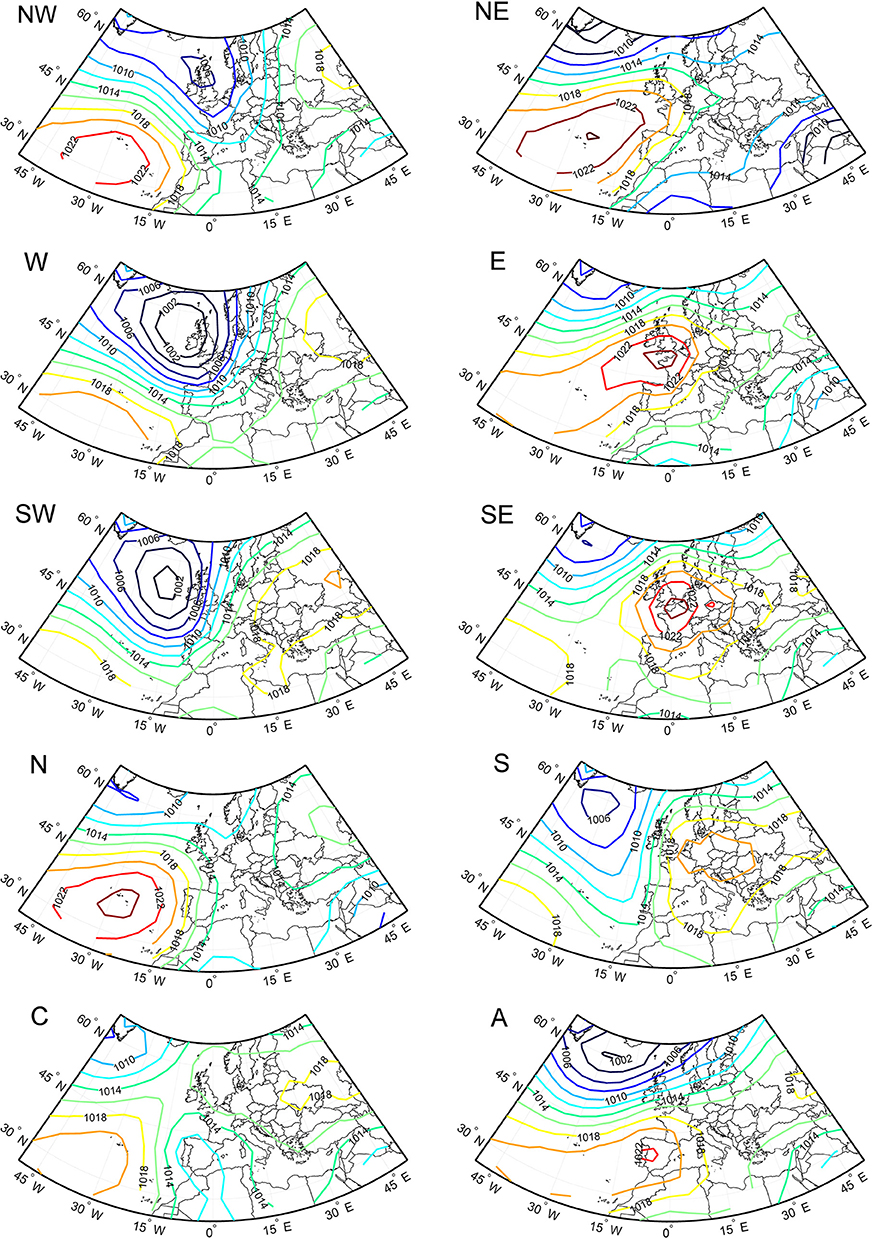
Figure 2. Mean SLP field configuration of the 10 pure WTs for period 1950–2003. The contour interval is 2 hPa.
Precipitation Indices
To study the relationship between daily precipitation and WTs, six mean monthly indices were analyzed: the WTs Frequency, Mean Precipitation, Percentage Contribution, Intensity, Efficiency, and Area of Influence. All these indexes (except the WTs Frequency) are first calculated for each individual pixel of the precipitation grid, and then are averaged over the 1673 Iberian pixel (including Balearic Islands).
The shift from monthly to daily precipitation allows to compute new rainfall indexes such as the Mean Precipitation of each WT, the Precipitation Intensity and Efficiency that were not studied in the previous work (Cortesi et al., 2013b). In that work a large number of regression models were developed at the monthly scale for each station; however, such approach presents serious limitations, for example the systematical overestimation of precipitation assigned to the WTs that were selected as predictors by the stepwise regression model and vice versa, the wrong attribution of no rainfall amount to the WTs that were not selected as predictors. In order to avoid any misleading interpretation of the results obtained we would like to provide a brief description of all the precipitation indices used:
• The Mean Precipitation of each WT is the simple sum of the rainfall amount during the days affected by that specific WT throughout all the years of the study period (1950–2003) at monthly level, divided by the total number of years (i.e., the monthly climatology of the WT in mm):
• The Percentage Contribution of each WT is equal to the Mean Precipitation of that WT divided by the mean monthly total precipitation during the same period:
• The Precipitation Intensity for a given WT is defined as the sum of the daily precipitation due to the WT during the period 1950–2003 at monthly level, divided by the total number of days that belong to the same WT and period (including dry days):
• WT monthly Precipitation Efficiency is a percentage defined as the ratio between the number of wet days (≥1 mm.) affected by the WT for all the same months during the whole period 1950–2003 and the total number of days affected by the WT in all months of the same period. Thus, it measures the daily rainfall probability (%) of the WT:
• The Area of Influence of each WT is the ratio between the number of grid pixel with Mean Precipitation of 1 mm. or greater and the total number of IP pixel. As such, it measures the % of the IP land surface where a WT has at least a small influence (1 mm) on precipitation:
The Mean Precipitation, Percentage Contribution, and the Precipitation Intensity were first introduced by Trigo and DaCamara (2000) and where also measured by Fernández-González et al. (2012), who in the same paper presented the Precipitation Efficiency index for the key series of Leon (NW Spain). In particular the Area of Influence index, to the best of our knowledge, was never presented before in literature.
WT Frequency and Overall Contribution to Precipitation
WT Frequency
A crucial characteristic to determine the role played by the WTs on the monthly precipitation regime is provided by how often they occur, i.e. by their frequency. The monthly frequency of WTs, expressed in % of days per month, is shown in Table 2. It is immediately noticeable that no WT occurs more than 30% of days for a given month.
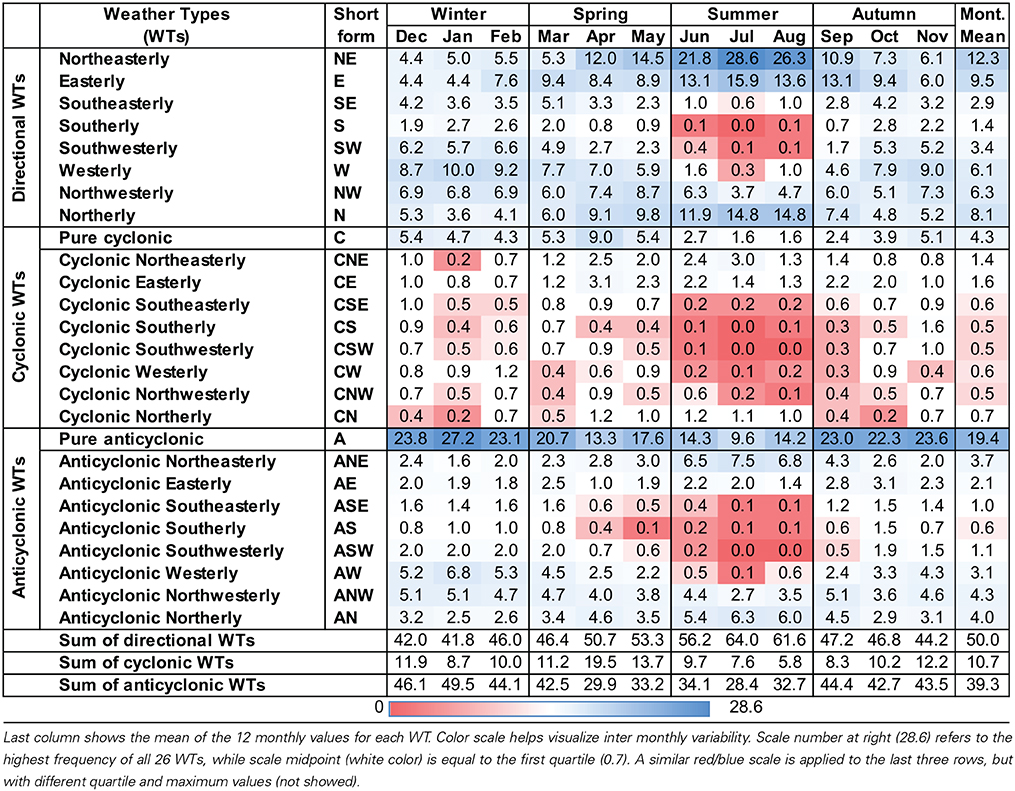
Table 2. WTs mean monthly frequency (in %) from 1950 to 2003, starting from December.
The pure A type is the most frequent WT from September to May (maximum of 27.2% in January); in June it is replaced by the NE as the most frequent WT during the three summer months (maximum of 28.6% in July). If we are interested in the top three WTs throughout the year than A, W, and SW are more frequent during winter, while NE, N, and E during summer. On the other hand C, SE, and NW present higher frequencies during spring and S during autumn. Hybrid Anticyclonic WTs globally dominate in winter, with a global overall maximum of 49.5% in January and a minimum of 28.4% in July. Hybrid Cyclonic WTs are the less frequent, with a combined maximum of 19.5% in April and a minimum of 5.8% in August, but individually are often below 0.5%, suggesting that these classes represent much less common atmospheric configurations. Some of these WTs classes show a maximum of occurrence in spring, or a bimodal annual cycle with maximum in spring and autumn. Overall, it is interesting to note from Table 2 that the mean annual frequencies of the Directional, Cyclonic, and Anticyclonic WTs are roughly 50, 10, and 40%, respectively. These results are similar with those described in Cortesi et al. (2013b), in which the same reanalysis dataset EMSLP was employed, but during a slightly different period (1948–2003 instead of 1950–2003). In addition, new information regarding the monthly means and the WTs sub-totals are grouped into seasons.
Percentage Contribution
Previous works with just a few stations have shown that a relatively small number of WTs are responsible for the bulk of the precipitation over western Iberia (Trigo and DaCamara, 2000) or southern Spain (Goodess and Palutikof, 1998) of northwestern Galicia (Lorenzo et al., 2008). Here we intend to evaluate this dependence using a much larger precipitation dataset and using the spatial averaged values over the entire IP. Thus, the monthly sequence of the seven “wettest” WTs for each month is presented in Figure 3 and Table 3. A simple glance to this figure shows that roughly 20% of total monthly Iberian precipitation depends from a single WT in autumn and winter months (W), and around 50% only from three WTs (W+C+SW). However, these three WTs have a combined frequency of occurrence of about 15%, i.e., confirming that a small number of WTs indeed captures a high percentage of monthly precipitation variability. If one considers all the months of the year then seven non-hybrid WTs generate almost 70% of total monthly Iberian precipitation: W (14.7%), C (12.4%), NE (11.4%), SW (8.8%), NW (8.4%), N (7.7%), and E (6.2%).

Figure 3. Percentage Contribution of the seven “wettest” WTs to total monthly Iberian precipitation (1950–2003). Highest WT contributors are placed at bottom and the lowest at the top. At monthly level, the type and the order of the seven wettest WTs varies, but considering also repeated WTs, the total number of WTs is 13. Red line shows the Mean Precipitation in mm.
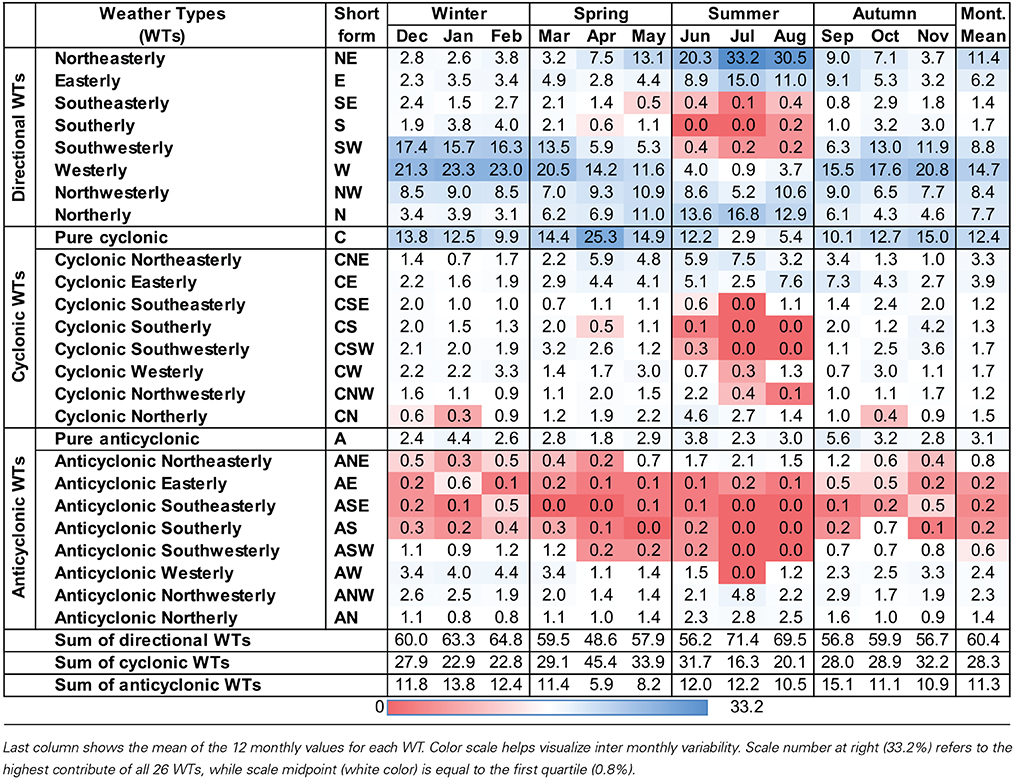
Table 3. Percentage Contribution of each WT to total monthly Iberian precipitation.
The type and order of the seven wettest WTs varies substantially throughout the year. The W type is the highest contributor, from September to March generating about 20% (maximum of 23.3% in January) of monthly rainfall amount, and at the same time during these months its contribution is the highest between all the 26 WTs. During the transitional months of April and May the C type replaces the W type as main contributor (especially in April, when the % difference between C and W is of 11%) and also affects considerably all not-summer months (contribution >10% during September–June), always positioning in the top three contributors position with the exception between July and August. During the three summer months, W and SW lose importance in favor of NE and N types; however, it must be stressed that despite their high percentage it accounts for only a few mm of precipitation due to the small total Iberian Precipitation in summer (red line in Figure 3). September is another transitional month during which the W type returns as the main WT contributor through the subsequent autumn and winter months up to March (included). The fourth WT with the largest contribution is the SW type; its contribution is particularly large during the extended winter half of the year, i.e., from October to March, being responsible of more than >13% of monthly precipitation, with a peak of 17.4% in December. Despite never reaching the rank of most important WT contributor, it plays a major role as along with W and C, with the “C-W-SW wet triplet” being responsible for about 50% of total rainfall from October to March. The overall contribution of NW type is quite constant in time, as it always appears in the fourth or fifth rank (third in April), followed by the N type, which has a temporal pattern similar to the NE type, both with a summer maximum. The only Anticyclonic WT observed is the pure A type in fifth position in February. Its frequency is the highest between all WTs (almost 1 day of 5), but its mean monthly Percentage Contribution is quite small compared to its frequency: only 3.1%. It is worth to notice that the S and SE Directional WTs never appear in the sequence of the seven wettest WTs. Thus, from the eight original Directional WTs, only six of them contribute significantly to Iberian precipitation.
The Percentage Contribution index attributes equal weight to each month, including summer months which have only a fraction of the winter precipitation; if we consider instead the seven wettest WTs for the Mean Precipitation index (not shown), than the importance of NE diminishes, shifting from third to fifth position in the wettest WTs sequence, and there are other minor changes in the order of the sequence.
We acknowledge that some of the results presented in this section do not differ substantially from those obtained previously for IP using precipitation at the monthly scale (e.g., Paredes et al., 2006; Cortesi et al., 2013a,b). Nevertheless, the use of a daily dataset ensures considerably more reliable values of individual WTs Percentage Contribution. This better assessment results from the strong caveats associated with the monthly model precipitation methodology, based on monthly frequency of WTs. In fact, the modeling approach presents misleading results for the less frequent WTs, implying positive (negative) bias for the wet (dry) WTs. These biases are responsible that the apparent negligible contribution from the drier WTs and exaggerated contribution associated to wetter WTs (compare Table 2 from Cortesi et al., 2013b with present work Table 3).
Additional analysis on the role of different WTs can be obtained clustering them according to their primary characteristic (Figure 4), i.e., dominated by the geostrophic flow (Directional types) or dominated by the geostrophic vorticity (Cyclonic and Anticyclonic broad classes). If one considers again the entire IP then the total annual precipitation depends more than 60% from Directional types, almost 30% from Cyclonic WTs and a little more than 10% from Anticyclonic WTs. This is particularly interesting if compared with the average monthly WTs frequencies from Table 2, which are about 50, 10, and 40%, respectively. Thus, Cyclonic WTs have a small occurrence (10.7%), but are responsible of almost 30% of overall precipitation, three times their frequency, while Anticyclonic WTs are frequent (39.3%), but contribute only to 11.3% of monthly rainfall, almost four times less than their frequency. This imbalance between WT frequency and Percentage Contribution is expressed by the Precipitation Efficiency that is considerably higher for the Cyclonic types (40.6%) and low for Anticyclonic ones (9.9%) as shown in Figure 4.
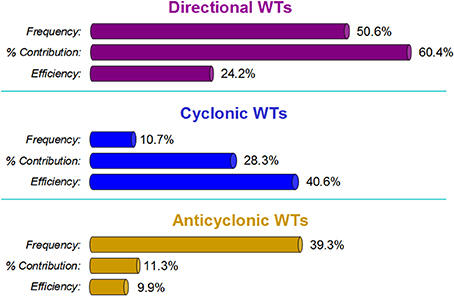
Figure 4. Monthly mean of WT Frequency, Percentage Contribution, and Precipitation Efficiency for the three main WT classes: Directional (N, NE, E, SE, S, SW, W, NW), Cyclonic (C, CN, CNE, CE, CSE, CS, CSW, CW, CNW), and Anticyclonic (A, AN, ANE, AE, ASE, AS, ASW, AW and ANW).
Spatial Analysis
The effects of each WT on the precipitation regime of the IP are related to all the indices mentioned in the Methods Section, i.e., its temporal Frequency (Table 2), Mean Precipitation (Table 3), Percentage Contribution (Table S1), total Area affected (Table S2), Precipitation Intensity (Table S3), and Efficiency (Table S4). This preliminary analysis conducted in the previous section and also in the above mentioned Tables is based only on precipitation averaged over the entire IP. Naturally, results will vary considerably if one looks into the individual behavior of each single grid cell or pixel. Therefore, it is of paramount importance to analyze the spatial distribution of each index, focusing on one WT at a time.
The analysis of WTs that follows illustrates the spatial distribution of the effects on monthly precipitation relative to three of the seven most prominent (i.e., wettest) WTs, namely; the W, C, and NE (Figures 4–6) with the remaining WTs being showed in the Supplementary Material. Taking into account the strong seasonal cycle but also the impossibility of showing the results for all the months we have limited this analysis to the four representative months in the middle of each season: January for winter, April for spring, July for summer, and October for autumn. Each figure includes 16 different sub-plots of the area affected by the specific WT at the monthly scale relative to four indices; (1) Mean Precipitation, (2) Percentage Contribution, (3) Precipitation Intensity, and (4) Precipitation Efficiency. Note that the spatial distribution of the Mean Precipitation is always proportional to the Precipitation Intensity, only the magnitude is different (recall definitions in Section Precipitation Indices).
Westerly (W) Weather Type
The most prominent WT affecting IP precipitation at monthly level is W and the overall characterization is shown in Figure 5. The corresponding atmospheric circulation pattern consists of high pressure centered west of the Canary Islands and a low pressure system placed on average just west of Ireland (Figure 2). As a consequence, Atlantic westerly flows enter in the IP reaching the mountain arch and affecting the entire IP but particularly the north-western sector. This pattern affects substantially from September to March. Highest effects are noticed to the northwestern areas where more than 30% of January, February and March precipitation depends on this WT, even if its influence spreads even along the western part of the Pyrenees (Figure 1). There are two areas in which the effects of W type do not contribute notoriously to explain monthly precipitation: the Cantabric coastland to the north, and the Mediterranean fringe to the east, including the north-inland Ebro basin. Precipitation Intensity is highest in the northwestern areas (including most of Portugal) because of local orography. The same is true for Precipitation Efficiency, which reaches a maximum of almost 100% in the same areas and then decreases to almost 0% in a clear diagonal gradient from north-west to south-east.
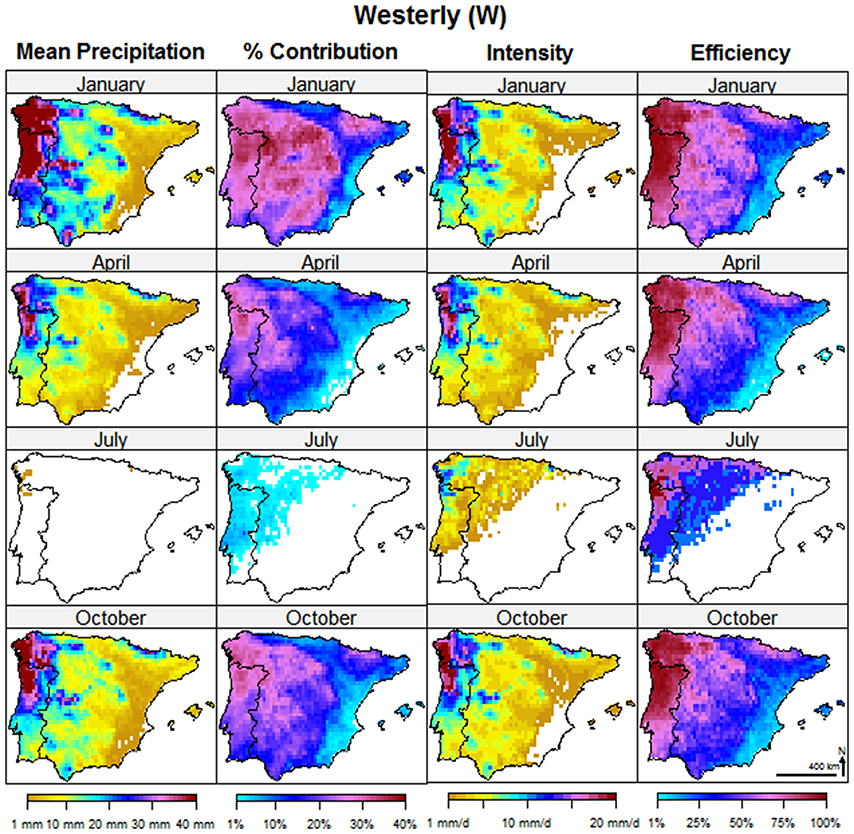
Figure 5. Westerly (W) composite maps for the Mean Precipitation, Percentage Contribution, Precipitation Intensity, and Efficiency. The 4 months in the middle of each season are representative of each season: January for winter, April for spring, July for summer, and October for autumn.
Pure Cyclonic (C) Weather Type
The spatial distribution and contribution to precipitation associated to the C type is shown in Figure 6. The corresponding composite SLP pattern (Figure 2) is dominated by a low pressure center over the IP. The spatial impact of this WT type is different from the W type described previously. Its maximum effects, in terms of contribution to monthly precipitation are clearly observed in spring season, but are also relevant during autumn and winter. The shape of the affected area of its Percentage Contribution has a diagonal orientation from north-east to south-west, i.e., relative precipitation in the northwest and southeast sectors of IP does not depend much on this WT, while the shape of the affected area of its Mean Precipitation gives more weight to the orography, particularly to the Central System and the Bethic System. Differently from the Percentage Contribution, the Precipitation Intensity is highest in autumn and winter, not in spring, because C frequency is smaller in the former season, while the Precipitation Efficiency is almost the same for both seasons, generally between 25 and 75%, and increasing from west to east, with a spatial variation inferior than the Westerly WT, which in the same month could range from 1 to 100% of Efficiency.
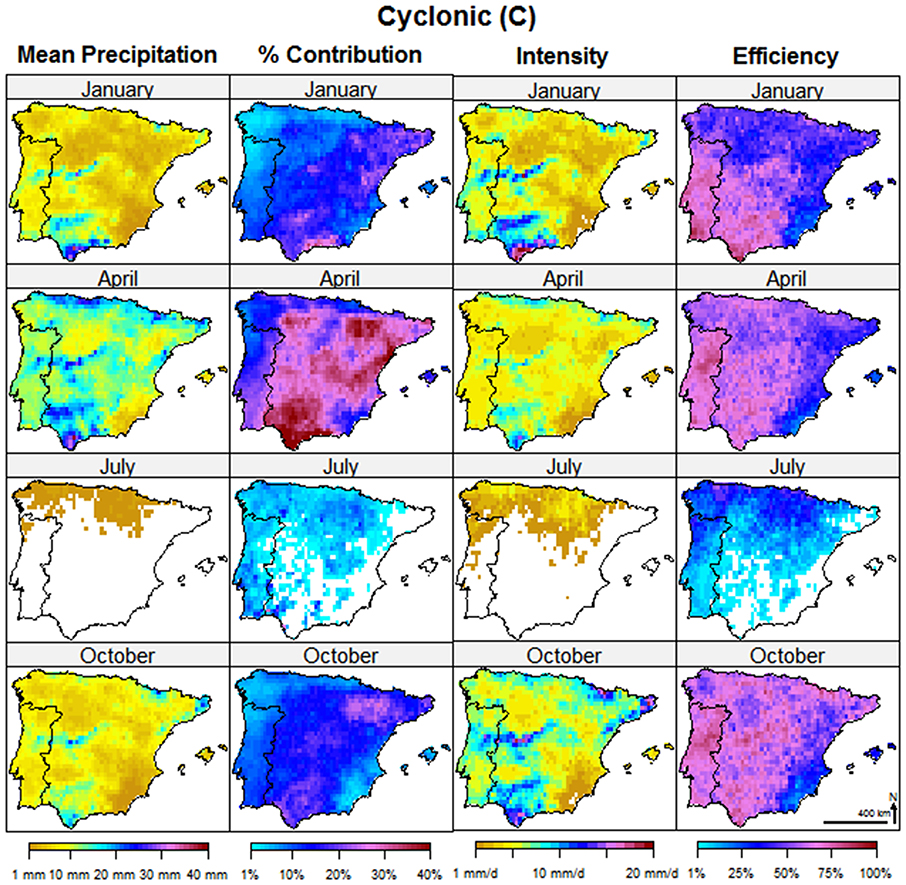
Figure 6. As Figure 5 but relative to the Cyclonic (C) class.
Northeasterly (NE) Weather Type
The NE type pattern consists of a high SLP center located to the north of Azores but extending further north and east than the average patterns for the N type (Figure 2). Its effects on IP precipitation are less extended than those described previously for the W and C types and with a different peak season (Figure 7). Thus, the Mean Precipitation and Area of Influence are lower throughout the year (Tables S1 and S2), and limited to some coastal areas to the east and north of IP. Only its Percentage Contribution is very high in summer, particularly in July and August, because in these months there are few WTs contributing to monthly rainfall. Thus, its Percentage Contribution can reach very high values (>40%), even if the Mean Precipitation is small or very small (<1–2 mm.). This is also due to the very high summer NE frequencies, that distributes the small NE rainfall amount in a large number of days, determining a very small summer Precipitation Intensity (<1 mm/day) and Efficiency (<25% for the majority of IP).
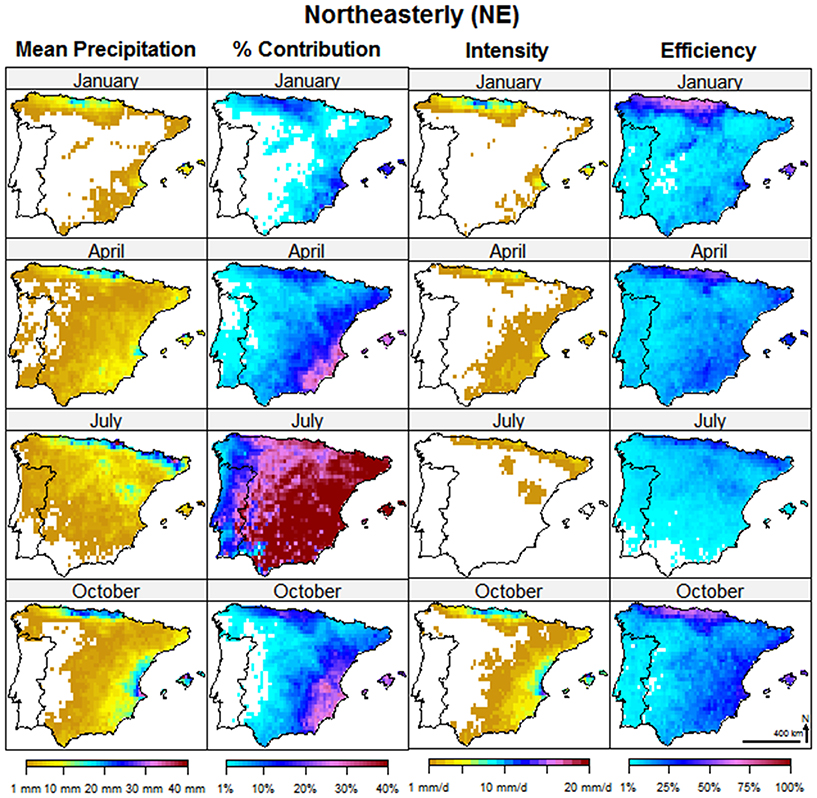
Figure 7. As Figure 5 but relative to the Northeasterly (NE) class.
Combined Analysis of Precipitation Indices
In this section we perform a combined analysis of the three most innovative precipitation indices (Precipitation Intensity, Precipitation Efficiency, and Area of Influence). In this way, we can identify visually in appropriate scatter-plots the nature of these relationships (e.g., linear vs. non-linear, level of dispersion, etc.) and also how such links vary with WTs. In these representations (Figures 8–10) each point represents a single WT during a specific month, therefore there is a total of 312 values (26 × 12 = 312 points).
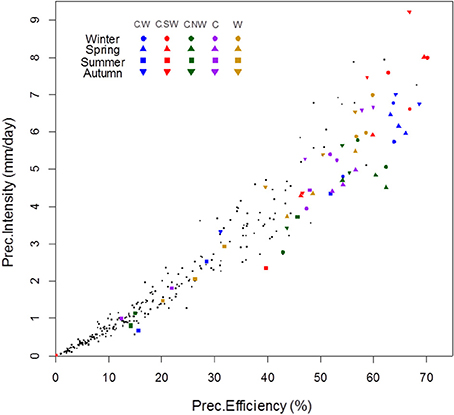
Figure 8. Scatter plot between the Precipitation Intensity and the Precipitation Efficiency. Each point represents a single WT during a specific month (total of 26 × 12 = 312 points). R2 of the linear fit is 0.94. The five WTs with the highest mean monthly Efficiency are highlighted in color, in order of decreasing Efficiency from left to right. For these five WTs, the three winter months (D-J-F) are shown as circles, the three spring months (M-A-M) as triangles, summer months (J-J-A) as squares, and autumn (S-O-N) as triangles pointing downward.
Precipitation Intensity vs. Precipitation Efficiency
Due to the similar definition of Precipitation Intensity and Precipitation Efficiency (see Section Precipitation Indices), which only differ in the numerator, these two indexes are highly correlated between them, as can be seen from their scatter plot in Figure 8. This fact explains the sequence of the five most intense WTs is very similar to the sequence of the five most efficient ones (from Figure 8: CW; CSW; CNW; C; W). Four of the five WTs with the highest Precipitation Efficiency are hybrid C types; the fifth is the W type. We should elucidate that these Cyclonic hybrid types tend to occur at much lower rates than most Directional or Anticyclonic types (Table 1), often less than 1%, and therefore contribute poorly to the total precipitation. Another interesting aspect results from the apparent existence of two regimes in Figure 8, with higher correlation values and lower dispersion at low intensity or efficiencies.
The global high Precipitation Intensity and Efficiency of pure Cyclonic type (C) is also extensive to all hybrid C types. The maximum value of Efficiency is 70.2%, reached by the CSW in January. Each WT presents a seasonal cycle that alternates between minimum Efficiency and Intensity values in summer months, and its maximum in one of the other seasons.
Percentage Contribution vs. Area of Influence
A different measure of the relevance of each WT on IP precipitation regime is given in Figure 9, where we present the scatter plot between the Area of Influence for each month and WT and its corresponding Percentage Contribution. The correlation is good but not as high as for the Precipitation Intensity and Efficiency (Figure 8) due to the non-linear nature of this relationship, especially for values with very high (>80%) Area of Influence.
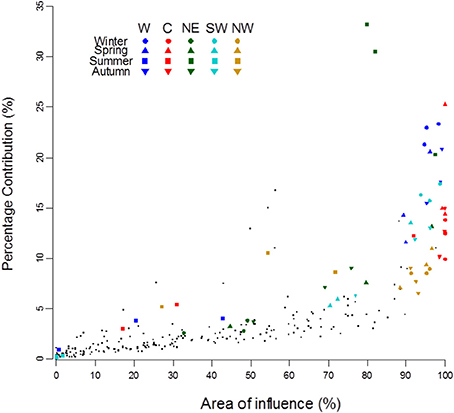
Figure 9. Scatter plot of the Percentage Contribution as a function of the Area of Influence. The five “wettest” WTs (W, C, NE, SW, and NW) are highlighted in color with a legend similar to Figure 8.
The only WT which almost completely affects the IP (>99.9%) is the C type from October to April; its Area of Influence is very high also during September, May, and June (>92%), and only in July and August falls below 31% (see Table S2). The second most widespread WT influential area is the NW, which spreads to over 90% of IP during all non-summer months and March, followed closely by the W, which covers more than 89% of IP during all not-summer months. These three WTs impinge their influence over extended areas of IP, while in general other WTs provide a more localized contribution over relatively narrow areas usually with a limited percentage of total monthly precipitation of IP, but locally being important.
The spatial extension of NE and N types is also important but lower than the three previous ones, in any case their global mean monthly extension is over 65% of IP, and during a few months their affected area is larger than 90% (May–June for NE, May for N, October to March for SW). Their seasonal cycle is similar to the most prominent WTs but often affecting considerably smaller areas than those three wet WTs.
It's important to stress that other WTs can affect extended areas but during shorter periods of the year. Among those that are relevant during the warm season we can find (see Table S1 of the Supplementary Material): E (May, June, and September), CNE (April), and CE (May); during autumn many WTs reach their maximum extension, between them 5 Cyclonic and 5 Anticyclonic types: the SE (October), CSE (October), CE (September), CSW (November), CW (October), CNW (November), A (September, with a secondary maximum in January), ANE (September), AS and AE (October), and lastly ASE (November). Even in winter season several extended WTs are visible, such as NW, S, CS, CSW, CNW, AW, ANW, ASW, even if the three last Anticyclonic WTs affect at their maximum less than 70% of IP. Only in spring the Area of Influence is minimum, and it is limited to only the CNE and CE types.
Percentage Contribution vs. Precipitation Intensity
As we have shown previously in Table 3 and Figures 2, 3, just a few “wet” WTs dominate the precipitation over large parts of IP particularly the W, C, SW, NE, and NW. The situation is more varied in case of the Precipitation Intensity. The scatter plot between the Percentage Contribution and the Precipitation Intensity is presented in Figure 10. The majority of WTs show low contributions (<3%), but have varying intensities, ranging from near 0 to 9.2 mm/day, typically lower for Anticyclonic types and higher for Cyclonic ones.
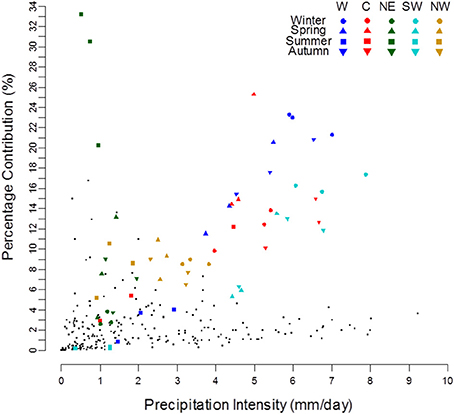
Figure 10. Similar to Figure 9 but for Percentage Contribution vs. Precipitation Intensity.
Precipitation Intensity of Cyclonic WTs is clearly higher than Directional or Anticyclonic types, as they produce more precipitation when they occur, even if their Percentage Contribution is inferior to the Directional types. For this reason, the C Type is found along the lower right tail of the distribution in Figure 10.
The five “wettest” WTs dominate the upper right part of the scatter plot with contribution >3%, always reaching their maximum Precipitation Intensity during autumn or winter, and then falling to a minimum of both Intensity and Contribution during summer (except NE, which in summer reaches the maximum Contribution). The same seasonal pattern is also observed for most other WTs, exceptions being CN during spring and CNE during summer (see Table S3 of the Supplementary Material). The three green squares in the upper left corner of Figure 10 refer to the high Contribution of NE type during summer, but its Intensity is low because in this period its Frequency is very high (≈25%).
Discussion and Conclusions
Climate variability at sub-regional scale is generally higher than on hemispheric or global scale (Giorgi, 2002). This is especially true for precipitation because its variability shows less spatial averaged predictability and higher temporal variability than any other climate element (Quadrelli et al., 2001; Xoplaki et al., 2004). It also reflects the fact that several different spatial scale processes from hemispheric to local convective, are in one way or another, related to precipitation. Thus, research on precipitation at sub-regional scales depends more than other climate elements on both, (1) the availability of spatially dense databases (Lana and Burgueño, 2000; Huntington, 2006; Trenberth et al., 2007), and (2) the length and completeness of the series (Llasat and Quintas, 2004; Xoplaki et al., 2004). We have applied this approach in the present study to analyze at the highest available spatial detail the relationship between WTs and daily monthly precipitation in the IP.
In a recent paper focused on WTs at general scale of the IP, Cortesi et al. (2013a) stated that the number of WTs that contribute to monthly precipitation decreases from western areas to eastern Mediterranean fringe. The authors concluded that the high variability of precipitation in the eastern areas is due to the dependence on a few number of WTs, while to the west the anomalous behavior of one or two WTs could affect the total amount to a lesser extent.
Some of the results presented in the present work are in accordance with those obtained previously by other researchers for IP using precipitation at the monthly scale (e.g., Paredes et al., 2006; Cortesi et al., 2013a,b). However, the use of a high resolution daily dataset implies much more robust results, in particular we have noticed that the monthly approach has serious limitations, namely positive (negative) bias for the wet (dry) WTs, quite often stating that the contribution from drier WTs is negligible or null while the contribution of wetter WTs is overestimated. For comparison see the large number of zero entrances in the individual WTs contribution in Table 2 (Cortesi et al., 2013b) that are not negligible at all in the corresponding analysis in the present work (Table 3). Additionally we have obtained finer spatial detail results of the WT impact in precipitation and novel results related with combined analysis of precipitation indices related to WTs.
Overall the main results can be summarized as follows:
1. Most of the precipitation is produced by just a few WTs that contribute to a large percentage of the monthly precipitation in most areas of IP; however, their Efficiency varies substantially, being the most efficient WTs the Cyclonic cluster types throughout the year, and the Directional (those with a western component) being also efficient precipitation generators in winter months.
2. The WTs that dominate the precipitation during winter months (D-J-F) in central, western and southwestern areas of IP are pure C, and Directional W and SW. These three WTs have a combined frequency of occurrence of about 15%, but are responsible for up to 50% of the precipitation in winter. This confirms that a small number of WTs indeed captures a high percentage of monthly precipitation variability (Trigo and DaCamara, 2000; Paredes et al., 2006) In the Mediterranean coastland the winter precipitation is linked mostly with easterly flows, noticed by Queralt et al. (2009) and Muñoz-Diaz and Rodrigo (2006).
3. Summer monthly precipitation is usually associated to Northerly or Easterly flows in the IP as suggested by Lorenzo et al. (2011) in northwest areas, or by Muñoz-Diaz and Rodrigo (2006) for the whole IP. During summer months the analyses show that different WTs effects are restricted to relatively narrow areas and during short temporal intervals (one or two months), suggesting that local factors such as relief and deep convection processes could play a major role in precipitation spatial variability.
4. Monthly precipitation during spring and autumn depends mainly from two WTs, namely W and C. We did not observe a clear distinction at IP scale previously noticed between these two seasons as suggested by Lorenzo et al. (2011), Muñoz-Diaz and Rodrigo (2006).
5. Three contrasted areas accordingly WTs can be delimited:
5.1. Northern Cantabrian coastland, from the sea line to the mountain line, extended from west to the east, where precipitation depends particularly on N and NW.
5.2. Central-southwest, depending on W, SW, and C, extend from western coastland to the inland mountain line.
5.3. Mediterranean coastland and Ebro basin, delimited by the Iberian System and Bethic System mountain chain (to the west), the Pyrenees (to the north), and the sea line (to the east). In this area monthly precipitation depends on a variety of WTs, and their effects are confined to very small areas.
6. The geographical disposition of the main mountain chains in the IP, i.e., from west to the east, has been attributed as one of the main factor that promotes the spatial distribution of precipitation and their trends (Gonzalez-Hidalgo et al., 2011), and here we have shown that also they contribute to establish a very well delimited areas accordingly to specific WTs effects.
7. The most efficient WTs corresponds to the CW; CSW; CNW; C; W. However, these Cyclonic hybrid types tend to have low occurrence monthly rates and therefore do not contribute significantly to the total precipitation.
8. The spatial influence of the five “wettest” WTs (W, C, NE, SW, and NW) is particularly large. For the C type, the area of influence is almost 100% of the IP during the extended inter months and decreases for the other months of the year. In addition, the other four WTs impinge their influence over extended areas of IP, while in general the remaining WTs provide a more localized contribution over relatively narrow areas.
All of these aspects are crucial to understand the recent behavior of precipitation in the IP, and form the basis for detailed downscaling analyses for future projections. Finally, this study shows that WTs approach is able to explain at high spatial detail a very high proportion of monthly precipitation variability, and can be a useful argument for precipitation analyses at high resolution in future projections. The results cover also the spring and autumn season less studied until now, and offer information about both seasons in which, for extended areas of IP, the maximum of precipitation are produced (de Luis et al., 2010).
Conflict of Interest Statement
The authors declare that the research was conducted in the absence of any commercial or financial relationships that could be construed as a potential conflict of interest.
Acknowledgments
This work was supported by the Portuguese Foundation for Science and Technology (FCT) through project PTDC/GEO-MET/3476/2012—Predictability assessment and hybridization of seasonal drought forecasts in Western Europe (PHDROUGHT). Alexandre M. Ramos was also supported by FCT through grant FCT/DFRH/SFRH/BPD/84328/2012. The authors would like to thank Dr. Jose Carlos Gonzalez-Hidalgo for providing useful suggestions and stimulating discussions about this work.
Supplementary Material
The Supplementary Material for this article can be found online at: http://www.frontiersin.org/journal/10.3389/feart.2014.00025/abstract
References
Ansell, T., Jones, P. D., Allan, R. J., Lister, D., Parker, D. E., Brunet-India, M., et al. (2006). Daily mean sea level pressure reconstructions for the European – North Atlantic region for the period 1850–2003. J. Clim. 19, 2717–2742. doi: 10.1175/JCLI3775.1
Belo-Pereira, M., Dutra, E., and Viterbo, P. (2011). Evaluation of global precipitation data sets over the Iberian Peninsula. J. Geophys. Res. 116, 148–227. doi: 10.1029/2010JD015481
Casado, M. J., Pastor, M. A., and Doblas-Reyes, F. J. (2010). Links between circulation types and precipitation over Spain. Phys. Chem. Earth 35, 437–447. doi: 10.1016/j.pce.2009.12.007
Corte-Real, J., Zhang, X., and Wang, X. (1995). Downscaling GCM information to regional scales: a non-parametric multivariate approach. Clim. Dyn. 11, 413–424.
Cortesi, N., Gonzalez-Hidalgo, J. C., Trigo, R. M., and Ramos, A. M. (2013b). Weather types and spatial variability of precipitation in the Iberian Peninsula. Int. J. Clim. 34, 2661–2677. doi: 10.1002/joc.3866
Cortesi, N., Trigo, R. M., Gonzalez-Hidalgo, J. C., and Ramos, A. M. (2013a). Modelling monthly precipitation with circulation weather types for a dense network of stations over Iberia. Hydrol. Earth Syst. Sci. 17, 665–678. doi: 10.5194/hess-17-665-2013
de Luis, M., Brunetti, M., Gonzalez-Hidalgo, J. C., Longares, L. A., and Martin-Vide, J. (2010). Changes in seasonal precipitation in the Iberian Peninsula during 1946–2005. Global Planet. Change 74, 27–33. doi: 10.1016/j.gloplacha.2010.06.006
Dünkeloh, A., and Jacobeit, J. (2003). Circulation dynamics of Mediterranean precipitation variability 1948–1998. Int. J. Clim. 23, 1843–1866. doi: 10.1002/joc.973
Esteban-Parra, M., Rodrigo, F., and Castro, M. Y. (1998). Spatial and temporal patterns of precipitation in Spain for the period 1880–1992. Int. J. Clim. 18, 1557–1574.
Fernández-González, S., del Rio, S., Castro, A., Penas, A., Fernández-Raga, M., Calvo, A., et al. (2012). Connection between NAO, weather types and precipitation in León, Spain (1948–2008). Int. J. Clim. 32, 2181–2196. doi: 10.1002/joc.2431
Fernandez-Mills, G. F. (1995). Principal component analysis of precipitation and rainfall regionalization in Spain. Theor. Appl. Climatol. 50, 169–183.
Garcia, J. A., Serrano, A., and Gallego, M. D. (2002). A spectral analysis of Iberian Peninsula monthly rainfall. Theor. Appl. Climatol. 71, 77–95. doi: 10.1007/s704-002-8209-y
Gimeno, L., Nieto, R., Trigo, R. M., Vicente-Serrano, S. M., and Lopez-Moreno, J. I. (2010). Where does the Iberian Peninsula moisture come from? an answer based on a lagrangian approach. J. Hydrometeorol. 11, 421–436. doi: 10.1175/2009JHM1182.1
Giorgi, F. (2002). Variability and trends of subcontinental scale surface climate in the twentieth century. Part I: observatorios. Clim. Dyn. 18, 675–691. doi: 10.1007/s00382-001-0204-x
Gonzalez-Hidalgo, J. C., Brunetti, M., and de Luis, M. (2011). A new tool for monthly precipitation analysis in Spain: MOPREDAS database (Monthly precipitation trends December 1945–November 2005). Int. J. Clim. 31, 715–731. doi: 10.1002/joc.2115
Goodess, C. M., and Jones, P. D. (2002). Links between circulation and changes in the characteristics of Iberian rainfall. Int. J. Clim. 22, 1593–1615. doi: 10.1002/joc.810
Goodess, C. M., and Palutikof, J. P. (1998). Development of daily rainfall scenarios for southeast Spain using a circulation-type approach to downscaling. Int. J. Clim. 18, 1051–1083.
Hanggi, P., Jete, M., Kuttel, M., Wanner, H., and Weingartner, R. (2011). Weather type-related trend analysis of precipitation in Switzerland. Hydrol. Wasserbewirts. 55, 140–154.
Herrera, S., Gutiérrez, J. M., Ancell, R., Pons, M. R., Frías, M. D., and Fernández, J. (2012). Development and analysis of a 50-year high-resolution daily gridded precipitation dataset over Spain (Spain02). Int. J. Clim. 32, 74–85. doi: 10.1002/joc.2256
Huntington, T. G. (2006). Evidence for intensification of the global water cycle: review and synthesis. J. Hydrol. 319, 83–95. doi: 10.1016/j.jhydrol.2005.07.003
Jenkinson, A. F., and Collison, F. P. (1977). “An initial climatology of gales over the North Sea,” in Synoptic Climatology Branch Memorandum (Bracknell: Meteorological Office).
Jones, P. D., Hulme, M., and Briffa, K. R. (1993). A comparison of Lamb circulation types with an objective classification scheme. Int. J. Clim. 13, 655–663.
Kostopoulou, E., and Jones, P. D. (2007a). Comprehensive analysis of the climate variability in the eastern Mediterranean. Part I: map-pattern. Int.J. Clim. 27, 1189–1214. doi: 10.1002/joc.1467
Kostopoulou, E., and Jones, P. D. (2007b). Comprehensive analysis of the climate variability in the eastern Mediterranean. Part II: relationships between atmospheric circulation patterns and surface climatic elements. Int. J. Clim. 27, 1351–1371. doi: 10.1002/joc.1466
Kutiel, H., Maheras, P., and Guika, S. (1996). Circulation indices over the Mediterranean and Europe and their relationship with rainfall conditions across the Mediterranean. Theor. Appl. Climatol. 54, 125–138. doi: 10.1007/BF00865155
Lana, X., and Burgueño, A. (2000). Some statistical characteristics of monthly and annual pluviometric irregularity for the Spanish Mediterranean coast. Theor. Appl. Climatol. 65, 79–97. doi: 10.1007/s007040050006
Lionello, P., Gacic, M., Gomis, D., Garcia-Herrera, R., Giorgi, F., Planton, S., et al. (2012). Program focuses on climate of the Mediterranean region. EOS Trans. Am. Geophys. Union 93, 105–106. doi: 10.1029/2012EO100001
Llasat, M. C., and Quintas, L. (2004). Stationarity of monthly rainfall series since the middle of the XIXth century. Application to the case of Peninsular Spain. Nat. Hazards 31, 613–622. doi: 10.1023/B:NHAZ.0000024894.66869.46
Lorenzo, M. N., Ramos, A. M., Taboada, J., and Gimeno, L. (2011). Changes in present and future circulation types frequency in Northwest Iberian Peninsula. PLoS ONE 6:e16201. doi: 10.1371/journal.pone.0016201
Pubmed Abstract | Pubmed Full Text | CrossRef Full Text | Google Scholar
Lorenzo, M. N., Taboada, J. J., and Gimeno, L. (2008). Links between circulation weather types and teleconnection patterns and their influence on precipitatioon patterns in Galicia (NW Spain). Int. J. Clim. 28, 1493–1505. doi: 10.1002/joc.1646
Lorenzo-Lacruz, J., Vicente-Serrano, S. M., López-Moreno, J. I., Gonzalez-Hidalgo, J. C., and Morán-Tejeda, E. (2011). The response of Iberian rivers to the North Atlantic Oscillation. Hydrol. Earth Syst. Sci. 15, 2581–2597. doi: 10.5194/hess-15-2581-2011
Martin-Vide, J. (2004). Spatial distribution of a daily precipitation concentration index in peninsular Spain. Int. J. Clim. 24, 959–971. doi: 10.1002/joc.1030
Martin-Vide, J., and Gomez, L. (1999). Regionalization of peninsular Spain based on the length of dry spells. Int. J. Clim. 19, 537–555.
Martin-Vide, J., and Lopez-Bustins, J. A. (2006). The western Mediterranean oscillation and rainfall in the Iberian Peninsula. Int. J. Clim. 26, 1455–1475. doi: 10.1002/joc.1388
Michailidou, C., Maheras, P., Arseni-Papadimititriou, A. F., Kolyva-Machera, A., and Anagnostopoulou, C. (2009). A study of weather types at Athens and Thessaloniki and their relationship to circulation types for the cold-wet period, part I: two-step cluster analysis. Theor. Appl. Climatol. 97, 163–177. doi: 10.1007/s00704-008-0057-x
Morata, A., Martin, M. L., Luna, M. Y., and Valero, F. (2006). Self-similarity patterns of precipitation in the Iberian Peninsula. Theor. Appl. Climatol. 85, 41–59. doi: 10.1007/s00704-005-0175-7
Muñoz-Diaz, D., and Rodrigo, F. S. (2004). Spatio-temporal patterns of seasonal rainfall in Spain (1912–2000) using cluster and principal component analysis: comparison. Ann. Geophys. 22, 1435–1448. doi: 10.5194/angeo-22-1435-2004
Muñoz-Diaz, D., and Rodrigo, F. S. (2006). Seasonal rainfall variations in Spain (1912–2000) and the links to atmospheric circulation. Atmos. Res. 81, 94–110. doi: 10.1016/j.atmosres.2005.11.005
Paredes, D., Trigo, R. M., García-Herrera, R., and Trigo, I. F. (2006). Understanding precipitation changes in Iberia in early spring: weather typing and storm-tracking approaches. J. Hydrometeorol. 7, 101–113. doi: 10.1175/JHM472.1
Quadrelli, R., Pavan, V., and Molteni, F. (2001). Wintertime variability of Mediterranean precipitation and its links with large-scale circulation anomalies. Clim. Dyn. 17, 457–466. doi: 10.1007/s003820000121
Queralt, S., Hernandez, E., Barriopedro, D., Gallego, D., Ribera, P., and Casanova, C. (2009). North Atlantic Oscillation influence and weather types associated with Winter total and extreme precipitation events in Spain. Atmos. Res. 94, 675–683. doi: 10.1016/j.atmosres.2009.09.005
Ramos, A. M., Lorenzo, M. N., and Gimeno, L. (2010). Compatibility between modes of low-frequency variability and circulation types: a case study of the northwest Iberian Peninsula. J. Geophys. Res. Atmos. 115:D02113. doi: 10.1029/2009JD012194
Ramos, A. M., Trigo, R. M., and Liberato, M. L. R. (2014). A ranking of high-resolution daily precipitation extreme events for the Iberian Peninsula. Atmos. Sci. Lett. doi: 10.1002/asl2.507
Rodriguez-Puebla, C., Encinas, A. H., Nieto, S., and Garmenia, J. (1998). Spatial and temporal patterns of annual precipitation variability over the Iberian Peninsula. Int. J. Clim. 18, 299–316.
Romero, R., Ramis, C., and Guijarro, J. A. (1999). Daily rainfall patterns in the Spanish Mediterranean area: an objective classification. Int. J. Clim. 19, 95–112.
Saaroni, H., Halfon, N., and Ziv, B. (2010). Links between the rainfall regime in Israel and location and intensity of Cyprus lows. Int. J. Clim. 30, 1014–1025. doi: 10.1002/joc.1912
Santos, J. A., Corte-Real, J., and Leite, S. M. (2005). Weather regimes and their connections to the winter rainfall in Portugal. Int. J. Clim. 25, 33–50. doi: 10.1002/joc.1101
Serrano, A., Garcia, J. A., Mateos, V. L., Cancillo, M. L., and Garrido, J. (1999). Monthly modes of variation of precipitation over the Iberian peninsula. J. Clim. 12, 2894–2919.
Spellman, G. (2000). The use of an index-based regression model for precipitation analysis on the Iberian Peninsula. Theor. Appl. Climatol. 66, 229–239. doi: 10.1007/s007040070027
Tartaglione, N., Maugeri, M., Dalan, F., Brunetti, M., Nanni, T., and Speranza, A. (2009). Searching for resemblance between large-scale sea level pressure patterns leading to “intense” precipitation events over Italy. Theor. Appl. Climatol. 95, 183–196. doi: 10.1007/s00704-007-0374-5
Trenberth, K. E., Jones, P. D., Ambenje, P., Bojariu, R., Easterling, D., Klein Tank, A., et al. (2007). “Observations: surface and atmospheric climate change,” in Climate Change 2007: The Physical Science Basis. Contribution of Working Group I to the Fourth Assessment Report of the Intergovernmental Panel on Climate Change, eds S. Solomon, D. Qin, M. Manning, Z. Chen, M. Marquis, K. B. Averyt, M. Tignor and H. L. Miller (Cambridge; New York, NY: Cambridge University Press).
Trigo, R. M., and DaCamara, C. C. (2000). Circulation weather types and their impact on the precipitation regime in Portugal. Int. J. Clim. 20, 1559–1581. doi: 10.1002/1097-0088(20001115)20:13<1559::AID-JOC555>3.0.CO;2-5
Trigo, R. M., and Palutikof, J. P. (2001). Precipitation scenarios over Iberia: a comparison between direct GCM output and different downscaling techniques. Int. J. Clim. 14, 4422–4446. doi: 10.1175/1520-0442(2001)014<4422:PSOIAC>2.0.CO;2
Valero, F., Martín, M. L., Sotillo, M. G., Morata, A., and Luna, M. Y. (2009). Characterization of the autumn Iberian precipitation from long term datasets: comparison between observed and hindcasted data. Int. J. Clim. 29, 527–541. doi: 10.1002/joc.1726
Vicente-Serrano, S. M., and Lopez-Moreno, J. I. (2006). The influence of atmospheric circulation at different spatial scales on winter drought variability through a semi-arid climatic gradient in Northeast Spain. Int. J. Clim. 26, 1427–1453. doi: 10.1002/joc.1387
Wilks, D. S. (2006). Statistical Methods in the Atmospheric Sciences: An Introduction. International Geophysics. Series 59. St. Louis, MO: Academic Press.
Xoplaki, E., González-Rouco, F., Luterbacher, J., and Wanner, A. (2004). Wet season Mediterranean precipitation variability: influence of large scale dynamics and trends. Clim. Dyn. 23, 63–78. doi: 10.1007/s00382-004-0422-0
Zhang, X., Wang, X. L., and Corte-Real, J. (1997). On the relationships between daily circulation patterns and precipitation in Portugal. J. Geophys. Res. 102, 13495–13507.
Keywords: circulation weather types, daily gridded precipitation, Iberian Peninsula, spatial variability, seasonal variability
Citation: Ramos AM, Cortesi N and Trigo RM (2014) Circulation weather types and spatial variability of daily precipitation in the Iberian Peninsula. Front. Earth Sci. 2:25. doi: 10.3389/feart.2014.00025
Received: 15 July 2014; Paper pending published: 22 August 2014;
Accepted: 16 September 2014; Published online: 13 October 2014.
Edited by:
Raquel Nieto, University of Vigo, SpainReviewed by:
Ashok Kumar Jaswal, India Meteorological Department, IndiaThando Ndarana, South African Weather Service, South Africa
Michelle Simoes Reboita, Federal University of Itajubá, Brazil
Copyright © 2014 Ramos, Cortesi and Trigo. This is an open-access article distributed under the terms of the Creative Commons Attribution License (CC BY). The use, distribution or reproduction in other forums is permitted, provided the original author(s) or licensor are credited and that the original publication in this journal is cited, in accordance with accepted academic practice. No use, distribution or reproduction is permitted which does not comply with these terms.
*Correspondence: Alexandre M. Ramos, Faculdade de Ciências, Instituto Dom Luiz, Universidade de Lisboa, Campo Grande, Edf. C8, Piso 3, Sala 8.3.1, 1749-016 Lisboa, Portugal e-mail: amramos@fc.ul.pt