Broad distribution and high proportion of protein synthesis active marine bacteria revealed by click chemistry at the single cell level
 Ty J. Samo
 Steven Smriga
 Francesca Malfatti
 Byron P. Sherwood
 Farooq Azam
- Marine Biology Research Division, Scripps Institution of Oceanography, University of California, San Diego, La Jolla, CA, USA
Marine bacterial and archaeal communities control global biogeochemical cycles through nutrient acquisition processes that are ultimately dictated by the metabolic requirements of individual cells. Currently lacking, however, is a sensitive, quick, and quantitative measurement of activity in these single cells. We tested the applicability of copper (I)-catalyzed cycloaddition, or “click,” chemistry to observe and estimate single-cell protein synthesis activity in natural assemblages and isolates of heterotrophic marine bacteria. Incorporation rates of the non-canonical methionine bioortholog L-homopropargylglycine (HPG) were quantified within individual cells by measuring fluorescence of alkyne-conjugated Alexa Fluor®488 using epifluorescence microscopy. The method's high sensitivity, along with a conversion factor derived from two Alteromonas spp. isolates, revealed a broad range of cell-specific protein synthesis within natural microbial populations. Comparison with 35S-methionine microautoradiography showed that a large fraction of the natural marine bacterial assemblage (15–100%), previously considered inactive by autoradiography, were actively synthesizing protein. Data pooled from 21 samples showed that cell-specific activity scaled logarithmically with cell volume. Activity distributions of each sample were fit to power-law functions, providing an illustrative and quantitative comparison of assemblages that demonstrate individual protein synthesis rates were commonly partitioned between cells in low- and high-metabolic states in our samples. The HPG method offers a simple approach to link individual cell physiology to the ecology and biogeochemistry of bacterial (micro)environments in the ocean.
Introduction
The metabolism and growth responses of marine bacteria and archaea communities significantly affect global ocean ecology and biogeochemical cycles. Diverse microhabitats are an important component of microbial ecosystems, existing within an organic matter continuum typified by a variety and abundance of colloids, gels, and particles of varying chemical and physical attributes (Azam and Worden, 2004; Verdugo et al., 2004). Characterizing the adaptive responses, particularly growth, of individual bacteria and archaea (collectively here called “bacteria”) may assist in quantifying the microenvironmental regulation of microbial communities and constrain estimates of their biogeochemical effects. A quantitative individual cell approach should help test the significance of microscale heterogeneity for the maintenance of bacterial genomic and functional diversity in the ocean.
Previous studies have shown the existence of microscale variation in bacterial community composition and activity (Long and Azam, 2001b; Barbara and Mitchell, 2003; Seymour et al., 2005). The challenge now is to develop sensitive and quantitative methods for measuring individual cell activities within these microscale patches. Currently, individual cell growth is studied using a variety of approaches. This includes 3H-based microautoradiography (Fuhrman and Azam, 1982; Cottrell and Kirchman, 2004) and the use of a non-radioisotopic, fluorescence-based method detecting incorporation of the thymidine analog bromodeoxyuridine (BrdU) (Pernthaler et al., 2002; Hamasaki et al., 2004). Other studies have documented mRNA fluorescent in situ hybridization (mRNA FISH; Pernthaler and Amann, 2004) or single-cell analyses of activity using nano secondary ion mass spectrometry (nanoSIMS) to quantify metabolic fluxes of symbioses and inter-species interactions (Orphan et al., 2002; Foster et al., 2011; Musat et al., 2012). While microautoradiography has been used extensively, the use of radioisotopes can be problematic or even prohibited in many field settings. The BrdU method overcomes some of these challenges and has been applied to individual cell growth measurements (Tada et al., 2010; Galand et al., 2013). FISH methodologies are robust and focus on taxonomic and/or functional potential, but provide little in rate characterizations. Meanwhile, the high spatial resolution combined with sensitive quantification of incorporated, stable isotope-labeled compounds makes nanoSIMS the most sensitive technique for single cell taxonomic and metabolic quantification. But measurements are relatively low-throughput and dependent upon instrument availability.
Over the past several years, cell biology researchers have adopted the use of bioorthogonal amino acids (Dieterich et al., 2006; tom Dieck et al., 2012) coupled with copper catalyzed azide-alkyne cycloaddition chemistry (one type of many “click” methodologies) for proteomic and protein expression studies of mammalian cells in vivo (Best, 2009; below). Recently, a group has described a method using the azide-bearing methionine surrogate azidohomoalanine (AHA) on microbial assemblages to identify translationally active cells in combination with the taxonomic identity via FISH (Hatzenpichler et al., 2014). We have developed a separate method to measure protein synthesis rates in natural planktonic microbial assemblages using the alkyne-bearing methionine analog 2-Amino-5-hexynoic acid, commonly known as L-homopropargylglycine (HPG).
A significant technical advantage of click chemistry is use of a fluorophore bound to a small molecule, thus eliminating the need to permeabilize cells (as used in the BrdU method) and resulting in simple, rapid sample processing (Smriga et al., 2014). We found that the high sensitivity and low signal background of the HPG method allowed us to detect a broad spectrum of individual cell activity within natural marine assemblages. This new capability increases the capacity to directly address the long-standing question of what proportion of bacterial communities are active and their relative cell-specific activity, as well as estimated cell-specific growth rates. In this study, we describe the advantages and limitations of the method via comparisons with bulk radioisotope incorporation and microautoradiography. We then present a comprehensive set of experiments conducted in the laboratory and field that test the validity and limitations of bacterial protein synthesis rate measurements in both simple cultures and complex heterogeneous environmental samples.
Results
Adapting Click Chemistry for Marine Bacteria
Several important factors were identified and adopted into the HPG click chemistry protocol including: (i) immobilization of cells onto filter membranes rather than centrifugation; (ii) use of the filter-transfer-freeze technique to reduce background fluorescence; and (iii) use of glass coverslips during the click reaction to limit oxygen exposure and thereby maintain reduced conditions for conversion of copper (II) to copper (I) with subsequent bonding of the fluorescent azide (Alexa Fluor 488) to the incorporated alkyne (HPG) (Figure 1A).
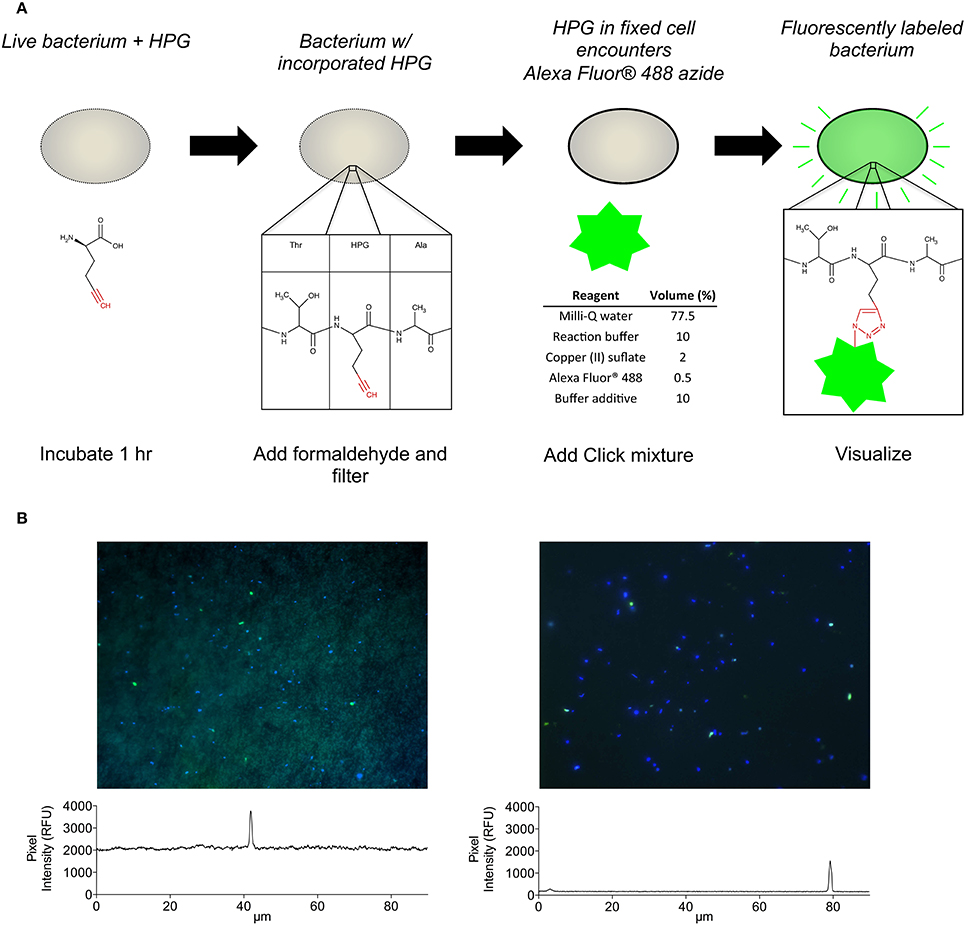
Figure 1. (A) Conceptual flow chart summarizing the HPG incorporation and detection method. (B) A representative view of HPG-labeled bacteria (green cells) among all bacteria (blue cells) observed on polycarbonate filters (left) and coverslips after filter-transfer-freeze (right), which enabled observation of both faintly and brightly labeled cells. Signal intensity profiles (panels below images) measured across the images (white lines) illustrate a 10-fold reduction of background signal using filter-transfer-freeze.
Significant Background Reduction by the Filter-Transfer-Freeze Technique
When measured on polycarbonate filters, HPG-labeling ranged 9.8–47% of total DAPI-stained bacteria among five samples (Figure S1). Application of the FTF technique to five parallel samples resulted in a 10-fold reduction in background fluorescence (Figure 1B) and increased the proportion of HPG-labeled cells to 14.6–100% (Figure S1; example microautoradiography image in Figure S2). In parallel incubations of two separate seawater assemblages, percent labeling with the HPG method (using the FTF technique) was ~5- to 8-fold higher than with 35S-methionine microautoradiography (Table 1). FTF bacterial transfer efficiency ranged 69–200% because some cells remained stuck to the filter (underestimation) and transferred cells aggregated in condensation pools on the coverslip (overestimation). The average labeling percentages calculated from each field of view were positively correlated with the absolute percentages calculated from all fields (R = 0.99, p < 0.0001), and they exhibited a nearly 1:1 ratio, as shown by a model II linear regression yielding a significantly non-zero slope of 0.98 (p < 0.0001; 95% confidence intervals = 0.95–1.017). Thus, assuming equal transfer efficiency of labeled and unlabeled cells, individual cell signal intensities and labeling percentages (Table 2) should not have been affected by FTF.
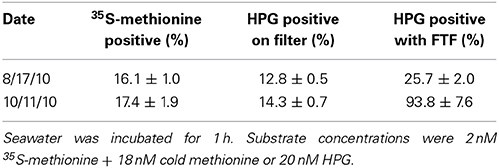
Table 1. Percent labeling in two natural assemblages as quantified via three methods: (i) 35S-methionine microautoradiography, (ii) HPG on polycarbonate filters, and (iii) HPG with the freeze-transfer-freeze method.
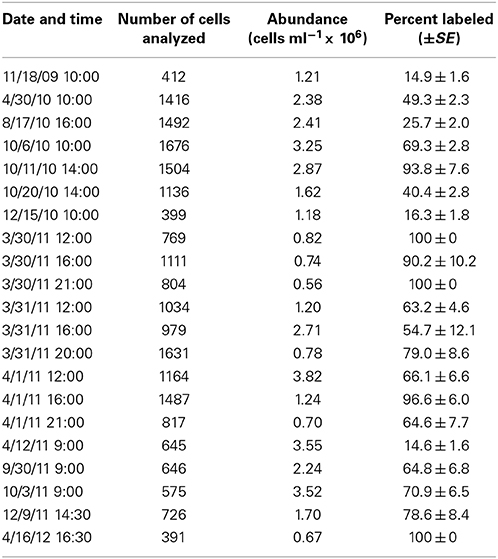
Table 2. Overview of HPG percent labeling for 21 sampling dates at Scripps Pier.
Validating Use of HPG
HPG incorporation specificity and efficacy as methionine analog
We determined that HPG labeling did not occur in the presence of chloramphenicol, and that the presence of methionine at 1 or 2 μM reduced or eliminated HPG labeling percentages in four separate tests of natural assemblages (Figure S3).
An experiment that tested the competition of HPG with 35S-methionine incorporation suggested the presence of HPG (8 or 18 nM) did not significantly change 35S-methionine incorporation while the presence of cold-methionine (8 or 18 nM) decreased 35S-methionine incorporation by 2.3- and 3.7-fold, respectively (p < 0.05; Figure S4). In a second experiment, presence of HPG at 20 nM resulted in an insignificant reduction of 35S-methionine incorporation (1.3-fold; p = 0.06), but 200 nM and 2 μM HPG elicited significant reductions (2.8-fold; p < 0.05 and 12.5-fold; p < 0.05, respectively; Figure S4).
Additional experiments examined the potential for HPG to competitively inhibit methionine incorporation. Enzyme kinetic curve fit calculations indicated that Km for 35S-methionine decreased with higher HPG concentrations but there was no effect on Vmax. The calculated inhibition constant (Ki) for HPG was 373 nM (numerically equal to Km for HPG incorporation) while the Km for methionine incorporation was an order of magnitude lower at 31 nM (Figure 2). The results support the conclusion that HPG competes with methionine for incorporation into cells within an enzyme-substrate binding framework (Copeland, 2005).
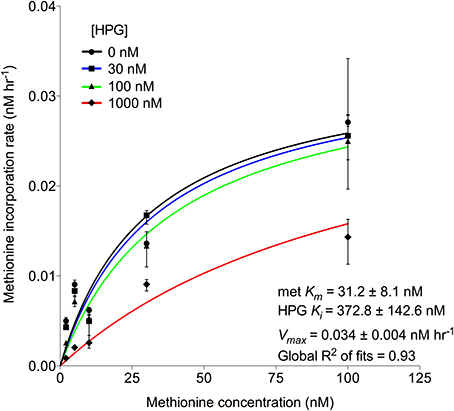
Figure 2. Michaelis-Menten kinetics (±95% confidence intervals) displaying HPG competitive inhibition of methionine, i.e., unchanging Vmax and decreasing Km values of methionine uptake with increasing HPG concentration, where HPG acts as an inhibitor. Included are the half-saturation constants for methionine and HPG. Each point (±95% confidence intervals) was calculated from triplicate 35S-methionine incorporation samples of Scripps Pier microbial communities at 5 concentrations (2, 5, 10, 30, and 100 nM) in the presence of 0, 30, 100, and 1000 nM HPG.
Conversion factor for HPG fluorescence to protein production rate
We calculated a conversion factor using 3 different approaches and adopted the “top 10% isolate mean” calculation (see Materials and Methods). The individual cell HPG signal intensities of the Alteromonas spp. AltSIO and As1 used for the conversion factors ranged 1.795–5.617 log10 RFU cell−1 (n = 1697). The range in protein for the top 10% cells was 18.2–136.1 fg cell−1 and the resulting conversion factor was 5.358 log10 RFU fg−1 protein; this value was used to convert a single cell HPG signal to a single cell protein production rate (scPP) for all labeled cells in natural communities. The detection limit of the method was determined to be 0.07 fg cell−1 (SE = 6.1 × 10⁻⁴, n = 7136) and was calculated by taking the average value of all control cells from all samples after applying the conversion factor.
Protein mass determined from all cell volumes ranged 8.1–136.1 fg cell−1. The two remaining calculations, while not adopted, provided the following conversion values: (i) “isolates regression,” 5.620 log10 RFU fg−1 protein (R2 = 0.41, p > 0.0001) and (ii) “community sum 35S-methionine,” 5.166 log10 RFU fg−1 protein. The “isolates regression” calculation assumed all labeled cells, including low intensity cells, harbored protein where most methionine had been replaced by HPG. This regression fit calculation was sensitive to disproportionate influence by low intensity cells. The “community sum 35S-methionine” factor assumed: (i) the sum crystal area for the ~900 cells we measured could be normalized to all cells per mL, allowing us to correlate crystal area with bulk growth rate and (ii) the bulk HPG community sum intensity could be accurately divided into the bulk 35S-methionine protein synthesis rate.
Using HPG to Quantify Single Cell Protein Production
Natural assemblages
HPG labeling across 21 seawater samples (i.e., communities) ranged 14.6–100% (Table 2). HPG signal intensities in labeled cells ranged six orders of magnitude (−0.155 to 6.949 log10 RFU cell−1; raw data shown in Figure S5 and Table S2). The labeled cells were rank-ordered by intensity within each community, and the sum HPG signal intensity for all cells in each community was calculated. The percentage of rank-ordered cells that comprised 10% of this “community sum” ranged 0.2–1.6% (Table 3). The percentage of “community sum” comprised by the top 10% of active cells ranged 34.7–77.8% while the bottom 50% of active cells ranged 1.9–13.7% (Table 3). Upon application of the conversion factor to each cell's HPG signal intensity, scPPs ranged 3.1 × 10⁻⁶ to 3.9 fg protein cell−1 h−1 (n = 13645; Table 3 and Figure S6).
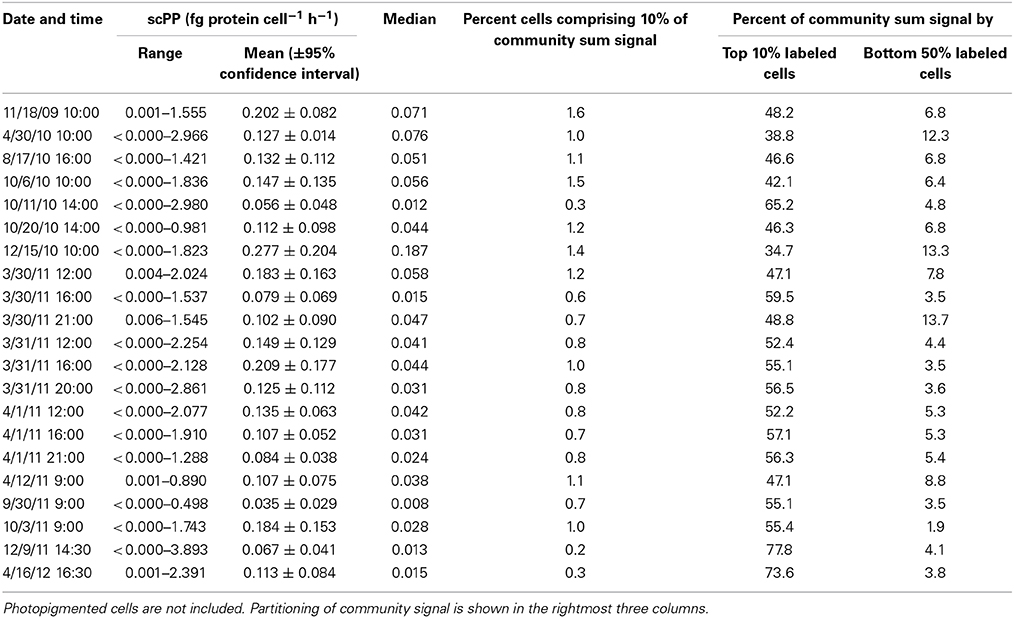
Table 3. Overview of protein synthesis rates for 21 sampling dates at Scripps Pier incubated with 20 nM HPG for 1 h.
Cell volume and HPG signal intensity
For all labeled natural assemblage cells in the 21 Scripps Pier samples (n = 13645), a model II linear regression and correlation analysis of cell volume and log-transformed HPG signal intensity were significantly non-zero and correlated, respectively (p < 0.0001; Spearman R = 0.306; Figure 3). There was also a significantly non-zero model II linear regression and correlation between cell volume and size-normalized cell signal intensity (p < 0.008; Spearman R = 0.063; data not shown).
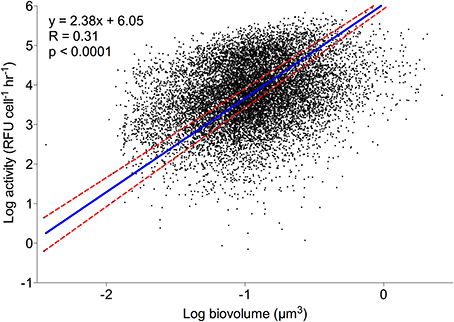
Figure 3. Individual cell HPG signal intensity relative to cell size. A model II regression (blue line) shows log-transformed sum intensity scaled significantly with log-transformed cell volume. Red dashed lines are 95% confidence intervals. n = 13645.
Distribution of single-cell protein production
The scPPs within each community exhibited non-Gaussian distributions, likely caused by a high number of cells with low rates. Neither log-normal nor exponential regressions of the frequency distributions were significant for any of the 21 communities. However, the distributions fit well to power law regressions (Figure 4) with R2 > 0.99 in 9 of the 21 seawater samples while the remaining had R2 > 0.75. The power law fits displayed similar visual trends in that all had negative slopes and were relatively confined to the same x-y space. However, the scaling factors (variable A) and exponents (variable B) were wide ranging (Figure 4 inset). A consensus regression model fit to the global dataset did not account for all of the variation (extra sum of squares F test, p < 0.0001; Akaike's informative criteria, 99.99% probability). Notably, the innermost and outermost regressions (15-Dec-2010 and 9-Dec-2011) originated from water samples that differed greatly with regard to sampling depth and chlorophyll concentration.
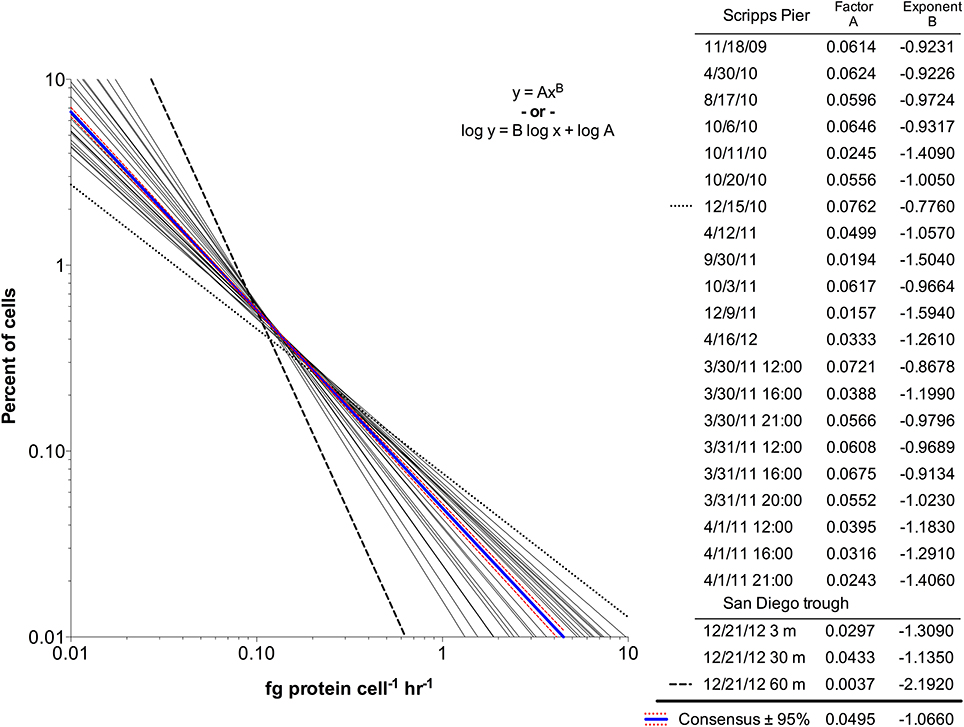
Figure 4. Single cell protein production rate distribution for 24 bacterial community samples from Scripps Pier and San Diego offshore trough seawater. The rate distributions fit power law regressions, and the parameter fits are shown (Factor A and Exponent B). A global fit to consensus data and 95% confidence intervals are shown in blue and red, respectively. The most divergent samples are shown by the dashed lines (15-Dec-2010; 21-Dec-2011).
Particle-attached bacteria
When we applied the standard concentration and incubation protocol to seawater particles (20 nM HPG for 1 h), 80% of DAPI-stained attached bacteria were labeled, with a median scPP of 0.025 fg protein cell−1 h−1 (Figure 5; example images in Figure S7). Extended incubation times (up to 2 d) and higher HPG concentration (2 μM) increased labeling characteristics for particle-associated cells. Median signal intensity in 20 nM HPG increased by 2.8-fold from 1 h to 2 d then remained approximately constant through 8 d (Figure 5). In contrast, median intensity in 2 μM HPG increased by 4.8-fold from 1 h to 2 d, then another 6.6-fold from 2–8 d. Signal intensities for 20 nM HPG treatments were lower than 2 μM HPG treatments at each time point (Figure 5). The same pattern occurred for free-living cells in the same vessels (data not shown). Signal intensities for particle-attached cells followed non-Gaussian distributions (D'Agostino and Pearson omnibus and Shapiro-Wilk normality tests, p < 0.001). Methodologically, omission of filter-transfer-freeze for 8 μm filters had little effect on the particle attached cell measurements because high background fluorescence, as occurs on 0.2 μm filters, was due to small, closely-spaced pores. Background intensities measured from circular regions (1 μm diameter) were only slightly higher on 8 μm polycarbonate filters relative to cover glass following filter-transfer-freeze (1.25-fold in 20 nM samples; 1.09-fold in 2 μM samples).
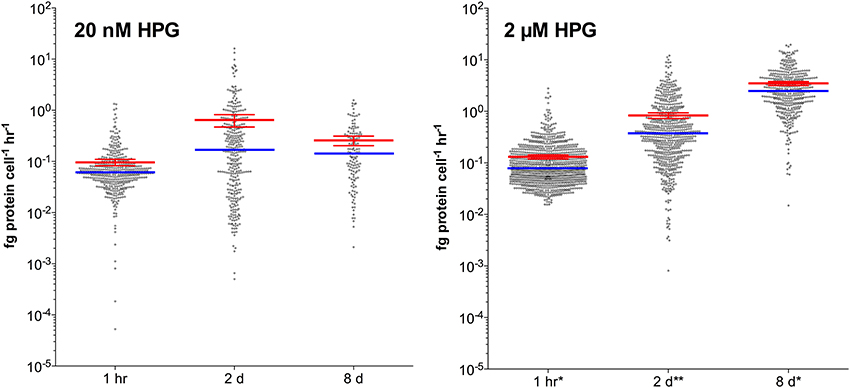
Figure 5. HPG-based protein synthesis rates for particle-attached bacteria incubated with 20 nM or 2 μM HPG. Incubations were sampled at 1 h, 2 day, and 8 day. Red bars show means (±95% confidence intervals) while blue bars display the medians. Samples denoted (*) exhibited 100% labeling and (**) denotes >90% labeling of DAPI-stained cells.
Clonal isolates
We hypothesized that limited variation in HPG labeling intensity would characterize marine bacterial monocultures. To address this, isolates AltSIO and As1 were grown in separate experiments to examine patterns and distribution of HPG incorporation in clonal cells. Labeling percentages were 100% for both isolates as determined from aliquots tested each hour from 16 to 22 h. Single-cell signal intensities ranged approximately three orders of magnitude at each timepoint, with the brightest cells of AltSIO and As1, respectively, at 6.176 and 6.279 log10 RFU (Figure S8). By comparison, the most fluorescent single cell measured among all Scripps Pier samples was 5.949 log10 RFU. Population signal intensities for both isolates followed non-Gaussian distributions at all timepoints except T = 18 h (D'Agostino and Pearson omnibus and Shapiro-Wilk normality tests, 0.03 < p < 0.0001).
Discussion
The HPG method we developed measures the percentage of bacteria engaged in protein synthesis and the protein synthesis rate of those single cells. After confirming the method's utility and specificity, we used it to quantify single cell protein synthesis rates in free-living natural seawater assemblages, particle-associated natural assemblages, and two cultured clonal bacterial strains.
Method Validation
Prerequisites for HPG as a quantitative measurement
HPG is specifically incorporated into de novo synthesized protein. Incorporation of HPG into new protein has been previously demonstrated for E. coli (Beatty et al., 2005; Wang et al., 2008). We used chloramphenicol inhibition of protein synthesis to test whether this held true for natural assemblages of marine bacteria. Chloroamphenicol blocks peptidyl-transferase and prevents protein chain elongation. The presence of chloramphenicol eliminated HPG labeling, indicating that HPG is very likely incorporated into newly synthesized protein in natural bacteria. We did not directly address the interaction of HPG and/or methionine at the level of membrane transport and translation, nor did we directly test whether HPG and/or methionine was converted to other compounds or brought into intracellular inclusion bodies rather than become incorporated into proteins.
HPG is a competitive inhibitor of methionine. Methionine addition reduced or eliminated HPG percent labeling in a dose-dependent manner, supporting the basic premise that HPG can be used as a substitute for methionine in protein (Figure S3). Given the non-zero, albeit significantly reduced, HPG labeling percentages in the presence of methionine on 1-Oct-2009, the experiment was repeated three times. The 16-May-2010 and 6-Oct-2010 samples showed no labeling, as expected, while 11-Oct-2010 maintained a low amount of labeling (Figure S3). We speculate that community acclimation to high exogenous methionine concentrations within the particular water masses resulted in preferential uptake of HPG. These results may also be due to naturally-occurring alkynes in the cells of these samples (Udwary et al., 2007). While such cells should have appeared in many samples, it may be that there was a higher abundance of such cells on 1-Oct-2009 and 11-Oct-2010. This result clearly defies expectation and is without a well-defined explanation.
Bulk methionine incorporation was reduced by the presence of HPG (Figure S4). Michaelis-Menten kinetics of HPG-methionine interaction showed competitive inhibition at 1000 nM, but overlap of the 95% confidence intervals for the non-linear uptake kinetic fits in the presence of 0, 30, and 100 nM HPG suggested insignificant competitive inhibition at these concentrations despite exhibiting similar Vmax rates alongside increasing Km concentrations with increasing inhibitor (i.e., HPG; Figure 2). This may partially be explained by: (i) the bacterial community exhibiting ~10-fold lower affinity for incorporation of HPG based on its high Ki and (ii) metabolic variation in the complex assemblage of cells within the triplicate measurements. Additionally, this affinity may explain why 8 or 18 nM HPG did not significantly reduce 35S-methionine incorporation while as little as 10 nM cold methionine was sufficient (Figure S4). Nevertheless, since typical methionine concentrations in surface seawater are ~200 pM (Zubkov et al., 2004), availability of 20 nM HPG should overcome competitive inhibition by methionine.
HPG percent labeling is comparable to 35S-methionine microautoradiography. For parallel seawater incubations, the HPG method (without FTF) and 35S-methionine microautoradiography yielded similar percent labeling (Table 1). Thus, the HPG method performs at least as well as microradiography for quantifying proportions of protein-synthesizing bacteria in natural assemblages. We attempted to directly compare the two methods by co-incubating seawater with 35S-methionine and HPG, transferring co-labeled cells to photographic emulsion on a single slide, then sequentially processing the slide for microautoradiography or click. We found that AlexaFluor-488 azide bound non-specifically to the microradiography emulsion, rendering HPG-labeled cells indistinguishable from background. Application of the click reaction on the filters prior to microautoradiography processing was also unsuccessful as no HPG-labeled cells were observed, possibly due to fluorescence fading during 3 day exposure at 4°C.
Short incubations and high sensitivity. These prerequisites are desirable in order to limit time-dependent changes in protein synthesis rate. We adopted 1 h incubation time as standard protocol because the results of a time course experiment demonstrated that percent cell labeling increased 1.6-fold as incubation time increased from 30 min to 1 h, with no further increase up to 4 h incubation (data not shown). The 1 h incubation time, combined with use of the FTF technique, permitted detection of very low individual cell HPG fluorescence intensities. The scPP estimates were calculated by first acquiring accurate and precise measurements of fluorescence intensities and bacterial cell dimensions using the Nikon NIS Elements software. The HPG intensities were divided by the conversion factor to yield scPP. Using this individualized measurement approach, the lowest detected scPP was 3.1 × 10⁻⁷ fg protein cell−1 h−1.
From data acquired in the particle experiment, we found that increasing HPG concentration from 20 nM to 2 μM yielded mean incorporation rates that were 1.5-fold higher while median incorporation rates increased 3.8-fold. As a standard protocol we chose to use 20 nM HPG to yield conservative estimates of the incorporation rate; even at this conservative HPG concentration bacterial communities on 3 out of 21 sampling dates exhibited 100% labeling.
Method Limitations
While the method can be used to determine percent protein synthesis active bacteria in communities and single cell protein production rates, a potential limitation is that HPG uptake affinity and subsequent incorporation may be species variable, which could underestimate percentages and influence scPP rates. The limitation may be overcome by using high HPG concentrations provided there is no effect of HPG concentration on protein synthesis rate, though greater HPG availability would not increase labeling for species that do not uptake HPG. Another possible limitation is that click chemistry labeling component(s) may not permeate through fixed membranes of all taxa. Though this topic was not specifically tested here, we saw no evidence for impermeability, and a separate click chemistry study demonstrated no improvement in cell labeling with enzymatic permeabilization (Smriga et al., 2014). Lastly, we note the inability to extrapolate single cell protein synthesis rates to bulk rates due to the FTF technique potentially biasing the relative proportion of zero, low, or high activity cells. This limitation may be ameliorated by developing in vivo bulk fluorometric detection of HPG in whole seawater using “strain promoted,” copper-free click labeling (Agard et al., 2004; Baskin et al., 2007; Hatzenpichler et al., 2014). In addition to these three aspects, future work examining the dynamics between uptake and protein incorporation would further constrain the “top 10% isolate mean” conversion factor and supplement testing on oligotrophic seawater samples.
Converting Fluorescence to Protein Production
We experimentally determined a numerical factor for converting single cell fluorescence intensity into single cell protein synthesis rate. Ideally this factor would have been determined from a direct, cell-specific comparison of microautoradiography and HPG, i.e., co-incubation of natural seawater samples with 35S-methionine and HPG followed by simultaneous measurement of silver grain cluster area and Alexa Fluor 488 intensity in each cell. Experimental attempts at this were problematic (see above).
We instead opted for a parallel incubation approach to determine a conversion factor, i.e., experimental replicates amended only with 35S-methionine or only with HPG. For this “community sum 35S-methionine” approach we determined the bulk growth rate for the samples amended with 35S-methionine and separately did both microradiography to quantify silver grain cluster areas and click labeling on HPG incubated samples. Percent labeling in the HPG replicates was much higher than in the 35S-methionine replicates, but the distributions of single cell HPG signal intensities were similar to those for single cell crystal areas in two samples (Figure 6). While we cannot directly correlate the two signal types to get a conversion factor, the distributions imply that HPG and 35S-methionine were comparable in their utility for estimating relative incorporation at the single cell level.
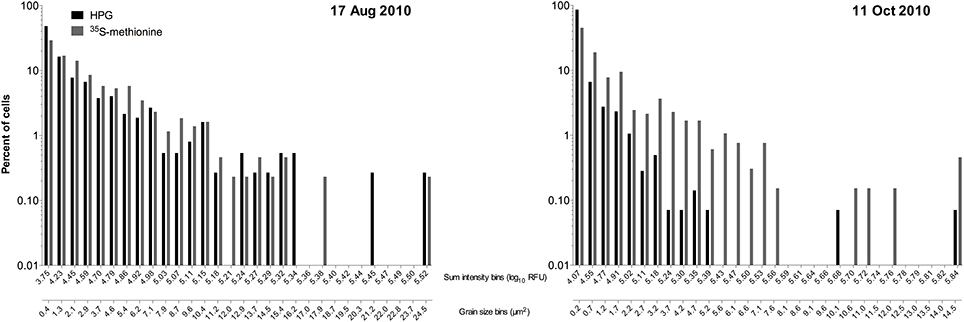
Figure 6. Distributions of individual cell signal intensities for click chemistry (HPG) and micro radiography (35S-methionine) determined via parallel incubations (i.e., separate 2 mL samples from the same flask) on two sample dates at Scripps Pier.
As an independent approach to determine a conversion factor, we quantified HPG incorporation in two bacterial isolates (AltSIO and As1) that grew well in unamended seawater and used the HPG signal intensity data for two calculations (see Materials and Methods).
The “top 10% isolate mean” calculation resulted in a conversion factor (5.358 log10 RFU fg−1 protein) that we assumed to be most accurate for transforming fluorescence signal to HPG content. It took into account the skewed distribution of labeling observed in AltSIO and As1 (described below) as evidence that a greater fraction of methionine was replaced by HPG in the protein content of the top 10% brightest cells. The rationale for the “top 10%” calculation arose from: (i) the large range and large coefficient of variation (cv = 0.86) in labeling intensities for AltSIO and As1, potentially due to heterogeneous activity patterns and/or departure from logarithmic growth, (ii) the lower variance among the top 10% of these cells (cv = 0.49) implying that this subpopulation was nearly saturated with HPG, and (iii) the fact that nearly saturated cells yielded a higher conversion factor which translated into more conservative scPP rates than the use of a lower conversion factor.
Our use of strains AltSIO and As1 assumed that their growth in unamended seawater reflected the growth conditions of natural communities (in the absence of significant viral or protistan mortality). We recognized that two closely related strains might only partially represent the vast taxonomic and physiological diversity of natural bacterial assemblages. We therefore attempted to grow other isolates in unamended seawater to determine a conversion factor: Tw3 (Vibrionaceae), Tw7 (Alteromonadaceae), and BBFL7 (Flavobacteriaceae). However, these isolates did not grow in unenriched seawater.
Variance in the methionine content per cell could effect the conversion factor calculation, but evidence suggests low variance in methionine content relative to other amino acids including leucine, the amino acid often used to estimate bulk bacterial production in seawater. First, methionine content of marine bacteria is low (2.2 mol%) relative to other amino acids including leucine (7.3 mol%) as quantified experimentally (Simon and Azam, 1989). Second, the average methionine content of all aquatic bacterial genomes in the IMG database (http://img.jgi.doe.gov) is 2.4 mol% (SE = 0.02, n = 279) while leucine is 10.4 mol% (SE = 0.05, n = 279; Moura et al., 2013). Similarly, methionine is the least frequently incorporated amino acid in E. coli proteins (~2% of residues) while leucine is among the most (Saier, 2008). While total cell methionine content variance is low, this may be underpinned by high variance in the methionine residues per protein. Among three Alteromonas spp. genomes, most proteins (74–77%) encode 1–10 residues, but a small percentage require either >25 or none at all. For context, the genome of AltSIO (unpublished) contains an average of 8.4 methionine residues per protein (SE = 0.095; n = 3941). It is possible that in natural assemblages, expression of a few “high-methionine” proteins will cause an individual cell's total methionine content to be disproportionately high relative to other individuals in a clonal population. However, we predict this is limited since proteins with many methionine residues are also large proteins, and the space constraints of cells do not permit unregulated production of these molecules unless cell size is increased (Simon and Azam, 1989).
The adopted “top 10% isolate mean” conversion factor is currently a best estimate based on labeling response of two strains exhibiting growth characteristics that reflect elevated protein synthesis rates in heterotrophic bacteria encountering favorable conditions within the marine water column. Importantly, while we chose to adopt the “top 10% isolate mean” calculation, all three approaches gave conversion factors within the same order of magnitude (~5.2 to ~5.6 log10 RFU fg−1 protein), which provides confidence in the level of accuracy of the adopted value. Future experience with the method will likely improve accuracy of the conversion factor.
Characteristics of Single Cell Protein Production in Marine Bacteria
Low activity bacteria in natural assemblages
When we applied the conversion factor to natural assemblages in 21 samples, the resulting scPP ranged ~10−6 to 3.9 fg protein cell−1 h−1. This broad range is in agreement with Sintes and Herndl (2006) in which values ranged 1–100 amol Leu cell−1 d−1, or equivalent to 0.15 and 15.1 fg protein cell−1 h−1, respectively, assuming 3.6 kg protein per mole of leucine incorporated (Simon and Azam, 1989). Comparatively, our minimum rate detected with HPG is very low. The FTF technique enabled a high signal-to-background ratio for HPG-labeled cells and extended the lower threshold for detecting active cells. This is one potential reason why percent labeling was higher for HPG than for microradiography in parallel samples (Table 1). It may also be influenced by the dynamic range obtained from pixels vs. exposed silver grains. Using fluorescence, the collection of photons from a single cell occurs over hundreds of pixels comprising its dimensions, and not based on the tens of silver grains in its vicinity.
Several different methods for quantifying cell activity have shown that a majority of cells are inactive or “ghosts” or dormant in seawater (Fuhrman and Azam, 1982; Zweifel and Hagstrom, 1995; Lebaron et al., 1998; Schumann et al., 2003; Hamasaki et al., 2004). By contrast, the majority of cells were actively synthesizing protein in all samples we tested, albeit many cells were doing so at a low rate. The large proportion of low activity cells points to the existence of a background microbial community with low metabolic activity potentially primed to respond advantageously. It is known that bacterial communities harbor multiphasic uptake systems (Azam and Hodson, 1981). Low activity cells with high Km permeases may maintain a minimal metabolic state until favorable conditions arise (Roszak and Colwell, 1987; Lauro et al., 2009). These low-activity populations may thus represent a substantial portion of the “microbial seed bank” suggested to exist throughout the ocean (Gibbons et al., 2013).
Relationship of HPG incorporation to cell volume
A positive linear relationship was observed between cell volume and HPG incorporation (i.e., log10 RFU intensity), consistent with previous studies of marine bacteria (Gasol et al., 1995; Lebaron et al., 2002). Larger volume cells tended to have higher protein synthesis rates (Figure 3). These relationships held when incorporation rates were normalized by volume, i.e., larger cells exhibited higher incorporation even when each cell's rate was divided by its volume. This suggests that carbon and nutrient incorporation is not similar for all cells per cell mass, showing that cell size is a significant parameter affecting anabolic processes derived from ambient material. This lends further support that size is an important factor governing microbially-mediated nutrient dynamics, along with substrate degradation specificity and growth efficiency (del Giorgio and Cole, 1998).
Power law distribution
The strong skew in fluorescence intensities within each sample led us to use log-log plots for viewing and comparing the spectrum of scPP across samples after fitting the data distributions to power law regressions. The visual clustering of regressions (and the global fit; Figure 4) indicates there is stability in the distribution of growth rates across individuals in the communities at Scripps Pier as well as in the offshore ecosystem of the San Diego trough. The consensus fit, however, could not explain all of the variation seen in the data, indicating each sampled water mass harbored microbial communities with unique continuums of single cell protein synthesis profiles that: (i) exerted differential influence over elemental cycling and (ii) reflected fluctuating nutrient availability supporting individual cell growth. Indeed, the two most divergent regression lines (15-Dec-2010 and 21-Dec-2011; Figure 4, bold lines) reflected the two most divergent sample types, specifically offshore waters at 60 m (overall lower community activity) and an intense bloom of the dinoflagellate Lingulodinium polydrum (overall higher community activity). Phytoplankton-derived organic carbon availability is among the factors that may explain these two divergent regressions (Mague et al., 1980; Fuhrman et al., 1985; Nelson and Carlson, 2012; Sarmento and Gasol, 2012).
The power law scaling values are useful to consider alongside means and medians when describing non-Gaussian distributions of single cell microbial activity. These values define the allocation of activity within the community (Figure S9). Increasing the scaling factor A (analogous to the y-intercept) results in an overall increase in community protein production rate. Changing the scaling exponent B (analogous to the slope) affects the relative proportion of higher or lower activity cells while also controlling the distribution of community activity. We found no significant relationship between chlorophyll and scPP mean or median, scaling factor, or scaling exponent. However, we did find significant positive correlations between: (i) the scPP means and scaling factors (r = 0.61, p = 0.003) or scaling exponents (r = 0.65, p = 0.002) and (ii) scPP medians and scaling factors (r = 0.93, p < 0.0001) or scaling exponents (r = 0.95, p < 0.0001).
The power law distributions are in general agreement with previous work examining single-cell incorporation of various substrates in the Arctic Ocean using microautoradiography (Nikrad et al., 2012). In one of the few examples of this distribution, the authors noted a negative slope of percent active cells vs. silver grain area (data were plotted on log-linear axes), similar to the decreasing trend between percent cells and the activity bins shown in our HPG study using log-log axes. One implication is that “cell-specific rate,” i.e., bulk community rate divided by the total abundance of cells, does not accurately reflect activity distribution at the single cell level. This calculation assumes Gaussian rate distribution within the natural community (Smith and del Giorgio, 2003; and references therein) but this assumption is clearly not valid for HPG-based protein synthesis rates given their fit to a power law regression.
Activity of particle-attached bacteria
We applied the method to particles because these microenvironments are ubiquitous in coastal seawater and may regulate bacterial community activity at larger scales. The standard protocol for free-living bacteria (20 nM HPG, 1 h incubation; Figure 1) also worked for particle-attached bacteria, and additional treatments in the particle incubations gave insight into the nature of protein production on particles. The experiment included parallel treatments of 2 μM HPG since we recognized a priori that high methionine concentrations could originate from particles, e.g., due to bacteria-mediated proteolysis, which could reduce HPG incorporation and thereby underestimate growth rates for bacteria closely-associated with particles (Smith et al., 1992; Azam and Long, 2001; Kiørboe and Jackson, 2001). This assumption may have been accurate since signal intensities were higher in 2 μM than in 20 nM HPG (Figure 5). Also, the dramatic increase in HPG signal intensities over 8 day for particle-associated cells suggests that methionine concentrations in the particles were initially high and decreased over time. Possible explanations include chemical diffusion away from the particles or bacterial incorporation and conversion into biomass. As a result, the removal of methionine relieved competition with HPG, which led to increased incorporation of HPG. An alternative explanation for low HPG signal intensities at 1 and 48 h is the occurrence of antagonistic interactions within the attached consortia that constrained cell growth (Long and Azam, 2001a).
The observations are consistent with previous work on marine particles that demonstrated particle-attached bacteria are active. One study used fluorescence microscopy to detect incorporation of the thymidine analog BrdU (Hamasaki et al., 2004). BrdU percent labeling was higher on particles than among free-living cells (56 vs. 35%) but signal intensities were not quantified for particle-attached bacteria. A few studies have used microautoradiography and showed that attached bacteria were active and exhibited higher percent labeling than free-living bacteria (Kirchman and Mitchell, 1982; Paerl, 1984). Specifically, size-fractionated samples demonstrated that particle-associated cells accounted for disproportionately high incorporation relative to free-living cells; the tested substrates included 14C-glucose and 14C-glutamate (Kirchman and Mitchell, 1982), or an 3H-amino acid mixture and 33PO4 (Paerl, 1984).
Our results suggest that percent labeling on particles is influenced by incubation times and concentrations of both a compound and its analog in the surrounding environment. Single cell protein production rates on a particle can vary widely which may reflect microscale heterogeneity of resources on the particle itself, e.g., protein-depleted microscale patches may have enhanced HPG incorporation. The HPG method may enable cells to act as bioindicators for the “nutritional status” of a particle, simultaneously providing information on particle lability and single cell growth rate.
Growth heterogeneity among cells in cultured, clonal populations
When we applied the conversion factor to cultures of Alteromonas AltSIO and As1, protein synthesis rates varied by greater than 3 orders of magnitude. Here cells were grown ~21 h in non-enriched seawater in contrast to >40 h growth used in the conversion factor experiments. The large variance was unexpected but indicates that growth rate heterogeneity can occur among clonal cells undergoing logarithmic growth (Figure S8). The pattern is consistent with the adaptive strategy of bacterial aging in E. coli (Rang et al., 2011) in that heterogeneity may indicate repeated accumulation of oxidative damage to mother cells (lower intensity cells) that serve to rejuvenate daughter cells (higher intensity cells). If growth heterogeneity in AltSIO and As1 reflects similar behavior in natural marine communities, then individuals of specific taxa may exhibit a broad range of growth rates that depend on the overall health of their predecessors. This may partially explain the existence of dividing cells containing one HPG-labeled and one non-labeled cell (Figure 7). Such asymmetrical growth coupled with the prevalence of very slow growing cells could have important consequences for the rank-abundance of microbial taxa within the rare biosphere (Sogin et al., 2006).
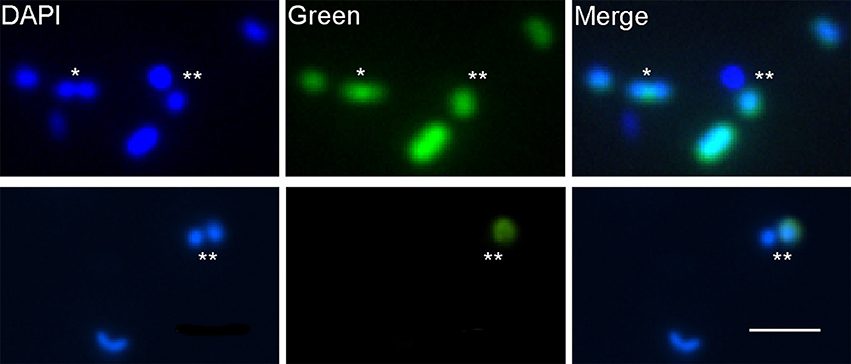
Figure 7. HPG labeling patterns of putatively dividing cells. Each row shows a separate field of view. In most cases, both mother and daughter cells were labeled (*). Occasionally, one cell (either mother or daughter) was labeled and the other was not (**). Scale bar for all images = 2 μm.
Conclusions
The HPG click chemistry method provides a highly sensitive approach to estimate single cell bacterial protein synthesis and growth, and complements other single-cell quantifiable DNA synthesis viability/activity probes, e.g., click EdU, CTC, live/dead, CellTracker, Redox Sensor Green (del Giorgio et al., 1997; Grégori et al., 2001; Schumann et al., 2003; Kalyuzhnaya et al., 2008; Smriga et al., 2014). We used it to measure activity in both rapidly growing cells as well as slow growers previously considered inactive (Zweifel and Hagstrom, 1995; Smith and del Giorgio, 2003). Low abundances of very active cells suggest they were preferentially removed from the communities, possibly via protistan grazing or viral lysis, i.e., “kill the winner” dynamics (Thingstad, 2000). The method also provides a new capability to examine protein synthesis patterns among individual cells on the important microhabitats of planktonic particles. Future goals toward method improvement include development of conversion factors for open ocean regimes. Our results, as well as those of future studies that utilize the method, should help inform conceptual and numerical models that seek to predict the effects of single cell activities on ecosystem-scale biogeochemical processes.
Materials and Methods
Click Reaction, Sample Processing, and Image Analyses
The click reaction is a conjugation of an azide to an alkyne group in the presence of copper (I) via the formation of a stable triazole (Rostovtsev et al., 2002; Tornøe et al., 2002). The sample is first incubated with an azide- or alkyne-functionalized bioorthogonal molecule. This study employed the alkyne-modified methionine analog L-homopropargylglycine (HPG). Incubation of the analog with copper (II) and an azide-linked fluorophore under reducing conditions enables copper (I) to catalyze binding of the azide group to the alkyne, thus fluorescently labeling the analog (Beatty et al., 2005; Salic and Mitchison, 2008). Labeled single-cell fluorescence is then measured in thousands of individual cells using an epifluorescence microscope and CCD camera.
General Protocol
Stock solutions of HPG were prepared in dimethyl sulfoxide (DMSO, 200–2000 μM final; Smriga et al., 2014). Experiments were performed with 0.2 μm filtered 2–200 μM working solutions diluted in Milli-Q water (pH 7.0). Final concentrations were 1 to 2000 nM HPG incubated for 30 min to 8 d. Unless otherwise noted, most incubation durations were 1 h. Field samples were incubated at in situ temperature and protected from light. Experiments with bacterial isolates were incubated at 21°C. Control samples were added to vials containing HPG and 0.2 μm-filtered formaldehyde (2–4% w/v final) to measure non-specific labeling. Statistical tests, data plotting, and kinetics analyses were performed with Graphpad Prism 6 (GraphPad Software, Inc., La Jolla, CA).
Following incubation, 0.2 μm-filtered formaldehyde (2–4% w/v final) was added to each sample and allowed to fix for 15 min to 1 h. The volumes were then filtered onto white 0.2 μm pore size polycarbonate membrane filters (Nuclepore, GE Whatman, Piscataway, NJ). Each filter was cut into 1/8 or 1/6 slices using a sterile razor blade or surgical scissors and placed onto a microscope slide. The remaining portion was stored (dark; −20°C). Filters were processed with the Click-iT® reagent kit (Life Technologies, Grand Island, NY). The kit contained 5 mg of freeze-dried HPG, 0.5 mg Alexa Fluor 488 azide, 20 mL of reaction buffer (an unknown compound, likely ascorbic acid, in 1× tris-buffered saline), 4 mL of 100 mM copper (II) sulfate, and 20 mL of buffer additive (also unknown, likely tris[(1-hydroxypropyl-1H-1,2,3-triazol-4-yl)methyl]amine or similar; Hong et al., 2009; Hatzenpichler et al., 2014). The Click-iT mixture and detection protocol is outlined in Figure 1 and detailed below. The solution of Alexa Fluor® 488 azide was prepared in DMSO at 1 mM with a final concentration of 5 μM in the mixture. Processing steps were completed in darkened conditions to minimize fluorophore photobleaching and azide group decomposition (Abbenante et al., 2007). DNA counterstaining of bacterial cells with 4′,6-diamidino-2-phenylindole (DAPI) was achieved per Glöckner et al. (1996) using antifade mounting medium of Patel et al. (2007).
Filter-Transfer-Freeze
To reduce background signal, we adapted the filter-transfer-freeze technique (Hewes and Holm-Hansen, 1983). Briefly, the wet filter is placed cell side down on a glass slide, quickly frozen (Rapid Freeze Spray, Decon Laboratories, Inc., King of Prussia, PA), warmed with a gloved finger, frozen again, and peeled away, leaving a layer of cells on the slide. The remaining condensation is dried at room temperature (RT).
Step-by-Step Protocol
Preparation:
(1) Remove frozen Alexa 488-azide and buffer additive from the freezer; thaw at RT in the dark.
(2) Clean coverslips and slides with 70% ethanol.
(3) Cut polycarbonate filter into 1/8–1/6 slice and place cell-side up onto a glass slide.
(4) Label filters with a pen.
(5) Add sterile deionized (DI) water to tightly folded absorbent paper placed in a 50 mL falcon tube.
Click reaction steps:
(1) Prepare the Click reaction cocktail with the following components. Use higher volumes to process more than 8 filters:
155 μL sterile DI water, 20 μL 10× reaction buffer, 4 μL copper solution, 1 μL Alexa-488, and 20 μL buffer additive.
Note: be sure to add the buffer additive last and use the reaction cocktail immediately after adding the buffer additive.
(2) Apply 25 μL of reaction cocktail to a cleaned glass coverslip. Turn the coverslip over and place it reagent-side down onto the filter piece.
Note: when multiple filter pieces are processed at once, up to four pieces can be processed on one glass slide. Two 25 μL drops of reaction cocktail are placed onto each 25 × 25 mm coverslip, or four 25 μL drops are placed on a 24 × 50 mm coverslip. Each coverslip is inverted onto the 2–4 filter pieces.
(3) Place the slide into the 50 mL Falcon tube. Seal the Falcon tube and incubate in the dark at RT for 30 min.
Counterstaining:
(1) Prepare DAPI solution at 5 μg mL−1 final concentration. Each filter will need 25 μL.
(2) Two min before the incubation is complete, set up material for DAPI staining: fill 2 Petri dishes with ~20 mL sterile DI water (“wash”), and add 25 μL drops of DAPI per filter piece onto a EtOH-cleaned microscope slide (up to 4 per slide).
(3) Remove the slide from the Falcon tube. Remove the coverslip(s) by gently sliding them over the edge, grasping with the tweezers or gently with gloved fingers, and lifting up. The filters may stick to the coverslip or remain on the slide so be sure to remember which side is face up.
(4) Place the filter piece in the first DI wash, then place in the second DI wash. Dab the filter onto absorbent paper then place cell-side up on top of the DAPI drop (stain will permeate through filter) and incubate 5–15 min in the dark.
Filter-transfer-freeze and slide mounting:
(1) Add 25 μL drops of sterile DI water to EtOH-cleaned slides for as many filters as will be processed.
(2) Remove the filter from DAPI, wash each filter piece as in step 12, dab on absorbent paper, and place on the sterile DI water to maintain hydration.
(3) One at a time, place a filter cell-side down on the coverslip, mark the location & orientation with a sharpie, apply freeze spray for ~5 s, lightly press and warm filter with gloved finger, refreeze for ~5 s, and quickly peel away filter with forceps.
(4) Allow the coverslip to dry completely at RT. Prepare antifade mounting media by diluting a stock solution of 1,4-Phenylenediamine dihydrochloride (10% w/v; Sigma-Aldrich) to 0.1% in 1:1 PBS:Glycerol and keep dark on ice. The stock can be re-frozen and used as many times as the solution remains clear and not purple or dark purple-red.
(5) Add 15 μL of mounting medium to the slide and invert the coverslip on top of it. Let settle for 5–30 min.
(6) Immediately acquire images (as opposed to storing at −20°C for later processing) to reduce fluorescence fading.
Microscopy
We used a Nikon TE2000-U inverted microscope with a Plan Apochromat VC 100×, 1.4 NA oil immersion objective (Nikon Instruments, Japan) and illumination from an Exfo Xcite 120 Hg lamp (Lumen Dynamics, Canada). Images were acquired and analyzed using NIS-Elements 3.0 (Nikon Instruments). Each image (10–20 fields/filter) was haphazardly acquired at: (i) 350 nm excitation 457 nm emission (blue channel for DAPI), (ii) 490 nm excitation 528 nm emission (green channel for Alexa Fluor® 488 signal of incorporated HPG), and (iii) 555 nm excitation 617 nm emission (red channel for photopigment autofluorescence). Exposure ranged from 10 ms to a few seconds, depending on sample. The typical exposure for HPG conjugated Alexa Fluor 488 fluorescence was 1 s. Exposures of DAPI and photopigments were optimized for each sample set. It was critical to quantify between-sample variation in Hg lamp illumination and to inter-calibrate fluorescence intensity at different exposure times. We performed calibrations using the InSpeck Green Microscope Image Intensity Calibration Kit (Life Technologies, NY). Fluorescent beads (0.3% relative intensity) were imaged on three separate dates at 2, 10, 25, 100, and 200 ms exposure times. Additionally, the 0, 0.3, 1, 3, 10, 30, and 100% relative intensity beads were imaged at a constant 30 ms exposure time.
Single-Cell Signal Measurements
Following filter-transfer-freeze, samples were imaged and processed to quantify single-cell intensities. Binary thresholding in Elements software was used to select individual cells in the DAPI channel. Cell area, width, and length data were automatically measured in the software and exported to Microsoft Excel. Cell volumes (V) were calculated from cell lengths (L) and widths (W) according to Bratbak (1985) with the equation (V = L − W ÷ 3) × (π ÷ 4 × W2). Protein content (P) was calculated from cell volume according to Simon and Azam (1989) with the equation P = 88.6 × V0.59. The conversion of 2-dimensional measurements into cell volumes and protein is robust for marine bacteria and has been used repeatedly in marine bacterial assemblages (Bratbak, 1985; Lee and Fuhrman, 1987; Gundersen et al., 2002; Terrado et al., 2008; Malfatti et al., 2009; Pedler et al., 2014).
For each image the DAPI binary layer was overlaid onto the corresponding green channel. Data in this channel was exported as two separate parameters: sum intensity (total fluorescence from each cell) and cell size normalized intensity (sum intensity ÷ #pixels; referred to as “size normalized intensity”). Formaldehyde-fixed controls revealed faint fluorescence likely due to slight non-specific binding of HPG and/or Alexa Fluor® 488 to bacterial cell surfaces. The glass slide contributed little to overall background fluorescence. In some cases the background area normalized intensity of the slide was greater than cell size normalized intensity in control samples. Therefore, to calculate background signals, we measured the mean size normalized intensity of all cells from 5 haphazardly chosen fields (>200 cells) in formaldehyde-fixed controls for each sample. This average cell background intensity was multiplied by the pixel number (cell area divided by the square of pixel length) of each cell in HPG-amended treatments. We reasoned that background subtraction using the highest intensity control cell would give conservative corrected signal intensities in the natural samples, but this approach translated to very low percent labeling and very liberal scPP rates. Using the lowest intensity control cell for background subtraction yielded labeling and scPP rates similar to those obtained using average background approach. Thus, we adopted the average background calculation. It provided a liberal, unique, and cell volume-specific background sum intensity that was subtracted from the sum intensity of each respective cell, the difference being the HPG signal. Intensity values that were zero or negative were considered unlabeled and not analyzed further, but included in calculations of percent-labeled cells.
Proportion of HPG-Labeled Cells
The percent of HPG-labeled cells on filters was calculated as [(# HPG+ cells) − (# red channel+ cells)] ÷ (# DAPI+ cells) from 10 haphazardly chosen fields and ≥20 cells per field. Red channel+ cells were excluded since samples used for cell counts displayed seemingly HPG+ cells in the green channel due to carryover of photopigment autofluorescence from cyanobacteria and/or picoeukaryotes. They were manually removed from the thresholding-based selections using Elements software.
HPG-labeled cells in samples processed by filter-transfer-freeze were analyzed identically. After background subtraction, sum intensities >0 were used to calculate percentages of HPG-labeled cells: (i) as averages of 10 fields of view (arcsine transformed prior to calculation of means and standard error) and (ii) as absolute percentages (total # HPG+ cells from all fields ÷ total # DAPI+ cells from all fields). This was done in order to determine whether cell abundance aggregation and variance in each field (caused by filter-transfer-freeze) skewed the results.
Method Validation
Specificity of HPG incorporation into newly synthesized protein
Chloramphenicol inhibition of protein synthesis was used to determine the specificity of HPG incorporation. Samples were incubated with 50 μg mL−1 chloramphenicol + 20 nM HPG for 1 and 6 h, processed, and compared to unamended controls.
HPG as analog to and competitive inhibitor of methionine
E. coli uses methionyl-tRNA synthetase to incorporate HPG into protein in place of methionine (Kiick et al., 2002; Wang et al., 2008). We conducted four incorporation kinetics experiments to test that natural marine microbial communities also incorporated HPG in place of methionine.
Methionine inhibition of HPG incorporation. We incubated seawater samples with 20 nM HPG plus 0, 1, or 2 μM methionine for 0.5, 1, 4, and 6 h. Samples were click-processed (as above, without filter-transfer-freeze), imaged, and analyzed to quantify methionine inhibition of HPG incorporation.
HPG inhibition of 35S-methionine incorporation. Scripps Pier seawater was incubated for 1 h with 2 nM 35S-methionine alone and with 8 nM, 18 nM, 20 nM, 200 nM, 2 μM HPG, or 8 nM HPG + 10 nM cold methionine. 35S incorporation was quantified by the centrifugation method (triplicate samples with duplicate controls; Smith and Azam, 1992).
HPG inhibition of methionine incorporation: Competitive or non-competitive? We evaluated uptake kinetics to test whether HPG is a competitive, non-competitive, or mixed inhibitor of methionine (Michaelis and Menten, 1913). We used natural coastal seawater bacterial assemblages collected from the Scripps Pier, and analyzed the concentration-dependence of 35S-methionine incorporation (Km) at 5 concentrations (2, 5, 10, 30, and 100 nM). Deviation of 35S-methionine incorporation kinetics due to the presence of 0, 30, 100, and 1000 nM HPG was analyzed to determine the Ki for HPG, which is numerically equivalent to HPG Km (Experimental details in Table S1).
35S-methionine microautoradiography. Parallel incubations were conducted to compare microautoradiography and click chemistry for detection of the proportion of protein synthesizing cells from natural assemblages. Slides were prepared for microautoradiographic analysis from samples incubated with 35S-methionine in the presence (200 nM and 2 μM) or absence of HPG. Simultaneously, samples were incubated with HPG and click-processed for visualization: (i) directly on filters and (ii) on glass slides after applying the filter-transfer-freeze technique. The objective was to compare the proportion of positively labeled cells by the three approaches, as well as to quantify the potential inhibitory effect of the presence of HPG on cellular protein synthesis.
Microautoradiography
Seawater was incubated for 1 h in the dark unless otherwise noted. Following incubation with 2 nM 35S-methionine + 18 nM methionine, samples were formaldehyde fixed (2% final concentration) for >15 min. Killed controls received a mixture of radiolabeled amino acid and formaldehyde. Samples were filtered onto 0.2 μm pore size polycarbonate filters backed with 0.45 μm pore size mixed cellulose ester filters (Isopore membrane filters and MF membrane filters, Millipore, Billerica, MA). Filters were rinsed with 0.2 μm filtered 1× PBS or Milli-Q water, dried on absorbent tissue, and stored at −20°C.
Filters were cut into 1/8 to 1/4 pieces. Preparations for microautoradiography were performed under darkroom conditions using a Kodak GBX-2 safelight with a 15 W bulb placed ~5 m away from the working area. This extremely faint light ensured low background, but necessitated the use of night vision monocular goggles (D-112MG; Night Optics USA, Inc., Huntington Beach, CA). We modified an emulsion coating and cell transferring protocol based on those from previous publications (Fuhrman and Azam, 1982; Teira et al., 2004; Longnecker et al., 2010). Ammersham LM-1 emulsion was melted at 43°C for 15 min to 1 h. Slides were dipped in emulsion for 5 s, allowed to drip for 5 s, wiped to remove emulsion on the back of the slide, and immediately placed onto a flat sheet of aluminum foil on ice. After 5–10 min, a filter slice was placed cell side down onto the emulsion. When this was completed for all filters, each slide was placed in a slide box with desiccant. The slide box was sealed with black tape, wrapped in aluminum foil, placed in a cardboard box, kept at RT for 1 h, and then transferred to 4°C for 72 h exposure. We did not test longer exposure times than 72 h, but note that this duration is longer than published studies examining both %-active and silver-grain sizes using 3H-labeled compounds (Cottrell and Kirchman, 2003; Sintes and Herndl, 2006; Longnecker et al., 2010). Since 35S emits nearly 10x more energy than 3H, our results likely reflect the upper bound of %-active cells as revealed using 35S-methionine.
Slides were developed with Kodak D19. In 50 mL tubes, 1.6 g of developer was mixed with 40 mL water and dissolved at 43°C for 15 min. Nine grams of fixer was mixed with 40 mL water at room temperature until fully dissolved. Four separate slide mailers (Fisher Scientific, Pittsburgh, PA, USA) were used as reagent containers and filled with 20 mL of developer, developer wash, fixer, and fixer, respectively. Under darkroom conditions, the slides were removed from the darkened box, and the filters were gently removed from each slide using forceps, thereby transferring the cells from the filters (now embedded in exposed emulsion).
Slides were submerged in developer for 4 min, washed for 10 s, then submerged in fixer for 5 min, washed again for 5 min, and then allowed to dry on absorbent paper. Once the slide was dry, 50–100 μL of 1 μg mL−1 DAPI was added to the location of the cells and incubated for 10 min. The slide was then washed in autoclaved filtered water and dried again. A coverslip (#1.5 thickness) was mounted to the slide with 15–20 μL of antifade mounting medium.
Microscopy visualization was performed as described above with omission of the green channel. Transmitted light was used to observe the presence or absence of exposed emulsion grains. Percent labeling was calculated as the number of DAPI-labeled cells located within exposed emulsion divided by the total number of DAPI-labeled cells in each field of view for both live and control samples. The data were arcsine transformed, averaged, blank subtracted, and then back transformed. Autofluorescent cyanobacteria and/or eukaryotic cells were excluded from analyses.
Signal intensity conversion to single cell carbon production
We tested 3 approaches to calculate a valid factor converting sum intensity (SI) to fg protein, called “top 10% isolate mean,” “isolates regression,” and “community sum 35S-methionine.”
Alteromonas species As1 and AltSIO (Pedler et al., 2014) were used to quantify the “top 10% isolate mean.” These strains were acclimated to and maintained in GF/F-filtered autoclaved seawater (FASW) to simulate natural seawater conditions. Exponentially growing cells of each isolate were inoculated into triplicate flasks containing 100 ml FASW at a starting concentration of 102 cells ml−1. Flasks were incubated at room temperature for 16 h, at which point concentrations were ~103 cells mL−1, corresponding to growth by 4 doublings (confirmed via DAPI counts). HPG (20 nM) was added to one flask of each isolate and the other remained unamended as a control. Assuming each cell had ≤ 4.0 × 10⁶ methionine residues (an upper limit), 20 nM HPG would be an ample supply for up to ~109 cells and was not limited in the incubation volumes. After 24 and 48 h additional incubation (T40 and T64 h total growth time), 20 mL sub-samples were formaldehyde fixed (2%) and filtered. Each sample was click processed, imaged, counted and measured. Images for the green channel were acquired with 50 ms exposure due to bright labeling of cells. Cell volume (V) and protein content (P) was calculated as above. After fluorescence background subtraction, sum intensities for the cells (of both isolates) were divided by volume-derived protein content (P) to obtain a conversion factor of fluorescence in units of sum intensity per fg protein. This value was multiplied by 20 to scale the 50 ms exposure to images acquired from the standard 1 s exposure used in natural assemblages. We concluded this intensity quantification was valid after measuring the intensity linearity of calibrated fluorescent beads. The average intensity:protein value of the top 10% most intensely labeled cells at T40 and T64 was calculated as a conversion factor. Here it was assumed that only the top 10% most intensely labeled cells were “saturated” with HPG.
The “isolates regression” approach used the cell signal intensities (from the experiment described above) and plotted these against the cell volume-derived protein content (P). A linear regression was fit to the data, and the inverse of the slope in terms of log10 RFU fg protein−1 was the calculated conversion factor. Here it was assumed that all cells, both faintly and brightly labeled, were saturated with HPG.
Lastly, the “community sum 35S-methionine” approach was calculated from two experiments that quantified parallel HPG labeling and 35S-methionine bulk incorporation. On two dates, 1 h incubations of Scripps Pier seawater with 2 nM 35S-methionine + 18 nM methionine were performed alongside separate 1 h incubations with 20 nM HPG. Bulk protein synthesis was calculated from 35S-methionine incorporation assuming zero isotope dilution and 2.2 mol%. The bulk assemblage HPG community sum (i.e., of ~ 1 × 10⁶ cells mL−1) was extrapolated from directly measured cells. First, the HPG labeling percentage (calculated via microscopy) was multiplied by the DAPI-based cell density to provide the number of HPG+ cells in the bulk assemblage. This was divided by the number of microscopy-based HPG+ cells to yield a proportional value that was multiplied by the community sum to yield the bulk assemblage community sum. It was then divided by the 35S-methionine bulk protein synthesis rate to provide a conversion factor in units of log10 RFU fg protein−1.
The “top 10% isolates mean” factor was applied to individual cell HPG intensities acquired from natural samples and other experiments to obtain single-cell protein production (scPP; fg cell−1 h−1).
Using the Method to Quantify Single Cell Activity
Sampling locations
Seawater was collected from the Ellen Browning Scripps Memorial Pier (32° 52.02′ N, 117° 15.43′ W; “Scripps Pier”). Measurement of environmental parameters including temperature, salinity, and chlorophyll fluorescence were conducted as part of the Southern California Coastal Ocean Observing System (SCCOOS; www.sccoos.org). In total, 21 samples were collected and processed.
Offshore samples were collected at 3, 30, and 60 m depth from the San Diego trough (32° 38.022′ N, 117° 34.034′ W) via Niskin bottles attached to a CTD rosette (Sea-Bird Electronics, Bellevue, WA).
Individual cell activity distribution
Comparison of HPG-based activity profiles among all the sampling dates was performed by plotting the frequency distributions of cell-specific protein production on log10-log10 axes. The percent cell labeling vs. fg cell−1 h−1 within 0.05 fg bins were fit to power-law functions for each sample, and the resulting equations were used to generate a linear regression by reorganizing the power law equation (y = AxB) into logarithmic form (log y = B log x + log A). This enabled B, the scaling exponent, to be used as the regression slope alongside A, the scaling factor, as the y-intercept.
Particle-attached bacteria
Duplicate 40 mL seawater samples were treated as follows: (i) 20 nM HPG, (ii) 20 nM HPG + 2% formaldehyde, (iii) 2 μM HPG, (iv) 2 μM HPG + 2% formaldehyde, and (v) no addition. Each was incubated for 1 h, 48 h, and 8 day. At each time point, 30 mL was removed, formaldehyde-fixed, and filtered onto 8 μm white polycarbonate filters (30 mL). Filters were click-processed, but filter-transfer-freeze was not applied to 8 μm filters (to minimize potential damage to particles and/or alteration of bacterial associations). Ten particles (>10 μm in diameter and containing at least 20 cells) were imaged on the 8 μm filters. Particle-attached cells were only measured and quantified if they were in focus, a characteristic of most particles observed in this study. Particles with high proportions of unfocused cells were not visualized, and those with few unfocused cells were visualized, but the cells were not analyzed.
Clonal isolates
Alteromonas spp. strains As1 and AltSIO were inoculated at ~103 cells mL−1 into GF/F filtered and autoclaved seawater. Through preliminary growth experiments in the same growth medium, it was determined that sampling would begin 16 h after inoculation to target the onset of exponential growth phase. One hour incubations amended with 20 nM HPG were carried out every hour from 16 to 22 h (duplicate with one control). Samples were fixed, filtered, stored, and then click- and filter-transfer-freeze processed as above. Images were acquired at 200 ms to maintain unsaturated pixels and signal intensities measured for each cell were multiplied by 5 for congruence with all samples.
Conflict of Interest Statement
The Reviewer Craig E. Nelson declares that, despite being affiliated to the same institution as the authors Ty J. Samo and Byron P. Sherwood, the review process was handled objectively and no conflict of interest exists. The authors declare that the research was conducted in the absence of any commercial or financial relationships that could be construed as a potential conflict of interest.
Supplementary Material
The Supplementary Material for this article can be found online at: http://www.frontiersin.org/journal/10.3389/fmars.2014.00048/abstract
Table S1. Setup of 20 incubations to measure 35S-methionine incorporation in the presence of homopropargylglycine (HPG).
Table S2. Raw data of all HPG-labeled cells analyzed in this study. Measurements include background subtracted sum intensity, cell dimensions (area, length, width, volume), calculated protein content, and conversion factor-based protein synthesis rate.
Figure S1. Percent HPG-labeling for cells visualized directly (filter) or after filter-transfer-freeze (FTF). Seawater samples were incubated with 20 nM HPG for 1 h. Bars represent SE.
Figure S2. Example images of DAPI-stained cells within radiographic emulsion for parallel HPG and 35S-methionine incubation experiments performed 17-Aug-2010 (A) or 11-Oct-2010 (B). Scale bars = 10 μm.
Figure S3. HPG percent labeling in bacterial assemblages collected on four dates from Scripps Pier under different amendment conditions and incubation times. No labeling occurred in HPG plus 1 μM methionine for two dates, as indicated by asterisks. HPG plus 2 μM methionine was tested only on 11-Oct-2010. Bars represent SE.
Figure S4. Disintegrations per minute (DPM) in seawater samples incubated with 2 nM 35S-methionine alone and with varying concentrations of HPG and/or cold methionine. Mean values for two replicates are shown; error bars represent SE of the mean.
Figure S5. Rank ordered plot of raw sum intensity values of all single cells measured in this study without background subtraction or protein conversion. Note: the “fixed” cells' values are not the size-normalized numbers used for background subtractions.
Figure S6. Distribution of HPG-based single-cell activity rates for all dates. Each point is calculated from one bacterium. Red bars represent the mean ± 95% confidence intervals. Blue bars are median values. Green bars are single-cell protein production rates calculated from bulk 35S-methionine incorporation (two samples).
Figure S7. Composite example images of HPG labeled (green) and DAPI-stained cells (blue) of the free-living (A) and particle-associated (B) communities following incubation for 1 h in 20 nM HPG. For comparison, the bottom row of images show fixed controls of free-living (C) and particle-associated (D) cells. Insets depict signal in the green channel only. Scale bars = 10 μm.
Figure S8. Individual cell HPG incorporation in clonal cultures of Alteromonas strains AltSIO (left) and As1 (right). Cultures were initiated in seawater at T = 0 h, and at each timepoint shown an aliquot was incubated for 1 h with HPG. Means are shown by red bars ± 95% confidence intervals. Blue dashed bars show medians. Note the different intervals between the top and bottom y-axis segments.
Figure S9. Simulated power law regressions showing effects of changes in scaling values on HPG activity structures.
References
Abbenante, G., Le, G. T., and Fairlie, D. P. (2007). Unexpected photolytic decomposition of alkyl azides under mild conditions. Chem. Commun. 4501–4503. doi: 10.1039/b708134k. Available online at: http://pubs.rsc.org/en/content/articlelanding/2007/cc/b708134k#!divAbstract
Agard, N. J., Prescher, J. A., and Bertozzi, C. R. (2004). A strain-promoted [3 + 2] azide-alkyne cycloaddition for covalent modification of biomolecules in living systems. J. Am. Chem. Soc. 126, 15046–15047. doi: 10.1021/ja044996f
Pubmed Abstract | Pubmed Full Text | CrossRef Full Text | Google Scholar
Azam, F., and Hodson, R. E. (1981). Multiphasic kinetics for D-glucose uptake by assemblages of natural marine bacteria. Mar. Ecol. Prog. Ser. 6, 213–222. doi: 10.3354/meps006213
Azam, F., and Long, R. A. (2001). Oceanography: sea snow microcosms. Nature 414, 495–498. doi: 10.1038/35107174
Pubmed Abstract | Pubmed Full Text | CrossRef Full Text | Google Scholar
Azam, F., and Worden, A. Z. (2004). Microbes, molecules, and marine ecosystems. Science 303, 1622–1624. doi: 10.1126/science.1093892
Pubmed Abstract | Pubmed Full Text | CrossRef Full Text | Google Scholar
Barbara, G. M., and Mitchell, J. G. (2003). Marine bacterial organisation around point-like sources of amino acids. FEMS Microbiol. Ecol. 43, 99–109. doi: 10.1111/j.1574-6941.2003.tb01049.x
Pubmed Abstract | Pubmed Full Text | CrossRef Full Text | Google Scholar
Baskin, J. M., Prescher, J. A., Laughlin, S. T., Agard, N. J., Chang, P. V., Miller, I. A., et al. (2007). Copper-free click chemistry for dynamic in vivo imaging. Proc. Natl. Acad. Sci. U.S.A. 104, 16793–16797. doi: 10.1073/pnas.0707090104
Pubmed Abstract | Pubmed Full Text | CrossRef Full Text | Google Scholar
Beatty, K. E., Xie, F., Wang, Q., and Tirrell, D. A. (2005). Selective dye-labeling of newly synthesized proteins in bacterial cells. J. Am. Chem. Soc. 127, 14150–14151. doi: 10.1021/ja054643w
Pubmed Abstract | Pubmed Full Text | CrossRef Full Text | Google Scholar
Best, M. D. (2009). Click chemistry and bioorthogonal reactions: unprecedented selectivity in the labeling of biological molecules. Biochemistry 48, 6571–6584. doi: 10.1021/bi9007726
Pubmed Abstract | Pubmed Full Text | CrossRef Full Text | Google Scholar
Bratbak, G. (1985). Bacterial biovolume and biomass estimations. Appl. Environ. Microbiol. 49, 1488–1493.
Copeland, R. A. (2005). Evaluation of Enzyme Inhibitors in Drug Discovery: A Guide for Medicinal Chemists and Pharmacologists. 1st Edn. Hoboken, NJ: Wiley-Interscience.
Cottrell, M. T., and Kirchman, D. L. (2003). Contribution of major bacterial groups to bacterial biomass production (thymidine and leucine incorporation) in the Delaware estuary. Limnol. Oceanogr. 48, 168–178. doi: 10.4319/lo.2003.48.1.0168
Cottrell, M. T., and Kirchman, D. L. (2004). Single-cell analysis of bacterial growth, cell size, and community structure in the Delaware estuary. Aquat. Microb. Ecol. 34, 139–149. doi: 10.3354/ame034139
del Giorgio, P. A., and Cole, J. J. (1998). Bacterial growth efficiency in natural aquatic systems. Annu. Rev. Ecol. Syst. 29, 503–541. doi: 10.1146/annurev.ecolsys.29.1.503
del Giorgio, P. A., Prairie, Y. T., and Bird, D. F. (1997). Coupling between rates of bacterial production and the abundance of metabolically active bacteria in lakes, enumerated using CTC reduction and flow cytometry. Microb. Ecol. 34, 144–154. doi: 10.1007/s002489900044
Pubmed Abstract | Pubmed Full Text | CrossRef Full Text | Google Scholar
Dieterich, D. C., Link, A. J., Graumann, J., Tirrell, D. A., and Schuman, E. M. (2006). Selective identification of newly synthesized proteins in mammalian cells using bioorthogonal noncanonical amino acid tagging (BONCAT). Proc. Natl. Acad. Sci. U.S.A. 103, 9482–9487. doi: 10.1073/pnas.0601637103
Pubmed Abstract | Pubmed Full Text | CrossRef Full Text | Google Scholar
Foster, R. A., Kuypers, M. M. M., Vagner, T., Paerl, R. W., Musat, N., and Zehr, J. P. (2011). Nitrogen fixation and transfer in open ocean diatom–cyanobacterial symbioses. ISME J. 5, 1484–1493. doi: 10.1038/ismej.2011.26
Pubmed Abstract | Pubmed Full Text | CrossRef Full Text | Google Scholar
Fuhrman, J. A., and Azam, F. (1982). Thymidine incorporation as a measure of heterotrophic bacterioplankton production in marine surface waters: evaluation and field results. Mar. Biol. 66, 109–120. doi: 10.1007/BF00397184
Fuhrman, J. A., Eppley, R. W., Hagström, Å., and Azam, F. (1985). Diel variations in bacterioplankton, phytoplankton, and related parameters in the Southern California Bight. Mar. Ecol. Prog. Ser. 27, 9–20. doi: 10.3354/meps027009
Galand, P. E., Alonso-Saez, L., Bertilsson, S., Lovejoy, C., and Casamayor, E. O. (2013). Contrasting activity patterns determined by BrdU incorporation in bacterial ribotypes from the Arctic Ocean in winter. Front. Microbiol. 4:118. doi: 10.3389/fmicb.2013.00118.
Pubmed Abstract | Pubmed Full Text | CrossRef Full Text | Google Scholar
Gasol, J. M., Del Giorgio, P. A., Massana, R., and Duarte, C. M. (1995). Active versus inactive bacteria: size-dependence in a coastal marine plankton community. Mar. Ecol. Prog. Ser. Oldendorf 128, 91–97. doi: 10.3354/meps128091
Gibbons, S. M., Caporaso, J. G., Pirrung, M., Field, D., Knight, R., and Gilbert, J. A. (2013). Evidence for a persistent microbial seed bank throughout the global ocean. Proc. Natl. Acad. Sci. U.S.A. 110, 4651–4655. doi: 10.1073/pnas.1217767110
Pubmed Abstract | Pubmed Full Text | CrossRef Full Text | Google Scholar
Glöckner, F. O., Amann, R., Alfreider, A., Pernthaler, J., Psenner, R., Trebesius, K., et al. (1996). An in situ hybridization protocol for detection and identification of planktonic bacteria. Syst. Appl. Microbiol. 19, 403–406. doi: 10.1016/S0723-2020(96)80069-5
Pubmed Abstract | Pubmed Full Text | CrossRef Full Text | Google Scholar
Grégori, G., Citterio, S., Ghiani, A., Labra, M., Sgorbati, S., Brown, S., et al. (2001). Resolution of viable and membrane-compromised bacteria in freshwater and marine waters based on analytical flow cytometry and nucleic acid double staining. Appl. Environ. Microbiol. 67, 4662–4670. doi: 10.1128/AEM.67.10.4662-4670.2001
Pubmed Abstract | Pubmed Full Text | CrossRef Full Text | Google Scholar
Gundersen, K., Heldal, M., Norland, S., Purdie, D. A., and Knap, A. H. (2002). Elemental C, N, and P cell content of individual bacteria collected at the Bermuda Atlantic Time-Series Study (BATS) site. Limnol. Oceanogr. 47, 1525–1530. doi: 10.4319/lo.2002.47.5.1525
Hamasaki, K., Long, R. A., and Azam, F. (2004). Individual cell growth rates of marine bacteria, measured by bromodeoxyuridine incorporation. Aquat. Microb. Ecol. 35:217. doi: 10.3354/ame035217
Hatzenpichler, R., Scheller, S., Tavormina, P. L., Babin, B. M., Tirrell, D. A., and Orphan, V. J. (2014). In situ visualization of newly synthesized proteins in environmental microbes using amino acid tagging and click chemistry. Environ. Microbiol. 16, 2568–2590. doi: 10.1111/1462-2920.12436
Pubmed Abstract | Pubmed Full Text | CrossRef Full Text | Google Scholar
Hewes, C. D., and Holm-Hansen, O. (1983). A method for recovering nanoplankton from filters for identification with the microscope: the filter-transfer-freeze (FTF) technique. Limnol. Oceanogr. 28, 389–394. doi: 10.4319/lo.1983.28.2.0389
Hong, V., Presolski, S. I., Ma, C., and Finn, M. G. (2009). Analysis and optimization of copper-catalyzed azide–alkyne cycloaddition for bioconjugation. Angew. Chem. Int. Ed. Engl. 48, 9879–9883. doi: 10.1002/anie.200905087
Pubmed Abstract | Pubmed Full Text | CrossRef Full Text | Google Scholar
Kalyuzhnaya, M. G., Lidstrom, M. E., and Chistoserdova, L. (2008). Real-time detection of actively metabolizing microbes by redox sensing as applied to methylotroph populations in Lake Washington. ISME J. 2, 696–706. doi: 10.1038/ismej.2008.32
Pubmed Abstract | Pubmed Full Text | CrossRef Full Text | Google Scholar
Kiick, K. L., Saxon, E., Tirrell, D. A., and Bertozzi, C. R. (2002). Incorporation of azides into recombinant proteins for chemoselective modification by the Staudinger ligation. Proc. Natl. Acad. Sci. U.S.A. 99, 19–24. doi: 10.1073/pnas.012583299
Pubmed Abstract | Pubmed Full Text | CrossRef Full Text | Google Scholar
Kiørboe, T., and Jackson, G. A. (2001). Marine snow, organic solute plumes, and optimal chemosensory behavior of bacteria. Limnol. Oceanogr. 46, 1309–1318. doi: 10.4319/lo.2001.46.6.1309
Kirchman, D., and Mitchell, R. (1982). Contribution of particle-bound bacteria to total microheterotrophic activity in five ponds and two marshes. Appl. Environ. Microbiol. 43, 200–209.
Lauro, F. M., McDougald, D., Thomas, T., Williams, T. J., Egan, S., Rice, S., et al. (2009). The genomic basis of trophic strategy in marine bacteria. Proc. Natl. Acad. Sci. U.S.A. 106, 15527–15533. doi: 10.1073/pnas.0903507106
Pubmed Abstract | Pubmed Full Text | CrossRef Full Text | Google Scholar
Lebaron, P., Catala, P., and Parthuisot, N. (1998). Effectiveness of SYTOX green stain for bacterial viability assessment. Appl. Environ. Microbiol. 64, 2697–2700.
Lebaron, P., Servais, P., Baudoux, A.-C., Bourrain, M., Courties, C., and Parthuisot, N. (2002). Variations of bacterial-specific activity with cell size and nucleic acid content assessed by flow cytometry. Aquat. Microb. Ecol. 28, 131–140. doi: 10.3354/ame028131
Lee, S., and Fuhrman, J. A. (1987). Relationships between biovolume and biomass of naturally derived marine bacterioplankton. Appl. Environ. Microbiol. 53, 1298–1303.
Long, R. A., and Azam, F. (2001a). Antagonistic interactions among marine pelagic bacteria. Appl. Environ. Microbiol. 67, 4975–4983. doi: 10.1128/AEM.67.11.4975-4983.2001
Pubmed Abstract | Pubmed Full Text | CrossRef Full Text | Google Scholar
Long, R. A., and Azam, F. (2001b). Microscale patchiness of bacterioplankton assemblage richness in seawater. Aquat. Microb. Ecol. 26:103. doi: 10.3354/ame026103
Longnecker, K., Wilson, M., Sherr, E., and Sherr, B. (2010). Effect of top-down control on cell-specific activity and diversity of active marine bacterioplankton. Aquat. Microb. Ecol. 58, 153–165. doi: 10.3354/ame01366
Mague, T. H., Friberg, E., Hughes, D. J., and Morris, I. (1980). Extracellular release of carbon by marine phytoplankton; a physiological approach. Limnol. Oceanogr. 25, 262–279. doi: 10.4319/lo.1980.25.2.0262
Malfatti, F., Samo, T. J., and Azam, F. (2009). High-resolution imaging of pelagic bacteria by Atomic Force Microscopy and implications for carbon cycling. ISME J. 4, 427–439. doi: 10.1038/ismej.2009.116
Pubmed Abstract | Pubmed Full Text | CrossRef Full Text | Google Scholar
Moura, A., Savageau, M. A., and Alves, R. (2013). Relative amino acid composition signatures of organisms and environments. PLoS ONE 8:e77319. doi: 10.1371/journal.pone.0077319
Pubmed Abstract | Pubmed Full Text | CrossRef Full Text | Google Scholar
Musat, N., Foster, R., Vagner, T., Adam, B., and Kuypers, M. M. M. (2012). Detecting metabolic activities in single cells, with emphasis on nanoSIMS. FEMS Microbiol. Rev. 36, 486–511. doi: 10.1111/j.1574-6976.2011.00303.x
Pubmed Abstract | Pubmed Full Text | CrossRef Full Text | Google Scholar
Nelson, C. E., and Carlson, C. A. (2012). Tracking differential incorporation of dissolved organic carbon types among diverse lineages of Sargasso Sea bacterioplankton. Environ. Microbiol. 14, 1500–1516. doi: 10.1111/j.1462-2920.2012.02738.x
Pubmed Abstract | Pubmed Full Text | CrossRef Full Text | Google Scholar
Nikrad, M. P., Cottrell, M. T., and Kirchman, D. L. (2012). Abundance and single-cell activity of heterotrophic bacterial groups in the Western Arctic Ocean in summer and winter. Appl. Environ. Microbiol. 78, 2402–2409. doi: 10.1128/AEM.07130-11
Pubmed Abstract | Pubmed Full Text | CrossRef Full Text | Google Scholar
Orphan, V. J., House, C. H., Hinrichs, K.-U., McKeegan, K. D., and DeLong, E. F. (2002). Multiple archaeal groups mediate methane oxidation in anoxic cold seep sediments. Proc. Natl. Acad. Sci. U.S.A. 99, 7663–7668. doi: 10.1073/pnas.072210299
Pubmed Abstract | Pubmed Full Text | CrossRef Full Text | Google Scholar
Paerl, H. W. (1984). Alteration of microbial metabolic activities in association with detritus. Bull. Mar. Sci. 35, 393–408.
Patel, A., Noble, R. T., Steele, J. A., Schwalbach, M. S., Hewson, I., and Fuhrman, J. A. (2007). Virus and prokaryote enumeration from planktonic aquatic environments by epifluorescence microscopy with SYBR Green I. Nat. Protoc. 2, 269–276. doi: 10.1038/nprot.2007.6
Pubmed Abstract | Pubmed Full Text | CrossRef Full Text | Google Scholar
Pedler, B. E., Aluwihare, L. I., and Azam, F. (2014). Single bacterial strain capable of significant contribution to carbon cycling in the surface ocean. Proc. Natl. Acad. Sci. U.S.A. 111, 7202–7207. doi: 10.1073/pnas.1401887111
Pubmed Abstract | Pubmed Full Text | CrossRef Full Text | Google Scholar
Pernthaler, A., and Amann, R. (2004). Simultaneous fluorescence in situ hybridization of mRNA and rRNA in environmental bacteria. Appl. Environ. Microbiol. 70, 5426–5433. doi: 10.1128/AEM.70.9.5426-5433.2004
Pubmed Abstract | Pubmed Full Text | CrossRef Full Text | Google Scholar
Pernthaler, A., Pernthaler, J., Schattenhofer, M., and Amann, R. (2002). Identification of DNA-synthesizing bacterial cells in coastal north sea plankton. Appl. Environ. Microbiol. 68, 5728–5736. doi: 10.1128/AEM.68.11.5728-5736.2002
Pubmed Abstract | Pubmed Full Text | CrossRef Full Text | Google Scholar
Rang, C. U., Peng, A. Y., and Chao, L. (2011). Temporal dynamics of bacterial aging and rejuvenation. Curr. Biol. 21, 1813–1816. doi: 10.1016/j.cub.2011.09.018
Pubmed Abstract | Pubmed Full Text | CrossRef Full Text | Google Scholar
Rostovtsev, V. V., Green, L. G., Fokin, V. V., and Sharpless, K. B. (2002). A stepwise huisgen cycloaddition process: copper(I)-catalyzed regioselective “ligation” of azides and terminal alkynes. Angew. Chem. Int. Ed. Engl. 41, 2596–2599. doi: 10.1002/1521-3773(20020715)41:14<2596::AID-ANIE2596>3.0.CO;2-4
Pubmed Abstract | Pubmed Full Text | CrossRef Full Text | Google Scholar
Roszak, D. B., and Colwell, R. R. (1987). Survival strategies of bacteria in the natural environment. Microbiol. Rev. 51, 365–379.
Saier, M. H. (2008). The bacterial chromosome. Crit. Rev. Biochem. Mol. Biol. 43, 89–134. doi: 10.1080/10409230801921262
Pubmed Abstract | Pubmed Full Text | CrossRef Full Text | Google Scholar
Salic, A., and Mitchison, T. J. (2008). A chemical method for fast and sensitive detection of DNA synthesis in vivo. Proc. Natl. Acad. Sci. U.S.A. 105, 2415–2420. doi: 10.1073/pnas.0712168105
Pubmed Abstract | Pubmed Full Text | CrossRef Full Text | Google Scholar
Sarmento, H., and Gasol, J. M. (2012). Use of phytoplankton-derived dissolved organic carbon by different types of bacterioplankton. Environ. Microbiol. 14, 2348–2360. doi: 10.1111/j.1462-2920.2012.02787.x
Pubmed Abstract | Pubmed Full Text | CrossRef Full Text | Google Scholar
Schumann, R., Schiewer, U., Karsten, U., and Rieling, T. (2003). Viability of bacteria from different aquatic habitats. II. Cellular fluorescent markers for membrane integrity and metabolic activity. Aquat. Microb. Ecol. 32, 137–150. doi: 10.3354/ame032137
Seymour, J. R., Seuront, L., and Mitchell, J. G. (2005). Microscale and small-scale temporal dynamics of a coastal planktonic microbial community. Mar. Ecol. Prog. Ser. 300, 21–37. doi: 10.3354/meps300021
Simon, M., and Azam, F. (1989). Protein content and protein synthesis rates of planktonic marine bacteria. Mar. Ecol. Prog. Ser. 51, 201–213. doi: 10.3354/meps051201
Pubmed Abstract | Pubmed Full Text | CrossRef Full Text | Google Scholar
Sintes, E., and Herndl, G. J. (2006). Quantifying substrate uptake by individual cells of marine bacterioplankton by catalyzed reporter deposition fluorescence in situ hybridization combined with microautoradiography. Appl. Environ. Microbiol. 72, 7022–7028. doi: 10.1128/AEM.00763-06
Pubmed Abstract | Pubmed Full Text | CrossRef Full Text | Google Scholar
Smith, D. C., and Azam, F. (1992). A simple, economical method for measuring bacterial protein synthesis rates in seawater using 3H-leucine. Mar. Microb. Food Webs 6, 107–114.
Smith, D. C., Simon, M., Alldredge, A. L., and Azam, F. (1992). Intense hydrolytic enzyme activity on marine aggregates and implications for rapid particle dissolution. Nature 359, 139–142. doi: 10.1038/359139a0
Smith, E. M., and del Giorgio, P. A. (2003). Low fractions of active bacteria in natural aquatic communities? Aquat. Microb. Ecol. 31, 203–208. doi: 10.3354/ame031203
Smriga, S., Samo, T., Malfatti, F., Villareal, J., and Azam, F. (2014). Individual cell DNA synthesis within natural marine bacterial assemblages as detected by “click” chemistry. Aquat. Microb. Ecol. 72, 269–280. doi: 10.3354/ame01698
Sogin, M. L., Morrison, H. G., Huber, J. A., Welch, D. M., Huse, S. M., Neal, P. R., et al. (2006). Microbial diversity in the deep sea and the underexplored “rare biosphere.” Proc. Natl. Acad. Sci. U.S.A. 103, 12115–12120. doi: 10.1073/pnas.0605127103
Pubmed Abstract | Pubmed Full Text | CrossRef Full Text | Google Scholar
Tada, Y., Taniguchi, A., and Hamasaki, K. (2010). Phylotype-specific growth rates of marine bacteria measured by bromodeoxyuridine immunocytochemistry and fluorescence in situ hybridization. Aquat. Microb. Ecol. 59, 229–238. doi: 10.3354/ame01412
Teira, E., Reinthaler, T., Pernthaler, A., Pernthaler, J., and Herndl, G. J. (2004). Combining catalyzed reporter deposition-fluorescence in situ hybridization and microautoradiography to detect substrate utilization by bacteria and archaea in the deep ocean. Appl. Environ. Microbiol. 70, 4411–4414. doi: 10.1128/AEM.70.7.4411-4414.2004
Pubmed Abstract | Pubmed Full Text | CrossRef Full Text | Google Scholar
Terrado, R., Lovejoy, C., Massana, R., and Vincent, W. F. (2008). Microbial food web responses to light and nutrients beneath the coastal Arctic Ocean sea ice during the winter–spring transition. J. Mar. Syst. 74, 964–977. doi: 10.1016/j.jmarsys.2007.11.001
Thingstad, T. F. (2000). Elements of a theory for the mechanisms controlling abundance, diversity, and biogeochemical role of lytic bacterial viruses in aquatic systems. Limnol. Oceanogr. 45, 1320–1328. doi: 10.4319/lo.2000.45.6.1320
tom Dieck, S., Müller, A., Nehring, A., Hinz, F. I., Bartnik, I., Schuman, E. M., et al. (2012). Metabolic labeling with noncanonical amino acids and visualization by chemoselective fluorescent tagging. Curr. Protoc. Cell Biol. 56, 7.11.1–7.11.29. doi: 10.1002/0471143030.cb0711s56
Pubmed Abstract | Pubmed Full Text | CrossRef Full Text | Google Scholar
Tornøe, C. W., Christensen, C., and Meldal, M. (2002). Peptidotriazoles on solid phase: [1,2,3]-triazoles by regiospecific copper(I)-catalyzed 1,3-dipolar cycloadditions of terminal alkynes to azides. J. Org. Chem. 67, 3057–3064. doi: 10.1021/jo011148j
Pubmed Abstract | Pubmed Full Text | CrossRef Full Text | Google Scholar
Udwary, D. W., Zeigler, L., Asolkar, R. N., Singan, V., Lapidus, A., Fenical, W., et al. (2007). Genome sequencing reveals complex secondary metabolome in the marine actinomycete Salinispora tropica. Proc. Natl. Acad. Sci. U.S.A. 104, 10376–10381. doi: 10.1073/pnas.0700962104
Pubmed Abstract | Pubmed Full Text | CrossRef Full Text | Google Scholar
Verdugo, P., Alldredge, A. L., Azam, F., Kirchman, D. L., Passow, U., and Santschi, P. H. (2004). The oceanic gel phase: a bridge in the DOM–POM continuum. Mar. Chem. 92, 67–85. doi: 10.1016/j.marchem.2004.06.017
Wang, A., Winblade Nairn, N., Johnson, R. S., Tirrell, D. A., and Grabstein, K. (2008). Processing of N-terminal unnatural amino acids in recombinant human interferon-β in Escherichia coli. Chembiochem 9, 324–330. doi: 10.1002/cbic.200700379
Pubmed Abstract | Pubmed Full Text | CrossRef Full Text | Google Scholar
Zubkov, M. V., Tarran, G. A., and Fuchs, B. M. (2004). Depth related amino acid uptake by Prochlorococcus cyanobacteria in the Southern Atlantic tropical gyre. FEMS Microbiol. Ecol. 50, 153–161. doi: 10.1016/j.femsec.2004.06.009
Pubmed Abstract | Pubmed Full Text | CrossRef Full Text | Google Scholar
Keywords: marine bacteria, microscopy, click chemistry, HPG, single-cell protein production, ecology, oceanography, biogeochemistry
Citation: Samo TJ, Smriga S, Malfatti F, Sherwood BP and Azam F (2014) Broad distribution and high proportion of protein synthesis active marine bacteria revealed by click chemistry at the single cell level. Front. Mar. Sci. 1:48. doi: 10.3389/fmars.2014.00048
Received: 05 April 2014; Accepted: 16 September 2014;
Published online: 10 October 2014.
Edited by:
Hongyue Dang, Xiamen University, ChinaReviewed by:
Gerhard Josef Herndl, University of Vienna, AustriaCraig E. Nelson, University of Hawaii at Manoa, USA
Copyright © 2014 Samo, Smriga, Malfatti, Sherwood and Azam. This is an open-access article distributed under the terms of the Creative Commons Attribution License (CC BY). The use, distribution or reproduction in other forums is permitted, provided the original author(s) or licensor are credited and that the original publication in this journal is cited, in accordance with accepted academic practice. No use, distribution or reproduction is permitted which does not comply with these terms.
*Correspondence: Ty J. Samo, Department of Oceanography, Center for Microbial Oceanography: Research and Education, School of Ocean and Earth Science and Technology, University of Hawaii at Manoa, 1950 East-West Rd., Honolulu, HI 96822, USA e-mail: tsamo@hawaii.edu
†Present address: Steven Smriga, Ralph M. Parsons Laboratory, Department of Civil and Environmental Engineering, Massachusetts Institute of Technology, Cambridge, USA
Francesca Malfatti, Oceanography Section (OCE), National Institute of Oceanography and Experimental Geophysics (OGS), Trieste, Italy
Byron P. Sherwood, Department of Oceanography, Center for Microbial Oceanography: Research and Education, School of Ocean and Earth Science and Technology, University of Hawai'i at Mânoa, Honolulu, USA