 Engielle M. R. Paguican
 Marcus I. Bursik
- 1Department of Geology, University at Buffalo, The State University of New York, Buffalo, NY, USA
- 2Department of Geography, Earth System Sciences, Vrije Universiteit Brussel, Brussels, Belgium
The eastern boundary of the Southern Cascades (Hat Creek Graben region), California, USA, is an extensively faulted volcanic corridor between the Cascade Range and Modoc Plateau. The morphology of the region is a result of plate motions associated with different tectonic provinces, faulting, and recurring volcanic activity, making it an ideal place to study the interrelationship between tectonics, volcanoes, and geomorphology. We use the morphometry and spatial distribution of volcanoes and their interaction with regional structures to understand how long term regional deformation can affect volcano evolution. A database of volcanic centers and structures was created from interpretations of digital elevation models. Volcanic centers were classified by morphological type into cones, sub-cones, shields and massifs. A second classification by height separated the larger and smaller edifices, and revealed an evolutionary trend. Poisson Nearest Neighbor analysis showed that bigger volcanoes are spatially dispersed while smaller ones are clustered. Using volcano centroid locations, about 90 lineaments consisting of at least three centers within 6 km of one another were found, revealing that preferential north-northwest directed pathways control the transport of magma from the source to the surface, consistent with the strikes of the major fault systems. Most of the volcano crater and collapse scar openings are perpendicular to the north northwest-directed maximum horizontal stress, expected for extensional environments with dominant normal faulting. Early in the history of a volcano or volcano cluster, melt propagates to the surface using the easiest and most efficient pathway, mostly controlled by the pre-existing normal faults and near-surface stress fields, as indicated by the pervasive vent alignments. Volcano growth continues to be dependent on the regional structures as indicated by the opening directions, suggesting structural control on the growth of the volcanic edifices. The results present a particularly well-defined case in which extension of a volcanic region is accommodated mostly by faulting, and only partly by intrusion to form volcanoes. This is attributed to a low magma supply rate.
1. Introduction
Volcanoes occur in a wide variety of shapes and sizes as a result of the interaction of constructive and destructive geological and environmental processes. The quantitative description of volcano morphology, called volcano morphometry, is a systematic way to characterize the morphology of volcano edifices, allowing for the extraction of information on the processes that interact and factors that control growth history and evolution (Grosse et al., 2012, 2014). At the same time, describing a volcanic field in which volcanoes grow is essential for characterizing key controls on volcano growth in space, which reflects the pathway used by magma to reach the surface, and the existence of any dominantly controlling factor that may have created preferential pathways (Le Corvec et al., 2013). At the surface and through time, the growth or destruction of a volcano is influenced by the volcano-tectonic setting of the region. Studies looking at the influence of regional stress on the direction of sector-collapse and debris-avalanche amphitheater opening have been done for Southeast Asian volcanoes in tectonic settings dominated by strike-slip faults, particularly those in the Philippines, by Lagmay and Valdivia (2006), Japan by Ui et al. (1986), and Indonesia by Bahar and Girod (1983), which showed that the opening direction of such features is at an acute angle relative to the regional maximum horizontal stress. Their results are in disagreement with earlier models by Moriya (1980), Siebert (1984), and Nakamura (1977), which show volcano openings perpendicular to the maximum horizontal stress being more prevalent in extensional regions (Tibaldi, 1995), where tabular conduits and dikes that propagate along normal faults promote collapses perpendicular to the regional maximum horizontal stress. This difference in results may be due to differences in the underlying fault kinematics, the resulting geometry of large-scale sliding and debris avalanching, original crater opening direction due to temporal and topographic stress-field control within a volcanic body (Ui et al., 1986), a dipping substrate, or a spreading basement.
The eastern boundary of the Southern Cascades (herein referred to as the Hat Creek Graben region) in California is an extensively faulted volcanic corridor with spectacular, high, steep scarps in a bedrock of late Tertiary and Quaternary volcanic and sedimentary deposits (Wills, 1991; Muffler et al., 1994; Blakely et al., 1997). It is at the boundary between two distinct geologic and geomorphic provinces (Jenkins, 1938), the Cascade Range on the west and the Modoc Plateau on the east, between Mt. Shasta and Lassen Peak on the north and south, respectively. It is in the transition zone between several significant volcanic and tectonic provinces, including the east-west convergence and subduction of the Gorda Plate underneath the North American Plate, the current north-south shortening within the Klamath Mountain Region on the northwest, and the region of east-west extensional faulting that produced the dominant north- to northwest- striking normal faults, forming the horst and graben topography and voluminous basaltic volcanism (White and Crider, 2006). Volcano morphology is a result of recurring volcanic activity within this diverse tectonic setting, from more than 500 vents over the past 7 Ma (Muffler et al., 1994), making it an important place to study the long-term interrelationship between tectonics, geomorphology, and volcanic activity. Many studies have recently explored the importance of magma in shaping divergent plate boundaries (Wright et al., 2006; Ebinger et al., 2010; Sigmundsson et al., 2015; Acocella and Trippanera, 2016), and here we seek to discern whether some of these ideas also apply to intraplate magmatic provinces experiencing extension, such as the Hat Creek Graben region.
This study aims to provide a tectonic-geomorphic interpretation of the eastern boundary of the southern Cascades—the Hat Creek Graben region. It is hoped that the results will aid in producing a more refined understanding of regional volcano-tectonic interaction and history, which may help guide future hazard assessment. We explore the overall geomorphology and activity of individual volcanoes and the potential effects of regional stress regimes. We characterize local structures within each volcano, and compare the trend of volcano erosional and collapse scars with features in the basement faults, and regional maximum horizontal stress. We furthermore attempt to refine our understanding of the probable kinematics of underlying faults that may cause volcano instability.
2. Regional Tectonic Setting and Fault Systems
The tectonics of the Hat Creek Graben region (Figure 1A) is dominated by the convergence of the Pacific, Juan de Fuca, Gorda and North American Plates; the rigid block of the Sierran Microplate; and the dominantly extensional western Basin and Range (Hammond and Thatcher, 2005). Subduction of the Juan de Fuca and Gorda Plates underneath the North American Plate forms the Cascadia Subduction Zone and the associated Cascade Arc volcanoes. To the south, the Sierran Microplate behaves as a rigid block that, due to the faster rate of right-lateral shear on its western side, accommodated by the right-lateral San Andreas Transform Fault and associated structures (Dixon et al., 2000; Faulds et al., 2005), is translated northward. This causes compression (north-south shortening) in the Klamath Mountains region on the northwest (McCaffrey, 2005). Furthermore, the motion of the Sierran Microplate contributes to the clockwise rotation of the Oregon forearc, where the Sierran Microplate and Cascadia forearc blocks meet (McCaffrey, 2005). On the eastern boundary of the Sierran Microplate, the Walker Lane accommodates some 15–25% of the total relative plate motion (Faulds et al., 2005), with GPS measured strain rates of about 11 mm yr−1 (Dokka and Travis, 1990; Argus and Gordon, 1991; Sauber et al., 1994; Bennett et al., 1999; Dixon et al., 2000; Hammond and Thatcher, 2007). Some of the right-lateral shear related to relative Pacific and North American plate motion is accommodated within the Hat Creek Graben region, and connects with poorly defined zones of deformation between the Gorda, Pacific, and North American plates near the Klamath Mountains (Miller et al., 2001). Crustal stresses related to the complex block motions and volcanic processes drive regional seismicity, and the observed patterns of faulting of the Hat Creek Graben region.
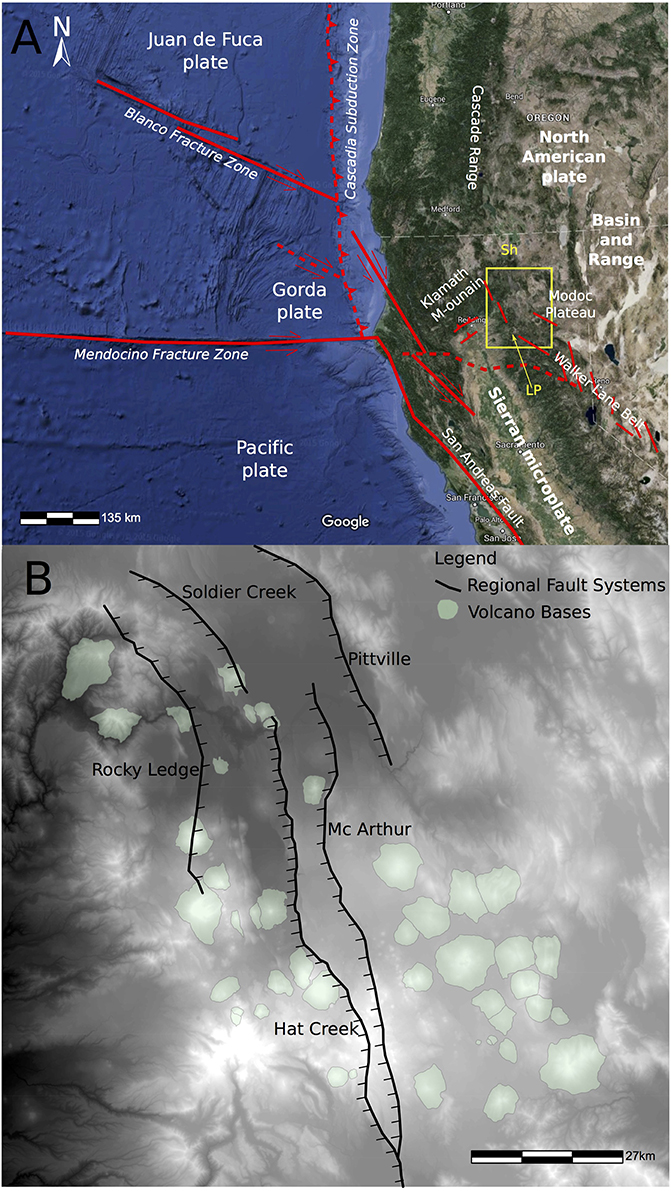
Figure 1. (A) Regional tectonic setting of the eastern boundary of the Southern Cascades (Hat Creek Graben region), California, is dominated by the convergence of the Pacific, Juan de Fuca, Gorda, and North American Plates resulting in the formation of the Cascadia Subduction Zone and its associated Cascade Arc Volcano with Lassen Peak (LP) as its southernmost volcano; the rigid block of the Sierran Microplate that acts like a piston compressing the Klamath Mountain on the northern boundary and creating the Ink Creek Fold Belt southwest of Lassen Peak; the Oregon forearc where the Sierran Microplate and Cascadia forearc blocks meet; the dominantly extensional western Basin and Range Region and Walker Lane; and the Hat Creek Graben region (yellow box) that includes the area south of Mt. Shasta (Sh), Pit River Region, Mushroom Rock Anticline, Cinder Butte, Butte Creek, Bald Mountain, Big Lake, Brushy Butte, and Fall River Valley. Modified from Faulds et al. (2005) and Austin (2013). (B) General distribution of the regional fault systems and volcanoes.
Fault scarps are prominent in the Hat Creek Graben region, especially in places where they displace resistant Pliocene to early Pleistocene basalt, with up to millions of years of accumulated offset (Blakeslee and Kattenhorn, 2013). Major fault systems (Figure 1B) identified and described by previous workers include the Hat Creek, Rocky Ledge, McArthur, Soldier Creek, and Pittville Fault Systems.
The Hat Creek Fault System is a late Pleistocene to Holocene (Parrish, 2006; U.S. Geological Survey and California Geological Survey, 2006; Muffler et al., 2010), 47-km long, up to 490-m high, west-facing escarpment along the east side of Hat Creek Valley (Blakeslee and Kattenhorn, 2013). It has a slip rate of about 1-3.6 mm yr−1, and is capable of producing an earthquake of moment magnitude about 6.7, with a recurrence interval of 667 ± 167 yr (Wills, 1991; Blakeslee and Kattenhorn, 2013). The Hat Creek Fault has a component of right-lateral offset along with normal offset (Wills, 1991), with segments connected by relay ramps and monoclines (Muffler et al., 1994). Due to sporadic volcanic activity, surface rupture along the Hat Creek fault has progressively migrated westward since the Late Pleistocene, with older scarps successively abandoned (Blakeslee and Kattenhorn, 2013). North of the Pit River, slip of the Hat Creek Fault probably transfers to the Soldier Creek Fault, which displaces a 1.2 Ma basalt by more than 260 m, giving a long-term vertical separation rate of 0.22 mm yr−1. On the western edge of Hat Creek valley is the 9 km long, north-trending and east-facing Rocky Ledge Fault System. It has a component of right-lateral motion on a dominantly normal structure. The strike-slip component is consistent with the northwest propagation of the Walker Lane Belt, with suggested Holocene activity (Wills, 1991; Austin, 2013). The Rocky Ledge Fault System has an average slip rate of 0.4 ±0.2 mm yr−1, an order magnitude less than the late Quaternary slip rate on the Hat Creek Fault (Sawyer and Ramelli, 2012). East of and parallel to the Hat Creek fault zone, there are normal faults with a right-lateral component, as well as the west-facing scarps of the McArthur Fault Zone. A steep scarp in alluvium with very weak soil development, a large closed depression that flanks a west-facing scarp in alluvium south of Big Lake, and tonal lineaments in plowed fields indicate Holocene offset along this fault (Wills, 1991). The more northwesterly Pittville Fault extends for about 48 km to the southeast, partly controlling the course of the Pit River and offsetting Brushy Butte, the volcanic center north of Big Lake (Peterson and Martin, 1980). Recent movements are indicated North of the Pit River Valley, where the fault forms a 1–3 m scarp in Late Pleistocene basalt, with open fissures up to 2 m deep on the upthrown side.
3. Methodology
Shuttle Radar Topography Mission (SRTM), higher-resolution, local LiDAR, and 10-m spacing National Elevation Data (NED) (Gesch et al., 2002) were used in the present study. NED data, covering the area of the Southern Cascades from 40.22 to 41.33 N and 122.08 to 120.22 W in decimal degrees, were acquired from the USGS National Map website (http://ned.usgs.gov), and were the primary dataset used for mapping and interpreting the overall tectonics, geomorphology and volcano distribution. In addition, Landsat satellite images, which have been used to study remote active volcanoes and to map basaltic volcanic fields (Francis and Wells, 1988), were downloaded. The elevation data were loaded in ArcGIS® software and saved as an ENVI compatible file for processing and topographic modeling.
3.1. Topographic Modeling, and Structural and Geomorphological Interpretation
Topographic modeling techniques were applied to the DEM using RSI ENVI® software generated surface parameters, including shaded relief, slope, and aspect maps. Landsat 7 Thematic Mapper Plus (ETM+) and panchromatic band 8 images were processed to combine bands and obtain maximum contrast to check surface features and deposits observed in the DEM. Generated images were compiled using ArcGIS® software.
Geomorphic features, including volcanic, tectonic, and volcano-tectonic features such as volcano edifices, cone and lava fields, and faults, as well as features resulting from gravitational instability and erosion were visually interpreted and described from the images. Interpretations were checked in the field. Structural analysis of the elevation dataset was based on the interpretation of rectilinear features or lineaments of regional scale. Lineaments consist of sharp tonal differences and alignments of geomorphological features like cones, streams and rivers, ridges and crests. Within tectonically active areas such as the Hat Creek Graben region, lineaments usually coincide with the fracture network and the major fracture patterns. Volcanoes are identified from descriptions in previous literature and visually interpreted by their positive relief with a circular or elongated shape, and may have a small crater near the summit. Volcano bases were manually delineated, by following the break in slope around the edifice base. Thus, only the objectively definable, visible edifice was traced and far-reaching fall and flow products were not considered in the delineation. Main lineament directions and volcano base elongations were then defined by the azimuth frequency distribution plotted on rose diagrams. Terrain modeling, geomorphological interpretation, and geomorphometry were then combined to interpret the relationships between the regional stress, basement faults, and volcanoes.
3.2. Volcano Morphometry
Individual volcano base and crater shapefiles were extracted as regions of interest from the DEM and processed using MORVOLC to generate a quantitative characterization of each individual edifice, and to develop a systematic way to compare the edifices. MORVOLC (Grosse et al., 2009) is an IDL-based code that generates a database of quantitative descriptions of the size (height, width, and volume), planview shape (ellipticity and irregularity), and profile shape (height-width ratio, summit width to basal width ratio, and slope) of stratovolcanoes and cones. Morphometric analysis can provide clues to the processes that interact during the growth history, development and evolution of each volcano, and can be used to draw an evolutionary trend for volcanoes in a region. MORVOLC calculates a 3D basal surface from the edifice outline using a least-squares criterion, which was used to estimate the volume and height parameters. Elevation contour lines were then generated from the DEM, and a summit region was defined at the elevation where the edifice starts flattening out.
3.3. Volcano Spatial Distribution and Alignments
MORVOLC generated the geographic coordinates of volcano summits that we used as the volcano centroids. These point data sets were used as input information for running the Geological Image Analysis Software (GIAS, www.geoanalysis.org) code in Matlab developed by Beggan and Hamilton (2010). GIAS evaluates the amount of randomness or any patterns of a spatial distribution of points by comparing the mean distance between all the nearest neighbors in the population with those defined by an idealized statistical model (Clark and Evans, 1954), Poisson Nearest Neighbor Analysis is preferred, in the present case. The nearest neighbor distances are determined both for the observed and expected distribution and then their mean distances are calculated to obtain the population-dependent R0 and Re (Baloga et al., 2007), respectively. Our observed population consists of the number of volcanoes per subgroup based on their morphometric class. The sample area is a convex hull generated by connecting the outermost points of the population (Hamilton et al., 2010; Le Corvec et al., 2013). To overcome the sample-dependent bias and properly assess the suitability of the PNN analysis, the R and c values were plotted with a confidence interval of 2σ. GIAS outputs a plot of the volcanic centers and the convex hull of the volcanic area, the R and c statistical values, and the skewness vs. kurtosis.
Alignment patterns found by PNN provided important constrains for understanding controls on regional volcanic evolution. Using the area of the convex hull from PNN analysis computed by GIAS, and the observed volcano population based on morphological characterization by MORVOLC, we calculated the normalized distance between the volcanoes used to create alignments, based on the density of the volcanoes. This takes into account the problem of volcanic fields covering a large area even though the mean distance between volcanic centers is generally small, due to magma propagating through new fractures or re-activated pre-existing structures (Valentine and Hirano, 2010). Due to differences in densities and mean distances of volcanic centers for each volcanic field within the Hat Creek region, we applied the relationship between the maximum length for the generation of alignments and the density of volcanic centers originally determined by Le Corvec et al. (2013) for monogenetic volcanic fields. This relationship was used to calculate the maximum length to generate lineaments in the Hat Creek volcanic region. A Three-point Alignments Matlab code used for volcanic alignment analysis (Le Corvec et al., 2013) was used to identify groups of points in a population of volcanic centers that form straight lines (Wadge and Cross, 1988; Connor et al., 1992; Baloga et al., 2007; Bleacher et al., 2009; Le Corvec et al., 2013), and to generate a list of alignment azimuths. Directions of alignments are presented in a rose diagram to find out if there is a a strong controlling factor that results in preferred alignment during volcano growth.
3.4. Volcano Morphology and Regional Stress Relationship
We compared crater morphology and regional stress relationships only for bigger volcanoes, to draw from a homogeneous population. Amphitheaters, breaches, scars or craters were our primary indicator for describing a part of the volcano's history that could be related to regional stress (Lagmay and Valdivia, 2006). We identified volcanoes that show amphitheaters, volcanic scars and breaches. A scar was used to describe craters deformed by major collapse events, including debris avalanches and large landslides. A crater breach is a scar-like deformation brought about by erosion such as by glaciers (cirques) or by meteoric and hydrological events forming gullies and gully heads.
To determine regional stress, we obtained the orientation of the nearest regional maximum horizontal stress node to each bigger volcano from the World Stress Map, a standard global compilation of contemporary tectonic stress (Heidbach et al., 2008). Stress orientation in the map is from various types of stress indicators, such as earthquake focal mechanisms; well bore breakout and drilling induced features; in-situ stress measurement such as overcoring, hydraulic fracturing, and borehole slotter; and young geologic data from fault slip analysis and volcanic vent alignments (Heidbach et al., 2008). We then measured the direction at which scars and breaches open using the angle measurement tool in GNU Image Manipulation Program®. The absolute difference between these two angles is the angle difference.
4. Results
4.1. Topographic Modeling, and Structural and Geomorphological Interpretation
4.1.1. Elevation Modeling
The elevation range in the Hat Creek region is from 150 to 3200 m with a mean elevation of 1400 ± 400 m. To simplify initial exploration of terrain development, elevation density slicing was applied to the DEM, generalizing the topography. This process enhanced the regional detail of the DEM. Based on the original and density sliced DEM (Figures 2A,B), there are two major elevation profiles: the low elevation areas in cool colors and high areas in warm colors. The low elevation areas are subdivided into four areas based on the continuity of the low elevations compared to adjacent, higher areas: A, B1, B2, and C. The low areas decrease in mean elevation from east to west. The lowest mean elevation (A), darkest blue in Figure 2A and magenta in Figure 2B, are the Sacramento Valley and Sacramento River and its tributaries from the Klamath Mountains in the north to the western side of Lassen Volcano National Park in the south. This area is separated from the lower area of Lake Britton (B1) on the east by Chalk and Hatchet Mountains, which are both part of the Klamath Mountains. The Pit River, which is the northern main tributary of the Sacramento River, carves the divide between these two mountains. In lightest blue and highest in mean elevation among the three low areas is an area that includes lakes in the southern part of Brushy Butte lava field, and McArthur and Fall River Mills (B2). It is separated from the lower western area (B1), of Lake Britton and Hat Creek Valley, by the Hogback ridge and Saddle and Haney Mountains. The green, flat area consists of Lookout and Bieber areas and Ash Creek State Wildlife Area (C), possibly the easternmost tributary of the Sacramento River.
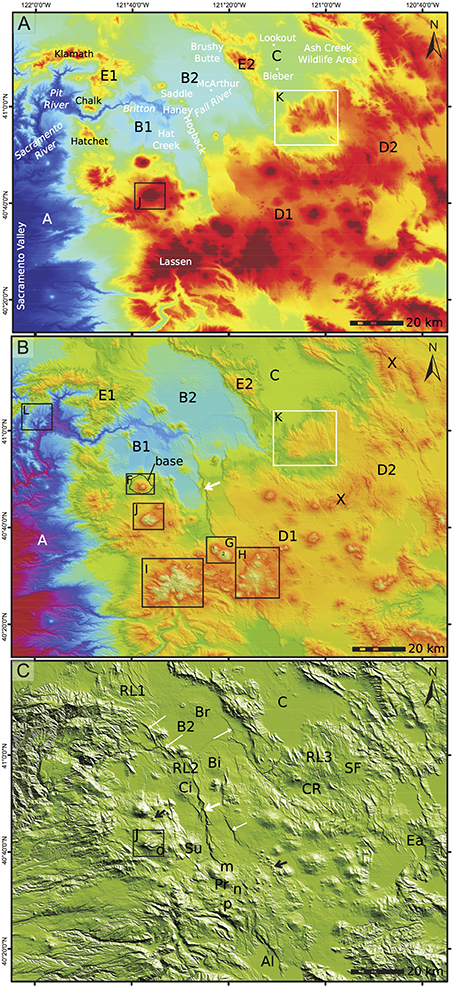
Figure 2. Density-sliced DEM and Shaded Relief Maps of the Hat Creek Graben and its vicinity (Gesch et al., 2002). (A) Highlights the different elevation regions high in warm colors and low in cold colors and (B) green as the boundary between the two main regions and red as the break in slope that marks the bases of volcanoes. Based on mean elevation and continuity of elevation vs. adjacent areas, the low elevation areas are subdivided into A: Sacramento Valley and Sacramento River including its main tributary on the north, the Pit River; B1: Hat Creek Valley and Lake Britton, B2: McArthur and Fall River, and C: Lookout, Bieber and Ash Creek Wildlife Area. High elevation areas are subdivided based on texture and intensity of warm colors and geographic location. D1: Cascade Range; D2: Modoc Plateau; E1: Klamath Mountains; and E2: Taylor, Jimmerson and Widow Mountains. Red linear areas marked with x and K (inset) are ridges, features in insets F, G, and J denote stratovolcanoes, and insets H and I denote complex volcano edifices. Inset L denotes areas of river erosion. (C) Shaded relief image with water bodies: lakes Almanor (Al) and Eagle (EA); reservoirs: Silva Flat (SF) and Catfish (CR); flood plains: B2 and C; volcanoes: Sugarloaf Mountain (Su), Crater Peak (inset J), Prospect Peak (Pr); lava fields: Cinder Butte (Ci), Big Cave (Bi), Brushy Butte (Br), m and n; lava flows (o and p); cones (black arrows); faults (white arrows); and possible lineaments as localized faults (RL1, RL2, RL3). Arrows are drawn perpendicular to the general strike of the lineaments.
The high elevation areas are subdivided based on the texture and intensity of warm colors in the DEM and the geographic location (D1, D2, E1, E2). The warm, geographically continuous colors in the southern part of the study area are divided into an area of smooth contours on the western side that coincides with the Cascade Range (D1) and the relatively irregular-edged Modoc Plateau (D2) on the east and northeast sides. Two other high elevation areas are geographically separated and thus are identified as separate profiles: the Klamath Mountains (E1) and Taylor, Jimmerson and Widow Mountains (E2). The elevation density map (Figure 2B) highlights the edges of high elevation areas (in green: D1, D2, E1, E2), and the break in slope that marks the base of volcano edifices (in red: insets F, G, H, I, J).
Features observed and mapped include the morphology of the edifices. Mountain ridges that form narrow and linear features (x) are contrasted against volcano edifices, observed as being more equant in planview (insets F, G, J). Stratovolcano bases are identified by the outermost, circular or equant, boundaries (insets F, G:1-2, J). The non-circular and very irregular edges of the base also identify the more complex volcanoes (such as those in insets H and I). “Piedmont” volcanoes (such as in inset G) are formed when the base of one volcano (1) is truncated by or buried under an adjacent edifice (2). Big volcanoes or broad areas of higher elevation relative to adjacent areas (insets H, I) are comprised of concentrations of (sometimes linear) cones (inset H), or are heavily eroded stratovolcanoes (inset I). Smaller stratovolcanoes (insets F, G, J) can also show irregularities of their bases, which can be evidence for collapse, sliding or unequal deposition and erosion. In inset J is an area that has experienced a deep-seated erosional or mass-wasting process.
Other high elevation areas (insets K, L) with differences in the regularity and smoothness of the edges (in green) can indicate areas that may be experiencing varying degrees of erosion. Inset K, showing a volcano base with a regular planview edge as indicated by smoother color contour, may indicate a relatively lesser amount and lower rate of erosion, while the volcano in inset L may be experiencing a higher and more stable rate of erosion by a river tributary.
4.1.2. Shaded Relief
The shaded relief map (Figure 2C) shows a 3D depiction of the earth's surface. The flat and very smooth surfaces represent: the water bodies such as lakes Almanor (Al) and Eagle (Ea); reservoirs such as Silva Flat (SF) and Catfish (CR); and flood plains such as B2 and C. Rough and sloping areas represent either mountains or mountain ridges if they are elongated, and volcanoes if they are more circular in planview.
Volcanoes having rough surface textures but very few gullies or other linear erosional features, such as Sugarloaf Mountain (Su), have relatively fresh lava (lava is not easily erodible), which may translate into a young relative age of the volcano. Those with rough surface texture or lower slopes, such as Cinder Butte (Ci), Big Cave (Bi), and Brushy Butte (Br), or those being non-circular in planview, such as those in“m” and “n,” are identified as lava fields, as long as there is a recognizable source. Lava flows (“o” and “p”) are also recognizable as having levees on the narrower sides, and subsidiary flows on the edges of the main flow. Cones (black arrows) are easily recognizable as small mounds with relatively smooth and steep slopes. Relative ages of mountains are marked by the existence and density of gullies.
Other surface feature easily recognized on a shaded relief image are faults and linear features. Linear features that show continuity, and coincide with regional fault systems described in the literature, as well as those that show obvious vertical displacement of other features (white arrows), are identified as faults. Identification of linear arrays of cones (black arrows) and faults (white arrows) is a starting point in recognizing more subtle structures. Repeating lineaments (RL1, RL2, RL3) in the same area, and with the same strike, are also likely faults. In recognizing faults, the most obvious ones may not have the biggest offset, but may have the best preserved scarp, which is due to their age, offset, and erosion and deposition rates.
The hillshade image enhances some of what can be picked out in color mapping (Figure 2C). The addition of a 3D depiction behind the DEM enhances the surface features observed, while the simplified and generalized version of the shaded relief image confirms the existence of both the surface features and structures that may have been otherwise over-interpreted. Although (Figure 2C) is just an enhancement of Figure 2A, one of its advantages is that shadows generated by the particular sun angle considered in the generation of the shaded relief image are not emphasized. Shadow emphasis might be helpful for delineating faults (thick white arrow), but this is not always the case for delineating volcano bases like that of Crater Peak (inset J), as the surfaces are of much the same texture, generating the same types of shadows, in all directions.
4.1.3. Slope Modeling
Topographic modeling was also used to generate a slope map (Figures 3A,B). The dataset for the study area ranges from 0° to 81.5° with a mean slope of 11°. Steep slopes are emphasized in Figure 3A. This color mapping of the slope map is useful for confirming the delineations of faults.
Figure 3. Slope and aspect maps (Gesch et al., 2002). (A) Density sliced slope map where steep areas including volcano and cone summits and fault scarps are yellow, edifices are pink, and relatively flat surfaces and water bodies are blue. The boundaries between the blue and pink areas are the break in slopes that mark a volcano base. Arrows are drawn perpendicular to the general strike of the lineaments. Fault groups based on orientation and strike, degree of curvature and sinuosity are RL1, RL2, RL3. Hat Creek Fault and its projected continuation is shown by thick white arrow. McArthur fault is indicated by a thin white arrow. Steep gorges are marked G1, G2, G3, and G4. Steeply sloping, wide areas are S1 and S2. Stratovolcanoes with known and observed deformed edifices are Crater Peak (CP), Chaos Crags (CC) and Lassen Peak (LP). Other edifices are Sugarloaf Peak (Su), Cinder Butte (Ci), Big Cave (Bi), Bald Mountain (Ba), and Burney Mountain (Bu) and lava fields (o) and Hermit Butte (He). (B) Emphasizes lava fields and their source areas labeled 1–11. (C) Aspect map of the Hat Creek Graben and adjacent areas. Polygon colors and azimuths: red (0–45°), green (45–90°), blue (90–135°), yellow (135–180°), cyan (180–225°), magenta (225–270°), maroon (270–315°), and sea green (315–360°). Water bodies: lakes Almanor (Al) and Eagle (Ea) are in yellow. White and black arrows point at west- and south- facing fault controlled geomorphic features and linear discontinuities.
Faults are identified as relatively straight lineaments, often members of a set with consistent strike. Faults in the study area have a considerable amount of vertical movement, as measured by the extent of the area colored yellow. The faults were classified according to the degree of curvature. Faults in RL1, RL2, RL3, for example, are grouped together. Faults that belong to the same set generally have the same orientation, maximum along-strike throw as indicated by maximum cross-strike width, planview curvature, and thus approximately the same age, as should be the case.
The main Hat Creek fault may well have a southern continuation (thick white arrow), which occurs along the northeastern bank of the northwestern lobe of Almanor Lake (Al). To the east of the Hat Creek Fault is the trace of the McArthur fault (thin white arrow), which may continue to the south or southeast as evidenced by the linear cones directly north of AL.
Steep gorges, G1, G2, G3, and G4, are identifiable; they often indicate in this region that the stream segment has been uplifted. Steeply sloping, wide areas, such as S1 and S2 indicate landsliding or a high rate of erosion. A closer look at the steep summits of some volcanoes and domes, such as Chaos Crags (CC) and Crater Peak (CP), shows that these are relatively smooth in texture, compared to stratovolcanoes that have been deformed by violent activity, such as Lassen Peak.
Cones (black arrows) are defined by yellow circular regions that indicate steepness from the base to the summit, with a lower-slope angle, cool colored (blue) region in the middle. Because slope maps emphasize areas of steepness, they are good for delineating lava flow extent, since the edges of lava flows tend to be steep, irregular and narrow relative to adjacent areas. Because slope steepness is a factor in landslide susceptibility mapping, steeper regions on volcanic edifices are at increased risk for landslides and collapses.
Slope maps also indicate relative ages of volcanic edifices. If we compare Burney Mountain, Bald Mountain (Ba) and Hermit Butte (He), for example, Burney Mountain seems to have been covered by younger surface deposits and less affected by erosion than the other two volcanoes.
Another variation in slope map presentation (Figure 3B) emphasizes lava fields (labeled 1–11) and their source areas. Areas covered by lava flows, such as those near Sugarloaf Peak (Su), Cinder Butte (Ci), Big Cave (Bi), the area north of Burney Mountain (Bu) and the area southeast of Crater Peak (o), have rough texture in the slope map, but a mean slope near zero.
4.1.4. Aspect Modeling
Slope aspect mapping is classified as a continuous terrain segmentation scheme (Miliaresis and Kokkas, 2004). In the current approach, aspect was computed for every DEM grid point (Figure 3C). Then the aspect was standardized to eight major geographic directions: N, NE, E, SE, S, SW, W, and NW. Linearity in colored polygon in the figure is another type of evidence for faults (black arrows). Faults with dip-slip component of different orientation can be distinguished with this technique, e.g., those with the western block moving down relative to the eastern block (white arrows). Areas of deposition of rough materials, such as emplaced lava flows or avalanche and slide toes tend to have highly variable, specular color patterns, meaning that the area has slopes facing in many directions on a relatively fine spatial scale, such as at Cinder Butte (Ci), Brushy Butte (Br), and Crater Peak (CP).
4.1.5. Structural and Lineament Mapping
Regional fault systems (Figure 4A) were drawn and identified in consultation with previous work as: the Hat Creek, Rocky Ledge, McArthur, Soldier Creek, and Pittville Fault Systems. These fault systems are predominantly normal, with right-lateral components and evidence of activity up to Holocene time (Wills, 1991; Muffler et al., 1994, 2010; Parrish, 2006; U.S. Geological Survey and California Geological Survey, 2006; Sawyer and Ramelli, 2012; Blakeslee and Kattenhorn, 2013). We traced the possible extent of these structures, as well as other shorter, more curvilinear, and relatively minor, faults such as those that affect Burney Mountain (Bu), Crater Peak (CP), West Prospect Peak (WP), Prospect Peak (PP), Bogard Butte (Bo), Whaleback (Wh), and Fox Mountain (Fo) (Figures 4B–F). Some of the smaller faults, with strike directions that coincide with faults identified by U.S. Geological Survey and California Geological Survey (2006) to be <130 ka, <1600 ka and >1600 ka, are assumed to be of the same age as the larger faults, and are grouped with them. The smaller faults so mapped are possibly parts of the Walker Spring fault system, and the unnamed faults in the Susanville lake and Big Valley areas, while Other Primary Regional 1 faults are unnamed. Some of our other Primary Regional 2 traces also belong to the <1600 ka faults in the USGS Fault Map.
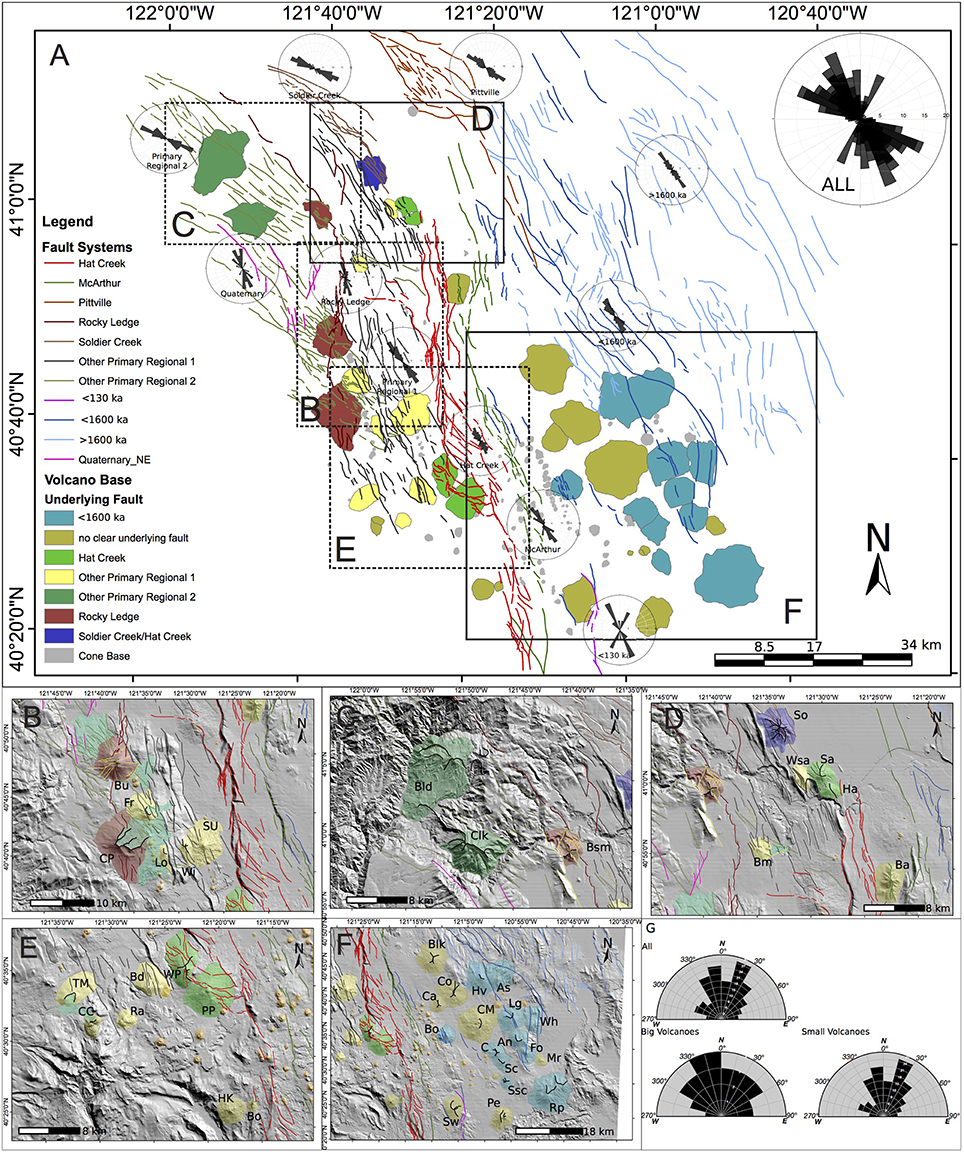
Figure 4. Volcano-tectonic relationships in Hat Creek Graben region. (A) Base map showing fault systems, volcano bases color coded on fault system that mostly affects edifice, and water bodies; rose diagrams of fault strikes by fault system; and locations (squares) of hill-shaded maps (B–F) showing fault traces and effects on edifice: edifice instability and collapse, edifice disintegration, and splitting. (G) Rose diagrams of volcano base elongations for both big (cones, sub-cones, shields, and massifs) and small (small cones, small sub-cones, and small shields) volcano sub-groups, and all volcanoes. Dataset available in Supplementary Materials.
Most of the faults trend northwest (Figure 4A). However, in more detail, the fault strike evolves from north-northwest to more nearly west-northwest, from east to west near the northern edge, while it goes from west-northwest toward north in the central to southern part of the study area. The small faults are defined as short lineaments on volcanoes without clear continuity into nearby areas. Such lineaments include the trace just to the northeast of Crater Peak (CP) (Figure 4B), which continues northwest up to the northwest side of Burney Mountain (Bu). These traces can contain multiple, short lineaments, but are constrained areally. Another area of localized faulting is the corridor of northwest trending short faults that affect the northern sectors of Prospect (PP) and West Prospect Peaks (WP) (Figure 4E). On some volcanic edifices, such as Bogard Butte (Bo), Whaleback (Wh), and Fox Mountain (Fo) (Figure 4F), small faults seem to split the edifices. In the case of Crater Peak, the small fault seems to have at least partly resulted from a major collapse. In these cases, the lineaments developed in response to a gravity-driven event that affected the volcano. However, in the case of Bogard Butte, Whaleback and Fox, it appears that the faults have influenced the shape and development of the volcano, suggesting that they are basement features that have propagated into the edifice.
4.2. Volcano Morphometry
Based on the MORVOLC output, we classified the volcanoes of the Hat Creek Graben region using primarily height to basal width ratio (Figure 5A). Those with a height to basal width ratio greater than 0.15 were classified as cones; those with intermediate values between 0.1 and 0.15 as sub-cones, and those with values less than 0.1 as shields or massifs. These last two were classified further based on height. A second classification based on height was done to differentiate small and large cones, sub-cones and shields. This classification was used to develop an evolutionary trend for volcanoes in the Hat Creek Graben region (Figure 5B).
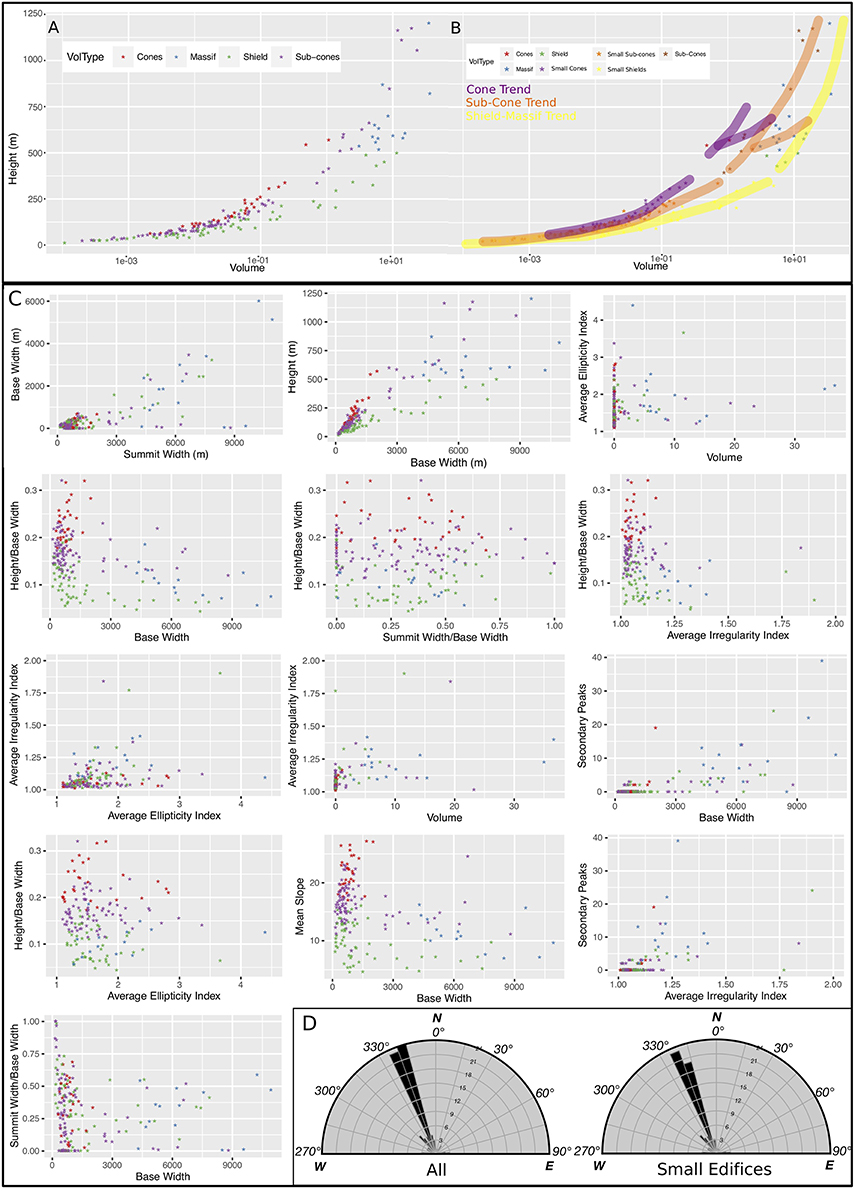
Figure 5. Volcano morphometry. (A) Volume vs. height plots for all volcanoes grouped by morphological classification: cones, sub-cones, shields, and massifs based on their height and basal width ratio; (B) A second morphological classification based on height separating bigger and smaller edifices on a volume vs. height plot to draw a volcano evolutionary trend; (C) X-Y plots of selected morphometric parameters grouped by morphological type (cones, sub-cones, shields and massifs); and (D) A rose diagram showing the preferred direction of alignments that can be formed by at least 3 volcano centroids within 6 km. Dataset available in Supplementary Materials.
The evolutionary trend begins with cones. Cones can either maintain their height to basal width ratio to increase in volume into larger cones, or enlarge in basal width to become sub-cones. Sub-cones can continuously increase in volume to become a bigger sub-cone, or evolve in basal width into a large but low volcano, a shield, and ultimately into a massif. Lastly, small volcanoes with height and basal width ratios of a shield can grow into massifs. All morphologically big volcanoes in the region are those with identified names, as discussed in the geomorphological classification of features in the region (Part 1 of this work). However, some of these previously named, big volcanoes needed to be reclassified as small cones, small sub-cones, or small shields, because their heights were less than 350 m (Figure 5B). Of the total of 185 drawn volcanic centers in the Hat Creek Graben region, 33 were classified as bigger stratovolcanoes (massifs), and 152 are morphologically smaller, mostly monogenetic cones (Tables 1, 2).
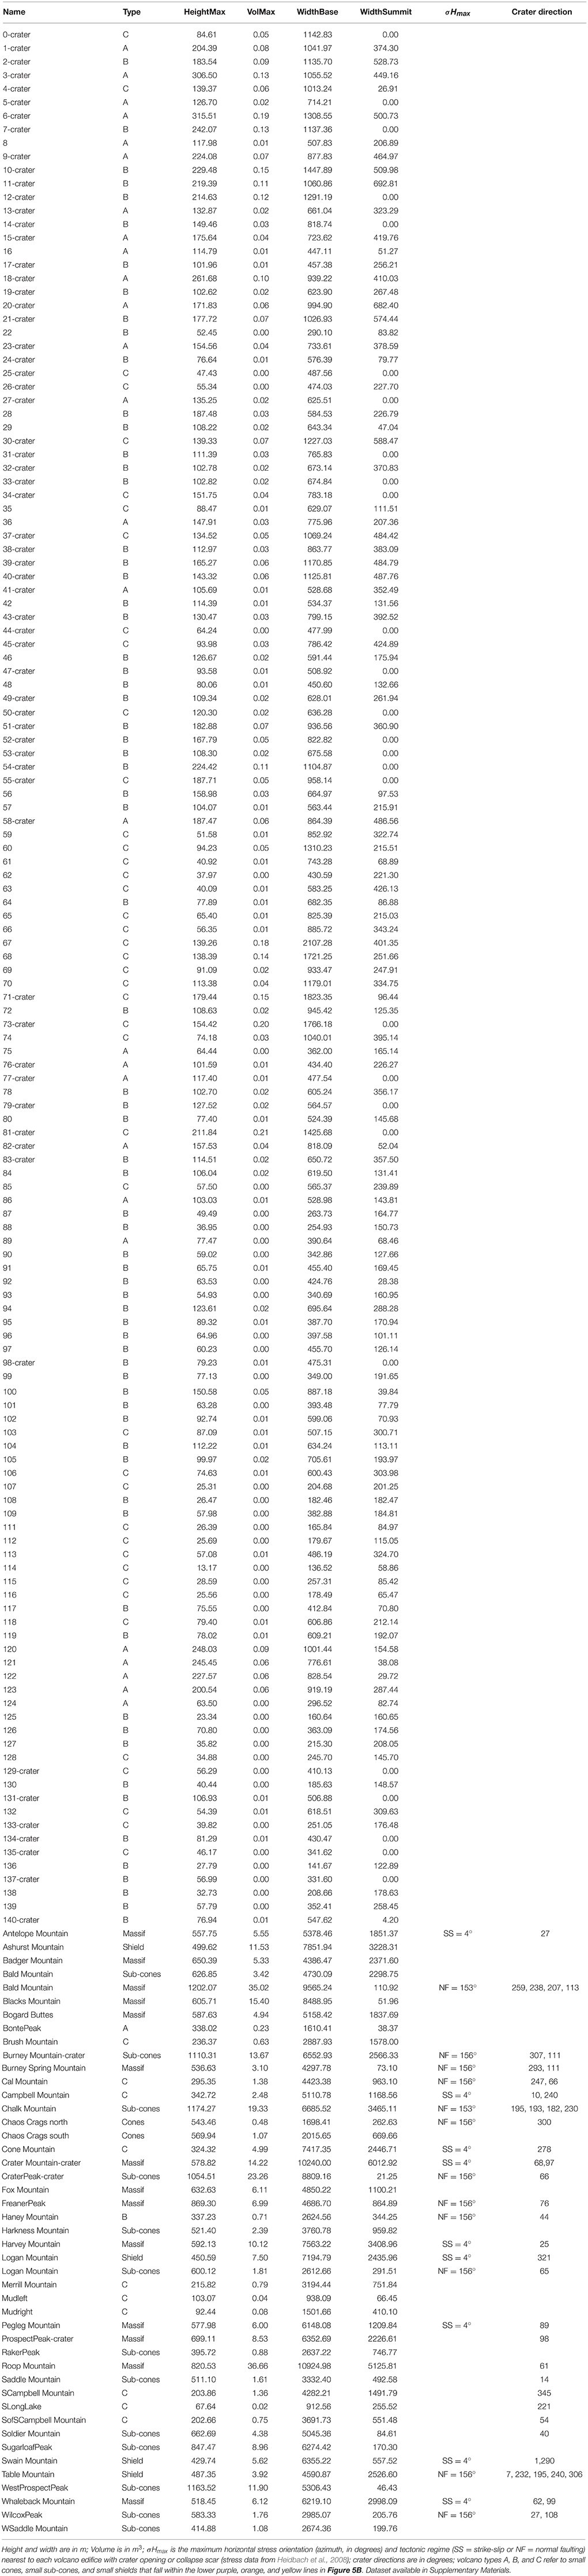
Table 1. Morphometry and crater morphology of the Hat Creek Graben region stratovolcanoes.
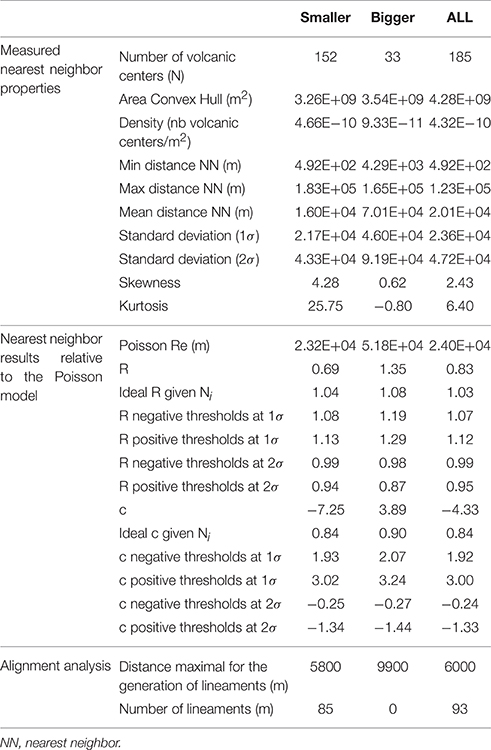
Table 2. Properties and results of the statistical analyses for each morphological subgroup (big and small), and for the all the volcanoes in the Hat Creek Graben.
We present x-y scatter plots of volcanoes in the region based on morphological classification parameters (Figure 5C). Cones have narrow summit widths, while shields and massifs tend to have broader summits, wider bases and more peaks, and are sometimes more irregular in outline. Basically, shields and massifs are high volcanoes with wide bases. Sub-cones, shields and massifs are voluminous volcanoes compared to cones. Cones are mostly identifiable by their height and high mean slope angle, in which sub-cones follow them closely. Sub-cones, massifs and some shields show the most irregular or elliptical planview shapes (Figure 6A).
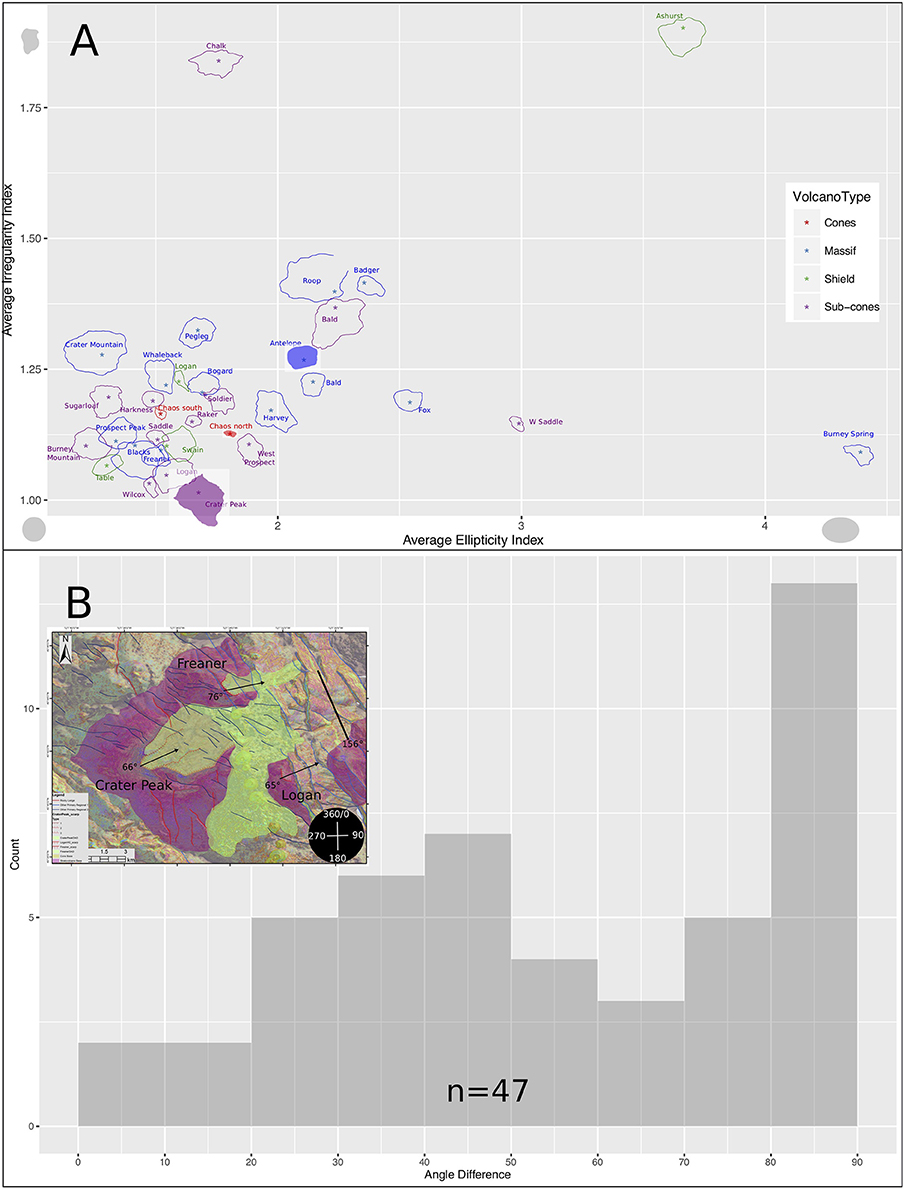
Figure 6. Volcano morphology and breaches. (A) Ellipticity and Irregularity Indices (not to scale) of bigger volcanoes in the Hat Creek Graben region grouped by morphological type as cones, sub-cones, shields and massifs. Filled polygons are those with evidence of collapse scars. (B) Frequency diagram showing the relationship between the opening direction of craters and the maximum horizontal stress. Inset is an example of how angle difference is calculated.
Volcano bases are elongated (Figure 4G), with two modes, north-northwest and northeast; most of this scatter is influenced by the trend of the large population of smaller volcanoes. Big volcanoes also generally trend north-northwest, but this trend is less clear. Volcano bases seem to be elongated consistent with the trend of the directly underlying local structures.
4.3. Volcano Spatial Distribution and Alignments
The Hat Creek Graben region appears to be a volcanic field with distinctive subgroups of volcanoes, having different spatial distributions. Poisson Nearest Neighbor Analysis was applied to the morphologically smaller and bigger volcanoes as subgroups, and separately, to all volcanoes (Table 2). The smaller volcano subgroup and the group of all volcanoes have c values outside the ±2σ significance level but R less than −2σ, which means they are spatially clustered. The bigger volcano subgroup, however, has c values outside the ±2σ significance level and R greater than +2σ, which means that volcanoes in this group are dispersed relative to the Poisson distribution. Based on the density of volcanoes per subgroup, and using the relationship established using the global database of monogenetic volcanic fields (Le Corvec et al., 2013), we used 5800, 9900, and 6000 m as the maximal distance needed for the recognition of lineaments for smaller and bigger subgroups, and the group of all volcanoes, respectively.
The three-point MATLAB script was used to automatically extract the different alignments of the volcanoes, and plot for each the direction of the alignment on a rose diagram (Figure 5D). Bigger volcanoes generated no preferred alignment, while the smaller volcano subgroup and the group of all volcanoes have a north-northwest preferred direction of alignments. Again, this quantitatively determined strike is consistent with the strike of local, tectonic faults.
4.4. Crater Morphology and Stress Field
Only the subgroup of bigger volcanoes was considered for investigating crater opening, either a volcano collapse scar or an erosional breach, because of the prevalence of these features on the bigger volcanoes. The regional maximum horizontal stress and crater opening directions, both in azimuth, were noted for each bigger volcano with crater openings in Table 1. For example, as in Figure 6B (inset), the maximum horizontal regional stress has an azimuth of 156° near Freaner, Logan and Crater Peak volcanoes, which have summit openings (erosional breaches for Freaner and Logan, and collapse scar for Crater Peak) of 76°, 65°, and 66°, respectively. The angle difference for each of these three volcanoes is the absolute value of the difference between 156°and the summit opening direction, which is 80°, 89°, and 90°, respectively (Table 1). A frequency diagram (Figure 6B) of the angular difference between the crater opening direction for the bigger volcanoes and the maximum horizontal stress has a mode at about 90°, although crater openings at an acute angle are also found, albeit at lower frequencies. Most of the crater openings are thus perpendicular to the maximum horizontal stress, which is consistent with the observation of Tibaldi (1995) and models by Moriya (1980) and Siebert (1984).
5. Discussion
Several regional fault systems are oriented northwest-southeast; these are comprised of normal faults with right-lateral components. Individual faults within these systems pass through or underneath most of the volcanoes. The stratovolcanoes contain clear traces of the regional faults, or manifestations of collapse or erosional features on their edifices that can be related to the faults. Cones are more prevalent in the southeastern part of the study area.
5.1. Magma Propagation
The Hat Creek Graben region consists of volcano subgroups that have different spatial distributions; smaller volcanoes tend to cluster, while bigger volcanoes are dispersed. The density-dependent, preferred alignments reveal a single north-northwest direction for the small volcano subgroup, and all volcanoes considered together. These observations are consistent with the control of melt production at depth and magma propagation by pre-existing regional structures, and with the control of magma propagation in the near surface by the local stress regime. Melt production is related to the oblique subduction of the Gorda Plate underneath the Northern American Plate, and is manifested in the volcanism at the surface. Regional and near-surface stresses are influenced by Walker Lane and Cascades tectonism. Extension is accommodated by the pervasive faulting and magmatism. As the area extends, it produces weak regions that provide energy-efficient paths along which magma propagates to the surface.
Normal faults, dominant in the area, influence dike orientation and the generation of alignments at the surface, because dikes are more likely to intercept and follow dipping faults than vertical fractures (i.e., Le Corvec et al., 2013). Near-surface stress also affects magma propagation (i.e., Caputo, 1995) it is possible that high differential stress did not allow stress swap, therefore the intrusions followed the orientation of the earlier dikes. The generation of multiple orientations of volcanic alignments is perhaps attributable to the interaction of near-surface stress field influences and pre-existing fractures.
Magma pressure, which is also a factor in dike propagation (i.e., Jolly and Sanderson, 1997), may be low, so that magma only follows pre-existing fractures that are favorable for reactivation in the prevailing stress field. Although pathways may vary slightly according to stress field at time of propagation and eventual emplacement (i.e., Valentine and Krogh, 2006), in general, they have been consistent through the lifetime of Hat Creek region volcanism.
The propagation of magma that formed the bigger volcanoes is also structurally controlled, because these volcanoes stand atop major regional structures, and the faults affect the stability of the volcanic edifices. The random, dispersed spatial distribution of the bigger volcanoes may be attributed to their long-lived plumbing systems, which are capable of capturing or re-focusing nearby dikes as they propagate to the surface, most of the time erupting from a single vent. Changes in the local stress field caused by the growing edifice may also have enhanced dike capture.
5.2. Edifice Evolution
Most volcanoes in the study area are small, with maximum heights about 250–300 m, and volumes generally less than 1 km3. Based on the height and basal width ratio, some volcanoes can be classified as cones, which are relatively regular and more nearly circular in planview, have relatively smaller summit areas and narrower basal widths compared to sub-cones and to the bigger and more voluminous shields and massif volcanoes. Quantitative morphology furthermore suggests that volcanoes evolve along several paths: small cones continue to grow as cones, or they grow into sub-cones; small sub-cones continue to grow into bigger sub-cones, or they develop into shields and massifs; and shields can grow into massifs. Underlying major faults systems have greatly influenced the growth, partial destruction, and general evolution of volcano morphology.
Quantitative evaluation furthermore revealed volcanic basal elongations in two main directions, north-northwest and northeast. The existence and magnitude of the northeast mode in the elongations is consistent with spreading parallel to displacements on regional normal faults with right-lateral components, either by preferred feeder dike orientation or by deformation.
5.2.1. Deformed and Collapsing Volcanoes
Several types of volcanic edifice deformation are observed in the Hat Creek Graben region. Some volcanoes show collapse features, others erosional breaches, and some are being split by faulting.
Chaos Crags is a stratovolcano with a known collapse scar (Figure 4E). The collapse of the unstable, very steep, soft-cored, and unconsolidated plug dome of Chaos North resulted in a debris avalanche, called the Chaos Jumbles. The jumbles were emplaced as a high yield strength material capable of deforming and shearing in three separate rockfalls about 300 years ago Eppler et al. (1987), damming Manzanita Creek and forming Manzanita Lake. A projection of a northwest striking fault, here part of a Primary Regional 1 group of faults (Figures 4A,E), which splits Table Mountain to the northwest, may be masked underneath the Crags and Jumbles. Post-eruptive mass wasting and sedimentation on the slopes of Chaos Crags have masked any evidence for the mechanism of generation of the debris avalanche (Perez, 1998). Activity on the fault could have triggered instability and collapse.
Crater Peak is another stratovolcano that shows morphological evidence of collapse (Figure 4B). Crater Peak has a large and deep-seated scar, and a possible runout deposit elongated toward the northeast marked by a rough surface texture that would be expected in a debris avalanche deposit. The scar was glacially eroded after the collapse, as shown by the smoother, uppermost parts of the amphitheater, which thus resembles, or is in part, a cirque. Comparing the structures and scar elongation direction of Crater Peak to Figure 9E of Wooller et al. (2009), we speculate that the collapse could have been caused by a basement normal fault, with a right-lateral component, possibly the Rocky Ledge Fault (red line in Figures 4A,B, thicker black line Figure 7A), which passes through the center of the edifice. In this scenario, the Rocky Ledge Fault destabilized and eventually caused a collapse approximately normal to its strike direction.
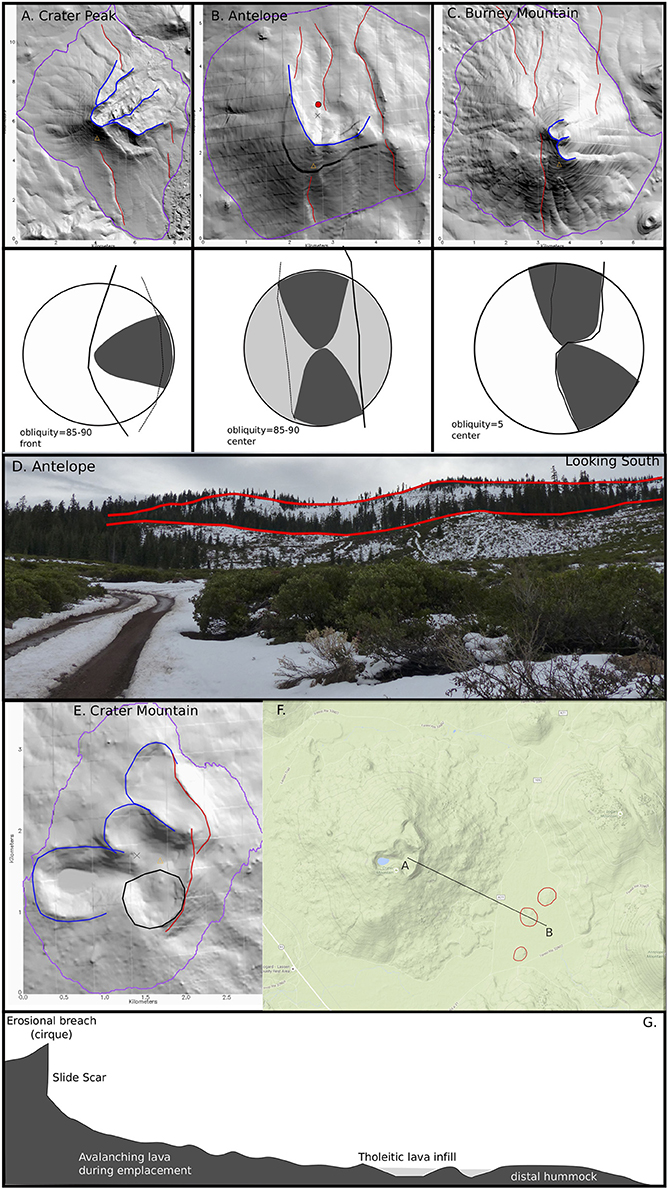
Figure 7. Deformed volcanoes in the Hat Creek Graben region. (A–C) Shaded relief delineated with volcano base (purple), collapse scars or erosional breaches (blue) and structural lineaments (red) for Crater Peak (B), and Antelope (C), and Burney (D) Mountains compared with their predictive model cones by Wooller et al. (2009) underneath, where the gray circles represent the edifice; solid lines are main normal faults; dotted polylines are antithetic and minor faults; and gray polygons are unstable sectors; (D) View looking at Antelope Mountain Slide scar from the northern sector of the volcano marked as red dot in (B). The red lines are the slide scar (top), and terrace (bottom) that mark the top of the major listric faults that accommodate the sliding of the whole area. (E) Shaded relief and (F) google earth images, and (G) cross section of Crater Mountain Slide. Location of cross section A-B is drawn over google earth image (F). Volcano base (purple); cirques (blue); scar and hummocks (red); possible crater trace (black) are marked.
Relations, confirmed in the field, showed that Antelope Mountain has also collapsed (Figures 4F, 7B,D), with deposits emplaced toward the northeast. From remote sensing, lineaments on the eastern base of the volcano can be traced (Figures 4A,F), of the same set that split Whaleback volcano to the northeast. Another set that perhaps influenced the stability of Antelope Mountain more strikes northwest, splits Logan Mountain to the north, and affects the western flank of Fox Mountain. The structures affecting Antelope Mountain are grouped with the <1600 ka faults, are possibly part of the Walker Spring fault system. These may be related to the faults in the Susanville and Big Lake Valley areas, which may have been active during the Holocene.
Based on remote sensing analysis, four more volcanoes notably show evidence of edifice collapse: Crater, Burney and Table Mountains; and Raker Peak. Burney and Table Mountains are deformed, and show morphological traces of edifice collapse structures (Figures 4B,E). The structures at Burney Mountain appear to be manifestations of ongoing deformation of the edifice by the Rocky Ledge Fault, the underlying basement fault (Figure 4B), which may ultimately result in sector collapse. In the field, Burney Mountain has two small craters that both open to the east. These are likely to have evolved into cirques by small, summit glaciers flowing to the east, leaving behind till, possibly in the form of a moraine, below the northern cirque (Figure 7C). The location of lineaments on the northwest and southeast sectors of Burney Mountain is consistent with underlying normal faults with little strike-slip component (Figure 7C). The lineaments (in yellow) perpendicular to the Rocky Ledge Fault trace may not be tectonic in origin, but rather lava flow ridges (Figure 4B).
Crater Mountain (Figures 4E–G) is a relatively “strong” and stable volcano, built mostly of lava flows, with no apparent hydrothermal alteration at the surface, nor any indication that it is built on deformable and weak substrata. At the summit, three craters have been traced, all elongated to the east, which may be modified by glaciers. There may be another, fourth, crater as well. The head-scarp morphology in the summit area, where the north-south scar is drawn (Figures 7E–G), suggests some type of gravity failure on the east flank. The scarp could have been made by multiple slides, affecting slightly different sectors. It is possible that a series of slides were emplaced without a thin, weak or wet sliding base, which resulted in slumping or rotation of relatively coherent blocks, forming a toe now exposed as three low mounds or distal hummocks (Paguican et al., 2014). Spaces between hummocks have been infilled by tholeiite lavas.
Raker Peak (Figure 4E) is another edifice with an apparent northeastward opening. This sector deformed relative to the others. Although there is no basement fault near the edifice, a river flows across the eastern piedmont, which could have cut the base of the edifice, causing its eventual collapse. It is also possible that a segment of a Primary Regional 2 fault is buried by the volcano.
Last, the southwestern sector of Table Mountain (Figure 4E) has a crater-like structure that opens toward the south. The difference in slope steepness between the upper and lower portions of the edifice within the scar is evident.
5.2.2. Volcanoes with Erosional Breaches and their Underlying Faults
Volcanoes with an erosional breach or particular sectors affected by relatively more gullies include Pegleg, Swain, Roop Mountain, Logan, Campbell, South of Campbell, South of South Campbell, and Harvey Mountain (Figure 4F); Chalk and Bald Mountains in the north (Figure 4C); Raker Peak (Figure 4E), Cone and Cal Mountains (Figure 4F), Soldier, Haney and, Saddle Mountains (Figure 4D), and Burney Spring Mountain (Figure 4C) in the east.
Harvey Mountain is bounded to the east by Ashurst volcano. These two stratovolcanoes are separated by a segment of a <1600 ka regional fault that also affects Logan, Antelope and Fox Mountains. On the northeast is a possible erosional feature most likely to develop under the influence of an active normal fault with a strike-slip component. Logan, Campbell and South of Campbell all have erosional features opening toward the northeast or northwest. Of these, only Logan Mountain is clearly traversed by a <1600 ka fault, the same fault that splits Fox Mountain and is related to the slide on Antelope Mountain. The volcano to the south of South Campbell has no apparent nearby fault to which we can relate the north and northwest scars. However, a river flows near the western base, which might have laterally undermined the volcano base, causing instability on the northwestern flank. The western flank of Roop Mountain has gullies. The northeastern sector is the most incised by deep gullies, with major gully heads. Based on its relatively bigger size and volume compared to other volcanoes, and the density and size of gullies, Roop Mountain is probably an old volcanic edifice.
Swain Mountain has traces of two fault on the southwestern and northeastern piedmonts. Two erosional scars are shaped like cirques and have gullies within their walls. Breaks in slope that create benches or terraces within the scar may indicate that this is the most deformed part of the edifice, causing it to be more easily affected by erosional processes. The locations and opening directions of the scars are consistent with deformed sectors of volcanoes affected by normal faults with a strike-slip component occurring at the base and facing toward the edifice (Wooller et al., 2009). Pegleg Mountain also has two scar traces but unlike Swain Mountain, there is no nearby fault that can be explicitly connected to it. Thus, all sectors of the volcano are affected by gullies.
In the northern portion of the Hat Creek Graben region, where both the Rocky Ledge and Hat Creek faults terminate, and more dense Primary Regional 1 and 2 faults, and other Quaternary faults, are delineated, Chalk, Bald, Soldier, Haney, Saddle and Burney Spring Mountains are observed to be heavily traversed by the regional structures. In addition, the volcanoes occur along a major river (the Pit River), so they have many more erosional features and gullies in almost all sectors. They are therefore more affected by both frequent sliding and gully formation than other volcanoes.
On the eastern side of the study area, two volcanic edifices, Cone and Cal Mountains, each, have two erosional scars opening in opposite directions. There is no clear trace of a regional fault or any manifestation of movement of possible faults except for these scars.
5.2.3. Splitting Volcanoes, and the Faults Splitting Them
A few volcanoes are either very young, composed of strong and consolidated materials, or constructed on relatively stable basements. Even though they stand atop regional faults, may remain intact, except for splitting, in which some parts of the edifice move vertically relative to adjacent areas. Splitting volcanoes are affected by through-going faults, deforming yet not causing major instability or collapse. Whaleback, Fox, and Bogard (Figure 4F) Mountains are examples of this. Freaner and Wilcox (Figure 4B) are splitting elliptical volcanoes, as shown by vertical differences between adjacent parts of the edifices. Some volcanoes, such as West Prospect Peak, Prospect Peak (Figure 4E), and Sugarloaf (Figure 4B), have retained their ellipticity and regularity, even though faults split them.
5.3. Fault vs. Dike Dominated Regional Extension
In magmatic slow and ultraslow spreading plate boundaries and rift zones, extension is often accommodated by magmatic activity, or diking with associated faulting (Acocella and Trippanera, 2016, and references therein). Normal faults that propagate from the surface downwards and create graben-like structures on the surface are recurrent structural features. Symmetric, minor grabens are observed in Lakagigar and Bardarbunga in Iceland, and Dallol in Afar, induced by single diking episodes. Asymmetric, larger grabens can be seen in Krafla, Iceland, and Fantale, Ethiopia, formed by repeated or distributed diking. At these spreading plate boundaries, extension at depth seems to be accommodated mostly by diking, with normal faulting playing a negligible role. In shallower layers, normal faults and extensional tectonic structures accommodate the deformation, alongside a few feeder dikes (Acocella and Trippanera, 2016, and references therein).
While we cannot rule out the idea that dikes play a major role in extension at depth in the Hat Creek Graben region, and that some of the shorter faults might have been generated by diking episodes, it seems that at shallower levels, regional normal faults accommodate most of the extension. The extent of the Hat Creek Graben region, its regional fault systems with total displacements as high as a few hundred meters, recurrence intervals of a few 100 years, and the influence of the regional fault systems on the development of the volcanoes furthermore suggest that it is unlikely that most accommodation is by diking episodes, even deeper in the crust. The Hat Creek Graben region and the East African Rift are spreading at similar rates of 2.9 ± 0.8 mm yr−1 (Zeng and Shen, 2014) and 3–4 mm yr−1 (Stamps et al., 2008), respectively. However, it appears that the Hat Creek Graben region has a lower magma supply rate because it has smaller volcanoes than does the East African Rift (Grosse et al., 2014). The Hat Creek Graben region presents as an example of a different mechanism of extension in a small rift system associated with a transform plate boundary.
6. Conclusions
Topographic mapping and modeling, based mostly on NED data, were used to describe the geomorphology and structures of the Hat Creek Graben region. In addition to the obvious, known major geomorphological features, such as Lassen Peak, Pit River and Hat Creek valleys, smaller-scale geomorphological features, including mountain ridges, volcanic edifices, and lava fields, were characterized in detail using different topographic modeling techniques. Initial assessment of the shape and regularity of the volcano bases gave an overview of the processes that have affected or are currently affecting the volcanoes. Erosional features and the density of structures delineated on volcanoes were also noted. The study can serve as a standard for other volcanic areas in the world with strong tectonic interaction.
Using the height and basal width ratios from the morphometric analysis allowed us to classify the individual volcanic edifices of the Hat Creek Graben region as cones, sub-cones, shields and massifs. Separating those less than 350 m high as smaller cones, sub-cones and shields revealed an evolutionary trend of volcanic forms in the region: smaller cones can grow into bigger cones if they increase their height in proportion to their basal width, or evolve into sub-cones if their basal width increases faster than their height. Smaller sub-cones can grow into bigger sub-cones, or grow into the wide variety of shields or massifs; and smaller shields can grow into larger shields or massifs. As volcanoes develop and grow on top of major regional faults, their activity and growth pattern are influenced by regional extension accommodated on north-northwest striking faults that are mostly normal with strike-slip component. The stress regime and fault orientation can cause edifice deformation by collapse, erosion, or splitting. The majority of the deformational features, often manifested as collapse scars or erosional breaches, have opening directions perpendicular to the maximum horizontal stress, similar to those in other extensional settings (Tibaldi, 1995) and may, therefore, be related to the normal component of movement on the underlying faults. A considerable number, however, open at an acute angle and therefore are affected by the right-lateral component of movement on the underlying faults.
Spatial distribution varies for the volcano subgroups in the Hat Creek Graben region. The smaller volcanoes subgroup, and the combined smaller and bigger volcanoes, are clustered with northwest-southeast alignments formed by at least three volcanoes within 6 km of one another, while the bigger volcanoes subgroup is random and dispersed. This implies that the initial and clustered growth of volcanoes in the Hat Creek Graben region is controlled by the pre-existing major structures. Thus, the regional structures and volcanoes within the Hat Creek Graben region are interacting. The spatial dispersion of the bigger volcanoes can be attributed to volcanogenic, near-surface pressure changes—as volcanoes grow and long-lived plumbing systems develop—capable of refocusing local dikes. Thus, in the case of the Hat Creek Graben region, the regional, pre-existing major faults within the crust greatly influenced the initial alignment and distribution of volcanoes, and their continued growth is closely related to local as well as regional strain.
Faults (by slip) and volcanoes (by increasing total crustal volume through dilation during intrusion and propagation of magma to the surface) both accommodate regional extension in the Hat Creek Graben region. However, extension is accommodated more by faulting than by dikes, which along with the small size of the stratovolcanoes, suggests that the magma supply rate is low, with low-pressure, as magma propagates to the surface using the most efficient, easiest, pre-existing fractures. Thus, the propagation of magma to the surface through a complex plumbing system has been insufficient to accommodate much of the extension, which is therefore dominated by normal and other extensional, purely tectonic structures. This is manifested by the dominantly fault-related topography of the Hat Creek Graben region, and the overwhelming control of the tectonic structures on the growth, development, and evolution of volcanoes. The tectonic structures should continue to have a great influence on the stability and deformation of the volcanoes into the future.
We recognize that a more comprehensive factoring in of temporal data, such as description of erosion rates, and dating of collapse events relative to the age of fault activity, will be important for a complete characterization of the morphological and morphometric evolution of the Hat Creek Graben region.
Author Contributions
EP and MB both contributed to the conception and design of the work, acquired, analyzed, and interpreted the data for the work. EP executed the detailed analyses, and drafted the manuscript. Revisions were made by both EP and MB. We both approved the version of the manuscript we submitted and we will both be accountable for the accuracy and integrity of this work.
Conflict of Interest Statement
The authors declare that the research was conducted in the absence of any commercial or financial relationships that could be construed as a potential conflict of interest.
Acknowledgments
We thank Laura Pioli and Gianluca Groppelli, and the Associate Editor, Dr. Roberto Sulpizio for their comprehensive and constructive reviews. We also thank the Editor in Chief, Dr. Valerio Acocella for his helpful comments. Dr. G. N. Fabbro provided essential help in formatting technicalities and improving the drafts. We are grateful for field assistance by Mr. G. Bursik and Ms. Leandra Marshall. This research was funded in part by NASA grant NNX12AQ10G, and by the State University of New York.
Supplementary Material
The Supplementary Material for this article can be found online at: http://journal.frontiersin.org/article/10.3389/feart.2016.00076
References
Acocella, V., and Trippanera, D. (2016). How diking affects the tectonomagmatic evolution of slow spreading plate boundaries: overview and model. Geosphere 12:GES01271.1. doi: 10.1130/GES01271.1
Argus, D. F., and Gordon, R. G. (1991). Current Sierra Nevada-North America motion from very long baseline interferometry: implications for the kinematics of the western United States. Geology 19, 1085–1088.
Austin, L. J. (2013). “Fault kinematics from LiDAR analysis of the Rocky Ledge Fault, Shasta County, California,” in Geological Society of America Abstracts with Programs (Denver, CO: Geological Society of America), 546.
Bahar, I., and Girod, M. (1983). Controle structural du volcanisme indonesien (Sumatra, Java-Bali); application et critique de la methode de Nakamura. Bull. Soc. Geol. Fr. XXV, 609–614. doi: 10.2113/gssgfbull.S7-XXV.4.609
Baloga, S. M., Glaze, L. S., and Bruno, B. C. (2007). Nearest-neighbor analysis of small features on Mars: applications to tumuli and rootless cones. J. Geophys. Res. E Planets 112, 1–17. doi: 10.1029/2005JE002652
Beggan, C., and Hamilton, C. W. (2010). New image processing software for analyzing object size-frequency distributions, geometry, orientation, and spatial distribution. Comput. Geosci. 36, 539–549. doi: 10.1016/j.cageo.2009.09.003
Bennett, R. A., Davis, J. L., and Wernicke, B. P. (1999). Present-day pattern of Cordilleran deformation in the western United States. Geology 27, 371–374.
Blakely, R. J., Christiansen, R. L., Guffanti, M., Wells, R. E., Donnelly-Nolan, J. M., Muffler, L., et al. (1997). Gravity anomalies, Quaternary vents, and Quaternary faults in the southern Cascade Range, Oregon and California: implications for arc and backarc evolution. J. Geophys. Res. 102:22513. doi: 10.1029/97JB01516
Blakeslee, M. W., and Kattenhorn, S. A. (2013). Revised earthquake hazard of the Hat Creek fault, northern California: a case example of a normal fault dissecting variable-age basaltic lavas. Geosphere 9, 1397–1409. doi: 10.1130/GES00910.1
Bleacher, J. E., Glaze, L. S., Greeley, R., Hauber, E., Baloga, S. M., Sakimoto, S. E. H., et al. (2009). Spatial and alignment analyses for a field of small volcanic vents south of Pavonis Mons and implications for the Tharsis province, Mars. J. Volcanol. Geotherm. Res. 185, 96–102. doi: 10.1016/j.jvolgeores.2009.04.008
Caputo, R. (1995). Evolution of orthogonal sets of coeval extension joints. Terra Nov. 7, 479–490. doi: 10.1111/j.1365-3121.1995.tb00549.x
Clark, P. J., and Evans, F. C. (1954). Distance to nearest neighbor as a measure of spatial relationships in populations. Ecol. Soc. Am. 35, 445–453. doi: 10.2307/1931034
Connor, C. B., Condit, C. D., Crumpler, L. S., and Aubele, J. C. (1992). Evidence of regional structural controls on vent distribution: springerville volcanic field, Arizona. J. Geophys. Res. 97, 12349–12359. doi: 10.1029/92JB00929
Dixon, T. H., Miller, M., Farina, F., Wang, H., and Johnson, D. (2000). Present-day motion of the Sierra Nevada block and some tectonic implications for the Basin and Range province, North American Cordillera. Tectonics 19:1. doi: 10.1029/1998TC001088
Dokka, R., and Travis, J. (1990). Role of the eastern california shear zone in integrated shear along the to historic measurements mm yr present rate mm yr 4 determined. Geophys. Res. Lett. 17, 1323–1326. doi: 10.1029/GL017i009p01323
Ebinger, C., Ayele, A., Keir, D., Rowland, J., Yirgu, G., Wright, T., et al. (2010). Length and timescales of rift faulting and magma intrusion: the afar rifting cycle from 2005 to present. Annu. Rev. Earth Planet. Sci. 38, 439–466. doi: 10.1146/annurev-earth-040809-152333
Eppler, D. B., Fink, J., and Fletcher, R. (1987). Rheologic properties and kinematics of emplacement of the chaos jumbles rockfall avalanche, Lassen Volcanic National Park, California. J. Geophys. Res. 92:3623. doi: 10.1029/JB092iB05p03623
Faulds, J. E., Henry, C. D., and Hinz, N. H. (2005). Kinematics of the northern Walker Lane: An incipient transform fault along the Pacific-North American plate boundary. Geology 33, 505–508. doi: 10.1130/G21274.1
Francis, P., and Wells, A. (1988). LANDSAT Thematic Mapper observa- tions of debris avalanche deposits in the Central Andes. Bull. Volcanol. 50, 258–278. doi: 10.1007/BF01047488
Gesch, D., Oimoen, M., Greenlee, S., Nelson, C., Steuck, M., and Tyler, D. (2002). The national elevation dataset. Photogramm. Eng. Remote Sens. 68, 5–32.
Grosse, P., Euillades, P. A., Euillades, L. D., and van Wyk de Vries, B. (2014). A global database of composite volcano morphometry. Bull. Volcanol. 76:784. doi: 10.1007/s00445-013-0784-4
Grosse, P., van Wyk de Vries, B., Euillades, P. A., Kervyn, M., and Petrinovic, I. A. (2012). Systematic morphometric characterization of volcanic edifices using digital elevation models. Geomorphology 136, 114–131. doi: 10.1016/j.geomorph.2011.06.001
Grosse, P., van Wyk de Vries, B., Petrinovic, I. A., Euillades, P. A., and Alvarado, G. E. (2009). Morphometry and evolution of arc volcanoes. Geology 37, 651–654. doi: 10.1130/G25734A.1
Hamilton, C. W., Fagents, S. A., and Thordarson, T. (2010). Explosive lavawater interactions II: self-organization processes among volcanic rootless eruption sites in the 17831784 Laki lava flow, Iceland. Bull. Volcanol. 72, 469–485. doi: 10.1007/s00445-009-0331-5
Hammond, W. C., and Thatcher, W. (2005). Northwest Basin and Range tectonic deformation observed with the Global Positioning System, 1999-2003. J. Geophys. Res. Solid Earth 110, 1–12. doi: 10.1029/2005JB003678
Hammond, W. C., and Thatcher, W. (2007). Crustal deformation across the Sierra Nevada, northern Walker Lane, Basin and Range transition, western United States measured with GPS, 2000-2004. J. Geophys. Res. Solid Earth 112, 1–26. doi: 10.1029/2006JB004625
Heidbach, O., Tingay, M., Barth, A., Reinecker, J., Kurfeß, D., and Müller, B. (2008). The World Stress Map Database Release 2008. doi: 10.1594/GFZ.WSM.Rel2008
Jenkins, O. (1938). Geomorphic Map of California: California Division of Mines and Geology Map Sheet, Scale Approximately 1:2,000,000.
Jolly, R., and Sanderson, D. (1997). A Mohr circle construction for the opening of a pre-existing fracture. J. Struct. Geol. 19, 887–892. doi: 10.1016/S0191-8141(97)00014-X
Lagmay, A. M. F., and Valdivia, W. (2006). Regional stress influence on the opening direction of crater amphitheaters in Southeast Asian volcanoes. J. Volcanol. Geotherm. Res. 158, 139–150. doi: 10.1016/j.jvolgeores.2006.04.020
Le Corvec, N., Spörli, K. B., Rowland, J., and Lindsay, J. (2013). Spatial distribution and alignments of volcanic centers: clues to the formation of monogenetic volcanic fields. Earth-Sci. Rev. 124, 96–114. doi: 10.1016/j.earscirev.2013.05.005
McCaffrey, R. (2005). Block kinematics of the Pacific-North America plate boundary in the southwestern United States from inversion of GPS, seismological, and geologic data. J. Geophys. Res. Solid Earth 110, 1–27. doi: 10.1029/2004JB003307
Miliaresis, G., and Kokkas, N. (2004). Segmentation and terrain modeling of extraterrestrial chasmata. J. Spat. Sci. 49, 89–99. doi: 10.1080/14498596.2004.9635024
Miller, M., Johnson, D. J., Rubin, C. M., Dragert, H., Wang, K., Qamar, A., et al. (2001). GPS-determination of along-strike variation in Cascadia margin kinematics: implications for relative plate motion, subduction zone coupling, and permanent deformation. Tectonics 20, 161–176. doi: 10.1029/2000TC001224
Moriya, I. (1980). Bandaian Eruption and Landforms Associated with It: Collection of Articles in Memory of Retirement of Prof. K. Hishimura. Technical Report, Tohoku University.
Muffler, L., Blakely, R. J., and Clynne, M. (1994). Late Quaternary normal faulting of the Hat Creek Basalt, Northern California. Geol. Soc. Am. Bull. 106, 195–200.
Muffler, L., Robinson, J., Felgar, T., Dutton, D., and Clynne, M. (2010). Database for the Geologic Map of Lassen Volcanic National Park and Vicinity, California. Data to accompany Scientific Investigations Map 2899. Available online at: http://pubs.usgs.gov/sim/2899/database.html
Nakamura, K. (1977). Volcanoes as possible indicators of tectonic stress orientation-principle and proposal. J. Volcanol. Geotherm. Res. 2, 1–16. doi: 10.1016/0377-0273(77)90012-9
Paguican, E. M. R., van Wyk de Vries, B., and Lagmay, A. M. F. (2014). Hummocks: how they form and how they evolve in rockslide-debris avalanches. Landslides 11, 67–80. doi: 10.1007/s10346-012-0368-y
Parrish, J. G. (2006). Simplified Geologic Map of California. California Geological Survey, Map Sheet 57. Available online at: http://www.conservation.ca.gov/cgs/information/publications/ms/documents/ms057.pdf
Perez, F. L. (1998). Talus fabric, clast morphology, and botanical indicators of slope processes on the chaos crags (California cascades), U.S.A. Geogr. Phys. Quat. 52, 1–22. doi: 10.7202/004861ar
Peterson, J., and Martin, L. (1980). Geologic Map of the Baker-Cypress BLM Roadless Area and Timbered Crater Rare II Areas, Modoc, Shasta, and Siskiyou Counties, Northeastern California. U.S. Geological Survey, Miscellaneous Field Studies Map 1214-A. Available online at: https://pubs.er.usgs.gov/publication/mf1214A
Sauber, J., Thatcher, W., Solomon, S., and Lisowski, M. (1994). Geodetic slip rate for the Eastern California shear zone and the recurrence time of Mojave Desert earthquakes. Nature 367, 264–266. doi: 10.1038/367264a0
Sawyer, T., and Ramelli, A. (2012). Structural Analysis, Evaluation, and Quaternary Activity of the Hat Creek and Rocky Ledge Faults, Shasta County, Northeastern California. Technical Report, Piedmont Geosciences Report, October 2012.
Siebert, L. (1984). Large volcanic debris avalanches: characteristics of source areas, deposits, and associated eruptions. J. Volcanol. Geotherm. Res. 22, 163–197. doi: 10.1016/0377-0273(84)90002-7
Sigmundsson, F., Hooper, A., Hreinsdóttir, S., Vogfjörd, K. S., Ófeigsson, B. G., Heimisson, E. R., et al. (2015). Segmented lateral dyke growth in a rifting event at BárÃřarbunga volcanic system, Iceland. Nature 517, 191–195. doi: 10.1038/nature14111
Stamps, D. S., Calais, E., Saria, E., Hartnady, C., Nocquet, J. M., Ebinger, C. J., et al. (2008). A kinematic model for the East African Rift. Geophys. Res. Lett. 35, 1–6. doi: 10.1029/2007GL032781
Tibaldi, A. (1995). Morphology of pyroclastic cones and tectonics. J. Geophys. Res. 100, 24521–24535. doi: 10.1029/95JB02250
Ui, T., Yamamoto, H., and Suzuki-Kamata, K. (1986). Characterization of debris avalanche deposits in Japan. J. Volcanol. Geotherm. Res. 29, 231–243. doi: 10.1016/0377-0273(86)90046-6
U.S. Geological Survey California Geological Survey (2006). Quaternary Fault and Fold Database for the United States. Available online at: http://earthquake.usgs.gov/hazards/qfaults/
Valentine, G., and Krogh, K. (2006). Emplacement of shallow dikes and sills beneath a small basaltic volcanic center The role of pre-existing structure (Paiute Ridge, southern Nevada, USA). Earth Planet. Sci. Lett. 246, 217–230. doi: 10.1016/j.epsl.2006.04.031
Valentine, G. A., and Hirano, N. (2010). Mechanisms of low-flux intraplate volcanic fields - Basin and Range (North America) and northwest Pacific Ocean. Geology 38, 55–58. doi: 10.1130/G30427.1
Wadge, G., and Cross, A. (1988). Quantitative methods for detecting aligned points: an application to the volcanic vents of the Michoacan-Guanajuato volcanic field, Mexico. Geology 16, 815–818.
White, I., and Crider, J. (2006). Extensional fault-propagation folds: mechanical models and observations from the Modoc Plateau, Northeastern California. J. Struct. Geol. 28, 1352–1370. doi: 10.1016/j.jsg.2006.03.028
Wills, C. J. (1991). Active faults north of Lassen Volcanic National Park, Northern California. Calif. Geol. 44, 49–72.
Wooller, L., van Wyk de Vries, B., Cecchi, E., and Rymer, H. (2009). Analogue models of the effect of long-term basement fault movement on volcanic edifices. Bull. Volcanol. 71, 1111–1131. doi: 10.1007/s00445-009-0289-3
Wright, T. J., Ebinger, C., Biggs, J., Ayele, A., Yirgu, G., Keir, D., et al. (2006). Magma-maintained rift segmentation at continental rupture in the 2005 Afar dyking episode. Nature 442, 291–294. doi: 10.1038/nature04978
Keywords: volcano-tectonic, tectonic-geomorphology, Hat Creek Graben region, California, Southern Cascades, morphometry, spatial distribution, volcano alignments
Citation: Paguican EMR and Bursik MI (2016) Tectonic Geomorphology and Volcano-Tectonic Interaction in the Eastern Boundary of the Southern Cascades (Hat Creek Graben Region), California, USA. Front. Earth Sci. 4:76. doi: 10.3389/feart.2016.00076
Received: 31 December 2015; Accepted: 12 July 2016;
Published: 28 July 2016.
Edited by:
Roberto Sulpizio, University of Bari, ItalyReviewed by:
Laura Pioli, University of Geneva, SwitzerlandGianluca Groppelli, National Research Council, Italy
Copyright © 2016 Paguican and Bursik. This is an open-access article distributed under the terms of the Creative Commons Attribution License (CC BY). The use, distribution or reproduction in other forums is permitted, provided the original author(s) or licensor are credited and that the original publication in this journal is cited, in accordance with accepted academic practice. No use, distribution or reproduction is permitted which does not comply with these terms.
*Correspondence: Engielle M. R. Paguican, ZW5naWVsbGVwYWd1aWNhbkBnbWFpbC5jb20=