Denitrifying Bioreactors Resist Disturbance from Fluctuating Water Levels
 Sarah K. Hathaway1†
  Angela D. Kent
 Julie L. Zilles
- 1Department of Civil and Environmental Engineering, University of Illinois at Urbana-Champaign, Urbana, IL, United States
- 2Department of Agricultural and Biological Engineering, University of Illinois at Urbana-Champaign, Urbana, IL, United States
- 3Department of Natural Resources and Environmental Sciences, University of Illinois at Urbana-Champaign, Urbana, IL, United States
Nitrate can be removed from wastewater streams, including subsurface agricultural drainage systems, using woodchip bioreactors to promote microbial denitrification. However, the variations in water flow in these systems could make reliable performance from this microbially-mediated process a challenge. In the current work, the effects of fluctuating water levels on nitrate removal, denitrifying activity, and microbial community composition in laboratory-scale bioreactors were investigated. The performance was sensitive to changing water level. An average of 31% nitrate was removed at high water level and 59% at low water level, despite flow adjustments to maintain a constant theoretical hydraulic retention time. The potential activity, as assessed through denitrifying enzyme assays, averaged 0.0008 mg N2O-N/h/dry g woodchip and did not show statistically significant differences between reactors, sampling depths, or operational conditions. In the denitrifying enzyme assays, nitrate removal consistently exceeded nitrous oxide production. The denitrifying bacterial communities were not significantly different from each other, regardless of water level, meaning that the denitrifying bacterial community did not change in response to disturbance. The overall bacterial communities, however, became more distinct between the two reactors when one reactor was operated with periodic disturbances of changing water height, and showed a stronger effect at the most severely disturbed location. The communities were not distinguishable, though, when comparing the same location under high and low water levels, indicating that the communities in the disturbed reactor were adapted to fluctuating conditions rather than to high or low water level. Overall, these results describe a biological treatment process and microbial community that is resistant to disturbance via water level fluctuations.
Introduction
For many coastal ecosystems worldwide, increasing problems with hypoxia are linked to anthropogenic nitrogen inputs, particularly from agricultural use of fertilizers (Howarth and Marino, 2006; Rabalais et al., 2010). In many areas, the widespread use of tile or subsurface drainage systems exacerbates the problem by increasing the fraction of fertilizer nitrogen reaching surface water. For example, in the Mississippi River Basin, subsurface drainage from fertilized agricultural fields with tile drainage is a major source of nitrate (David et al., 2010), affecting the Gulf of Mexico. In central Illinois, 12 year average nitrate losses from tile-drained agricultural fields were 23 to 33 kg N/ha, with average nitrate concentrations from 15 to 20 mg N/L in subsurface drains (Kalita et al., 2006), higher than the U.S. Environmental Protection Agency maximum contaminant level for drinking water (10 mg N/L). However, tile drainage systems also serve as collection systems, providing an opportunity to implement nutrient removal processes.
One promising treatment technology for tile drainage systems is edge-of-field denitrifying bioreactors. These bioreactors typically consist of a trench of woodchips through which tile drainage effluent is directed, providing an appropriate environment for microbially-mediated denitrification and decreasing the nitrate load carried by the tile drainage to surface water (reviewed in Schipper et al., 2010; Addy et al., 2016). Much of the research on denitrifying bioreactors to date has focused on engineering design parameters (e.g., Gibert et al., 2008; Greenan et al., 2009; Cameron and Schipper, 2010; Christianson et al., 2011) or in situ evaluation of bioreactors implemented in the field (e.g., Moorman et al., 2010).
The few prior studies on the microbial ecology of denitrifying bioreactors suggest moisture content and filter media are important parameters that influence the structure and function of microbial communities, consistent with the literature on denitrification in other environments (reviewed, for example, in Zumft, 1997). An important role for moisture content was suggested by spatial analysis of an active field bioreactor, in which the total bacterial populations varied by depth (Andrus et al., 2014). Further evidence for the importance of moisture content in this engineered environment came from a temporal study of three full-scale, field bioreactors, where the total and denitrifying bacterial communities were found to show seasonal patterns (distinct assemblages in January–June and July–December) and again to vary by depth within the reactor (Porter et al., 2015). Strikingly, this seasonal split corresponds not to temperature patterns but to typical wet/dry seasons in tile drain systems. The bioreactor shallow and deep depths also differ in being irregularly or constantly inundated, respectively. In laboratory-scale bioreactors, denitrification gene abundance also varied with carbon filter media (Warneke et al., 2011b).
Subsurface drainage flows fluctuate in response to variations in precipitation and evapotranspiration (Jaynes et al., 2001). Fluctuations in water level are thus likely to have a strong impact on nitrate removal in the denitrifying bioreactors, both through immediate effects on denitrification activity and through longer term effects on microbial community composition that could affect start up times and stability of performance.
To better understand the effects of water level, we studied the relationships amongst water level, nitrate removal (performance), microbial activity, and the microbial community composition in two parallel laboratory-scale bioreactors. One bioreactor, referred to as the constant reactor (C), was operated with a consistent water level for 19 months. In the second bioreactor, referred to as the disturbed reactor (D), the water level was manipulated to mimic seasonal patterns and shorter term fluctuations due to precipitation, as observed in field bioreactors. Nitrate removal performance was monitored throughout operation in both reactors. To characterize changes in the functional potential of the microbial communities during operation, denitrification enzyme assays (DEAs) were conducted under standard conditions (Tiedje et al., 1989; Murray and Knowles, 1999; Bernot et al., 2003). Bacterial and denitrifying bacterial community composition were analyzed with molecular fingerprinting methods. We hypothesized that lowering the water level would change the microbial community composition, causing a lag in restoring performance when the high water level was restored. With recurring changes in water level, we further hypothesized that a more resilient microbial community would develop, resulting in a faster recovery of performance once the high water level was restored.
Materials and Methods
Lab Bioreactor Set-Up and Operation
Two laboratory-scale bioreactors (13 × 46 × 30.5 cm) were constructed from acrylic sheets, adhered using Weld-On® 3 Solvent Cement (IPS Corporation, Compton, CA) and sealed with 100% silicone sealant (Dow Corning, Midland, MI) (Figure 1). Water was pumped into the reactors through an inlet tube that extended into the woodchip bed. An adjustable overflow weir allowed control of water level. Within each woodchip bed, two aluminum mesh (0.635 cm) sampling cages were installed. The sampling cages could be lifted out of the reactors and opened at the bottom for woodchip sampling. They were installed so that their bottoms were at two different depths: with one sampling about halfway up the woodchip bed (referred to as top port throughout the manuscript) and the second one sampling near the bottom (bottom port). The reactors were filled to their full depth with woodchips collected from an active field-scale bioreactor and from a nearby above-ground pile (1:1 mixture). The initial woodchip bed porosity was 0.60 in the disturbed reactor and 0.62 in the constant reactor. During operation, additional woodchips from the same mixture were added to the top of the sampling ports as needed to maintain a consistent woodchip height across the reactor surfaces. No woodchips were added outside of the sampling ports.
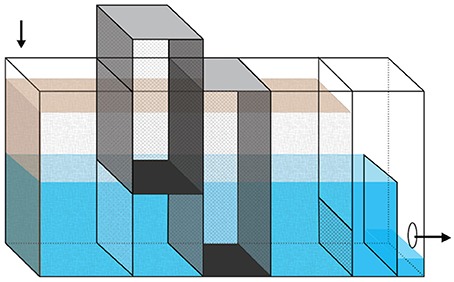
Figure 1. Diagram of laboratory-scale bioreactor. The reactors are 13 × 46 × 30.5 cm, with the brown shading showing the woodchip bed and the blue/gray areas showing the water level. Arrows indicate the direction of flow. The darker rectangular prisms show the location of the two removable sampling ports, which allowed sampling of woodchips from approximately half (top port) and full (bottom port) depth of the woodchip bed. Water level was controlled by adjusting the height of the overflow weir, which is shown here at low height, immediately before the effluent hole on the right side of the figure.
The synthetic tile drain reactor feed was based on typical nitrate concentrations in central Illinois tile drainage (Kalita et al., 2006) and chemical analysis of actual tile drainage water (Blowes et al., 1994; Stone and Krishnappan, 1997). Sterile concentrated feed was mixed with dechlorinated municipal tap water for influent concentrations of 15 mg -N/L, 0.25 mL/L mineral solution (Tanner, 1997), 0.0625 mL/L trace metal solution (Tanner, 1997), and 2.5 mg/L yeast extract. Following an initial 2 week recirculating flow period and gradual step-wise increases in retention time, the theoretical retention time was maintained at 12 h for both reactors for the duration of operation. This HRT was chosen to achieve a moderate percent removal, allowing detection of both increases and decreases in performance.
The water level in reactor C was maintained at 19 cm, which corresponded to a 5.76 L woodchip bed void volume. The water level in reactor D had three phases. In Phase I (April 3–August 23, 2011) the water level was 20.5 cm, which corresponds to a 5.76 L woodchip bed void volume. In Phase II (August 23, 2011–April 12, 2012), the water level in reactor D was decreased to 11 cm, with a corresponding decrease in flow rate to maintain constant HRT. In Phase III (April 12–November 8, 2012), the disturbed reactor was operated with fluctuating water levels, switching between the high and low water levels every 3 weeks for 6 months.
Laboratory temperature and flow rates were measured every other day during reactor operation. The room temperature was typically between 19 and 22°C, with an average temperature of 21. On three occasions (October 2011, December 2011, and March 2012) the room temperature was elevated for 3–4 days, with temperatures between 23 and 27°C. To monitor nitrate removal, 5 ml samples of the influent (which fed both reactors) and of the effluent from each reactor were collected every other day, filtered through 0.22 μm nylon syringe filters, and stored in 10 ml polyvinyl vials (Dionex, Sunnyvale, CA) at 4°C until analysis. Woodchips (15 g wet weight) were sampled from the bottom of each sampling port in each lab reactor weekly for microbial community analysis and processed immediately. Woodchip samples (20 g wet weight) were also removed for activity measurements.
Tracer Studies
Tracer studies were performed on both reactors in November 2011, when the disturbed reactor was in Phase II, extended low water period. A step input of 100 mg/L bromide was used as the tracer. Effluent samples were collected every hour for the first 5 h, every half hour for the next 13 h, and every hour for the remaining 18 h.
Denitrification Potential
Denitrification potential was measured through DEAs with the acetylene block method (Tiedje et al., 1989; Bernot et al., 2003). These assays were performed in duplicate for each sampling port. Ten grams of woodchips were incubated in a Wheaton bottle with 75 ml of solution containing 15 mg/L and 0.1 g/L chloramphenicol. Glucose was not typically added, but on three dates (June 14, June 28, and July 5, 2012), the assays were conducted with and without 1 mM glucose. The bottles were capped with chlorobutyl septa (Wheaton Science Products, Millville, NJ) and open top caps. The assay headspace was flushed with helium gas, and acetylene gas added to achieve a headspace concentration of about 20%. Samples were collected at times 0, 2, 4, and 6 h. Gas samples for nitrous oxide analysis were stored in 10 ml Vacutainers (BD, Franklin Lakes, NJ) until analysis. Liquid samples for nitrate quantification were filtered with 0.22 μl syringe filters and stored in 10 ml polyvinyl vials (Dionex, Sunnyvale, CA) at 4°C until analysis. After each sampling point, the extracted volume was replaced with 10:1 helium:acetylene gas mix. After the assay, the headspace volume was measured, and the woodchip samples were dried for 48 h at 105°C before measuring their dry weight.
Linear regressions were used to calculate the rates of nitrate removal and nitrous oxide production. The time zero samples were not included in the regression, because they were usually not linear with the other time points. Rates were normalized per dry gram of woodchips for individual assays. The denitrification potential values for multiple categories of disturbance and water level were averaged together. Significance of values was evaluated using paired t-tests for unequal variance in Microsoft Excel (Microsoft Corporation, Redmond, WA).
Chemical Analysis
Nitrate was quantified using an ICS-2000 ion chromatography system with Chromeleon Chromatography Management Software (Dionex, Sunnyvale, CA). An IonPac AS18 4 × 250 mm hydroxide-selective anion-exchange column was used. A standard curve was created for each run using standards with 3.125, 6.25, 12.5, 25, 50, and 100 mg/L . Samples collected during the tracer studies were also analyzed for bromide with this configuration.
Nitrous oxide was quantified in gas samples collected during DEA using a Shimadzu GC-2014AFsc gas chromatography system with packed columns and GCSolution software (Shimadzu Corporation, Nakagyo-ku, Kyoto, Japan). Preconditioned, custom packed HayeSep N 80-100 columns were included in the set-up (Supelco, Bellefonte, PA). A standard curve was created for each run using standards with 0.11, 0.73, 1.09, 1.80, 3.67, and 7.33 mg/L N2O.
Bacterial and Denitrifying Bacterial Community Composition
Sample processing included shaking with glass beads, extraction with the FastDNA Spin Kit (MP Biomedicals, Solon, OH), and CTAB purification, as described previously (Porter et al., 2015). Automated ribosomal intergenic spacer analysis (ARISA) (Fisher and Triplett, 1999) was used to analyze the composition of the overall bacterial community. Quantitative PCR was used to measure the abundance of clade I and clade II nitrous oxide reductase (nosZ) genes (Henry et al., 2006; Jones et al., 2013). Due to the low abundance of clade II nosZ (<8 copies/ng DNA, data not shown), the bacterial denitrifying community structure was analyzed using terminal restriction fragment length polymorphism analysis (tRFLP) of the clade I nosZ (Rich et al., 2003). Microbial community analysis was carried out as described previously (Porter et al., 2015), except that 100 ng of DNA was used in each nosZ PCR and 30 cycles were carried out. The ABI GeneScan ROX 1000 size standard was used for capillary electrophoresis, and electropherograms were analyzed using GeneMarker 2.2.0 (SoftGenetics, LLC, State College, PA).
Bacterial communities were analyzed using PRIMER 6, version 6.1.10 (Primer-E, Ltd., Plymouth, UK). To visually analyze the patterns in community structure, non-metric multi-dimensional scaling (MDS) plots were generated. To generate similarity values among different groups of samples, the ANOSIM function (Clarke and Green, 1988) was used. The DIVERSE function was used to determine taxa richness.
Results
Reactor Performance
Both reactors showed nitrate removal throughout the entire study period. The two reactors removed nitrate similarly when they both had the same high water level (Figure 2, Phase I). The constant reactor had an average of 31 ± 7% nitrate removal, and the disturbed reactor had an average of 31 ± 8% nitrate removal. However, the performance of the disturbed reactor unexpectedly improved in Phase II, when the water level was lower, even though the flow rate was adjusted to maintain a constant theoretical HRT (Figure 2). At the lower water level, the disturbed reactor had an average of 59 ± 11% nitrate removal.
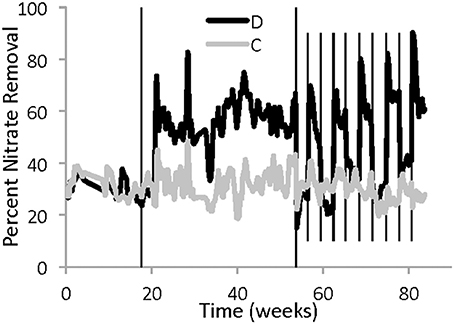
Figure 2. Five-day average percentage of nitrate removal in each reactor between April 3, 2011 and November 8, 2012. The gray line represents the reactor with constant operation, while the black line is from the disturbed reactor. The solid vertical lines indicate a change in water level in the disturbed reactor due to alternating low and high weirs. During Phase I, both reactors had the same high water level, while during Phase II the disturbed reactor had approximately half the water height. During Phase III the water height in the disturbed reactor alternated between high and low every 3 weeks. Six sampling dates were excluded because of operational problems that resulted in changes to the influent concentration.
During the period of regular disturbance (Phase III), the performance of the disturbed reactor continued to respond to differences in water level, showing similar nitrate removal to the constant reactor at high water level and increased nitrate removal at low water level (Figure 2, Phase III). There was also a consistent but transient spike in nitrate removal, up to 70–90%, observed in the disturbed reactor immediately following the decrease in water level. Within a few days at low water level, the performance decreased, but still remained better than performance at the high water level for either reactor.
Tracer Study
Due to the unexpected performance improvement at low water level, a tracer study was conducted during Phase II. The measured HRT was 7.5 h for the constant reactor, while the disturbed reactor showed a slightly longer HRT of 8.8 h at the low water level.
Denitrification Potential
In the DEAs, nitrate removal was measured under standard conditions over 6 h to determine the denitrification potential. In most cases the nitrate removal rates observed in this assay were not significantly different between the reactors or ports (Table 1), despite differences in water level, temporal proximity to water level changes, and performance. The exception was the top port of the disturbed reactor during Phase II, which had an average nitrate removal rate of 0.004 ± 0.001 mg NO3-N/h/dry g woodchips. This removal rate is significantly lower than those from the same port during Phase III and from any other port during any phase.
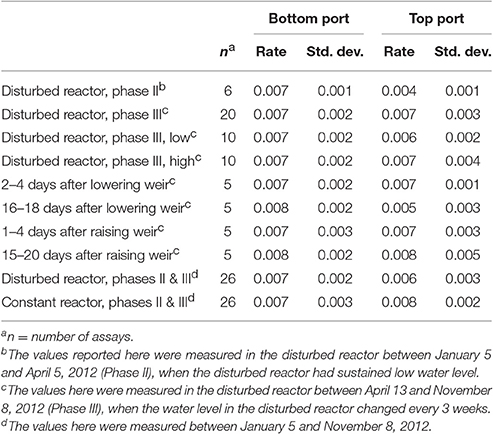
Table 1. Average nitrate removal rates (mg NO3-N/h dry g woodchips) in DEAs of woodchips sampled from the reactors.
The denitrification potential was also measured using the more common metric of nitrous oxide production, which accumulates in DEAs due to the inhibition of nitrous oxide reductase by acetylene. Nitrous oxide production rates were highly variable, ranging from 0.00002 to 0.004 mg N2O-N/h/dry g woodchips (for average values see Table S1). The high level of uncertainty in these measurements makes it difficult to compare the nitrous oxide production rates from different reactor conditions. However, nitrous oxide production rates were consistently about ten-fold lower than the nitrate removal rates.
To test whether organic carbon was limiting activity in the DEAs, samples from three dates were also assayed with and without glucose amendments. The average nitrate removal rates increased slightly when measured with amended glucose for both ports of both reactors (Figure S1), although only the comparison for the top port of the constant reactor was statistically significant (t-test, unequal variance, p = 0.03). This trend was also true for most of the individual DEAs.
Bacterial Community Composition
The bacterial communities observed in the denitrifying bioreactors included 323 unique Operational Taxonomic Units (OTUs). Individual samples contained a median of 76 OTUs, and the median number of OTUs was similar for both reactors. These results are only slightly lower than those observed in field bioreactors, where for example 435 unique ARISA fragments were found in a temporal study (Porter et al., 2015) and the median number of OTUs was 101.
The fluctuating water level had an effect on bacterial community composition. Comparing the constant and disturbed reactor, the bacterial communities of the two reactors first became significantly more distinct from each other during Phase III. This difference is illustrated by MDS (Figure 3) and confirmed by ANOSIM. The ANOSIM R value comparing the communities of both reactors before Phase III was 0.211 (p < 0.001). This included samples from Phase I, where the water height was identical, and from Phase II, where the disturbed reactor had a lower water level. After operation with fluctuating water levels (Phase III), the ANOSIM R value for comparison of communities between reactors was 0.417 (p < 0.001). The higher ANOSIM R value indicates that the bacterial communities became increasingly different between the two reactors once the recurring disturbance period began. This divergence was not observed between the ports of the disturbed reactor, despite their differences in environmental conditions (Table 2). Specifically, within the disturbed reactor, the ANOSIM R value comparing the top port communities at low and high water levels was not significant (p = 0.325), nor was the value comparing the bottom port communities at low and high water levels significant (p = 0.833), meaning that the communities are not significantly different from each other. However, the top port of the disturbed reactor, which experienced the most fluctuations in environmental conditions, did have the most distinct bacterial community.
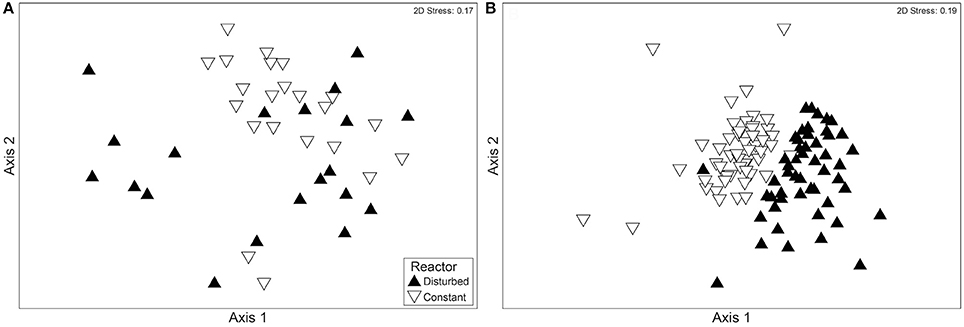
Figure 3. MDS plots showing a comparison of the bacterial communities of the disturbed and constant reactors (A) before and (B) after the beginning of Phase III, with its fluctuating water level in reactor D. Each point represents a community sample with multiple OTUs present in ARISA. The samples in (A) were collected during Phases I and II (between November 5, 2010 and April 9, 2012), and the samples in (B) were collected during Phase III (between April 16, 2012 and November 8, 2012). Both figures include communities experiencing low water level and high water level. The samples are categorized according to the reactor of origin.
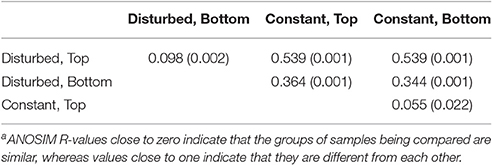
Table 2. ANOSIM R valuesa and their significance (p-values in parentheses) comparing all combinations of the ARISA communities of each port of each reactor during Phase III.
Denitrifying Bacterial Communities
The richness of the denitrifying bacterial community in the bioreactor samples was high, with a total of 272 unique AluI terminal restriction fragments and 172 unique HhaI terminal restriction fragments observed. Each sample contained between one and 69 AluI fragments and one and 59 HhaI fragments, with a median of 11 fragments per sample for AluI digests and 12 fragments per sample for HhaI digests. The disturbed reactor had medians of 10.5 AluI and 12 HhaI fragments, and the constant reactor had medians of 11 AluI and 13 HhaI fragments. Using the same primers and restriction enzymes, the median number of terminal restriction fragments in field bioreactors was 9 or 11, for HhaI and AluI respectively (Porter et al., 2015).
In contrast to the overall bacterial communities, the denitrifying communities did not show a shift to distinct assemblages between the two reactors following the disturbance period (Figure S2 and Table S2). The ANOSIM R values comparing the reactors during these operational periods were insignificant, indicating indistinctness from each other. The ANOSIM R values comparing the denitrifying communities from the four different ports were also insignificant, indicating that the communities were indistinct from each other. Finally, there was no distinction between the communities of an individual port sampled during high and low water conditions.
Discussion
This study was designed to investigate the relationships amongst water level, bioreactor performance, microbial activity, and the microbial community composition in laboratory-scale bioreactors. The observed nitrate removal rates of 5 g N/day/m3 for both bioreactors at high water level and 9 g N/day/m3 for the disturbed bioreactor at low water level were within the reported range of 2–22 g N/day/m3 for in situ bioreactors (Schipper et al., 2010). The rates of nitrous oxide production observed in this study (0.00005–0.004 mg N/h/g woodchips for moist woodchips) were also consistent with previous reports: 0.000176–0.00143 mg N/h/g woodchips in field bioreactors (Moorman et al., 2010) and 0.001–0.004 mg N/h/g woodchips in laboratory bioreactors (Warneke et al., 2011a). Our hypotheses were tested and disproven: lowering the water level did not change the bacterial community composition or disrupt performance. Recurring changes in water level did not result in a significant change in the denitrifying bacterial community, although they did result in a distinct overall bacterial community. From a practical perspective, the overall findings were positive, as bioreactor performance and bacterial communities were generally resistant to the disturbance of fluctuating water levels. Two surprising results were however observed.
First, lowering the water level increased nitrogen removal. Specifically, the laboratory bioreactors successfully removed 31% of nitrate at high water level and 59% of nitrate at low water level. Based on the tracer tests from Phase II, the reactor with low water level had about an 18% longer HRT, which seems insufficient to explain a doubling of the percent N removal (from 31% in both reactors at high water level to 59% in the reactor with low water level). To our knowledge, the increased removal at low water level is not predicted or explained by prior literature. Our results further indicate that the increase in nitrate removal was not due to differences in the denitrifying potential or the community composition. Having ruled out these explanations, we hypothesize that this difference is due to the availability of organic carbon. Having a larger aerobic portion of the reactor can result in a faster carbon mineralization rate of the woodchips (Moorman et al., 2010). The limited number of DEAs conducted with added carbon showed slightly higher nitrate removal rates than those without added carbon, consistent with this hypothesis. Increased availability of organic carbon could also explain the transient spike in nitrate removal that was consistently observed in the disturbed reactor during the first few days after the water height was lowered. With uncertainty remaining about the mechanism causing increased nitrogen removal, it is difficult to predict whether a similar phenomenon is likely to occur in field-scale bioreactors.
Second, the roughly 10-fold discrepancy between nitrate removal rates and nitrous oxide production rates is also noteworthy, especially considering the long-standing and widespread use of DEAs to measure denitrification potential. To our knowledge, all DEAs performed in other bioreactor studies have only measured nitrous oxide production, as is typical for the assay, so this discrepancy cannot be confirmed by comparison to other bioreactor studies. However, a similar phenomenon of greater nitrate removal than nitrous oxide production has previously been reported in freshwater sediments (Laverman et al., 2007) and in forest soil (Yu et al., 2008).
Some potential explanations for the roughly 10-fold lower nitrous oxide production rate appear unlikely. Although dissolved nitrous oxide was not measured, the Henry's Law constant, 0.025 mol/kg/bar, is too low for dissolved nitrous oxide to explain the discrepancy. Incomplete denitrification would either produce nitrite or nitric acid, but nitrite accumulation was not detected in the DEAs and we were unable to find any precedent for substantial nitric oxide accumulation in the literature. Assimilation is also an improbable explanation, since cell growth was inhibited during the DEAs by addition of chloramphenicol. Finally, insufficient ammonia was present in the assays to support anammox.
The most probable explanations are therefore dissimilatory nitrate reduction to ammonia (DNRA) or incomplete inhibition of nitrous oxide reduction. Substantial DNRA was not expected in the bioreactor samples, because this process is most common under high C/N ratios (Tiedje, 1988). However, ammonia was not measured here, so this explanation cannot be conclusively ruled out. Alternatively, incomplete inhibition of nitrous oxide reduction by acetylene could explain these results and has been previously proposed for various types of environmental samples (Knowles, 1982; Yu et al., 2010). If incomplete inhibition is the cause of the discrepancy, the nitrate removal rates would better reflect the denitrification potential than the nitrous oxide production rates.
The potential denitrifying activity was resistant to disturbance, being very similar across reactors, ports, and operational conditions. The sole exception to this consistent activity occurred in the top part of the disturbed reactor during Phase II. After an extended period at low water level, moisture levels reached as low as 14% (data not shown), and the denitrification potential in this port was lower during this time than all the other groupings of values. The rapid recovery of activity upon rewetting however suggests that field performance will be resistant to wetting and drying cycles.
The bacterial and especially the denitrifying bacterial communities in the laboratory bioreactors were also resistant to disturbance. Fluctuating water levels (D, Phase III) resulted in divergence between the bacterial communities in the two reactors, but not in depth differences within a reactor or between low and high water levels for a given sample port. The denitrifying bacterial communities appeared to be even more resistant to disturbance by the changing water level than the total bacterial communities, with no significant differences. This resistance is consistent with prior studies in other environments, such as acidic fens (Palmer et al., 2016) and is likely due to the metabolic versatility of most denitrifying bacteria. The resistance of these communities to the disturbance of changing water levels is an advantage for their application in denitrifying bioreactors, where water level fluctuations are frequent.
Conclusions
Regular disturbance, through fluctuations in the water level, did not affect denitrification activity, but did result in the development of more distinct bacterial communities between the constant and disturbed bioreactors. Water level had a substantial effect on bioreactor performance, independent of HRT, which should be further investigated. A substantial difference in nitrate removal and nitrous oxide production rates was also observed in DEAs, suggesting either that DNRA was occurring or that inhibition by acetylene was poor in this system. Overall, these results describe a robust biological treatment system, with no negative consequences observed from regular fluctuations in water level over several months.
Author Contributions
Conceived of the project: JZ, LR, and AK. Conducted the experiments: NB and SH. Designed experiments, interpreted data, and contributed to writing: SH, NB, LR, AK, and JZ. Led the writing: SH and JZ.
Funding
Funding was provided by United States National Science Foundation project CBET-0853820.
Conflict of Interest Statement
The authors declare that the research was conducted in the absence of any commercial or financial relationships that could be construed as a potential conflict of interest.
Acknowledgments
The authors acknowledge technical assistance from Matthew Porter in constructing the reactors, Paul Choi in operating and monitoring them, Jason Koval and Corey Mitchell with nitrous oxide measurements, and Natalie Stevenson with qPCR, as well as helpful discussions with Eberhard Morgenroth. We thank the reviewers for their helpful comments. Data from this study was included in MS dissertations by authors NB and SH.
Supplementary Material
The Supplementary Material for this article can be found online at: https://www.frontiersin.org/article/10.3389/fenvs.2017.00035/full#supplementary-material
References
Addy, K., Gold, A. J., Christianson, L. E., David, M. B., Schipper, L. A., and Ratigan, N. A. (2016). Denitrifying bioreactors for nitrate removal: a meta-analysis. J. Environ. Qual. 45, 873–881. doi: 10.2134/jeq2015.07.0399
Andrus, J. M., Porter, M. D., Rodríguez, L. F., Kuehlhorn, T., Cooke, R. A. C., Zhang, Y., et al. (2014). Spatial variation in the bacterial and denitrifying bacterial community in a biofilter treating subsurface agricultural drainage. Microb. Ecol. 67, 265–272. doi: 10.1007/s00248-013-0286-0
Bernot, M. J., Dodds, W. K., Gardner, W. S., McCarthy, M. J., Sobolev, D., and Tank, J. L. (2003). Comparing denitrification estimates for a texas estuary by using acetylene inhibition and membrane inlet mass spectrometry. Appl. Environ. Microbiol. 69, 5950–5956. doi: 10.1128/AEM.69.10.5950-5956.2003
Blowes, D. W., Robertson, W. D., Ptacek, C. J., and Merkley, C. (1994). Removal of agricultural nitrate from tile-drainage effluent water using in-line bioreactors. J. Contam. Hydrol. 15, 207–221. doi: 10.1016/0169-7722(94)90025-6
Cameron, S. G., and Schipper, L. A. (2010). Nitrate removal and hydraulic performance of organic carbon for use in denitrification beds. Ecol. Eng. 36, 1588–1595. doi: 10.1016/j.ecoleng.2010.03.010
Christianson, L. E., Bhandari, A., and Helmers, M. J. (2011). Pilot-scale evaluation of denitrification drainage bioreactors: reactor geometry and performance. J. Environ. Eng. 137, 213–220. doi: 10.1061/(ASCE)EE.1943-7870.0000316
Clarke, K. R., and Green, R. H. (1988). Statistical design and analysis for a biological effects study. Mar. Ecol. 46, 213–226. doi: 10.3354/meps046213
David, M. B., Drinkwater, L. E., and McIsaac, G. F. (2010). Sources of nitrate yields in the Mississippi River Basin. J. Environ. Qual. 39, 1657–1667. doi: 10.2134/jeq2010.0115
Fisher, M. M., and Triplett, E. W. (1999). Automated approach for ribosomal intergenic spacer analysis of microbial diversity and its application to freshwater bacterial communities. Appl. Environ. Microbiol. 65, 4630–4636.
Gibert, O., Pomierny, S., Rowe, I., and Kalin, R. M. (2008). Selection of organic substrates as potential reactive materials for use in a denitrification permeable reactive barrier wall (PRB). Bioresour. Technol. 99, 7587–7596. doi: 10.1016/j.biortech.2008.02.012
Greenan, C. M., Moorman, T. B., Parkin, T. B., Kaspar, T. C., and Jaynes, D. B. (2009). Denitrification in wood chip bioreactors at different water flows. J. Environ. Qual. 38, 1664–1671. doi: 10.2134/jeq2008.0413
Henry, S., Bru, D., Stres, B., Hallet, S., and Philippot, L. (2006). Quantitative detection of the nosZ gene, encoding nitrous oxide reductase, and comparison of the abundances of 16S rRNA, narG, nirK, and nosZ genes in soils. Appl. Environ. Microbiol. 72, 5181–5189. doi: 10.1128/AEM.00231-06
Howarth, R. W., and Marino, R. (2006). Nitrogen as the limiting nutrient for coastal marine ecosystems: evolving views over three decades. Limnol. Oceanogr. 51, 364–376. doi: 10.4319/lo.2006.51.1_part_2.0364
Jaynes, D. B., Colvin, T. S., Karlen, D. L., Cambardella, C. A., and Meek, D. W. (2001). Nitrate loss in subsurface drainage as affected by nitrogen fertilizer rate. J. Environ. Qual. 30, 1305–1314. doi: 10.2134/jeq2001.3041305x
Jones, C. M., Graf, D. R., Bru, D., Philippot, L., and Hallin, S. (2013). The unaccounted yet abundant nitrous oxide-reducing microbial community: a potential nitrous oxide sink. ISME J. 7, 417–426. doi: 10.1038/ismej.2012.125
Kalita, P. K., Algoazany, A. S., Mitchell, J. K., Cooke, R. A., and Hirschi, M. C. (2006). Subsurface water quality from a flat tile-drained watershed in Illinois, USA. Agric. Ecosyst. Environ. 115, 183–193. doi: 10.1016/j.agee.2006.01.006
Laverman, A. M., Canavan, R. W., Slomp, C. P., and Cappellen, P. V. (2007). Potential nitrate removal in a coastal freshwater sediment (Haringvliet Lake, The Netherlands) and response to salinization. Water Res. 41, 3061–3068. doi: 10.1016/j.watres.2007.04.002
Moorman, T. B., Parkin, T. B., Kaspar, T. C., and Jaynes, D. B. (2010). Denitrification activity, wood loss, and N2O emissions over 9 years from a wood chip bioreactor. Ecol. Eng. 36, 1567–1574. doi: 10.1016/j.ecoleng.2010.03.012
Murray, R. E., and Knowles, R. (1999). Chloramphenicol inhibition of denitrifying enzyme activity in two agricultural soils. Appl. Environ. Microbiol. 65, 3487–3492.
Palmer, K., Köpp, J., Gebauer, G., and Horn, M. A. (2016). Drying-rewetting and flooding impact denitrifier activity rather than community structure in a moderately acidic fen. Front. Microbiol. 7:727. doi: 10.3389/fmicb.2016.00727
Porter, M. D., Andrus, J. M., Bartolerio, N. A., Rodríguez, L. F., Zhang, Y., Zilles, J. L., et al. (2015). Seasonal patterns in microbial community composition in denitrifying bioreactors treating subsurface agricultural drainage. Microb. Ecol. 70, 1–14. doi: 10.1007/s00248-015-0605-8
Rabalais, N. N., Diaz, R. J., Levin, L. A., Turner, R. E., Gilbert, D., and Zhang, J. (2010). Dynamics and distribution of natural and human-caused hypoxia. Biogeosciences 7, 585–619. doi: 10.5194/bg-7-585-2010
Rich, J. J., Heichen, R. S., Bottomley, P. J., Cromack, K., and Myrold, D. D. (2003). Community composition and functioning of denitrifying bacteria from adjacent meadow and forest soils. Appl. Environ. Microbiol. 69, 5974–5982. doi: 10.1128/AEM.69.10.5974-5982.2003
Schipper, L. A., Robertson, W. D., Gold, A. J., Jaynes, D. B., and Cameron, S. C. (2010). Denitrifying bioreactors-An approach for reducing nitrate loads to receiving waters. Ecol. Eng. 36, 1532–1543. doi: 10.1016/j.ecoleng.2010.04.008
Stone, M., and Krishnappan, B. (1997). Transport characteristics of tile-drain sediments from an agricultural watershed. Water Air Soil Pollut. 99, 89–103. doi: 10.1007/BF02406848
Tanner, R. S. (1997). “Cultivation of bacteria and fungi,” in Manual of Environmental Microbiology, eds C. J. Hurst, G. R. Knudsen, M. J. McInerney, L. D. Stetzenbach, and M. V. Walter (Washington, DC: American Society for Microbiology), 52–60.
Tiedje, J. M. (1988). “Ecology of denitrification and of dissimilatory nitrate reduction to ammonium,” in Biology of Anaerobic Microorganisms, ed A. J. B. Zehnder (New York, NY: John Wiley and Sons, Inc.), 179–244.
Tiedje, J. M., Simkins, S., and Groffman, P. M. (1989). Perspectives on measurement of denitrification in the field including recommended protocols for acetylene based methods. Plant Soil 115, 261–284. doi: 10.1007/BF02202594
Warneke, S., Schipper, L. A., Bruesewitz, D. A., McDonald, I., and Cameron, S. (2011a). Rates, controls and potential adverse effects of nitrate removal in a denitrification bed. Ecol. Eng. 37, 511–522. doi: 10.1016/j.ecoleng.2010.12.006
Warneke, S., Schipper, L. A., Matiasek, M. G., Scow, K. M., Cameron, S., Bruesewitz, D. A., et al. (2011b). Nitrate removal, communities of denitrifiers and adverse effects in different carbon substrates for use in denitrification beds. Water Res. 45, 5463–5475. doi: 10.1016/j.watres.2011.08.007
Yu, K., Seo, D.-C., and DeLaune, R. D. (2010). Incomplete Acetylene inhibition of nitrous oxide reduction in potential denitrification assay as revealed by using 15N-nitrate tracer. Commun. Soil Sci. Plant Anal. 41, 2201–2210. doi: 10.1080/00103624.2010.504800
Yu, K., Struwe, S., Kjøller, A., and Chen, G. (2008). Denitrification rate determined by nitrate disappearance is higher than determined by nitrous oxide production with acetylene blockage. Ecol. Eng. 32, 90–96. doi: 10.1016/j.ecoleng.2007.09.006
Keywords: denitrifying bioreactors, denitrifying enzyme assays, disturbance, fluctuating water level, nitrate removal, nosZ, subsurface drainage
Citation: Hathaway SK, Bartolerio NA, Rodríguez LF, Kent AD and Zilles JL (2017) Denitrifying Bioreactors Resist Disturbance from Fluctuating Water Levels. Front. Environ. Sci. 5:35. doi: 10.3389/fenvs.2017.00035
Received: 21 December 2016; Accepted: 09 June 2017;
Published: 28 June 2017.
Edited by:
Regina-Michaela Wittich, Spanish High Council for Scientific Research-Estación Experimental del Zaidín, SpainReviewed by:
Giridhar Upadhyaya, University of Michigan, United StatesSeung Gu Shin, Pohang University of Science and Technology, South Korea
Copyright © 2017 Hathaway, Bartolerio, Rodríguez, Kent and Zilles. This is an open-access article distributed under the terms of the Creative Commons Attribution License (CC BY). The use, distribution or reproduction in other forums is permitted, provided the original author(s) or licensor are credited and that the original publication in this journal is cited, in accordance with accepted academic practice. No use, distribution or reproduction is permitted which does not comply with these terms.
*Correspondence: Julie L. Zilles, jzilles@illinois.edu
†Present Address: Sarah K. Hathaway, H2M Architects + Engineers, Melville, NY, United States
Nicholas A. Bartolerio, Strand Associates, Inc., Madison, WI, United States